pension fund perspective: the nature of the universe
TRANSCRIPT
CFA Institute
Pension Fund Perspective: The Nature of the UniverseAuthor(s): Steven D. Bleiberg and Patrick J. ReganSource: Financial Analysts Journal, Vol. 42, No. 2 (Mar. - Apr., 1986), pp. 13-14Published by: CFA InstituteStable URL: http://www.jstor.org/stable/4478913 .
Accessed: 16/06/2014 10:58
Your use of the JSTOR archive indicates your acceptance of the Terms & Conditions of Use, available at .http://www.jstor.org/page/info/about/policies/terms.jsp
.JSTOR is a not-for-profit service that helps scholars, researchers, and students discover, use, and build upon a wide range ofcontent in a trusted digital archive. We use information technology and tools to increase productivity and facilitate new formsof scholarship. For more information about JSTOR, please contact [email protected].
.
CFA Institute is collaborating with JSTOR to digitize, preserve and extend access to Financial AnalystsJournal.
http://www.jstor.org
This content downloaded from 195.78.108.81 on Mon, 16 Jun 2014 10:58:46 AMAll use subject to JSTOR Terms and Conditions
Pension Fund Perpective Patrick J. Regan V.P., BEA Associates, Inc.
This is the time of year when money managers and plan sponsors find out how their investment results ranked in the ma- jor universes. The top performers will refer to relative standings in their marketing
materials, while the laggards will probably emphasize the long-term record.
In the following article, Steven D. Blei- berg comments on the "survivorship bias" inherent in a long-term track record. Steve
is a Research Analyst with BEA Asso- ciates, Inc. He coauthored a recent column showing how pension costs and liabilities are finally becoming contained.
-P.J.R.
The Nature of the Universe by Steven D. Bleiberg
Buried deep in the back of the sports section of a recent newspaper was a story about what was billed as the world's "First Annual Coin Flipping Championship," held at the National Center for the Study of Probability. It seems that 1,024 people were selected (at random, of course) to participate in the tournament, which took place over two days. The rules on the first day were simple. Each contestant flipped a coin ten times. Whoever flipped "heads" the most times would be named the champion.
Naturally, the laws of probability worked perfectly. Out of the 1,024 entrants (2 raised to the 10th power, in case you hadn't noticed), one contes- tant (a fellow by the name of Buffett, the paper reported) flipped heads all 10 times! One unlucky fellow flipped tails each time. As for the others, they were distributed symmetrically around a mean of five winning flips, as the "Day 1" column in Table I shows.
While most of the reporters were off asking this Mr. Buffett what his secrets were, one writer was talking to a con- testant who had flipped heads six
times. "I feel pretty good about my showing, actually," the fellow said. "After all, I beat the average. In fact, as I calculate it, only 17 per cent of the contestants did better than I did."
The next day, the contestants gath- ered again and repeated the exercise. This time, however, there was a slight change in the rules: Any contestant who flipped tails three consecutive times would be eliminated from the competition. Looking slightly appre- hensive, the entrants began flipping.
Once again, probability worked its magic perfectly. After the third flip, 128 contestants (one-eighth) had been eliminated. Another 64 dropped out each time after the fourth, fifth and sixth flips. On the remaining four rounds, 56, 52, 48 and 44 people sat down.
After 10 rounds, only 504 of the original 1,024 flippers were left. Re- markably, Mr. Buffett had flipped ten heads again! In fact, all the contestants flipped the exact same sequence of heads and tails as they had on the first day, astonishing the assembled scien- tists. Of course, the ones who flipped
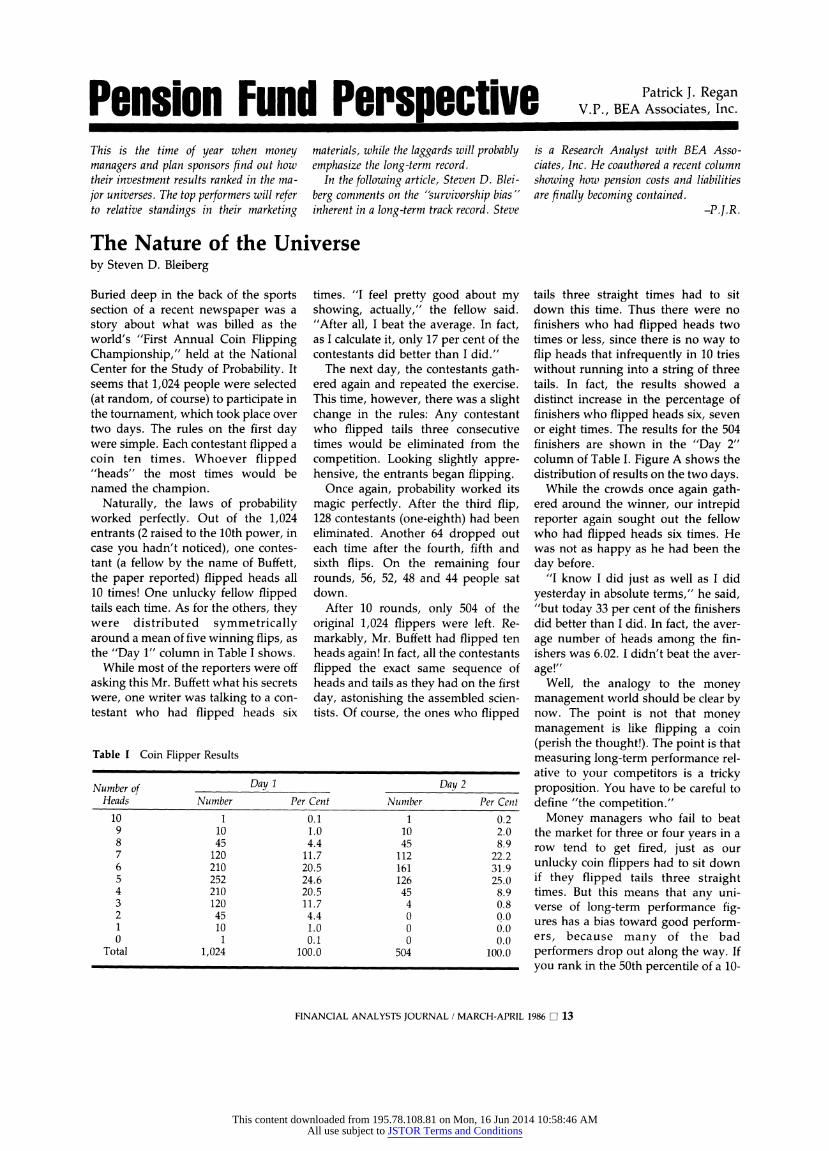
tails three straight times had to sit down this time. Thus there were no finishers who had flipped heads two times or less, since there is no way to flip heads that infrequently in 10 tries without running into a string of three tails. In fact, the results showed a distinct increase in the percentage of finishers who flipped heads six, seven or eight times. The results for the 504 finishers are shown in the "Day 2" column of Table I. Figure A shows the distribution of results on the two days.
While the crowds once again gath- ered around the winner, our intrepid reporter again sought out the fellow who had flipped heads six times. He was not as happy as he had been the day before.
"I know I did just as well as I did yesterday in absolute terms," he said, "but today 33 per cent of the finishers did better than I did. In fact, the aver- age number of heads among the fin- ishers was 6.02. I didn't beat the aver- age!"
Well, the analogy to the money management world should be clear by now. The point is not that money management is like flipping a coin (perish the thought!). The point is that measuring long-term performance rel- ative to your competitors is a tricky proposition. You have to be careful to define "the competition."
Money managers who fail to beat the market for three or four years in a row tend to get fired, just as our unlucky coin flippers had to sit down if they flipped tails three straight times. But this means that any uni- verse of long-term performance fig- ures has a bias toward good perform- ers, because many of the bad performers drop out along the way. If you rank in the 50th percentile of a 10-
Table I Coin Flipper Results
Number of Day 1 Day 2 Heads Number Per Cent Number Per Cent
10 1 0.1 1 0.2 9 10 1.0 10 2.0 8 45 4.4 45 8.9 7 120 11.7 112 22.2 6 210 20.5 161 31.9 5 252 24.6 126 25.0 4 210 20.5 45 8.9 3 120 11.7 4 0.8 2 45 4.4 0 0.0 1 10 1.0 0 0.0 0 1 0.1 0 0.0
Total 1,024 100.0 504 100.0
FINANCIAL ANALYSTS JOURNAL / MARCH-APRIL 1986 O 13
This content downloaded from 195.78.108.81 on Mon, 16 Jun 2014 10:58:46 AMAll use subject to JSTOR Terms and Conditions
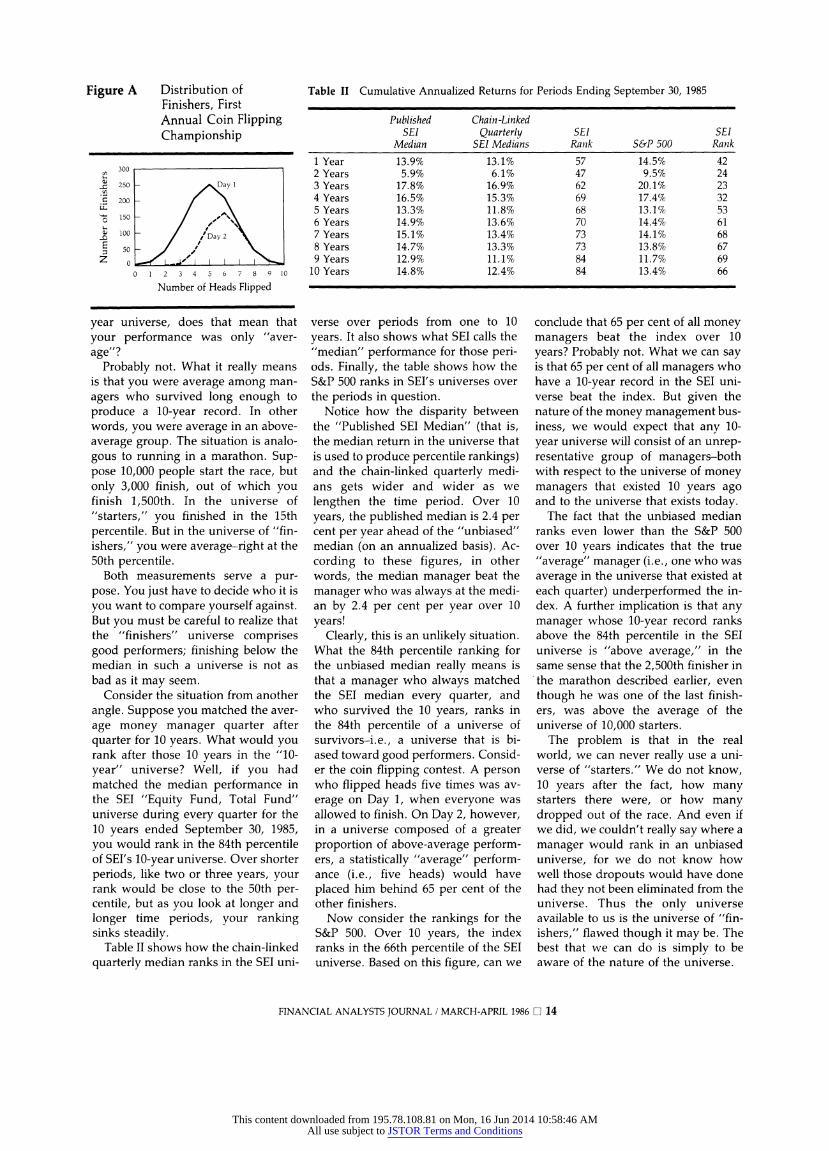
Figure A Distribution of Finishers, First Annual Coin Flipping Championship
300
5 250 - Day 1
*: 200 -
O150 / ̂ s
100 ' 1Day 2
50
0-
0 1 2 3 4 5 6 7 8 9 10
Number of Heads Flipped
Table II Cumulative Annualized Returns for Periods Ending September 30, 1985
Published Chain-Linked SEI Quarterly SEI SEI
Median SEI Medians Rank S&P 500 Rank
1 Year 13.9% 13.1% 57 14.5% 42 2 Years 5.9% 6.1% 47 9.5% 24 3 Years 17.8% 16.9% 62 20.1% 23 4 Years 16.5% 15.3% 69 17.4% 32 5 Years 13.3% 11.8% 68 13.1% 53 6 Years 14.9% 13.6% 70 14.4% 61 7 Years 15.1% 13.4% 73 14.1% 68 8 Years 14.7% 13.3% 73 13.8% 67 9 Years 12.9% 11.1% 84 11.7% 69
10 Years 14.8% 12.4% 84 13.4% 66
year universe, does that mean that your performance was only "aver- age"?
Probably not. What it really means is that you were average among man- agers who survived long enough to produce a 10-year record. In other words, you were average in an above- average group. The situation is analo- gous to running in a marathon. Sup- pose 10,000 people start the race, but only 3,000 finish, out of which you finish 1,500th. In the universe of "starters," you finished in the 15th percentile. But in the universe of "fin- ishers," you were average-right at the 50th percentile.
Both measurements serve a pur- pose. You just have to decide who it is you want to compare yourself against. But you must be careful to realize that the "finishers" universe comprises good performers; finishing below the median in such a universe is not as bad as it may seem.
Consider the situation from another angle. Suppose you matched the aver- age money manager quarter after quarter for 10 years. What would you rank after those 10 years in the "10- year" universe? Well, if you had matched the median performance in the SEI "Equity Fund, Total Fund" universe during every quarter for the 10 years ended September 30, 1985, you would rank in the 84th percentile of SEI's 10-year universe. Over shorter periods, like two or three years, your rank would be close to the 50th per- centile, but as you look at longer and longer time periods, your ranking sinks steadily.
Table II shows how the chain-linked quarterly median ranks in the SEI uni-
verse over periods from one to 10 years. It also shows what SEI calls the "median" performance for those peri- ods. Finally, the table shows how the S&P 500 ranks in SEI's universes over the periods in question.
Notice how the disparity between the "Published SEI Median" (that is, the median return in the universe that is used to produce percentile rankings) and the chain-linked quarterly medi- ans gets wider and wider as we lengthen the time period. Over 10 years, the published median is 2.4 per cent per year ahead of the "unbiased" median (on an annualized basis). Ac- cording to these figures, in other words, the median manager beat the manager who was always at the medi- an by 2.4 per cent per year over 10 years!
Clearly, this is an unlikely situation. What the 84th percentile ranking for the unbiased median really means is that a manager who always matched the SEI median every quarter, and who survived the 10 years, ranks in the 84th percentile of a universe of survivors-i.e., a universe that is bi- ased toward good performers. Consid- er the coin flipping contest. A person who flipped heads five times was av- erage on Day 1, when everyone was allowed to finish. On Day 2, however, in a universe composed of a greater proportion of above-average perform- ers, a statistically "average" perform- ance (i.e., five heads) would have placed him behind 65 per cent of the other finishers.
Now consider the rankings for the S&P 500. Over 10 years, the index ranks in the 66th percentile of the SEI universe. Based on this figure, can we
conclude that 65 per cent of all money managers beat the index over 10 years? Probably not. What we can say is that 65 per cent of all managers who have a 10-year record in the SEI uni- verse beat the index. But given the nature of the money management bus- iness, we would expect that any 10- year universe will consist of an unrep- resentative group of managers-both with respect to the universe of money managers that existed 10 years ago and to the universe that exists today.
The fact that the unbiased median ranks even lower than the S&P 500 over 10 years indicates that the true "average" manager (i.e., one who was average in the universe that existed at each quarter) underperformed the in- dex. A further implication is that any manager whose 10-year record ranks above the 84th percentile in the SEI universe is "above average," in the same sense that the 2,500th finisher in the marathon described earlier, even though he was one of the last finish- ers, was above the average of the universe of 10,000 starters.
The problem is that in the real world, we can never really use a uni- verse of "starters." We do not know, 10 years after the fact, how many starters there were, or how many dropped out of the race. And even if we did, we couldn't really say where a manager would rank in an unbiased universe, for we do not know how well those dropouts would have done had they not been eliminated from the universe. Thus the only universe available to us is the universe of "fin- ishers," flawed though it may be. The best that we can do is simply to be aware of the nature of the universe.
FINANCIAL ANALYSTS JOURNAL / MARCH-APRIL 1986 O 14
This content downloaded from 195.78.108.81 on Mon, 16 Jun 2014 10:58:46 AMAll use subject to JSTOR Terms and Conditions