pension 2009 annual report - sunsuper
TRANSCRIPT

Sunsuper Pension Options
Annual report2008 – 2009


1
Board report
This Annual report is for Sunsuper Pension Options members.
The Board is pleased to present the Sunsuper Annual report for the financial year ended 30 June 2009.
ContentsBoard report 1
Investment options 2
Investment managers 10
Professional advisers 11
Reserves 11
The Board 11
Compliance 12
Financial statements 13
The past 12 months has been a particularly challenging year for all superannuation funds and certainly the year for Sunsuper was no different. Despite the difficult investment conditions experienced throughout the year, the Fund’s discipline in maintaining its nerve and focus has seen our performance for the year place us amongst the leading funds in the nation.
Periods such as this year provide challenges for all businesses and within our industry, like many others, many have suffered deeply in these times. Sunsuper however, has continued to develop and bring to market a number of leading initiatives, while maintaining very high levels of member satisfaction and strong growth in terms of new members and contributions. These achievements in challenging times serve as testament to Sunsuper’s strength and capability.
One example of our ability to respond to challenges came through the acquisition of our administrator following the sale of CSA Retirement Services by their parent organisation. Our financial strength and forward planning allowed us to act positively to protect the interests of our members and secure this business, now named Precision Administration Services. The integration of the skills, expertise and organisational cultures of Precision and Sunsuper seeks to provide enormous benefits for Sunsuper into the future and has allowed Sunsuper to create an opportunity from a challenge many other lesser positioned funds would have struggled to negotiate.
Early in the year Sunsuper was named AFR Smart Investor Magazine’s Industry Fund of the Year. This prestigious award was followed with the equally well regarded SuperRatings
Pension Fund of the Year title. The recognition from independent evaluators that awards such as these provide is obviously very pleasing but importantly gives our members and employers great confidence in the Fund and in their decision to trust us with their retirement savings.
Looking aheadOur strategic planning for the future will continue to concentrate our efforts on providing high quality service, optimising members’ retirement benefits, keeping operational costs low to maximise profit for members, and developing viable retirement income solutions for those entering retirement.
One of the most exciting developments for the year ahead will be the roll-out of our On Track program, a market leading initiative to make professional financial advice more accessible and relevant for those entering the second half of their working life and moving through and then into retirement. We firmly believe On Track will set a new industry benchmark for the way advice is delivered to everyday Australians and will improve the future financial wellbeing of many of our members.
As the global economy emerges from the challenges of the last 18 months we will continue to pursue new investment opportunities in order to support strong long-term performance.
The Board would like to take this opportunity to thank Chief Executive Officer, Tony Lally, his senior management team and all the staff of both Sunsuper and Precision Administration Services for their outstanding performance during this challenging year.

Sunsuper Annual report — Pension 2008–2009
2
We recognise that choosing the right investment option or options can make a big difference to your retirement income and that choosing the right investment option or options depends on your personal circumstances and your retirement goals.
For Sunsuper pension members we have identified four broad investment profiles:
• Growth — Investors who want to generate wealth over the long-term,
• Balanced — Investors who want to generate wealth over the medium to long-term, while being sensitive to the relative performance of other large Australian superannuation funds,
• Retirement — Investors who want to generate wealth over the medium to long-term, while providing some reduction to the volatility of returns in the short–term, and
• Conservative — Investors who seek less volatile returns for their super while maintaining some growth exposure. Using their money in the short-term is likely to be their main purpose.
We offer four investment options to match each of these four broad investment profiles. However we also recognise that not everyone fits into these broad profiles and therefore we offer a range of other single asset class investment options.
For more details on the investment options, refer to the panels on pages 4 to 9.
Changes to the investment optionsThroughout the year we reviewed our investment options and changed the investment options offered in Sunsuper Pension Options. From 1 May 2009 new investors could select from the 13 options shown on pages 4 to 8. The remaining options closed on 30 June 2009.
We have also renamed the Sunsuper Moderate option to be the Sunsuper Retirement option and renamed the SSgA Australian Cash option to be the Sunsuper Cash option.
Investment objectives and strategiesSunsuper’s overall investment objectives are:
• tomaximisethereallong-terminvestmentreturns(after investment fees) subject to the expected risk profiles for each investment option,
• toimplementaninvestmentmanagerconfigurationforeachinvestment option which will in the long-term outperform the benchmark return and peer groups,
• toavoidexposingeachinvestmentoptiontoinappropriateriskthrough diversification of investments and of managers, and
• tomaintainsufficientliquidassetssoastopayallbenefitandexpense obligations in full when due.
The investment objectives and investment mix for each of the investment options are set out in the tables on pages 4 to 8.
About the Sunsuper investment options available from 1 July 2009In Sunsuper Pension Options we offer nine options where Sunsuper makes the investment mix decisions and selects the investment managers, including the Sunsuper Retirement option which is tailored to better meet the needs of members in or nearing retirement.
For these options, Sunsuper has adopted a philosophy of active investment management. This is reflected in the range of investment managers selected by Sunsuper and its investment consultant after considering a broad range of information sources.
We have a strong belief that this approach will result in returns higher than returns from index managers, even after active management fees are taken into account. Index managers aim to replicate the performance of a broad market index.
In addition to expecting our managers to outperform their benchmarks through active management, we expect all of our managers to:
•haveworld-classprofessionalinvestmentprocesses,
•complementeachother’sprocessesandstyles,and
•becosteffective.
For the Sunsuper diversified options we aim to reduce investment risk by diversifying across both asset classes and manager styles.
For the Sunsuper single asset class options, we aim to reduce investment risk by diversifying across manager styles.
About the external manager options available from 1 July 2009Sunsuper Pension Options offers four external manager options where the external manager makes the investment mix decisions.
Each of these options are single manager (where there is only one manager with one investment style) options and have adopted a philosophy of index (also known as passive, which aims to replicate the performance of the index) or enhanced index (which uses an index approach but targets minor levels of outperformance through low-risk active management techniques) investment management.
Sunsuper and its investment consultants have sourced leading investment managers for these options.
For more information on our investment options refer to the Sunsuper Pension Options Member guide.
How we calculate your balanceYour account balance is calculated by multiplying the number of units you have in each investment option by the unit price for each option. As the unit prices are calculated on a daily basis, the value of your account may change daily.
Is your investment guaranteed?Except for the Sunsuper Capital Guaranteed option, the movement in unit prices, the repayment of capital and the performance of any investment option are not guaranteed. Investing in a specific option does not give any entitlement to assets underlying that investment option.
For more details on the Sunsuper Capital Guaranteed option, refer to page 8.
Investment options

3
Use of derivatives in the FundSunsuper’s policy is to allow our investment managers to use derivatives, such as futures, options and swaps, to achieve their investment objectives, particularly for the purpose of managing risk. However, the managers must operate within specific guidelines.
Our investment managers who invest in derivatives must adopt a Derivative Risk Statement that is acceptable to Sunsuper. This statement sets out the use of derivatives and the controls in place to protect against improper use of derivatives.
Investment fees and costsAll superannuation funds incur investment fees to cover the costs of investing and managing investments for their members. In line with our profit-for-members philosophy, Sunsuper does not profit from investment fees.
We report the investment fee in two components, the base fee and the performance fee. These are calculated as a percentage of the total assets managed in each investment option. The actual investment fee for each investment option for the 2008/2009 financial year, is shown in the tables on pages 4 to 9. Some investment managers for the 2008/2009 financial year have been paid a performance fee as a result of outperforming their performance targets.
Sunsuper believes paying performance fees to its investment managers encourages sustained investment performance and avoids rewarding investment managers for underperformance. If an investment manager who has the potential to earn a performance fee underperforms their performance target, the investment manager needs to overcome their underperformance in future periods before another performance fee can be earned.
What are buy/sell spreads?Buy/sell spreads are costs charged by the investment managers for transaction costs incurred in buying and selling the underlying assets of an investment option. When money is invested in an investment option, the entry unit price includes a buy spread and is used to buy units. When money is withdrawn from an investment option, the exit unit price includes a sell spread and is used to sell units. For some investment options, this cost is passed on to you. We do not add a margin to the buy/sell spreads charged by the investment managers. The buy/sell spreads as at 30 June 2009 are shown in the tables on pages 4 to 8.
The buy/sell spreads may vary from time to time to reflect the buy/sell spreads charged by the relevant investment managers.
For any investment option which has a nil sell spread, we may, at our discretion, apply a sell spread (which reduces the unit price) if a Sunsuper employer requests either:
• allorpartoftheassetsinvestedinaninvestmentoptionwithin the plan account to be switched to another investment option, or
• awithdrawalfromSunsuperinordertotransferfundstoanother superannuation plan or fund.
The sell spread will be equal to the estimated sale cost of the underlying assets. When a sell spread is used, this will be an additional cost to members of that particular plan.
Estimated base and performance fees for 2009/2010The investment option tables on pages 4 to 8 also show the estimated base fees and the estimated performance fees for 2009/2010.
These are our best estimates based on recent experience and our current long-term expectations for ongoing investment costs. Performance fees are difficult to predict because the level of out-performance by the managers is difficult to predict. The performance fee may exceed the estimate.
We monitor the ongoing investment costs and for each investment option the investment fees deducted will not be more than the actual investment costs incurred but may differ from our estimates, for example, due to changes in the investment manager mix or investment manager fees. We will let you know the actual investment fees at the end of the 2009/2010 financial year.

Inve
stm
ent
mix
30
/6/0
9
Inve
stm
ent
mix
30
/6/0
8
Ben
chm
ark
%
Allo
wab
le
rang
e%
Australian shares 27.2 27.2 30 0-50International shares 29.5 32.0 30 0-50Private capital 11.8 9.3 10 0-20Property 8.9 8.2 10 0-30Infrastructure 9.1 9.7 10 0-30Fixed interest 0.8 0.9 0 0-20Hedge funds 11.6 10.9 10 0-20Cash 1.1 1.8 0 0-20
Inve
stm
ent
mix
30
/6/0
9
Inve
stm
ent
mix
30
/6/0
8
Ben
chm
ark
%
Allo
wab
le
rang
e%
Australian shares 28.7 28.8 30 0-50International shares 24.9 26.0 25 0-50Private capital 8.4 7.4 7.5 0-15Property 7.0 5.9 7.5 0-30Infrastructure 7.1 7.3 7.5 0-30Fixed interest 12.8 10.7 13 0-25Hedge funds 8.2 9.0 7.5 0-25Cash 2.9 4.9 2 0-25
Inve
stm
ent
mix
30
/6/0
9
Inve
stm
ent
mix
30
/6/0
8
Ben
chm
ark
%
Allo
wab
le
rang
e%
Australian shares 23.1 19.0 20 0-30International shares 15.9 16.9 18 0-30Private capital 4.4 3.5 3.5 0-10Property 8.5 6.3 6 0-25Infrastructure 8.4 6.0 6 0-25Fixed interest 26.3 29.9 29 0-50Hedge funds 7.4 7.3 7.5 0-15Cash 6.0 11.1 10 0-25
1 year(%)
5 years(% p.a.)
3 years(% p.a.)
4.3
5.2
-15.2
-10.9
-3.1
-17.2 -11.3
-25.6
-15.7-21.8
-7.9
-40.9
-14.0
8.211.1
-17.4
6.3 5.5
-11.0
5.8
7.4 5.82.2
1 year(%)
1 year(%)
5 years(% p.a.)
3 years(% p.a.)
1 year(%)
3 years(% p.a.)
1 year(%)
3 years(% p.a.)
1 year(%)
5 years(% p.a.)
3 years(% p.a.)
1 year(%)
5 years(% p.a.)
3 years(% p.a.)
1 year(%)
5 years(% p.a.)
3 years(% p.a.)
1 year(%)
5 years(% p.a.)
3 years(% p.a.)
1 year(%)
5 years(% p.a.)
3 years(% p.a.)
1 year(%)
3 years(% p.a.)
1 year(%)
3 years(% p.a.)
1 year(%)
3 years(% p.a.)
-1.0-12.6
0.85.5
-7.3
3.36.2
-0.6
7.5
-1.8
-16.0
-17.9
-3.6
-20.0
-10.3
-9.1
-29.4
-8.3-11.1
-33.6
Sunsuper Growth
Sunsuper Balanced
Sunsuper Retirement
Sunsuper Conservative
Sunsuper Australian Shares
SSgA Australian Equities Index
SSgA Global Index Plus (hedged)
Sunsuper InternationalShares (hedged)
Sunsuper Property
SSgA Australian Listed Property Index
SSgA Global Fixed Income Index
Sunsuper Cash
Sunsuper Capital Guaranteed
1 year(%)
5 years(% p.a.)
3 years(% p.a.)
4.3
5.2
-15.2
-10.9
-3.1
-17.2 -11.3
-25.6
-15.7-21.8
-7.9
-40.9
-14.0
8.211.1
-17.4
6.3 5.5
-11.0
5.8
7.4 5.82.2
1 year(%)
1 year(%)
5 years(% p.a.)
3 years(% p.a.)
1 year(%)
3 years(% p.a.)
1 year(%)
3 years(% p.a.)
1 year(%)
5 years(% p.a.)
3 years(% p.a.)
1 year(%)
5 years(% p.a.)
3 years(% p.a.)
1 year(%)
5 years(% p.a.)
3 years(% p.a.)
1 year(%)
5 years(% p.a.)
3 years(% p.a.)
1 year(%)
5 years(% p.a.)
3 years(% p.a.)
1 year(%)
3 years(% p.a.)
1 year(%)
3 years(% p.a.)
1 year(%)
3 years(% p.a.)
-1.0-12.6
0.85.5
-7.3
3.36.2
-0.6
7.5
-1.8
-16.0
-17.9
-3.6
-20.0
-10.3
-9.1
-29.4
-8.3-11.1
-33.6
Sunsuper Growth
Sunsuper Balanced
Sunsuper Retirement
Sunsuper Conservative
Sunsuper Australian Shares
SSgA Australian Equities Index
SSgA Global Index Plus (hedged)
Sunsuper InternationalShares (hedged)
Sunsuper Property
SSgA Australian Listed Property Index
SSgA Global Fixed Income Index
Sunsuper Cash
Sunsuper Capital Guaranteed
Sunsuper Annual report — Pension 2008–2009
4
Diversified options
Sunsuper RetirementSunsuper Growth Sunsuper Balanced
Actual fee for 2008/09
Base fee: 0.65% p.a.
Performance fee: 0.21% p.a.
Buy/sell spread: nil
Actual fee for 2008/09
Base fee: 0.54% p.a.
Performance fee: 0.16% p.a.
Buy/sell spread: nil
Actual fee for 2008/09
Base fee: 0.48% p.a.
Performance fee: 0.14% p.a.
Buy/sell spread: nil
For the periods ending 30 June 2009 For the periods ending 30 June 2009For the periods ending 30 June 2009
ASS
ET A
LLO
CATI
ON
ASS
ET A
LLO
CATI
ON
ASS
ET A
LLO
CATI
ON
INV
ESTM
ENT
RET
UR
NS
1
INV
ESTM
ENT
RET
UR
NS
1
INV
ESTM
ENT
RET
UR
NS
1
Estimated fee for 2009/10
Base fee: 0.65% p.a.
Performance fee: 0.07% p.a.
Estimated fee for 2009/10
Base fee: 0.55% p.a.
Performance fee: 0.07% p.a.
Estimated fee for 2009/10
Base fee: 0.55% p.a.
Performance fee: 0.07% p.a.
INV
ESTM
ENT
FEE
S2
INV
ESTM
ENT
FEE
S2
INV
ESTM
ENT
FEE
S2
1 Past performance is not a reliable indication of future performance. Returns are for the year ended 30 June 2009 and are after investment fees have been deducted.
2 It is important to read the information on page 3. Buy/Sell spreads are as at 30 June 2009.
Investment in: A wide variety of asset classes to gain the benefits of diversification. It primarily invests in Australian and international shares for exposure to economic growth.
Style: Multi-manager, active.
What is it for? This investment option is designed for members who want to generate wealth over the long-term.
Primary performance objective:Beat inflation by 5.5% p.a. over periods of 7 to 10 years after investment fees.
Expected outcome:
• Positivereturnsexpectedin4outof5 years on average over the long-term.
• Outperformthemedianofsimilarsuperfunds over periods of 5 to 7 years.
• Moderatetohighvolatilityofreturnsintheshort-term.
Investment in: A wide variety of asset classes to gain the benefit of diversification and may employ option strategies from time to time to reduce the impact of share market falls.
Style: Multi-manager, active.
What is it for? This investment option is designed for members who are close to, or have reached retirement. It is structured to generate wealth over the medium to long-term, while providing some reduction to the volatility of returns in the short-term.
Primary performance objective:Beat inflation by 4.0% p.a. over 5 years after investment fees.
Expected outcome:
• Positivereturnsexpectedin8outof9 years on average over the long-term.
• Lowtomoderatevolatilityofreturnsintheshort-term.
• Outperformthemedianofsimilarsuperfunds over periods of 5 to 7 years.
Sunsuper Retirement was previously called Sunsuper Moderate.
Investment in: A wide variety of asset classes to gain the benefits of diversification. It has a large allocation to Australian and international shares for exposure to economic growth.
Style: Multi-manager, active.
What is it for? This investment option is designed for members who want to generate wealth over the medium to long-term, while being sensitive to the relative performance of other large Australian superannuation funds.
Primary performance objective: Outperform the median of similar super funds over periods of 5 to 7 years.
Expected outcome:
• Positivereturnsexpectedin5outof6 years on average over the long-term.
• Beatinflationby4.5%p.a.overthe long-term after investment fees.
• Moderatevolatilityofreturnsinthe short-term.
INV
ESTM
ENT
OB
JECT
IVES
INV
ESTM
ENT
OB
JECT
IVES
INV
ESTM
ENT
OB
JECT
IVES

Inve
stm
ent
mix
30
/6/0
9
Inve
stm
ent
mix
30
/6/0
8
Ben
chm
ark
%
Allo
wab
le
rang
e%
Australian shares 10.1 9.4 10 0-15International shares 10.0 9.2 10 0-15Property 4.7 5.2 5 0-20Infrastructure 5.0 4.9 5 0-20Fixed interest 44.8 45.7 45 0-50Hedge funds 7.5 7.2 7.5 0-15Cash 17.9 18.4 17.5 0-100
1 year(%)
5 years(% p.a.)
3 years(% p.a.)
4.3
5.2
-15.2
-10.9
-3.1
-17.2 -11.3
-25.6
-15.7-21.8
-7.9
-40.9
-14.0
8.211.1
-17.4
6.3 5.5
-11.0
5.8
7.4 5.82.2
1 year(%)
1 year(%)
5 years(% p.a.)
3 years(% p.a.)
1 year(%)
3 years(% p.a.)
1 year(%)
3 years(% p.a.)
1 year(%)
5 years(% p.a.)
3 years(% p.a.)
1 year(%)
5 years(% p.a.)
3 years(% p.a.)
1 year(%)
5 years(% p.a.)
3 years(% p.a.)
1 year(%)
5 years(% p.a.)
3 years(% p.a.)
1 year(%)
5 years(% p.a.)
3 years(% p.a.)
1 year(%)
3 years(% p.a.)
1 year(%)
3 years(% p.a.)
1 year(%)
3 years(% p.a.)
-1.0-12.6
0.85.5
-7.3
3.36.2
-0.6
7.5
-1.8
-16.0
-17.9
-3.6
-20.0
-10.3
-9.1
-29.4
-8.3-11.1
-33.6
Sunsuper Growth
Sunsuper Balanced
Sunsuper Retirement
Sunsuper Conservative
Sunsuper Australian Shares
SSgA Australian Equities Index
SSgA Global Index Plus (hedged)
Sunsuper InternationalShares (hedged)
Sunsuper Property
SSgA Australian Listed Property Index
SSgA Global Fixed Income Index
Sunsuper Cash
Sunsuper Capital Guaranteed
1 year(%)
5 years(% p.a.)
3 years(% p.a.)
4.3
5.2
-15.2
-10.9
-3.1
-17.2 -11.3
-25.6
-15.7-21.8
-7.9
-40.9
-14.0
8.211.1
-17.4
6.3 5.5
-11.0
5.8
7.4 5.82.2
1 year(%)
1 year(%)
5 years(% p.a.)
3 years(% p.a.)
1 year(%)
3 years(% p.a.)
1 year(%)
3 years(% p.a.)
1 year(%)
5 years(% p.a.)
3 years(% p.a.)
1 year(%)
5 years(% p.a.)
3 years(% p.a.)
1 year(%)
5 years(% p.a.)
3 years(% p.a.)
1 year(%)
5 years(% p.a.)
3 years(% p.a.)
1 year(%)
5 years(% p.a.)
3 years(% p.a.)
1 year(%)
3 years(% p.a.)
1 year(%)
3 years(% p.a.)
1 year(%)
3 years(% p.a.)
-1.0-12.6
0.85.5
-7.3
3.36.2
-0.6
7.5
-1.8
-16.0
-17.9
-3.6
-20.0
-10.3
-9.1
-29.4
-8.3-11.1
-33.6
Sunsuper Growth
Sunsuper Balanced
Sunsuper Retirement
Sunsuper Conservative
Sunsuper Australian Shares
SSgA Australian Equities Index
SSgA Global Index Plus (hedged)
Sunsuper InternationalShares (hedged)
Sunsuper Property
SSgA Australian Listed Property Index
SSgA Global Fixed Income Index
Sunsuper Cash
Sunsuper Capital Guaranteed
Ben
chm
ark
%
Australian shares 100
Ben
chm
ark
%
Australian shares 100
5
SSgA Australian Equities IndexSunsuper Conservative Sunsuper Australian Shares
Investment in: Australian shares.
Style: Single-manager, index.
Performance benchmark: S&P/ASX 200 Accumulation Index.
Performance objective: Closely match the returns of the performance benchmark, before fees.
Investment in: Australian shares.
Style: Multi-manager, active.
Performance benchmark: S&P/ASX 300 Accumulation Index.
Performance objective: Beat the performance benchmark by 1–2% p.a. over rolling 5 years.
INV
ESTM
ENT
OB
JECT
IVES
INV
ESTM
ENT
OB
JECT
IVES
Actual fee for 2008/09
Base fee: 0.42% p.a.
Performance fee: 0.10% p.a.
Buy/sell spread: nil
For the periods ending 30 June 2009
ASS
ET A
LLO
CATI
ON
INV
ESTM
ENT
RET
UR
NS
1
Estimated fee for 2009/10
Base fee: 0.40% p.a.
Performance fee: 0.07% p.a.
INV
ESTM
ENT
FEE
S2
Actual fee for 2008/09
Base fee: 0.33% p.a.
Performance fee: 0.18% p.a.
Buy/sell spread: nil
ASS
ET A
LLO
CATI
ON
INV
ESTM
ENT
RET
UR
NS
1
Estimated fee for 2009/10
Base fee: 0.35% p.a.
Performance fee: 0.05% p.a.
INV
ESTM
ENT
FEE
S2
For the periods ending 30 June 2009
Actual fee for 2008/09
Base fee: 0.15% p.a.
Performance fee: n/a
Buy/sell spread: 0.10% / 0.12%
ASS
ET A
LLO
CATI
ON
INV
ESTM
ENT
RET
UR
NS
1
Estimated fee for 2009/10
Base fee: 0.15% p.a.
Performance fee: n/a
INV
ESTM
ENT
FEE
S2
For the periods ending 30 June 2009
Investment in: A diversified mixture of assets, with an emphasis on fixed interest and cash assets.
Style: Multi-manager, active.
What is it for? This investment option is designed for members who seek less volatile returns for their super while maintaining some growth exposure. Using your money in the short-term is likely to be your main purpose.
Primary performance objective: Returns after investment fees that are 1.0% p.a. above the UBS Australia Bank Bill Index over rolling periods of 2 to 5 years.
Expected outcome:
• Beatinflationby3.5%p.a.overthe long-term after investment fees.
• Positivereturnsexpectedin19outof20 years on average over the long term.
• Lowlevelsofvolatilityfromyeartoyear.
• Outperformthemedianofsimilarsuperfunds over periods of 5 to 7 years.
INV
ESTM
ENT
OB
JECT
IVES
Single asset class options

Ben
chm
ark
%
International shares 100
Ben
chm
ark
%
International shares 100
Ben
chm
ark
%
Property 100
1 year(%)
5 years(% p.a.)
3 years(% p.a.)
4.3
5.2
-15.2
-10.9
-3.1
-17.2 -11.3
-25.6
-15.7-21.8
-7.9
-40.9
-14.0
8.211.1
-17.4
6.3 5.5
-11.0
5.8
7.4 5.82.2
1 year(%)
1 year(%)
5 years(% p.a.)
3 years(% p.a.)
1 year(%)
3 years(% p.a.)
1 year(%)
3 years(% p.a.)
1 year(%)
5 years(% p.a.)
3 years(% p.a.)
1 year(%)
5 years(% p.a.)
3 years(% p.a.)
1 year(%)
5 years(% p.a.)
3 years(% p.a.)
1 year(%)
5 years(% p.a.)
3 years(% p.a.)
1 year(%)
5 years(% p.a.)
3 years(% p.a.)
1 year(%)
3 years(% p.a.)
1 year(%)
3 years(% p.a.)
1 year(%)
3 years(% p.a.)
-1.0-12.6
0.85.5
-7.3
3.36.2
-0.6
7.5
-1.8
-16.0
-17.9
-3.6
-20.0
-10.3
-9.1
-29.4
-8.3-11.1
-33.6
Sunsuper Growth
Sunsuper Balanced
Sunsuper Retirement
Sunsuper Conservative
Sunsuper Australian Shares
SSgA Australian Equities Index
SSgA Global Index Plus (hedged)
Sunsuper InternationalShares (hedged)
Sunsuper Property
SSgA Australian Listed Property Index
SSgA Global Fixed Income Index
Sunsuper Cash
Sunsuper Capital Guaranteed
1 year(%)
5 years(% p.a.)
3 years(% p.a.)
4.3
5.2
-15.2
-10.9
-3.1
-17.2 -11.3
-25.6
-15.7-21.8
-7.9
-40.9
-14.0
8.211.1
-17.4
6.3 5.5
-11.0
5.8
7.4 5.82.2
1 year(%)
1 year(%)
5 years(% p.a.)
3 years(% p.a.)
1 year(%)
3 years(% p.a.)
1 year(%)
3 years(% p.a.)
1 year(%)
5 years(% p.a.)
3 years(% p.a.)
1 year(%)
5 years(% p.a.)
3 years(% p.a.)
1 year(%)
5 years(% p.a.)
3 years(% p.a.)
1 year(%)
5 years(% p.a.)
3 years(% p.a.)
1 year(%)
5 years(% p.a.)
3 years(% p.a.)
1 year(%)
3 years(% p.a.)
1 year(%)
3 years(% p.a.)
1 year(%)
3 years(% p.a.)
-1.0-12.6
0.85.5
-7.3
3.36.2
-0.6
7.5
-1.8
-16.0
-17.9
-3.6
-20.0
-10.3
-9.1
-29.4
-8.3-11.1
-33.6
Sunsuper Growth
Sunsuper Balanced
Sunsuper Retirement
Sunsuper Conservative
Sunsuper Australian Shares
SSgA Australian Equities Index
SSgA Global Index Plus (hedged)
Sunsuper InternationalShares (hedged)
Sunsuper Property
SSgA Australian Listed Property Index
SSgA Global Fixed Income Index
Sunsuper Cash
Sunsuper Capital Guaranteed
Sunsuper Annual report — Pension 2008–2009
6
Single asset class options (continued)
Sunsuper PropertySSgA Global Index Plus (hedged) Sunsuper International Shares
Investment in: International shares.
Style: Single-manager, enhanced index.
Performance benchmark: MSCI World Ex-Australia Net in $A (hedged).
Performance objective: Beat the performance benchmark by 0.75% to 1% p.a. over rolling 3 year periods.
Currency: Hedged.
Investment in: Australian and international property.
Style: Multi-manager, active.
Performance benchmark: 50% S&P/ASX 200 A-REIT Index plus 50% FTSE EPRA/NAREIT Global REIT $A (hedged).
Performance objective: Beat the performance benchmark over rolling 5 years.
Currency: Hedged.
Additional information: To gain exposure to a wide range of property assets. Sunsuper Property invests in listed and unlisted Australian and international property funds.
Investment in: International shares.
Style: Multi-manager, active.
Performance benchmark: S&P Global Broad Market Index in $A (hedged).
Performance objective: beat the performance benchmark by 1–2% p.a. over rolling 5 years.
Currency: Combination of hedged and unhedged.
It may not be possible for this product to be 100% currency hedged at all times. Up to 25% of the overseas currency exposure may be unhedged at any point in time.
INV
ESTM
ENT
OB
JECT
IVES
INV
ESTM
ENT
OB
JECT
IVES
INV
ESTM
ENT
OB
JECT
IVES
ASS
ET A
LLO
CATI
ON
INV
ESTM
ENT
RET
UR
NS
1
Estimated fee for 2009/10
Base fee: 0.25% p.a.
Performance fee: n/a
INV
ESTM
ENT
FEE
S2
For the periods ending 30 June 2009
Actual fee for 2008/09
Base fee: 0.62% p.a.
Performance fee: 0.01% p.a.
Buy/sell spread: nil
Actual fee for 2008/09
Base fee: 0.25% p.a.
Performance fee: n/a
Buy/sell spread: 0.30% / 0.35%
ASS
ET A
LLO
CATI
ON
INV
ESTM
ENT
RET
UR
NS
1
Estimated fee for 2009/10
Base fee: 0.60% p.a.
Performance fee: 0.05% p.a.
INV
ESTM
ENT
FEE
S2
For the periods ending 30 June 2009
Actual fee for 2008/09
Base fee: 0.86% p.a.
Performance fee: 0.04% p.a.
Buy/sell spread: nil
ASS
ET A
LLO
CATI
ON
INV
ESTM
ENT
RET
UR
NS
1
Estimated fee for 2009/10
Base fee: 0.90% p.a.
Performance fee: 0.02% p.a.
INV
ESTM
ENT
FEE
S2
For the periods ending 30 June 2009
1 Past performance is not a reliable indication of future performance. Returns are for the year ended 30 June 2009 and are after investment fees have been deducted.
2 It is important to read the information on page 3. Buy/Sell spreads are as at 30 June 2009.
Ben
chm
ark
%
Property 100
Ben
chm
ark
%
Fixed interest 100
Ben
chm
ark
%
Cash 100
1 year(%)
5 years(% p.a.)
3 years(% p.a.)
4.3
5.2
-15.2
-10.9
-3.1
-17.2 -11.3
-25.6
-15.7-21.8
-7.9
-40.9
-14.0
8.211.1
-17.4
6.3 5.5
-11.0
5.8
7.4 5.82.2
1 year(%)
1 year(%)
5 years(% p.a.)
3 years(% p.a.)
1 year(%)
3 years(% p.a.)
1 year(%)
3 years(% p.a.)
1 year(%)
5 years(% p.a.)
3 years(% p.a.)
1 year(%)
5 years(% p.a.)
3 years(% p.a.)
1 year(%)
5 years(% p.a.)
3 years(% p.a.)
1 year(%)
5 years(% p.a.)
3 years(% p.a.)
1 year(%)
5 years(% p.a.)
3 years(% p.a.)
1 year(%)
3 years(% p.a.)
1 year(%)
3 years(% p.a.)
1 year(%)
3 years(% p.a.)
-1.0-12.6
0.85.5
-7.3
3.36.2
-0.6
7.5
-1.8
-16.0
-17.9
-3.6
-20.0
-10.3
-9.1
-29.4
-8.3-11.1
-33.6
Sunsuper Growth
Sunsuper Balanced
Sunsuper Retirement
Sunsuper Conservative
Sunsuper Australian Shares
SSgA Australian Equities Index
SSgA Global Index Plus (hedged)
Sunsuper InternationalShares (hedged)
Sunsuper Property
SSgA Australian Listed Property Index
SSgA Global Fixed Income Index
Sunsuper Cash
Sunsuper Capital Guaranteed
1 year(%)
5 years(% p.a.)
3 years(% p.a.)
4.3
5.2
-15.2
-10.9
-3.1
-17.2 -11.3
-25.6
-15.7-21.8
-7.9
-40.9
-14.0
8.211.1
-17.4
6.3 5.5
-11.0
5.8
7.4 5.82.2
1 year(%)
1 year(%)
5 years(% p.a.)
3 years(% p.a.)
1 year(%)
3 years(% p.a.)
1 year(%)
3 years(% p.a.)
1 year(%)
5 years(% p.a.)
3 years(% p.a.)
1 year(%)
5 years(% p.a.)
3 years(% p.a.)
1 year(%)
5 years(% p.a.)
3 years(% p.a.)
1 year(%)
5 years(% p.a.)
3 years(% p.a.)
1 year(%)
5 years(% p.a.)
3 years(% p.a.)
1 year(%)
3 years(% p.a.)
1 year(%)
3 years(% p.a.)
1 year(%)
3 years(% p.a.)
-1.0-12.6
0.85.5
-7.3
3.36.2
-0.6
7.5
-1.8
-16.0
-17.9
-3.6
-20.0
-10.3
-9.1
-29.4
-8.3-11.1
-33.6
Sunsuper Growth
Sunsuper Balanced
Sunsuper Retirement
Sunsuper Conservative
Sunsuper Australian Shares
SSgA Australian Equities Index
SSgA Global Index Plus (hedged)
Sunsuper InternationalShares (hedged)
Sunsuper Property
SSgA Australian Listed Property Index
SSgA Global Fixed Income Index
Sunsuper Cash
Sunsuper Capital Guaranteed
7
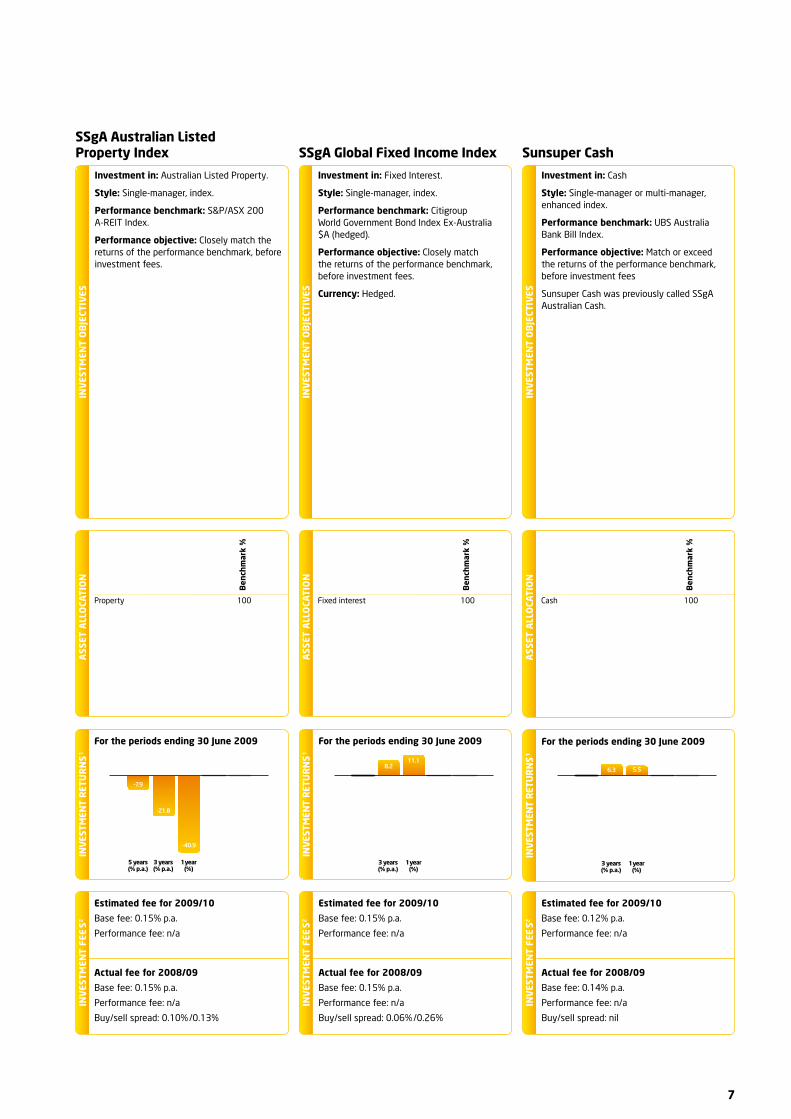
Sunsuper CashSSgA Australian Listed Property Index SSgA Global Fixed Income Index
Investment in: Australian Listed Property.
Style: Single-manager, index.
Performance benchmark: S&P/ASX 200 A-REIT Index.
Performance objective: Closely match the returns of the performance benchmark, before investment fees.
Investment in: Cash
Style: Single-manager or multi-manager, enhanced index.
Performance benchmark: UBS Australia Bank Bill Index.
Performance objective: Match or exceed the returns of the performance benchmark, before investment fees
Sunsuper Cash was previously called SSgA Australian Cash.
Investment in: Fixed Interest.
Style: Single-manager, index.
Performance benchmark: Citigroup World Government Bond Index Ex-Australia $A (hedged).
Performance objective: Closely match the returns of the performance benchmark, before investment fees.
Currency: Hedged.
INV
ESTM
ENT
OB
JECT
IVES
INV
ESTM
ENT
OB
JECT
IVES
INV
ESTM
ENT
OB
JECT
IVES
Actual fee for 2008/09
Base fee: 0.15% p.a.
Performance fee: n/a
Buy/sell spread: 0.10% /0.13%
ASS
ET A
LLO
CATI
ON
INV
ESTM
ENT
RET
UR
NS
1
Estimated fee for 2009/10
Base fee: 0.15% p.a.
Performance fee: n/a
INV
ESTM
ENT
FEE
S2
For the periods ending 30 June 2009
Actual fee for 2008/09
Base fee: 0.15% p.a.
Performance fee: n/a
Buy/sell spread: 0.06% /0.26%
ASS
ET A
LLO
CATI
ON
INV
ESTM
ENT
RET
UR
NS
1
Estimated fee for 2009/10
Base fee: 0.15% p.a.
Performance fee: n/a
INV
ESTM
ENT
FEE
S2
For the periods ending 30 June 2009
Actual fee for 2008/09
Base fee: 0.14% p.a.
Performance fee: n/a
Buy/sell spread: nil
ASS
ET A
LLO
CATI
ON
INV
ESTM
ENT
RET
UR
NS
1
Estimated fee for 2009/10
Base fee: 0.12% p.a.
Performance fee: n/a
INV
ESTM
ENT
FEE
S2
For the periods ending 30 June 2009

Ben
chm
ark
%
Depositis with ADIs
and Capital Guarranteed
Investment
100
1 year(%)
5 years(% p.a.)
3 years(% p.a.)
4.3
5.2
-15.2
-10.9
-3.1
-17.2 -11.3
-25.6
-15.7-21.8
-7.9
-40.9
-14.0
8.211.1
-17.4
6.3 5.5
-11.0
5.8
7.4 5.82.2
1 year(%)
1 year(%)
5 years(% p.a.)
3 years(% p.a.)
1 year(%)
3 years(% p.a.)
1 year(%)
3 years(% p.a.)
1 year(%)
5 years(% p.a.)
3 years(% p.a.)
1 year(%)
5 years(% p.a.)
3 years(% p.a.)
1 year(%)
5 years(% p.a.)
3 years(% p.a.)
1 year(%)
5 years(% p.a.)
3 years(% p.a.)
1 year(%)
5 years(% p.a.)
3 years(% p.a.)
1 year(%)
3 years(% p.a.)
1 year(%)
3 years(% p.a.)
1 year(%)
3 years(% p.a.)
-1.0-12.6
0.85.5
-7.3
3.36.2
-0.6
7.5
-1.8
-16.0
-17.9
-3.6
-20.0
-10.3
-9.1
-29.4
-8.3-11.1
-33.6
Sunsuper Growth
Sunsuper Balanced
Sunsuper Retirement
Sunsuper Conservative
Sunsuper Australian Shares
SSgA Australian Equities Index
SSgA Global Index Plus (hedged)
Sunsuper InternationalShares (hedged)
Sunsuper Property
SSgA Australian Listed Property Index
SSgA Global Fixed Income Index
Sunsuper Cash
Sunsuper Capital Guaranteed
Sunsuper Annual report — Pension 2008–2009
8
Single asset class options(continued)
Closed options
Sunsuper Capital Guaranteed
Investment in: A mixture of cash deposits with Authorised Deposit-taking Institutions (ADIs) and investments in capital guaranteed superannuation products.
Style: Active, multi-manager.
Performance benchmark: UBS Australia Bank Bill Index (after an allowance for investment tax).
Performance objective: The option is designed to provide:
• Fullsecurityofcapital,
• Modestreturnsoverthemediumtolong-term,and
• Targetperformance(afterinvestmenttaxandinvestmentfees)isthereturn of the UBS Australia Bank Bill Index (after investment tax) over rolling five year periods.
Additional information: Where investments are made into capital guaranteed superannuation products issued by life insurance companies or banks, the capital guarantee is provided by the issuing life company or bank. Sunsuper itself does not guarantee the security of capital.
The Capital Guaranteed option is quite different from other investment options. While the capital value is guaranteed by the issuing life insurance companies or banks not to fall, the trade-off with this guarantee is that your longer-term returns may be lower than some less conservative options. This may limit the chances of achieving your financial goals. You should consider seeking financial advice on alternative investment arrangements before investment in the option arrangements before investing in this option.
In some unfavourable market conditions, we reserve the right to restrict switches and benefit payments from the capital guaranteed option.
INV
ESTM
ENT
OB
JECT
IVES
1 Past performance is not a reliable indication of future performance. Returns are for the year ended 30 June 2009 and are after investment fees have been deducted .
2 It is important to read the information on page 3. Buy/Sell spreads are as at 30 June 2009.
AMP Capital’s Multi-Manager Growth
Sunsuper Fixed Interest
Sunsuper International Shares (unhedged)
Sunsuper All Shares
For the periods ending 30 June 2009 5 years: n/a 3 years: n/a 1 year: 21.1% p.a.(commenced August 2006) Actual fee for 2008/09Base fee: 0.70% p.a. Performance fee: 0.06% p.a.
For the periods ending 30 June 2009 5 years: 7.9% p.a. 3 years: 8.2% p.a. 1 year: 10.4% p.a. Actual fee for 2008/09Base fee: 0.32% p.a. Performance fee: nil
For the periods ending 30 June 2009 5 years: -2.3% p.a. 3 years: -10.8% p.a. 1 year: -19.7% p.a. Actual fee for 2008/09Base fee: 0.60% p.a. Performance fee: 0.07% p.a.
For the periods ending 30 June 2009 5 years: 2.9% p.a. 3 years: -5.8% p.a. 1 year: -18.0% p.a. Actual fee for 2008/09Base fee: 0.49% p.a. Performance fee: 0.12% p.a.
INV
ESTM
ENT
RET
UR
NS
1 A
ND
FEE
S2IN
VES
TMEN
T R
ETU
RN
S1
AN
D F
EES2
INV
ESTM
ENT
RET
UR
NS
1 A
ND
FEE
S2IN
VES
TMEN
T R
ETU
RN
S1
AN
D F
EES2
The following options closed to new pension investments on 1 May 2009 and to all pension investments on 30 June 2009.
Actual fee for 2008/09
Base fee: 0.48% p.a.
Performance fee: nil
Buy/sell spread: nil
ASS
ET A
LLO
CATI
ON
INV
ESTM
ENT
RET
UR
NS
1
Estimated fee for 2009/10
Base fee: 0.60% p.a.
Performance fee: nil
INV
ESTM
ENT
FEE
S2
For the periods ending 30 June 2009

9
QIC Growth
Maple-Brown Abbott Australian Shares
QIC International Equities (unhedged)
AMP Capital’s Responsible Investment Leaders Balanced
SSgA Passive Balanced
AMP Capital’s Multi-Manager Emerging Markets
AMP Capital’s Multi-Manager Balanced
AMP Capital Equity Fund
SSgA Global Index Plus (unhedged)
For the periods ending 30 June 2009 5 years: 5.9% p.a. 3 years: -0.2% p.a. 1 year: -8.7% p.a.
Actual fee for 2008/09Base fee: 0.52% p.a. Performance fee: 0.09% p.a.
For the periods ending 30 June 2009 5 years: 7.2% p.a 3 years: -0.4% p.a. 1 year: -11.3% p.a. Actual fee for 2008/09Base fee: 0.41% p.a. Performance fee: n/a
For the periods ending 30 June 2009 5 years: n/a 3 years: -12.3% p.a. 1 year: -21.3% p.a.(commenced October 2005) Actual fee for 2008/09Base fee: 0.74% p.a. Performance fee: 0.27% p.a.
For the periods ending 30 June 2009 5 years: n/a 3 years: n/a 1 year: -10.7% p.a.(commenced January 2007)
Actual fee for 2008/09Base fee: 0.65% p.a. Performance fee: 0.01% p.a.
For the periods ending 30 June 2009 5 years: n/a 3 years: -3.3% p.a. 1 year: -11.9% p.a. Actual fee for 2008/09Base fee: 0.16% p.a. Performance fee: n/a
For the periods ending 30 June 2009 5 years: n/a 3 years: n/a 1 year: -10.0% p.a. Actual fee for 2008/09Base fee: 0.91% p.a. Performance fee: nil
For the periods ending 30 June 2009 5 years: n/a 3 years: -4.5% p.a. 1 year: -18.9% p.a.(commenced May 2006) Actual fee for 2008/09Base fee: 0.70% p.a. Performance fee: 0.14% p.a.
For the periods ending 30 June 2009 5 years: n/a 3 years: -2.3% p.a. 1 year: -17.8% p.a. Actual fee for 2008/09Base fee: 0.60% p.a. Performance fee: n/a
For the periods ending 30 June 2009 5 years: -1.7% p.a. 3 years: -8.9% p.a. 1 year: -11.7% p.a. Actual fee for 2008/09Base fee: 0.25% p.a. Performance fee: n/a
INV
ESTM
ENT
RET
UR
NS
1 A
ND
FEE
S2
INV
ESTM
ENT
RET
UR
NS
1 A
ND
FEE
S2
INV
ESTM
ENT
RET
UR
NS
1 A
ND
FEE
S2
INV
ESTM
ENT
RET
UR
NS
1 A
ND
FEE
S2
INV
ESTM
ENT
RET
UR
NS
1 A
ND
FEE
S2
INV
ESTM
ENT
RET
UR
NS
1 A
ND
FEE
S2
INV
ESTM
ENT
RET
UR
NS
1 A
ND
FEE
S2
INV
ESTM
ENT
RET
UR
NS
1 A
ND
FEE
S2
INV
ESTM
ENT
RET
UR
NS
1 A
ND
FEE
S2

Sunsuper Annual report — Pension 2008–2009
10
Investment managers
Investment manager Asset classesTotal
($mil)
AMP1 Australian Shares, International Shares2, Private Equity, Opportunistic Property, Property, Infrastructure, Fixed Interest, Cash, Capital Guaranteed 2,041.7
Access Capital Infrastructure, Fixed Interest 294.4
Acorn Capital Australian Shares 81.6
Axa Capital Guaranteed 88.0
Balanced Equity Management Australian Shares 779.1
Barwon Investment Partners Private Equity 36.9
Bridgewater Hedge Funds 101.2
Colonial First State Opportunistic Property, Property, Infrastructure, Hedge Funds 294.3
Everest Financial Group Hedge Funds 184.2
Fortis Australian Shares 476.0
GMO International Shares, Infrastructure, Hedge Funds 512.6
Hastings Private Equity, Infrastructure 175.6
Invesco Australian Shares 78.6
Lazard International Shares 220.1
Lazard Carnegie Wylie Private Equity 193.6
Macquarie Private Equity, Property 146.1
Makena International Shares, Private Equity, Property, Fixed Interest, Hedge Funds, Cash 503.5
Maple-Brown Abbott Australian Shares 597.5
MIR Australian Shares 350.8
Morgan Stanley Fixed Interest 591.4
Northward Australian Shares 336.8
Pareto Currency Overlay 34.9
Pimco Fixed Interest 48.8
QIC1 Australian Shares, International Shares, Private Equity, Property, Fixed Interest, Cash, Rebalancing Overlay 512.9
Quest Australian Shares 352.1
State Street Global Advisors1 Australian Shares, International Shares, Property, Fixed Interest, Cash 1,522.1
Suncorp Capital Guaranteed 80.5
TCW Private Equity, Fixed Interest 452.2
Tribeca Australian Shares, Hedge Funds 376.1
Trinity Property 85.6
Wellington Fixed Interest 252.6
Wilshire Private Equity 30.1
Winton Capital Hedge Funds 58.9
Other Private Equity, Opportunistic Property, Property, Infrastructure, Fixed Interest, Hedge Funds, Cash 905.1
Total 12,795.9
1 These managers also invest in multi-asset class portfolios.
2 Assets managed by Alliance Bernstein, Alliance Capital, Arrowstreet, Axa Rosenberg, Baillie Gifford, Colonial First State, Genesis, GMO, Ironbridge, Morgan Stanley, Rothschild and THS Partners.

11
Professional advisersAdministrator Precision Administration Services Pty Ltd*
Custodian National Australia Bank Ltd
Auditor Deloitte Touche Tohmatsu
Investment Consultants
Mercer Human Resources Pty Ltd
Sovereign Investment Research Pty Ltd
Lawyers Corrs Chambers Westgarth
Actuaries Jan Brewer and Shane Mather (Fellows of the Institute of Actuaries of Australia)
* Precision Administration Services is a wholly owned subsidiary of Sunsuper Pty Ltd.
ReservesThe Trustee maintains a reserve in the Fund for the benefit of members.
The reserve is maintained to:
• helpmeettheexpensesofrunningtheFund,
• supportthetimingdifferencesinrespectofactualinvestmenttax and investment fees and the investment tax and fees charged to members, and
• providereservesforthemanagementoftheoperatingrisksofthe Fund.
The Trustee does not maintain the reserve for the purpose of smoothing investment earnings. Members’ accounts are credited or debited with the actual earnings of their selected investment options.
The reserves may invest in the following:
• SunsuperBalancedoption
• Lessvolatileinvestmentsincludingcashwherethereareknown significant short-term liabilities such as tax
• AnyotherinvestmentsdirectlyapprovedbytheTrusteethatdo not impact on the prudential management of the reserves over the past 5 years, Sunsuper’s reserves have been:
Year ending 30 June 2009 2008 2007 2006 2005
Reserves ($mil) 106.9 152.1 124.0 104.7 105.2
The reserve is included in ‘Net assets available to pay benefits’ as disclosed in the Statement of Financial Position on page 13 of this report.
The BoardThe Trustee of the Sunsuper Superannuation Fund is Sunsuper Pty Ltd (ABN 88 010 720 840), which is licensed by the Australian Prudential Regulation Authority (APRA) under a Registrable Superannuation Entity (RSE) licence and holds an Australian Financial Services Licence (AFSL) from the Australian Securities and Investments Commission (ASIC).
The Trustee is responsible for managing the Fund, and ensures it operates in the best interests of all members and continues to comply with all legal requirements.
Sunsuper Pty Ltd has a Board of Directors comprising equal numbers of employer and employee representatives. As at 30 June 2009, the representatives on the Board were:
Member representatives Appointed by
John Battams (Chair) Qld Council of Unions
Bill Ludwig Australian Workers Union of Employees Qld
Ron Monaghan1 Qld Council of Unions
Employer representatives Appointed by
Peter Annand1Qld Chamber of Commerce and Industry Limited
Graham Drummond1Qld Chamber of Commerce and Industry Limited
Graham HeilbronnQld Chamber of Commerce and Industry Limited
1 Members of the Audit, Compliance and Risk Management Committee as at 30 June 2009.
Replacement representatives are appointed by the same employer or union body to ensure there is always equal representation of employees and employers.
The Audit, Compliance and Risk Management Committee of the Board is responsible for reporting to and advising the Board on audit, compliance and risk management issues. The members of the Audit, Compliance and Risk Management Committee are appointed by the Board. All members must be Directors of the Trustee, except for the Audit Committee Financial Expert who can be an external, non-Board member. The current Audit Committee Financial Expert is Marian Micalizzi.
Sunsuper has developed and implemented a comprehensive risk management program, which focuses on the identification, analysis, evaluation, treatment, monitoring and communication of risks. The risk management program is maintained and monitored by an experienced and independent risk manager, and is subject to an annual independent audit by Sunsuper’s external auditor.
All Board members are members of the Investment Committee.

Sunsuper Annual report — Pension 2008–2009
12
ComplianceSunsuper compliesSunsuper is a regulated fund under the Superannuation Industry (Supervision) Act 1993 (SIS), and has been a complying fund since inception in 1987. Sunsuper was granted an RSE licence by the Australian Prudential Regulation Authority (APRA) on 21 October 2005.
It is the Trustee’s responsibility to ensure that Sunsuper meets its licensing obligations, including compliance with the RSE licensee laws and the maintenance of a risk management strategy and plan. As a result, Sunsuper members benefit from the lower tax rates that apply to complying funds. The Trustee lodges a return each year with APRA indicating the Fund’s compliance with relevant legislation, including SIS.
As an Australian Financial Services licensee, Sunsuper must also have arrangements in place to ensure that it complies with its licensee obligations as determined by the Australian Securities and Investment Commission (ASIC). These obligations relate to conduct and disclosure; the provision of financial services; the competence, knowledge and skills of its responsible officers, as well as their good fame and character; the training and competence of its staff and representatives; and dispute resolution and compensation arrangements. Sunsuper has planned and implemented compliance measures, processes and procedures to ensure it meets the obligations.
Further informationFurther information to help you understand your benefits or entitlements, the main features of the Fund, the management and financial condition of the Fund, the Fund’s investment performance or investment strategies, is available by calling us on 13 11 84 or visiting sunsuper.com.au.
Liability insuranceThe Trustee has a Trustee Professional Indemnity Insurance policy that provides appropriate and adequate cover.
Superannuation surchargeThis surcharge was abolished from 1 July 2005, however, surcharge amounts may have been advised by the ATO and been deducted from members’ accounts during the 2008/2009 year. Sunsuper as the Trustee is responsible for the collection and the remittance of these amounts to the ATO and will deduct any surcharge payable from your account.
Dispute ResolutionIf you are unhappy with us, we offer a complaint resolution process at no cost to you. Contact us to discuss your complaint:
Customer Service Hotline: 13 11 84 Customer Service Fax: 07 3016 7722
Sunsuper Complaints Officer: GPO Box 2924 Brisbane Qld 4001
Web: sunsuper.com.au.
If you are still not happy or Sunsuper has not responded within 90 days, you can contact the Superannuation Complaints Tribunal (SCT). This is an independent body set up by the Federal Government to help resolve complaints through conciliation.
They may be contacted by writing to:
The Secretariat Superannuation Complaints Tribunal
Locked Bag 3060 GPO Melbourne Vic 3001
Phone: 1300 780 808
Important information you should know about making a complaint to the SCTThe scope of matters that the SCT can deal with is limited by legislation, and it is possible that the SCT cannot deal with the matter. The SCT will advise you if they can deal with a complaint, and if so, what information is required.
The SCT can only deal with complaints where:
• ThecomplainantisamemberorformermemberofSunsuper,ora person acting on behalf of a member or former member of his/her estate,
• ThecomplaintrelatestoaTrusteedecisionoractioninrespectofa particular member of the fund, not the general management of the fund, and
• ThecomplainthasfirstbeendealtwithunderSunsuper’sinternalcomplaint resolution procedures.
Access to the SCT is free of charge.

13
Financial statementsThe detailed financial statements identify:
• allcontributionstotheFund,
• wheretheFund’smoneywasinvestedandhowmuchincomeit earned,
• expensestheFundpaid,
• theamountofmoneyleftintheFundtopayfuturebenefits, and
• theamounttheFundpaidoutinbenefits.
The Trustee is satisfied that the following abridged financial information derived from the audited Financial Statements of the Fund represents a true and accurate record of changes in the Fund’s net assets during the year to 30 June 2009 and the net assets as at 30 June 2009. Audited Financial Statements and the Independent Report by the Fund’s auditors are available to members on request.
STATEMENT OF NET ASSETS for the year ended 30 June
2009 $000
2008 $000
Investments
Cash and cash equivalents 2,538,272 1,843,122
Fixed interest securities 1,389,885 1,579,586
Australian equities 3,489,181 3,898,287
International equities 2,183,854 2,393,855
Property 633,864 748,272
Alternative assets 2,560,885 2,832,888
Total investments 12,795,941 13,296,010
Other assets
Cash at bank 33,976 46,716
Contributions receivable 127,400 130,443
Other receivables 26,893 14,309
Plant and equipment 3,785 5,118
Intangible assets 4,157 1,457
Deferred tax asset 164,708 8,738
Total other assets 360,919 206,781
Total assets 13,156,860 13,502,791
Liabilities
Benefits payable 84,965 52,929
Other payables 38,770 119,042
Provision for employee benefits 1,102 805
Current tax liabilities 173,184 297,605
Deferred tax liabilities 19,155 13,451
Total liabilities 317,176 483,832
Net assets available to pay benefits 12,839,684 13,018,959
STATEMENT OF CHANGES IN NET ASSETS for the year ended 30 June
2009 $000
2008 $000
Revenue from ordinary activities
Net investment revenue
Interest 126,100 92,506
Dividends and distributions 484,218 603,368
Rental and other investment income 26,801 27,313
Changes in net market value of investments (2,297,570) (1,534,995)
Less: Direct investment expenses (60,453) (45,393)
Contribution revenue
Employer contributions 1,800,152 1,699,289
Member contributions 232,301 336,709
Transfers from other funds 517,162 554,391
Other revenue
Group life insurance rebate 2,068 2,000
Group life insurance proceeds 85,309 44,734
Other income 287 333
Total revenue from ordinary activities 916,375 1,780,255
Expenditure from ordinary activities
Direct member expenses
Group life insurance premiums 116,393 111,830
Superannuation contribution surcharge 116 2,332
Other member and sub-plan specific expenses 1,489 1,167
Indirect member expenses charged to reserves
Fund administration expense 74,102 63,748
Audit fees 252 242
Depreciation expense 1,519 1,074
Amortisation expense 33 -
Anti-detriment payments 1,323 961
Benefits paid and payable 844,211 884,617
Total expenditure from ordinary activities 1,039,438 1,065,971
Total revenue less expenditure before income tax (123,063) 714,284
Income tax expense 56,212 129,909
Total revenue less expenditure after income tax (179,275) 584,375
Net assets available to pay benefits at the beginning of the year 13,018,959 12,434,584
Net assets available to pay benefits at the end of the year 12,839,684 13,018,959

10
67
(08
/09
)
Sunsuper Pty Ltd
ABN 88 010 720 840AFSL No. 228975
Sunsuper Superannuation Fund
ABN 98 503 137 921SPIN SSR 0100 AU
For 2009, Sunsuper has been recognised as one of Australia’s leading superannuation funds by three separate independent rating organisations shown below. We have also bee awarded the titles of Pension Fund of the Year 2009 and Industry Fund of the Year 2006 and 2008.
Contacting us is easy:
Call 13 11 84 (+61 7 3121 0700 when overseas) and speak to a Member Service Representative
Web sunsuper.com.au
Mail GPO Box 2924 Brisbane Qld 4001
Fax 07 3016 7722
This document has been prepared on 28 August 2009 and issued by Sunsuper Pty Ltd (ABN 88 010 720 840), Trustee of the Sunsuper Superannuation Fund. While it has been prepared with all reasonable care, no responsibility or liability is accepted for any errors or omissions or misstatement however caused. All forecasts and estimates are based on certain assumptions which may change. If those assumptions change, our forecasts and estimates may also change. This document has been prepared for general information purposes only and not as specific advice to any particular person. Any advice contained in this document is general advice and does not take into account any particular person’s objectives, financial situation or needs. Because of this, before acting on any advice, you should consider its appropriateness, having regard to your own particular objectives, financial situation and needs. You should obtain and consider the Product Disclosure Statement (PDS) before making any decision about whether to acquire or continue to hold the product. The PDS is available by contacting a Member Service Representative on 13 11 84. We are committed to respecting your privacy. Our formal privacy policy sets out how we do this. If you would like a copy of Sunsuper’s privacy policy please contact us.