pennsylvania: deindustrialization and divisionin bethlehem, the home-grown bethlehem steel...
TRANSCRIPT

CHAPTER 7
Pennsylvania: Deindustrialization and Division
As a state that is closely identi‹ed with deindustrialization and the rustbelt decline of the post–World War II period, Pennsylvania has not grownmuch in the last four decades of the twentieth century. Once the heartlandof coal, apparel, and steel production, by 1990 only 20 percent of the laborforce was employed in manufacturing. The shipbuilding industry inPhiladelphia died soon after World War II. The steel industry in westernPennsylvania completely collapsed by the early 1980s, with only 14 per-cent of Pittsburgh’s employment accounted for by manufacturing by 1988(Giarratani and Houston 1989; Serrin 1993). In Bethlehem, the home-grown Bethlehem Steel Corporation employed only 3,600 workers by themid-1990s, down from nearly 32,000 at its peak during World War II(Deitrick and Beauregard 1995). The coal industry in northeastern Penn-sylvania also died, stranding long-time industrial workers in a postindus-trial economy (Marsh 1987, 339; Kolbe 1975).
In spite of the deindustrialization process, the state has grown, thoughvery slowly. The Pennsylvania population was just 14 percent larger in themid-1990s than it was in 1950. Between 1980 and 1992, the average countygrew by only 3.8 percent, and in thirty-‹ve of the state’s sixty-seven coun-ties the population declined. None of Pennsylvania’s jurisdictions havegrown as fast as those of Florida or California. This is no surprise, ofcourse. Migrants and immigrants base their choice of destinations partlyon the availability of employment. Pennsylvania’s stagnant economy hasnot been inviting in this respect.
For years there has been a cultural divide separating the people ofeastern and western Pennsylvania. This divide has become demographicand economic, too, as map 7.1 illustrates. Eastern Pennsylvania hasweathered the process of deindustrialization far better than the west andhas completed the transition to the service economy without the long-termunemployment that still plagues the western counties (Gimpel 1996). The
238
ch7.qxd 6/17/99 12:25 PM Page 238

Map 7.1. Population growth in Pennsylvania counties, 1950–92. (Mean = 32.7, Moran’s I = .22)
ch7.qxd 6/17/99 12:25 PM Page 239
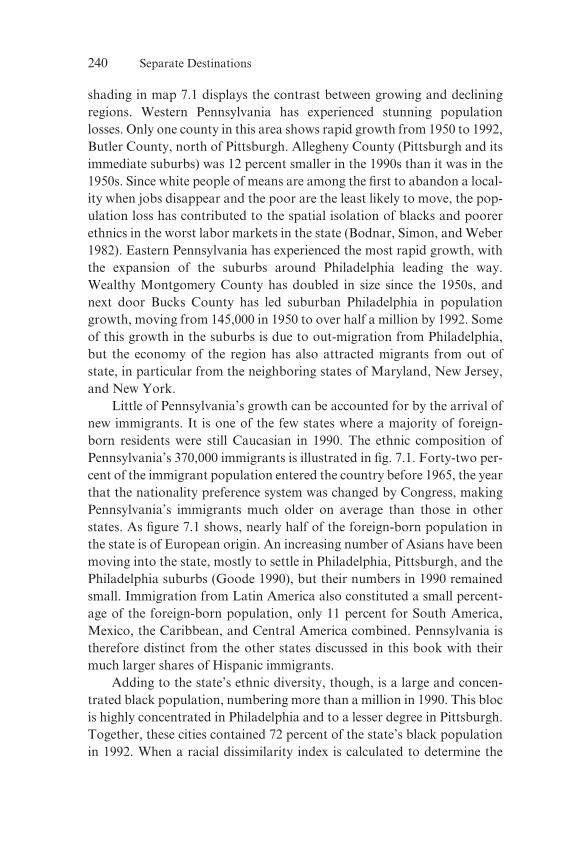
shading in map 7.1 displays the contrast between growing and decliningregions. Western Pennsylvania has experienced stunning populationlosses. Only one county in this area shows rapid growth from 1950 to 1992,Butler County, north of Pittsburgh. Allegheny County (Pittsburgh and itsimmediate suburbs) was 12 percent smaller in the 1990s than it was in the1950s. Since white people of means are among the ‹rst to abandon a local-ity when jobs disappear and the poor are the least likely to move, the pop-ulation loss has contributed to the spatial isolation of blacks and poorerethnics in the worst labor markets in the state (Bodnar, Simon, and Weber1982). Eastern Pennsylvania has experienced the most rapid growth, withthe expansion of the suburbs around Philadelphia leading the way.Wealthy Montgomery County has doubled in size since the 1950s, andnext door Bucks County has led suburban Philadelphia in populationgrowth, moving from 145,000 in 1950 to over half a million by 1992. Someof this growth in the suburbs is due to out-migration from Philadelphia,but the economy of the region has also attracted migrants from out ofstate, in particular from the neighboring states of Maryland, New Jersey,and New York.
Little of Pennsylvania’s growth can be accounted for by the arrival ofnew immigrants. It is one of the few states where a majority of foreign-born residents were still Caucasian in 1990. The ethnic composition ofPennsylvania’s 370,000 immigrants is illustrated in ‹g. 7.1. Forty-two per-cent of the immigrant population entered the country before 1965, the yearthat the nationality preference system was changed by Congress, makingPennsylvania’s immigrants much older on average than those in otherstates. As ‹gure 7.1 shows, nearly half of the foreign-born population inthe state is of European origin. An increasing number of Asians have beenmoving into the state, mostly to settle in Philadelphia, Pittsburgh, and thePhiladelphia suburbs (Goode 1990), but their numbers in 1990 remainedsmall. Immigration from Latin America also constituted a small percent-age of the foreign-born population, only 11 percent for South America,Mexico, the Caribbean, and Central America combined. Pennsylvania istherefore distinct from the other states discussed in this book with theirmuch larger shares of Hispanic immigrants.
Adding to the state’s ethnic diversity, though, is a large and concen-trated black population, numbering more than a million in 1990. This blocis highly concentrated in Philadelphia and to a lesser degree in Pittsburgh.Together, these cities contained 72 percent of the state’s black populationin 1992. When a racial dissimilarity index is calculated to determine the
240 Separate Destinations
ch7.qxd 6/17/99 12:25 PM Page 240

concentration of the black population across the state’s counties, the indexreveals considerably more concentration and segregation of blacks fromwhites than in Florida (chap. 6). In Pennsylvania, nearly two-thirds ofblacks would have to move for them to be evenly distributed across thestate’s sixty-seven counties. The Asian and Hispanic populations, whilemuch smaller, are not nearly so segregated. The same diversity index indi-cates that only about one-third of Asians and 46 percent of Hispanicswould have to move for them to be evenly distributed. Politically, too, thestate is spatially balkanized, as there are many one-party counties of eitherstrong Republican or Democratic inclination. As in Florida, an index ofdissimilarity suggests that about one-third of Republicans (or Democrats)would have to move in order for the parties to have equal strength acrossall counties.
Differences between immigrants, native Pennsylvanians, and internalmigrants residing in the state in 1990 closely re›ect the ‹ndings of manynational studies. Migrants earn considerably more than either immigrantsor natives (see appendix A, table A7.1). Internal migrants are also the besteducated of the three groups. Natives and immigrants, though, are onlyseveral hundred dollars apart in average wage and salary incomes. TableA7.1 shows considerable difference between mean and median incomes forimmigrants, indicating that immigrant earnings are especially concen-trated at the lower end of the income distribution. An important differencebetween Pennsylvania and other states lies in the age of the foreign-bornpopulation. Immigrants were several years older, on average, than eithernatives or internal migrants in 1990. Pennsylvania has attracted so fewrecent immigrants from Latin America and Asia that fully 67 percent of
Pennsylvania 241
Fig. 7.1. Composition of the foreign-born population in Pennsylvania, 1990
ch7.qxd 6/17/99 12:25 PM Page 241
242 Separate Destinations
foreign-born residents there are non-Hispanic whites. The data stronglysuggest that the foreign-born population in Pennsylvania arrived in theUnited States early. It is well established relative to populations in otherstates, although it is certainly not wealthy. Given the racial and economicpro‹le of the immigrant population, we can reasonably expect it to be bet-ter integrated with the native and internal migrant populations than it is inmany other places.
Settlement Patterns of Migrants and Immigrants in Pennsylvania
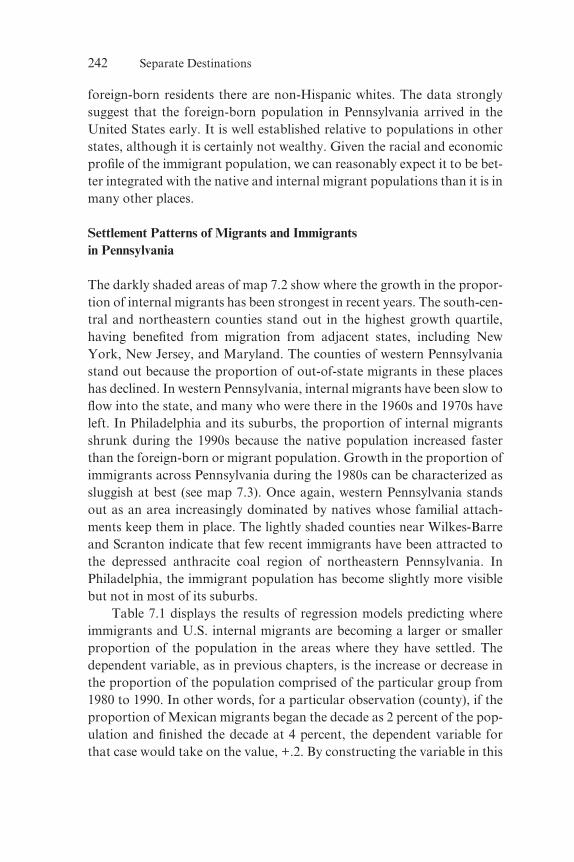
The darkly shaded areas of map 7.2 show where the growth in the propor-tion of internal migrants has been strongest in recent years. The south-cen-tral and northeastern counties stand out in the highest growth quartile,having bene‹ted from migration from adjacent states, including NewYork, New Jersey, and Maryland. The counties of western Pennsylvaniastand out because the proportion of out-of-state migrants in these placeshas declined. In western Pennsylvania, internal migrants have been slow to›ow into the state, and many who were there in the 1960s and 1970s haveleft. In Philadelphia and its suburbs, the proportion of internal migrantsshrunk during the 1990s because the native population increased fasterthan the foreign-born or migrant population. Growth in the proportion ofimmigrants across Pennsylvania during the 1980s can be characterized assluggish at best (see map 7.3). Once again, western Pennsylvania standsout as an area increasingly dominated by natives whose familial attach-ments keep them in place. The lightly shaded counties near Wilkes-Barreand Scranton indicate that few recent immigrants have been attracted tothe depressed anthracite coal region of northeastern Pennsylvania. InPhiladelphia, the immigrant population has become slightly more visiblebut not in most of its suburbs.
Table 7.1 displays the results of regression models predicting whereimmigrants and U.S. internal migrants are becoming a larger or smallerproportion of the population in the areas where they have settled. Thedependent variable, as in previous chapters, is the increase or decrease inthe proportion of the population comprised of the particular group from1980 to 1990. In other words, for a particular observation (county), if theproportion of Mexican migrants began the decade as 2 percent of the pop-ulation and ‹nished the decade at 4 percent, the dependent variable forthat case would take on the value, +.2. By constructing the variable in this
ch7.qxd 6/17/99 12:25 PM Page 242

Map 7.2. Change in the proportion of internal migrants in Pennsylvania counties, 1980–90. (Mean = .84, Moran’s I = .43)
ch7.qxd 6/17/99 12:25 PM Page 243
Map 7.3. Change in the proportion of immigrants in Pennsylvania counties, 1980–90. (Mean = –.28, Moran’s I = .19)
ch7.qxd 6/17/99 12:25 PM Page 244

TABLE 7.1. Influences on Population Concentration in Pennsylvania Counties, 1980–90
Central South U.S. African Asian European Canadian Mexican American American
Variable Migrants Immigrants Immigrants Immigrants Immigrants Immigrants Immigrants Immigrants
% 1980 .10** –1.06** .61** –.42** –.28** 1.36** –.18 .06group population (.04) (.13) (.11) (.03) (.08) (.33) (.21) (.19)
% unemployment, .24** –.004 .03* –.03** –.001 –.005 –.009 .00011980 (.10) (.003) (.01) (.01) (.002) (.006) (.006) (.004)
Change in real –.13** .003* .01* .02** –.0005 –.002 –.007* –.003median (.05) (.002) (.005) (.006) (.001) (.003) (.004) (.002)income, 1980–90
% net population .14** .0006 –.0007 .004* .0005 .002* .003** .002**change (.03) (.001) (.002) (.002) (.0004) (.001) (.001) (.001)
Population density –.0005** –.00001** .00002** .00003** .0000001 .000001 .00003** .00001**(.00008) (.000002) (.00001) (.000007) (.00001) (.000003) (.000007) (.000003)
% college students –.09** .006** –.03* .001 .003** –.003 .005** –.004**(.05) (.002) (.005) (.005) (.001) (.003) (.003) (.002)
Spatial lag .46** –.05 .22** –.18** –.03 –.31* .42 .38**(.09) (.19) (.09) (.09) (.15) (.18) (.33) (.18)
Constant –2.47 .03 –.53 .21 .014 .07 .09 .02
N 67 67 67 67 67 67 67 67R2
a .89 .67 .94 .89 .21 .34 .45 .55
Note: Spatial autoregressive model, weighted for population; income coefficients expressed in thousands of 1992 dollars; dependent variable =change in population group as a percentage of total population. See appendix A for a full description of variables.
*p < .10. **p < .05.
ch7.qxd 6/17/99 12:25 PM Page 245
manner, areas where the group population has increased do not necessar-ily register a positive value. It is important that the variable here showspositive gains for the population in question only when it has grown rela-tive to the rest of the population.
The independent variables have been selected mostly on the basis ofwhat economic and sociological theory has taught us about the reasonsmigrants and immigrants choose to settle where they do. The two princi-pal hypotheses to be tested are (1) that groups concentrate where there arefriends and family members—for example, coethnics—who can help themto gain a foothold in the new society; and (2) that groups concentratewhere the job prospects are strongest or at least in areas where unemploy-ment is most easily avoided.
The results are consistent with the notion that Asian and Mexican set-tlement patterns are most dependent upon existing coethnic communities.The areas where Asians and Mexicans are growing relative to the rest ofthe population are places where there were sizable populations of Asiansand Mexicans at the beginning of the decade. Africans, Europeans, andCanadians, on the other hand, have been shrinking as a proportion of thepopulation in areas where they have settled in the past. This is a re›ectionof both the declining proportion of immigrants from these world areas andtheir independence of coethnic enclaves.
European émigrés show some propensity to avoid increasing theirpresence in areas of high unemployment, but this is not the case with theother groups. Asians and U.S. internal migrants are a growing proportionof the population in areas that began the decade with high unemploymentrates. This is unusual for internal migrants, who generally have the kind ofinformation about local conditions that directs them to avoid areas withpoor employment prospects. Some of the strongest growth in the out-of-state population occurred in northeastern Pennsylvania along the NewYork and New Jersey borders. Some of this growth is the result of devel-opment in the Pocono Mountains in Monroe and Pike Counties east ofScranton. The reason this growth is unrelated to employment in theseareas is that northeastern Pennsylvania has not attracted as many jobseekers as it has retirees and commuters from northern New Jersey and theNew York City suburbs lured there by low-cost housing, open space,lakes, and mountains. Migration models that only consider economic con-ditions are likely to miss the important component of migration motivatedby lifestyle considerations.
Several groups are growing as a function of net population increase.
246 Separate Destinations
ch7.qxd 6/17/99 12:25 PM Page 246

These include internal migrants, Europeans, South Americans, CentralAmericans, and Mexicans. In other words, these groups are growing largereven in areas that are experiencing growth from other sources. These aresometimes, but not always, the more densely populated areas of the state,as the coef‹cients for population density show (table 7.1). Africans,Asians, Europeans, and South and Central Americans are all drawn toPennsylvania’s larger cities and suburbs. Asians increased their presence inboth Philadelphia and suburban Montgomery County. Mexicans becamea more signi‹cant presence in Berks (Reading) and Chester (suburbanPhiladelphia) Counties. Internal migrants are actually drawn to areas oflow-density development, especially Monroe, Pike, and Wayne Counties.These results make it clear that the destinations of migrants and thosewhere immigrants are concentrating are very different. The immigrantpopulation is growing larger in Pennsylvania’s urban centers and oldersuburbs. The population of out-of-state migrants is growing in rural areasof eastern Pennsylvania and in less densely populated suburbs.
Ethnic Balkanization and Naturalization in Pennsylvania
The fact that the internal migrant and immigrant populations are drawnto different areas of the state is of some consequence. Concentrated pop-ulations are much more noticeable than dispersed ones. While internalmigration is not always of suf‹cient volume in Pennsylvania to in›uencethe residential segregation of groups within counties, it is distinguishingcounties from one another, strongly suggesting that the population ofmostly white migrants from out of state, and that of immigrants, are notmixing well. The segregation accompanying increasing ethnic hetero-geneity is occurring on top of the more familiar separation of the whiteand black populations that has helped to identify Philadelphia as a citywith special interests and needs on the basis of its racial compositionalone.
Concentrated immigrant populations are slower to assimilate politi-cally than dispersed populations are, but naturalization rates also varydirectly with duration of residence in the country. Given Pennsylvania’solder stock of immigrants, the percentage of immigrants who are citizensis likely to be far higher there than in areas with more recent immigra-tion—and at 59 percent in 1990, the state’s naturalization rate is amongthe highest in the nation. Still, duration of residence is not the only impor-tant variable. Naturalization rates are a function of immigrant concentra-
Pennsylvania 247
ch7.qxd 6/17/99 12:25 PM Page 247

tion and isolation, as table A7.2 shows. In 1980, however, it is noteworthythat foreign-born concentration was associated with high naturalizationrates because the immigrant population in Pennsylvania remained pre-dominantly of European origin. These European immigrants were con-centrated in the state’s urban areas but had immigrated prior to 1970.Where more recent Hispanic and Asian immigrant populations were clus-tered, naturalization rates were much lower. Hence, the segregation ofAsian and Hispanic from white neighborhoods depressed naturalizationrates according to the 1980 census data (table A7.2). By 1990, with Euro-peans shrinking as a proportion of the immigrant population, immigrantconcentrations in Pennsylvania were associated with lower naturalizationrates. Asian and Hispanic isolation are not statistically signi‹cant in 1990because these variables are closely related to foreign-born concentration(table A7.2).
Migrants, Immigrants, and Voter Turnout inPennsylvania
Has population migration and immigration helped to politically stratifythe state? One might evaluate this by looking directly at levels of voterturnout across Pennsylvania jurisdictions. Trends and patterns of politicalparticipation have important implications for politics and policy becauseturnout ultimately determines who is elected to govern. One scholar ofurban politics has noted that there are more avenues for citizen involve-ment and participation in central cities than in suburbs or “edge cities”(Scavo 1995). This dearth of participation in local politics by suburbanresidents may have broader implications for state and national politics. Ifa much smaller fraction of the suburban than the rural electorate partici-pates in gubernatorial races, this undoubtedly gives rural areas a strongervoice in choosing statewide of‹ceholders than they would have otherwise.
Participation rates averaged across two gubernatorial elections areshown by quartile on map 7.4. Interestingly, the area of the state that hasexperienced the most population growth, suburban Philadelphia (except forDelaware County), is in the lowest turnout cohort. Other areas of growth,including Butler County outside Pittsburgh, have lower than averageturnout rates. The highest turnout areas, on the other hand, are those char-acterized by population stability or decline, including the rural northwest.
To explain these turnout patterns, table 7.2 presents a regressionanalysis of the in›uence of several demographic variables on the percent-
248 Separate Destinations
ch7.qxd 6/17/99 12:25 PM Page 248

Map 7.4. Average turnout in Pennsylvania gubernatorial elections, 1990–94. (Mean = 55.7, Moran’s I, = .33)
ch7.qxd 6/17/99 12:25 PM Page 249

TABLE 7.2. Impact of Population Mobility on Voter Turnout in Pennsylvania Counties, 1980–94
Variable 1980 1982 1990 1992 1994 Pooled 1990s
% college educated .31* –.04 –.09 .15* –.04 .01(.17) (.24) (.11) (.08) (.10) (.09)
Isolation of minorities from –.0001 –.03 –.02 .03* –.006 –.007whites (within counties) (.02) (.02) (.02) (.02) (.02) (.02)
% post-1970 immigrants –5.17** –3.75 .22 –.23 –.25 –.30(1.52) (2.20) (1.15) (.84) (.93) (.88)
% born out of state –.09 –.21** –.18** –.07 –.07 –.09*(.06) (.09) (.07) (.05) (.05) (.05)
% black –.35** .32 .10 .20a .09 .01(.14) (.22) (.21) (.14) (.15) (.09)
Population density –.001** –.001* –.001a –.001a –.0007a –.0001(.0001) (.0005) (.001) (.001) (.001) (.001)
Spatial lag .28* .04 .25* .02 .55** .61**(.17) (.16) (.15) (.16) (.14) (.10)
Presidential race .— .— .— .— .— 4.35**(1.44)
Constant 56.42 73.65 48.54 60.87 46.53 23.47
N 67 67 67 67 67 201R2
a .72 .76 .65 .26 .54 .69
Note: Spatial autoregressive model, weighted for population; dependent variable = percentage of turnout by county. See appendix A for a fulldescription of variables.
aVariables with low tolerances and high standard errors due to multicollinearity.*p < .10. **p < .05.
ch7.qxd 6/17/99 12:25 PM Page 250

age of registered voters who have participated in recent elections. My cen-tral hypothesis is that population growth from outside Pennsylvaniareduces the political participation of eligible voters given various barriersto reregistration. Control variables for education, population density, thesegregation of white from minority neighborhoods, and the percentage ofthe population that is African American are designed to evaluate whetherpopulation mobility has an impact on county-level participation oncethese other variables are added. The results show that the percentage ofthe population born out of state is negatively associated with turnout in allof the elections. This corresponds to the ‹ndings in other states, includingKentucky (chap. 5), which suggest that migrants may be slower to take aninterest in politics than long-term residents. Corresponding to this is the‹nding that the percentage of recent immigrants (those who immigratedsince 1970) is associated with lower turnout in four out of the ‹ve racesconsidered in table 7.2. In the 1980 presidential contest, for instance, a 1point increase in the percentage of recent immigrants across counties wasassociated with a 5.2 point drop in voter turnout. The key insight here isthat the exercise of social and political power by a population lags wellbehind that population’s arrival in a new place. There are considerablecosts involved in learning about the politics of a new location.
The population of college educated residents promotes turnout inpresidential elections but depresses it in gubernatorial contests. Appar-ently areas with well-educated populations such as Chester, Montgomery,and Bucks Counties in the Philadelphia suburbs are far less interested inlocal politics than in major national elections. Not coincidentally these arealso the counties with the most interstate migrants.
The black population has no consistent impact on an area’s turnout,increasing it relative to predominantly white areas in most races but drop-ping it in 1980. Black turnout in cities such as Philadelphia and Pittsburghmay depend upon the competitiveness of the contest and the mobilizationefforts of particular candidates and campaigns. Population density is neg-atively associated with turnout in all ‹ve elections. On average, urban andsuburban areas do turn out a smaller percentage of eligible voters than themore rural counties. Finally, the spatially lagged dependent variable indi-cates that turnout patterns have a regional basis in Pennsylvania thatreaches across county boundaries in the most recent elections.
These results clearly show that turnout across Pennsylvania countiesis highly variable both across the state and across election years. Still, thestate is strati‹ed in some consistent and predictable ways. In most elec-
Pennsylvania 251
ch7.qxd 6/17/99 12:25 PM Page 251
tions, urban areas do not have the representation at the polls that ruralareas do. Suburban areas with well-educated populations vary more fromelection to election, often generating higher turnout than nonsuburbancounties in presidential elections but then lagging behind the other coun-ties in off-year contests. Not coincidentally, it is the suburbs that have thehighest proportion of out-of-state migrants, who are slow to develop inter-est in local and statewide elections (Muller, Meyer, and Cybriwsky 1976).Turnout rates are occasionally cleaved along native-immigrant lines, withareas of large immigrant concentrations having lower levels of politicalparticipation than those with large native concentrations, especially in theearly 1980s.
Much has been made of the rise of suburban power in American poli-tics, and rightly so, for a plurality of voters in most states now live in sub-urban communities. For purposes of legislative apportionment, it is not atall trivial that the membership of Congress and the state legislatures ismore suburban than it has ever been. But in statewide elections suburbanpower may not be fully realized due to the transient nature of the suburbsand the reluctance of well-educated migrants to involve themselves in stateand local affairs. A further factor may also be relevant to the Pennsylvaniacase in particular. Several recent gubernatorial contests have been won bypopular politicians who were well ahead in the polls in the weeks beforeelection day. The perception that a race is not competitive gives voters theimpression that their votes will make little difference to the outcome.Many suburban voters may respond by skipping the consensus contestssuch as the 1990 reelection of popular governor Bob Casey.
Migrants, Immigrants, and Party Regularity in Pennsylvania
Areas of heavy in-migration are more likely to be irregular in their politi-cal behavior than those with highly stable populations. By party irregular-ity in this context, I mean the extent to which party registration ‹gurespredict actual balloting. Those counties where there is little correspon-dence between the two are said to be irregular. Which counties might beirregular can be predicted based on studies done at the individual level ofanalysis (Brown 1988). Political attitudes and party af‹liations oftenchange with migration as people sort out how traditional cues apply innovel, unfamiliar settings. The percentage of migrants from out of state ishighly associated with independent party registration in Pennsylvania
252 Separate Destinations
ch7.qxd 6/17/99 12:25 PM Page 252

(table not reported). Counties with more nonnatives, whether immigrantsor internal migrants, should be more irregular in their behavior, oftendeparting from party registration ‹gures when actual ballots are cast.
Alternatively, counties may be irregular because sizable proportionsof the registered electorate simply fail to show up at the polls. If 35 percentof the county is registered Democratic and 35 percent Republican, butonly half of the registered Democrats vote while all the Republicans do,the difference in turnout will cause the county to be far more Republicanthan its registration ‹gures would predict. The counties with the lowestturnout are most likely to show wide gaps between party balance and vot-ing behavior. Since higher proportions of foreign-born residents and inter-nal migrants are associated with low turnout, we would also expect thesevariables to be associated with party irregularity.
In fact, the results for Pennsylvania are mixed and vary from electionto election (see table 7.3). The proportion of recent foreign-born residentsis associated with party irregularity in most elections, but the effect is notalways statistically signi‹cant. The proportion of out-of-state migrantsseems to promote party regularity in most elections but in the 1990s has nostatistically signi‹cant impact when other variables are included. This iscontrary to the ‹ndings at the individual level, and for other states, whereinterstate migrants were positively associated with departures from parti-sanship. In Pennsylvania, however, the tendency for cross-state migrationto generate party regularity must be understood in the context of the irreg-ular partisanship of many rural Democrats, who often vote for Republi-cans. In western Pennsylvania, in particular, Republican candidates oftendo far better than registration ‹gures would predict. In 1982, incumbentgovernor Richard Thornburgh, a Republican, won 48 percent of the West-moreland County vote, though Republican registration was only at 29.1percent. Thornburgh’s opponent that year was a liberal congressman fromeastern Pennsylvania, and eastern politicians are often eyed suspiciouslyby westerners. While the voting patterns of rural counties like Westmore-land are not easily predicted by their balance of party registrants, somecounties did follow their registration patterns in the early 1980s. One ofthese is Chester County, in suburban Philadelphia, where high in-migra-tion, Republican registration, and Republican voting coincide. Adjacentto Chester are Delaware and Montgomery Counties, also strongly Repub-lican and quite regular in their behavior in spite of having a large popula-tion of nonnatives. Two things may account for the close alignment ofparty registration and voting in suburban Philadelphia. First, there is the
Pennsylvania 253
ch7.qxd 6/17/99 12:25 PM Page 253

TABLE 7.3. Similarity of Party Registration to Party Voting in Pennsylvania Counties, 1980–94
Variable 1980 1982 1990 1992 1994 Pooled 1990s
% college educated –.02 –.43 –.18 .40** –.06 –.31*(.37) (.38) (.30) (.18) (.16) (.17)
% born out of state –.24* –.33** .02 –.02 –.06 .06(.13) (.16) (.18) (.11) (.09) (.10)
% post-1970 immigrants –.64 –1.96a 2.94a .39a .97a 5.13**(3.73) (3.61) (2.90) (1.87) (1.68) (1.73)
% black .07a 1.19** –.67a –.58a .14a –.28(.29) (.30) (.47) (.31) (.24) (.27)
Population density .0004 –.003** .0005a .0008a –.001a –.001(.001) (.001) (.002) (.001) (.001) (.001)
% turnout –.03 –.18 .23 .14 –.13 .19(.31) (.23) (.33) (.29) (.21) (.15)
Spatial lag .50** .72** .69** .70** 1.20** .14(.20) (.18) (.14) (.19) (.13) (.10)
Presidential race .— .— .— .— .— –6.81**(2.28)
Constant 11.03 20.91 –6.75 –12.13 6.89 3.62
N 67 67 67 67 67 201R2
a .16 .42 .42 .41 .64 .21
Note: Spatial autoregressive model, weighted for population; dependent variable = Abs (% Republican vote – % Republican registration); high pos-itive values indicate counties where voting differed from registration. See appendix A for a full description of variables.
aVariables with low tolerances and high standard errors due to multicollinearity.*p < .10. **p < .05.
ch7.qxd 6/17/99 12:25 PM Page 254

“anticity” vote. The Philadelphia suburbs are more cohesively Republicanthan they might otherwise be because Philadelphia is so loyally Democra-tic. Second, the Philadelphia suburbs are known for being tightly orga-nized and having strong party machines. This ensures a stronger measureof party discipline than one might ‹nd in a more rural Republican countywhere high costs prohibit the effective organization of a more dispersedpopulation.
The inconsistent signs on the coef‹cients in table 7.3 for variables suchas population density and percentage black may be due to multicollinear-ity—densely populated counties also contain large black populations. Butthe inconsistency of direction may have a more substantive meaning thatpoints to the competitiveness of elections. In 1990 and 1982, both incum-bents were considered easy candidates for reelection. The 1994 election,though, was the most competitive statewide governor’s race in recentmemory. Local patterns of turnout and party regularity are not as pre-dictably strati‹ed in Pennsylvania as they are in states where underlyingdemographic characteristics explain these outcomes independent of theparticulars of a given election year. In other chapters, I have shown thatthe differences in turnout and party regularity usually hinge upon the pro-portion of nonnatives in an area and often upon the education and racialcomposition of the local population. In Pennsylvania, however, the rolethese factors play in distinguishing one place from another may dependupon the competitiveness of the election. In close elections, when mobi-lization and party loyalty count most, the state is more cleaved by regionthan in elections where strong incumbents have secured consensus behindtheir candidacy. Proof of this lies in the size and signi‹cance of the spa-tially lagged dependent variable for 1994 in tables 7.2 and 7.3. The 1994election was the closest gubernatorial race in recent memory. For bothturnout and party regularity, positive spatial dependency is stronger in1994 than any other year, indicating that regional balkanization is morepronounced in competitive elections than in noncompetitive ones.
Changes in Party Registration in Pennsylvania
In previous chapters, I have repeatedly argued that growth in the popula-tion of U.S. internal migrants stimulates growth in the share of Republi-can registrants. Prima facie evidence for the connection between the twoappears on map 7.5, where the shading bears a striking resemblance to thepatterns of population growth depicted on map 7.1. Economically
Pennsylvania 255
ch7.qxd 6/17/99 12:25 PM Page 255

Map 7.5. Change in the proportion of Republican registrants in Pennsylvania counties, 1980–90. (Mean = .80, Moran’s I = .37)
ch7.qxd 6/17/99 12:25 PM Page 256

depressed areas have not been kind to the GOP, as we see in the lightlyshaded regions in western Pennsylvania (map 7.5).
In the Pennsylvania case, Republican growth is associated withincreases in the out-of-state population in both decades (table 7.4). Forevery percentage point of growth in the proportion of internal migrants,Republican registration growth moves up half a point during the 1970sand by .30 during the 1980s. Growth in the proportion of foreign-born res-idents is also associated with Republican growth in the 1970s and 1980s,re›ecting the suburbanization of the immigrant population. It is notewor-thy that increases in the proportion of foreign-born residents are associ-ated with Republican growth in both decades. The places where Republi-cans seem to be gaining in the face of immigrant growth are in thesoutheastern Pennsylvania counties (York, Adams, and Lancaster) andseveral directly north of Philadelphia. This is no indication, of course, that
Pennsylvania 257
TABLE 7.4. Impact of Population Mobility on Changes in Republican PartyRegistration in Pennsylvania Counties, 1970–80, 1980–90
Variable 1970–80 1980–90
% born out of state, 1970 (1980) –.13* .03(.08) (.07)
Change in % born out of state .46** .30**(.22) (.14)
% foreign born, 1970 (1980) –.19 –.10(.35) (.28)
Change in % foreign born 2.85** 3.02**(.77) (.71)
% Republican registrants, 1970 (1980) –.19** –.05**(.03) (.02)
Population density –.001** .0003**(.00004) (.0002)
Spatial lag –.48** .56**(.18) (.15)
Constant 4.66 3.72
N 67 67R2
a .78 .68
Note: Spatial autoregressive model, weighted for population; dependent variable = changein Republican Party registration. See appendix A for a full description of variables.
aVariables with low tolerances and high standard errors due to multicollinearity.*p < .10. **p < .05.
ch7.qxd 6/17/99 12:25 PM Page 257

the foreign born are necessarily registering and voting Republican. Manyof the immigrants moving to such places are educated and skilled and havesimply found their way to a better life in suburbia along with much of thenative-born population. Suburbia’s GOP orientation is coincidental totheir arrival.
Much of the partisan change in Pennsylvania is directly related todeindustrialization. In chapter 1, I cited the evidence that Republicans areamong the ‹rst to leave depressed areas. Republicans, therefore, lose reg-istrants in economic hard times due to attrition. The results in table 7.4 areconsistent with this explanation. In the 1970s, places of greater populationdensity suffered heavy GOP losses. Areas that were strongly Republican in1970 lost GOP strength from 1970 to 1980 and again from 1980 to 1990.Many of these losses occurred in areas where unemployment hit hardest,forcing the able bodied and well educated to move out. During the 1980s,Republicans lost ‹ve points to other parties in Armstrong County nearPittsburgh, and similar losses were incurred in western jurisdictions thatwere affected by the collapse of the steel industry.
Partisan change shows a pattern of negative spatial dependency dur-ing the 1970s, indicating that growth in GOP registration in a particularplace was negatively related to growth in GOP registration in adjacentareas (see table 7.4; see also appendix B). Such a pattern of spatial cluster-ing is consistent with the political development of suburban counties sur-rounding Pittsburgh and Philadelphia. At the same time that the state’slargest cities are losing Republican registrants, the suburbs are gainingthem. Hence, positive values for one observation are associated with neg-ative values for geographically proximate observations. In the 1980s,though, the coef‹cient for the spatially lagged dependent variable in table7.4 shows positive spatial dependency. This pattern indicates that Repub-lican growth is occurring in “county clusters” or entire subsections of thestate, independent of county boundaries or the redistribution of popula-tion between urban and suburban counties.
Pennsylvania’s slow growth masks changes going on at the countylevel, which altered the balance of party registrants during the 1980s andearly 1990s. Eastern Pennsylvania, in particular, has weathered dif‹cultrecessionary times to come out on top. Suburban Philadelphia has seenboth population growth and Republican growth due to an in›ux ofmigrants from other states. Western Pennsylvania, on the other hand, hasexperienced population decline and Republican losses relative to those of
258 Separate Destinations
ch7.qxd 6/17/99 12:25 PM Page 258

other parties. Eastern Pennsylvania’s restructured postindustrial econ-omy, with its burgeoning share of white collar jobs in service industriesand high technology manufacturing, is an especially suitable foundationfor building a Republican-dominant politics. Western Pennsylvania still‹nds many of its interests best represented by Democrats.
The instrument for the economic balkanization of the state has beenthe uneven development of postindustrial enterprise. This uneven devel-opment has perpetuated, and to a great extent exacerbated, the separa-tion of the state’s population into two regions, east and west. The growthof Philadelphia’s suburbs has been the result of in-migration from bothother states and other countries. It is highly doubtful, of course, thatmany of the immigrants are naturalizing and registering as Republicans.The ‹nding in table 7.4 suggesting that growth in the foreign-born popu-lation is closely linked to Republican growth could also be due to thenative reaction to the growing number of immigrants in some Pennsylva-nia communities. Alternatively, immigration to an area is often a sign ofan expanding economy. Immigrants are no less smart than nativemigrants. If they are going to the trouble to relocate, they want to settlein a place where there are economic opportunities. Coincidentally,expanding economies that are drawing population from all sources areoften the places where the Republican share of the electorate is growingmost rapidly. Democrats, on the other hand, gain most from immobil-ity—from those who are left behind—which is one reason why Democ-rats have not lost their hold on the most deindustrialized and depopu-lated regions of the state.
Ethnicity and Political Behavior at the Individual Level
The aggregate data examined up to this point have revealed some interest-ing patterns in the Keystone State’s recent development. We know thatAsians and Mexicans are becoming more noticeable and concentrated inthe areas where they have settled (table 7.1). There is also the importantfact that recent statewide gubernatorial races have not always been com-petitive contests. Long-established generalizations in political science linkturnout levels to the competitiveness of an election. Having added thatimportant caveat, we have seen that out-of-state and foreign-born popula-tions are associated with lower turnout in many major elections and thatparty regularity is higher in suburban Philadelphia than in other areas of
Pennsylvania 259
ch7.qxd 6/17/99 12:25 PM Page 259

the state. We have also seen that growth in the migrant and immigrantpopulations is linked to Republican growth. The inevitable ambiguities ofecological data do not allow us to conclude that the relationships exam-ined in tables 7.2, 7.3, and 7.4 exist at the individual level. Drawing uponthe statistical technique designed by Gary King (1997) to provide maxi-mally descriptive individual level information from aggregate data, I esti-mated the proportion of blacks and whites who registered Republican for1990, 1992, and 1994, based on county level observations of Republicanregistration and racial/ethnic composition. The proportion of white votersregistering as Republicans hovered around 48 to 49 percent for all threeyears. Estimates of the proportion of the black population registered withthe GOP were considerably lower, as we would expect them to be, but›uctuated more from presidential to gubernatorial election years: 24 per-cent for 1990, 6 percent for 1992, and 15 percent for 1994. Estimates forHispanics and Asians showed greater Republican registration than amongblacks, but less support for Republicans than among whites. The estimatesfor Asians and Hispanics, while clearly plausible, were not very precise dueto severe aggregation bias in the data. State-level polling data may provideadditional insight into the validity of inferences made at the aggregatelevel, especially on the question of whether ethnic groups in the state iden-tify with the Republican or Democratic Party.
Whites are about evenly split between the parties, blacks are pre-dictably Democratic, and Hispanics are, surprisingly, more Republicanthan in many other states, including California (see table 7.5; for the Cali-fornia comparison, see table 2.5). In 1994, a majority of Hispanic respon-dents reported that they were independents. Asians, on the other hand,were highly Republican in the 1994 contest. Only 10 percent of Pennsylva-nia’s Asian population identi‹ed with the Democrats that year, comparedto 58 percent in 1990. While the small numbers of Asians and Hispanicssampled are responsible for the volatility of these ‹gures, it is also possiblethat Republicans do gain from the kind of established older immigrantsone is likely to ‹nd in Pennsylvania. Philadelphia, for instance, showsstronger black versus white cleavages in voting behavior than any otherarea or city in the state. Philadelphia’s nonblack minorities (Asians andHispanics) are as likely to say they are independent as Democrat. Perhapsthis is because the Democratic Party in Philadelphia is so dependent uponthe majority black community for support that it has no incentive to reachout to the much smaller Hispanic and Asian communities. In Pittsburgh,where the black community is not nearly as in›uential, Hispanics are far
260 Separate Destinations
ch7.qxd 6/17/99 12:25 PM Page 260

more likely to report that they are Democrats. Asians, however, are morelikely to be Republicans than Democrats in western Pennsylvania.
The patterns of party regularity described in the county-level analysisdo have some basis in the traits of individual voters. Survey data revealthat Philadelphia’s suburban voters were more consistent in their parti-sanship in the 1994 election than voters in the city proper, and more con-sistent than in Pittsburgh. That the suburbs should show such regularity issurprising given that whites are far more likely than ethnics to vote in amanner inconsistent with partisanship. But in highly polarized elections‹erce competition enforces party regularity. Once again, the extent towhich the state is geographically strati‹ed into high and low turnout areasseems to depend crucially on the competition for given of‹ces.
Political Change and the Internal Composition ofPennsylvania Counties
Several of Pennsylvania’s counties are worth close scrutiny because theypresent cases different from others in this book. None of the other stateshave experienced the kind of economic restructuring that has occurred inPennsylvania. In a previous work, I argued that deindustrialization has
Pennsylvania 261
TABLE 7.5. Party Identification by Race/Ethnicity in Pennsylvania Elections,1990–94
Race/Ethnic Group Year Democrat Independent Republican
White 1990 42.4 20.6 37.01992 40.5 19.8 39.61994 35.2 21.0 43.7
Black 1990 78.1 14.6 7.31992 75.5 20.2 4.31994 80.6 15.2 4.2
Hispanic 1990 37.5 12.5 50.01992 21.1 34.0 44.91994 20.7 54.9 24.4
Asian 1990 58.3 25.0 16.71992 38.2 12.3 49.51994 10.3 27.6 67.1
Source: Voter Research and Surveys, General Election Exit Polls, 1990–94 (weighteddata).
ch7.qxd 6/17/99 12:25 PM Page 261

changed the electoral foundations of the state, contributing to a less pre-dictably divided electorate than existed in the past and thereby generatinga more candidate-centered politics (Gimpel 1996). Here I have posed aslightly different question: how the population changes accompanying theindustrial restructuring of Pennsylvania have altered the social and politi-cal composition of counties, cities, and regions.
As in Florida and the other states I have studied, political change inPennsylvania is related to demographic changes within the state. Of thevarious characteristics of an area that are relevant to politics, I havefocused on patterns of ethnic and racial segregation. Spatially isolatedminority groups practice a different kind of politics than spatially inte-grated ones. Isolated minorities are less likely to participate than moreintegrated groups, and they are more likely to practice a distinctivelygroup-centered politics when they do get involved. Politicians from thesecommunities have dif‹culty not practicing a racial or ethnic style of poli-tics, for this is what is most likely to get them elected. While a group-cen-tered politics may succeed in securing a few ethnically held seats in a city,state, or national legislature, these candidates usually have trouble movingany further because the race-based rhetoric that resonates so well in iso-lated communities turns off the broader majority. An additional perversepolitical effect of minority isolation is the election of electorally safeincumbents who rarely have to fear retribution at the polls for bad behav-ior. Finally, another noticeable effect of the isolation of minorities hasbeen their inactivity in broad-based Democratic party-building efforts andthe consequent strengthening of Republican prospects. But what of Penn-sylvania? Is it any different?
Pennsylvania’s patterns of ethnic and residential segregation are simi-lar to those of the other states we have examined. The dissimilarity indexin table 7.6 shows that blacks are the most spatially isolated minority pop-ulation relative to whites (for a de‹nition of the index, see chap. 2, n. 1). In1990, nearly 80 percent of blacks would have had to move for them to beevenly distributed across the state’s 3,166 census tracts. The degree of seg-regation has hardly changed since 1980. As in other states, Hispanics arethe second most segregated population, more highly segregated than inKentucky (chap. 5). Asians are the least segregated, although, interest-ingly, they are more highly segregated in Pennsylvania than in Florida(chap. 6).
The counties evaluated in table 7.6 run a wide gamut but do not nec-essarily represent the experience and composition of all areas in the state.
262 Separate Destinations
ch7.qxd 6/17/99 12:25 PM Page 262

TABLE 7.6. Index of Dissimilarity for the Black, Asian, and Hispanic Populations Relative to Whites in Four PennsylvaniaCounties, 1980 and 1990, by Census Tract
Pennsylvania Allegheny Adams Chester Erie
Variable 1980 1990 1980 1990 1980 1990 1980 1990 1980 1990
Asians .46 .51 .44 .48 .31 .26 .32 .32 .37 .37Blacks .81 .79 .76 .74 .38 .43 .52 .50 .65 .65Hispanics .58 .61 .29 .29 .33 .32 .51 .47 .38 .49
N 3,166 3,166 499 499 19 19 113 113 69 69
Source: U.S. Census 1990, and author’s calculations.Note: Figures represent the percentage of each group that would have to move in order for the group to be evenly distributed across census tracts
in the county.
ch7.qxd 6/17/99 12:25 PM Page 263

In none of these jurisdictions is the population of recent immigrantsmuch of a force. Pennsylvania’s immigrant population is small, and thenumber of Asian immigrants is shrinking relative to the native popula-tion in Adams and Erie Counties. Hispanic immigrants increased as aproportion of the population in all four counties from 1980 to 1990.But in spite of their small numbers relative to the white population peo-ple of color are segregated to an extraordinary degree across all fourplaces.
Adams County (Gettysburg) sits in the rural south-central regionalong the Maryland border. Never an area of heavy industry, between1980 and 1992 this county experienced strong growth by Pennsylvaniastandards, moving from 68,000 to 81,000, a 19 percent increase. Republi-cans have also gained considerable ground, picking up about four pointson Democrats and third parties during the 1980s. Adams shows compara-tively low levels of racial segregation until one recognizes just how smallthe minority population is. With a black population of only 1 percent, lessthan 1 percent Asians, and about 2 percent Hispanics, it is dif‹cult toimagine that there could be active racial exclusion. Nevertheless, accord-ing to the ‹gures in table 7.6, 43 percent of the black population wouldhave to move for this group to be evenly distributed across the nineteentracts in the county.
Allegheny County is comprised of Pittsburgh and most of its suburbs,including McKeesport and Monroeville. Home to many Polish and Italianimmigrants, as well as black migrants from the South and their descen-dants, Allegheny is a particularly good place to examine patterns of segre-gation in an urban area af›icted with signi‹cant population losses. Eightpercent fewer people lived there in 1992 than in 1980. The ‹gures in table7.6 show that Allegheny County’s Asian and black populations are nearlyas isolated as in the state itself. Hispanics, on the other hand, are consid-erably less segregated from whites in the Pittsburgh area than they arestatewide. In spite of the segregation, Democrats have done well here,probably because the ‹rst to leave the area were the most skilled, educated,and mobile of those laid off.
Chester County in the Philadelphia suburbs (see map 7.1) has experi-enced rapid economic growth. It has one of the largest non-Pennsylvanianpopulations in the state, as it has drawn many white collar workers fromDelaware. Republicans gained some ground in Chester, though only amodest 1.3 percent, from 1980 to 1990. The population is only 6 percentblack, but these blacks are more likely to be middle class than poor so
264 Separate Destinations
ch7.qxd 6/17/99 12:25 PM Page 264

there is less segregation between Caucasians and other races than is foundin either Allegheny or poorer communities like Erie.
Finally, Erie County is in the northwest corner of the state, adjacentto New York and Ohio, bordering the shores of Lake Erie. Unlike Pitts-burgh, Erie has experienced some growth since midcentury, but nearly allof that growth has occurred in the county rather than the city of Erie.From 1980 to 1990, the county lost less than 1 percent of its population,which stood at 280,000 by 1992. The county’s black population is small (5percent) but highly concentrated. Table 7.6 shows that two-thirds of theblack population would be required to move for their numbers to beevenly distributed across the county’s sixty-nine tracts. Hispanics are moresegregated here than in Allegheny County, a surprising ‹nding given thatthey only comprised 1 percent of the population in 1990. Republicans havedone well in recent elections but have hardly improved their registration.From 1980 to 1990, there was a minuscule .1 percent increase in the shareof GOP registrants. Erie County appears to violate the generalization thatracially segregated populations bene‹t Republicans. Like other cities,though, the density of the population probably lessens the impact of spa-tial isolation on political activity.
Adams CountyThe Adams County economy is based on agriculture and tourism. Twentythousand acres of apple and peach orchards cover the northern and west-ern reaches of the county. Gettysburg is adjacent to the famous Civil Warbattle‹eld, now a national park. Growth has become an increasingly divi-sive issue, as commuters from the nearby cities of Baltimore, Washington,D.C., and Harrisburg have sought to escape urban life into more pastoralsettings. “People like the rural life and will commute incredible distancesto live here,” said one local planner. Pennsylvania does not tax pensionincome, so elderly retirees from Maryland are also attracted to the area.Natives resent that Maryland commuters, with incomes much higher thanthose of the average Pennsylvania resident, have driven prices up andforced the natives into a kind of second-class status. The nonagriculturalsegment of the local economy is based on low-paying service sector jobsrelated to tourism, restaurant and hotel businesses mostly. In averageannual wages, Adams County ranked among the lowest in the state in theearly 1990s.
The new arrivals, often moving from more developed suburban areas,are accustomed to a wide range of public services. This puts pressure on
Pennsylvania 265
ch7.qxd 6/17/99 12:25 PM Page 265

local governments to raise taxes to meet new demands. Natives, often liv-ing on ‹xed incomes or employed in low-paying service sector jobs, cannotafford the taxes to support economic development. Still, the newcomershave been slow to involve themselves in Pennsylvania politics, and nativescontrol most political of‹ces. Local politicians proudly distinguish them-selves from newcomers by proclaiming that they were born in the county.
The natives also look to the east and see the crowding of LancasterCounty. They are fearful that this pattern of change is in their future.“People are not interested in a city moving here,” said one local, himself aCalifornia transplant (Eshleman 1991). Naturally these fears have trans-lated into pressure for local growth control. The integrity of the Gettys-burg battle‹eld itself has been at stake in some recent quarrels aboutwhether to build a shopping mall that abuts the park. Development haswon some of these battles. Route 30, the major east-west thoroughfare,has been described as overburdened, a “homogenized, stripped-outmelange of 20th century motel and fast-food culture” (Goldstein 1991).
The areas of migrant settlement are shown on map 7.6. Even in thissparsely populated area, one can see that immigrant and migrant settle-ments are in separate parts of the county. The area is home to a signi‹cantpopulation of Mexican migrant workers who pick apples on farms northof Gettysburg. Haitians are a smaller but still signi‹cant portion of themigrant work force. Given the location of the orchards, “upper Adams” iswhere most of the Hispanic population is concentrated. South-centralPennsylvania has long had the lowest unemployment rate in the state, so itis not surprising that the migrant laborers have been a presence here sincethe 1960s. Even family-owned farms hire them. Long-time Anglo nativesdescribe the migrant workers as “good citizens. They work, raise theirfamilies, and do not go on welfare.” They are also politically inactive and“stick to themselves. The Catholic church is their only gathering point.”They are “not involved in criminal activity like minorities elsewhere,” saidone local reporter.
The model of partisan change in table 7.4 suggested that growth in theimmigrant population is associated with growth in the Republican shareof registrants. In the case of Adams County, however, there is no directcausal relationship at the individual level. Most Hispanics in Adams donot vote, and many are not even citizens. Hispanics are drawn to AdamsCounty because of economic opportunities that are not available in thedeclining areas of the state. This economic growth also happens to beattracting an increasing number of Republican migrants from Maryland
266 Separate Destinations
ch7.qxd 6/17/99 12:25 PM Page 266

Map 7.6. Internal migrant and immigrant magnets in Adams County, Pennsylvania, 1990
ch7.qxd 6/17/99 12:25 PM Page 267
and other states. Ethnic balkanization is on its way because Hispanics aresettling down to raise families in rural Pennsylvania, only occasionallyreturning to their hometowns in Mexico.
The mechanism of the spatial segregation of the Hispanic populationin Adams County is the location of jobs. It makes little sense for Hispanicmigrants to commute to the apple farms when there is housing close byand commuting costs are high. Hispanic families (of all races) made only65 percent of what non-Hispanic white families made in 1990. Ethnic ten-sion is not much of an issue. Blacks constituted only 1 percent of thecounty population in 1990. There are few Asians, although Indians in thehospitality and convenience store businesses are a noticeable presence.Adams County is an excellent example of a case in which the isolation ofthe Hispanic population has hindered its assimilation and rendered itpolitically powerless. Like communities of immigrant agricultural laborersin California, Colorado, Florida, and other states, rural isolation has a farmore adverse impact on participation in civic life than urban isolation has.While there are no signs of exploitation of Hispanics by farmers that com-pares to what is found in the meatpacking industry in Kansas and Col-orado, the Latino population is vulnerable and excessively dependentupon the benevolence of their employers.
Pittsburgh and Allegheny CountyAllegheny County’s population loss can be attributed to younger middleand upper income out-migrants and semiskilled workers who ‹nally real-ized that the old blue collar manufacturing jobs would not return. “You‹gured out the old jobs weren’t going to come back when they started tear-ing down the mills in the early 1980s,” said one local reporter. This left alarge population of older residents, and a demoralized underclass, along-side established older wealth. By the early 1990s, Pittsburgh had made acomeback, bringing in high technology and service industries for the welleducated (Stokes 1994). For the unskilled, the new industries offered lowerpaying nonunion employment, but this was better than nothing. Pitts-burgh’s effort to become the next Silicon Valley has been aided by the pres-ence of excellent universities, but public school enrollment has declined,indicating that few people with families have been attracted to the area.
The Mon Valley, southeast of Pittsburgh, has not fared as well as thecity itself. Along the Monongahela River lie the blighted, bombed-outremains of once thriving steel towns: Homestead, McKeesport, Duquesne,and Clairton (Serrin 1993; see map 7.7). In the early 1980s, 150,000 jobs
268 Separate Destinations
ch7.qxd 6/17/99 12:25 PM Page 268

Map 7.7. Internal migrant and immigrant magnets in Allegheny County, Pennsylvania, 1990
ch7.qxd 6/17/99 12:25 PM Page 269
were permanently lost in this area. A few marginal businesses survive,mostly because the buildings they are in would be empty otherwise and areowned by elderly proprietors who have nothing else to do (Marsh 1987).With the sudden loss of the industrial tax base, these communities havebeen hard pressed to pay for basic public services. The remaining popula-tion consists mainly of two groups: the elderly, living on ‹xed incomes;and the poor, who are usually dependent on public assistance (Gittell1992). The neighborhoods in these depressed areas are in a long-term stateof decline typi‹ed by abandoned and dilapidated housing, drug activity,and crime. William Julius Wilson has found the same neighborhooddynamics at work in Chicago associated with depopulation and neighbor-hood disinvestment (1996). The Mon Valley has experienced no popula-tion growth, a situation that has aided Democrats, as the elderly and blackpopulations are highly loyal. When asked why more young people do notleave, one local observer explained that “many residents do not think itwould be better anywhere else. There is a lack of hope.” Nor are there theresources in this population to pack up and go. Then there is the familiargap in depressed areas everywhere between what a place provides andwhat it means (Marsh 1987). Some endure the social and economic hard-ship of remaining in a poor community because they have strong psychicties to their neighborhood, church, family, and friends (Wilson 1996).
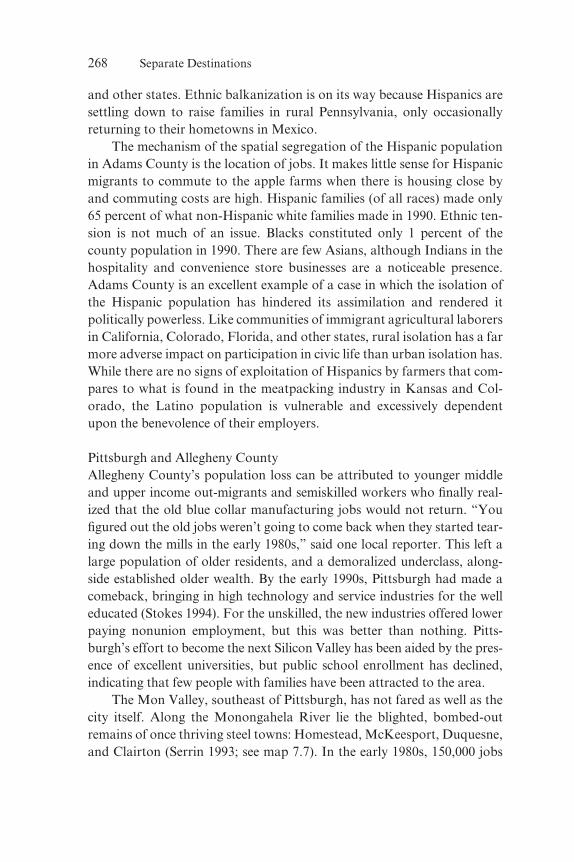
The wave of immigrants arriving since 1968 has largely bypassedPittsburgh. Hispanic immigrants in search of work would not ‹nd it in adepressed economy. The Latino population is large enough, however(8,000 in 1990), to support a Spanish language newspaper. Map 7.7 showsthat the areas of immigrant concentration tend to be in the poorer sectionssouth of Pittsburgh rather than in the wealthier northern tracts. Areaswhere migrants and immigrants have mixed include the tracts on the eastside of Pittsburgh (darkly shaded areas in map 7.7). Asians, particularlyChinese, Filipino, and Indian immigrants, have settled in the city’s easterntracts near Carnegie-Mellon University and the University of Pittsburghin the neighborhoods of Gar‹eld and Lawrenceville as well as in the east-ern suburbs of Wilkinsburg and Monroeville. In the suburbs, Asians aremore likely to be professionals than small business owners, and their levelof education has facilitated their assimilation. Some of the brightest stu-dents in the Monroeville schools are from Vietnamese and Indian families.Since Asians comprised only 1 percent of the population in the 1990 cen-sus, their high degree of segregation is somewhat surprising, but it can beexplained by the location of the universities and the tendency for Asians to
270 Separate Destinations
ch7.qxd 6/17/99 12:25 PM Page 270

chain migrate. Ethnic tensions between Asians and non-Asians are report-edly rare.
Many blacks came to the Pittsburgh area to take jobs in the steel millsas part of the “great migration” of the 1920s and 1930s (Gottlieb 1987).Their children and grandchildren have become the victims of deindustrial-ization. The black population is spatially segregated from the white popu-lation in both Pittsburgh and the Mon Valley towns. The black populationin the valley is extremely poor, with 40 percent of the families living belowthe poverty line in 1990, compared to 14 to 15 percent for whites. In Pitts-burgh, the only difference is that there are fewer white poor, so the incomedisparity is even greater in the city than in the suburbs. In the middle classeastern suburbs, such as Monroeville and Wilkinsburg, blacks have faredbetter. There have been isolated instances of racial intimidation but alsoconcerted efforts to overcome this tension.
The mechanism of racial segregation is in part the county’s unusualtopography of hills, valleys, and rivers, which isolate neighborhoods inunique ways (Glasco 1989; Bodnar, Simon, and Weber 1982). But segre-gation has also been the product of industrial decline and differencesbetween white and black birthrates. White, middle income neighborhoodswere far better able to weather deindustrializing trends and have been the‹rst to bounce back. In addition, more whites than blacks have decided toleave the county (and often the state) for better opportunities elsewhere.This has left the black population in some of the most impoverished andblighted areas in Pittsburgh and southwestern Pennsylvania. As the ‹guresin table 7.6 show, the level of residential segregation of the black commu-nity has remained almost the same from 1980 to 1990. High birthratesamong minorities and the out-migration of white families have created ahighly segregated school system in which black children are a much largerproportion of the school population than blacks are in the general popu-lation. Population losses contribute to segregation because low-incomeminority groups are less mobile than wealthier whites.
Blacks are a minority in the city and the county, and nearly all of themvote Democratic. Pittsburgh is such an overwhelmingly Democratic townthat the loyalty of the black wards to the Democratic Party has marginal-ized black in›uence. A recent move from at-large to district-level citycouncil elections has helped elect several black council members who oth-erwise would not have been elected. But in countywide contests whiteDemocratic politicians have been known to boast of not needing the blackvote to win local elections. Local observers suggested that the black com-
Pennsylvania 271
ch7.qxd 6/17/99 12:25 PM Page 271

munity has been af›icted with weak and inept leadership co-opted byDemocratic machine politics. Ward leaders have a strong incentive to pre-vent aspiring and capable black leaders from gaining too much power.
By the 1990s, the Democratic Party machinery had ossi‹ed. Youngerpeople were not drawn into the party leadership. As the suburbs havegrown, and the city has declined, Republicans have sometimes takenadvantage of Democratic factionalism. In the mid-1990s, the AlleghenyCounty Commission was taken over by Republicans for the ‹rst time dueto a feud within Democratic ranks. Party registration has remained heav-ily Democratic, and Republicans were still losing registrants as of the1990s. Independent registration increased to 6 percent in 1994, up aboutone point since 1980, but there has been no massive abandonment of tra-ditional party ties. Instead, party registration is stable because the popula-tion has not been replaced. The only changes are due to the attrition ofvoters, not to conversion or the addition of sizable new blocs.
The population trends in Allegheny County, its decline, the relativeabsence of immigrants, and the hopelessness of its unemployed populationall speak to its isolation, from both the rest of the state and the nation. Thereputable high-technology education centers in Pittsburgh have helped sta-bilize the area’s economy, but the city is “just not on people’s screens whenthey’re looking for information about business markets. Not growing is areal clear signal from the market that you’re not an attractive place to live,”reported one Post-Gazette story in the mid-1990s (Heuck 1996). Rumors ofPittsburgh’s recovery have been highly exaggerated. This area’s long-termdecline is favorable only to prolonged Democratic dominance.
Chester CountyChester County is a state away from Pittsburgh and worlds away in eco-nomic terms. Population growth started in the early 1970s, as Chesterproved to be a second stop in the suburbanization of Philadelphia. Out-migrants from the city had ‹rst settled in Delaware County, but asDelaware became crowded the next move was to Chester. These are resi-dential suburbs, then, where more people commute out to work toDelaware County, Philadelphia, and the state of Delaware than commutein. The population of newcomers consists mostly of af›uent young familieswho, according to one long-time native, “want to convert Chester into thenew Main Line. They want towns full of little shops that smell like lavenderand serve cappuccino. They are obsessed with safety and crime. They locktheir doors, don’t allow their kids to go outside and expect someone to be
272 Separate Destinations
ch7.qxd 6/17/99 12:25 PM Page 272
watching their children every minute.” Wilmington, Delaware, started abusing program to integrate its schools in the late 1970s. Fearing the effectsof integration, many white families ›ed across the border into ChesterCounty. The new arrivals who have suburbanized Chester are distinct fromthe native population, which knew the county before the in›ux and grew upsecure and comfortable in a rural way of life. Natives include af›uent Ital-ian and Quaker mushroom farmers at the southern end of the county andold wealth represented by the owners of Chester’s sprawling horse farms,including descendants of William Penn himself.
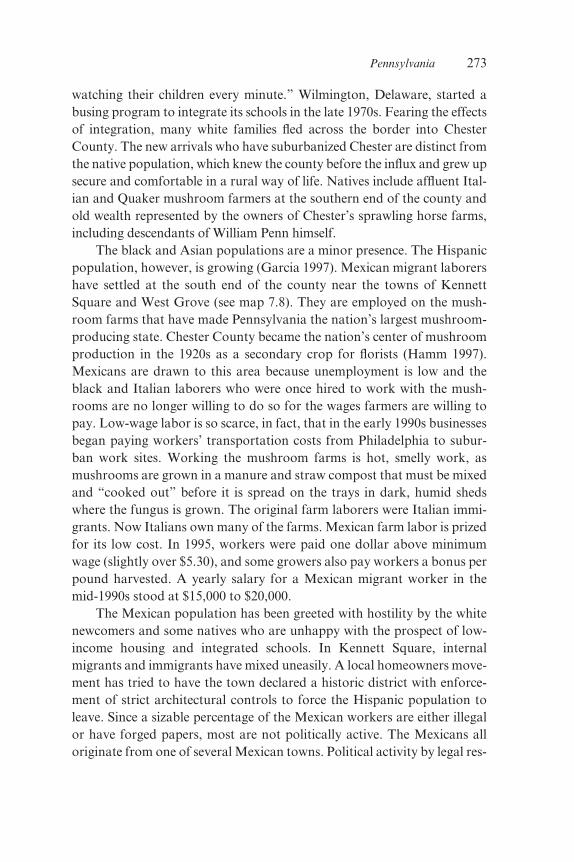
The black and Asian populations are a minor presence. The Hispanicpopulation, however, is growing (Garcia 1997). Mexican migrant laborershave settled at the south end of the county near the towns of KennettSquare and West Grove (see map 7.8). They are employed on the mush-room farms that have made Pennsylvania the nation’s largest mushroom-producing state. Chester County became the nation’s center of mushroomproduction in the 1920s as a secondary crop for ›orists (Hamm 1997).Mexicans are drawn to this area because unemployment is low and theblack and Italian laborers who were once hired to work with the mush-rooms are no longer willing to do so for the wages farmers are willing topay. Low-wage labor is so scarce, in fact, that in the early 1990s businessesbegan paying workers’ transportation costs from Philadelphia to subur-ban work sites. Working the mushroom farms is hot, smelly work, asmushrooms are grown in a manure and straw compost that must be mixedand “cooked out” before it is spread on the trays in dark, humid shedswhere the fungus is grown. The original farm laborers were Italian immi-grants. Now Italians own many of the farms. Mexican farm labor is prizedfor its low cost. In 1995, workers were paid one dollar above minimumwage (slightly over $5.30), and some growers also pay workers a bonus perpound harvested. A yearly salary for a Mexican migrant worker in themid-1990s stood at $15,000 to $20,000.
The Mexican population has been greeted with hostility by the whitenewcomers and some natives who are unhappy with the prospect of low-income housing and integrated schools. In Kennett Square, internalmigrants and immigrants have mixed uneasily. A local homeowners move-ment has tried to have the town declared a historic district with enforce-ment of strict architectural controls to force the Hispanic population toleave. Since a sizable percentage of the Mexican workers are either illegalor have forged papers, most are not politically active. The Mexicans alloriginate from one of several Mexican towns. Political activity by legal res-
Pennsylvania 273
ch7.qxd 6/17/99 12:25 PM Page 273

Map 7.8. Internal migrant and immigrant magnets in Chester County, Pennsylva-nia, 1990
ch7.qxd 6/17/99 12:25 PM Page 274

idents and U.S. citizens is avoided for fear that retaliation could meanarrest and deportation of friends and relatives. Black residents, some ofwhom have lived here since before the Civil War, when Chester Countywas a stop on the underground railroad (Oblinger 1973), have been forcedto move out by the rising cost of living (Garcia 1997). The ones whoremain are people of some means. Only 14 percent of the black populationlived in poverty in 1990, and this undoubtedly explains their relativelyhigher degree of integration compared to Erie or Allegheny Counties (seetable 7.6). The small number of well-educated black residents are politi-cally active. A few serve on local government boards in the southern bor-oughs and townships with mostly white constituencies.
Re›ecting its rural roots, Chester County is one-party Republicanturf and has been since before the New Deal. The Main Line WASP pop-ulation combined with German and Dutch immigrants has made for avery conservative brew. Republicanism is also a reaction to the prevailinganti-Philadelphia sentiment that has differentiated the suburbs from thecity for decades. Recent efforts to transfer money from the suburbs intothe city to deal with Philadelphia’s chronic ‹scal problems have been metwith hostility by all the suburban communities. “When Chester Countianssee Philadelphia, they see business, money, traf‹c and crime. There is ahostility to diversity. People out here won’t say they hate diversity, buttheir de‹nition of diversity is very homogeneous,” said one communityreporter. In spite of cultural differences among natives and newcomers,population in-migration has not dented the county’s Republican traditionas it has in other suburbs. Newcomers and natives may vote Republicanfor slightly different reasons. Natives, for instance, tend to be socially lib-eral, or even libertarian, on issues such as abortion. But the area is uni‹edin its ‹scal conservatism. No wonder Republican registration hasremained stable through the 1980s while Democratic registration hasdeclined slightly. Why haven’t Republican gains been more positive?Many new voters from out of state have not registered and have been slowto develop an interest in state and local issues. New residents also knowthat juries are chosen from voter registration lists, an additional disincen-tive to regular participation. Finally, the population growth in this regionhas translated into strong gains for independent registration, whichreached its historical peak of 12 percent of the electorate in 1994.
Pennsylvania 275
ch7.qxd 6/17/99 12:25 PM Page 275

Erie CountyAt a convenient junction at the corners of Pennsylvania, Ohio, and NewYork, Erie was once a meeting place for rival Indian tribes seeking toresolve disputes on neutral ground. In the late twentieth century, Erie hasfound itself at the intersection of two major interstate highways (I–79 andI–90) and has emerged as a retail and wholesale trade center for the entireregion. Small town residents from western New York, Pennsylvania,Ohio, and even Canada arrive in Erie for weekend sightseeing and shop-ping trips. While its population has been stable since 1980, Erie County isone of the few places that has grown in western Pennsylvania in thepost–World War II period, suggesting some resilience in the face of thedeindustrialization that wrecked Allegheny County and areas furthersouth. The scale of industrial employment has always been smaller here.Economic hard times meant layoffs and plant closings, but the smaller sizeof plants meant that a closing rarely had the kind of ripple effect on thecommunity that one found in the towns in the Mon Valley. Industrialemployers in Erie include smaller shops that could more easily make theshift toward batch production than the hulking and inflexible steel mills tothe south. When union laborers found themselves out of work in Erie, theyeither moved or were able to make the transition to jobs in nonunionemployment, sometimes even changing careers. The outlying suburbs andtowns have experienced a boom in low-wage retail and governmentemployment. The university in Edinboro is a major employer, as is thestate prison at the western end of the county. In the town of Albion, full ofsmall retail employers typical of towns of this size, the school district is thesingle largest employer.
Originally settled by immigrants from Poland, Ireland, and Italy earlyin the twentieth century, the city of Erie, like cities elsewhere, has lost pop-ulation to its suburbs and bedroom communities. This has left the citywith the usual problems: increasing poverty, poorly equipped schools,dilapidated housing stock, an aging population, and crime. With goodtransportation links to the south, west, and east, the commute is short andtolerable for those wishing to shop and work in the city. The nonwhitepopulation of Erie was only 15 percent by the mid-1990s, but the Hispanicpopulation was growing rapidly. As in Adams and Chester Counties, His-panics are employed in agriculture as seasonal labor on area grape farms.Judging from the ‹gures in table 7.6, the segregation of the Hispanic pop-ulation appears to be increasing along with its numbers. The Hispanicpopulation of Erie is extremely poor, earning only half of what non-His-
276 Separate Destinations
ch7.qxd 6/17/99 12:25 PM Page 276
panic white families earned in 1990, and isolated in neighborhoods on theeast end of town. The city has also attracted recent waves of immigrationfrom Russia, Asia, and Eastern Europe. Apparently, however, the arrivalof these groups has not caused any controversy because the volume of in-migration has been small enough that they have not put much of a strainon local resources and services. Erie’s strong and self-conscious ethnic her-itage has made it more accepting of immigrants than it might otherwise be.
Re›ecting its roots in the settlement of eastern and southern Euro-pean Catholics, the city of Erie has been a Democratic stronghold for mostof this century. The outlying areas are mostly Protestant and Republican.Like the rest of western Pennsylvania, the social values are conservative.Republicans represented the area in the U.S. House through the 1980s and1990s. Local observers report that partisanship is not the strong cue that itonce was. How else could Republicans get elected in a county where 57percent of the registered voters are Democrats? Although the growth ofthe suburbs has come mostly from the Democratic city of Erie, Republi-cans have gradually improved their prospects in outlying areas, increasingtheir membership to about 40 percent of total registrants in 1994. Theimprovement in GOP registration is not clearly linked to any trends inmigration from out of state but instead appears to be the result of genera-tional change, suburbanization, and growth from sources internal to thestate such as heavily Republican Crawford County to the south.
Large Numbers, Economic Opportunity, and Segregation
The Pennsylvania case is a good example of a place where numbers are agood indicator of an ethnic group’s assimilation and economic well-being.In areas where a group is concentrated in large numbers, its economicprospects are poorer than where ethnics are few and far between (Frisbieand Neidert 1976; Tienda and Lii 1987). Hence, the small number of Asianfamilies in Chester, Erie, and Allegheny Counties earn, on average, morethan the average non-Hispanic white family. But in Philadelphia, with afar larger Asian population, Asian family income is only 65 percent ofnon-Hispanic white income.
The precise mechanism of cause and effect is unclear here. Do ethnicenclaves hold back economic progress and assimilation or is the causaldirection the other way, with ethnics clustering in enclaves because theyare poor, uneducated, and need the strength of numbers for survival? Vari-ations in the well-being of the Hispanic population in Pennsylvania are
Pennsylvania 277
ch7.qxd 6/17/99 12:25 PM Page 277

also instructive and depend upon nativity and immigrant status. The smallnumber of Hispanic families in Allegheny County earned nearly as muchas non-Hispanic white families in 1990 because the vast majority werenative born and English speaking. By contrast, in Adams, Chester, andErie Counties, a far higher percentage were foreign born, in agriculturalemployment, and earning very low wages compared to the non-Hispanicwhite population.
Pennsylvania’s varying patterns of population growth, stagnation,and decline add considerable texture to our understanding of the politicalconsequences of demographic change. We have learned at least threethings from this chapter. First, Pennsylvania’s uneven development haslured more migrants and immigrants to the eastern than to the westernregion of the state. The instrument for the political and demographicbalkanization of the state has been the uneven development of postindus-trial enterprise. The geographic isolation of Pittsburgh and its reputationas a headquarters for costly union labor have been major barriers to newinvestment. By contrast, the proximity of Philadelphia and its suburbs tomajor East Coast markets has made for a much smoother transition to theservice economy.
Second, and more important, population decline is far less likely tochange the party balance of regions than population growth is. Thosewho remain behind when economic times turn sour are most likely tohave entrenched patterns and ways of life and thought. Population lossleaves two kinds of people behind: the very old and the very poor—mostof whom are unwilling or unable to move. With the most risk-averse cit-izens remaining behind, population loss has done little to alter the bal-ance of party registration in Allegheny County. Population growth, onthe other hand, has the capacity to upset the entire social and politicalbalance of a community. This is why af›uent white Pennsylvanians inChester County have such a strong incentive to shut out the growingthreat of the Hispanic population even as the local economy exploitstheir labor. In Adams County, the resentment is turned toward arrivalsfrom other states, particularly Maryland, who with their superiorincomes threaten to stratify an area that has been homogeneous withrespect to income.
Finally, the spatial segregation of ethnic and racial minorities fromthe white majority, and from each other, can be exacerbated by either pop-ulation growth or decline. In Chester County, and to a lesser extent inAdams, high-end development has taken the same track that it has in
278 Separate Destinations
ch7.qxd 6/17/99 12:25 PM Page 278

Florida. It has made more neighborhoods off limits to low-income resi-dents, many of whom are of color. While segregation in a rural county likeAdams is a relatively benign function of Hispanic migrants who ‹nd livingnear the fruit orchards a practical measure, in the Philadelphia suburbs themechanism of segregation is far from benign. White upper income resi-dents are ‹ercely ‹ghting to exclude low-income development from thesouthern end of Chester County in order to prevent the permanent settle-ment of Hispanic laborers. In the case of Allegheny County, we learn thatspatial segregation is sustained through population losses because out-migrants are not a random mix of the area population. Those who leaveare far more white, well educated, and motivated than those who staybehind. They are also those who can afford the costs of moving and areinformed enough to know what opportunities lie elsewhere.
Segregation of minority from white population groups in Pennsylva-nia threatens to create homogeneous communities of interest, polarizingneighborhoods, cities, and counties in social and political terms. City-sub-urban polarization is nothing new. Philadelphia’s inferiorities have alwaysbeen accentuated by its suburbs (Muller, Meyer, and Cybriwsky 1976).Nor is the division between west and east in Pennsylvania especially new.The continuing polarization of such areas by race and class due to themechanisms of either growth or decline are a matter of concern for thosewho value the practice of a pluralist politics of compromise where divi-sions in the community are temporary and subject to resolution. Over-coming the unpleasant political con›icts that occur along racial and ethniclines has been a continuing battle in the history of the nation. Racial cleav-ages have been anything but temporary. The sustained segregation ofracial and ethnic communities through contemporary migration andimmigration processes places racial and ethnic harmony even furtherbeyond our reach.
Pennsylvania 279
ch7.qxd 6/17/99 12:25 PM Page 279