pendragon plc - annualreports.com · pendragon plc annual report 08 contents 1. group review 2....
TRANSCRIPT

Pendragon PLCPendragon PLC

CONTENTS
Pend
rago
n PL
CA
nnua
l Rep
ort
08
1. Group Review
2. Operational and Business Review
16. Directors and Advisors
17. Report of the Directors
24. Corporate Governance Report
30. Corporate Social Responsibility Report
32. Directors’ Remuneration Report
40. Directors’ Responsibilities Statement
41. Independent Auditors’ Report to the Members of Pendragon PLC
42. Consolidated Income Statement
43. Consolidated Balance Sheet
44. Consolidated Cash Flow Statement
45. Consolidated Statement of Recognised Income and Expense
46. Notes to the Financial Statements
95. Company Balance Sheet
96. Notes to the Financial Statements of the Company
103. Shareholder Information

2008 2007 2006 2005 2004 £m £m £m £m £m
Revenue (note 6) 4,162.4 5,060.2 5,058.5 3,247.4 3,132.8
Gross profit (note 6) 543.2 672.7 701.3 462.5 445.5
Operating (loss) / profit before other income (note 6) (130.9) 87.3 139.7 97.5 84.9
(Loss) / profit before taxation (note 6) (200.6) 46.5 97.7 66.4 70.1
Net assets (note 9) 108.9 307.2 306.0 239.3 219.1
Net borrowings (note 7) 357.3 332.0 369.7 177.0 246.8
Other financial information
Gross margin (note 6) 13.1% 13.3% 13.7% 14.1% 14.1%
Total operating margin (note 1 and 6) (3.1)% 1.7% 2.8% 3.0% 2.7%
After tax return on equity (note 2) (77.0)% 12.7% 24.8% 15.8% 22.7%
Basic earnings per share (note 3) (25.2)p 6.5p 10.7p 7.0p 7.4p
Adjusted earnings per share (note 4) (3.0)p 5.0p 7.5p 6.7p 6.0p
Dividends per share (note 5) 0.50p 4.00p 3.45p 2.64p 2.04p
Dividend cover (times) (10.1) 1.6 3.1 2.6 3.7
Interest cover (times) (note 6) (2.3) 1.8 2.4 2.6 2.9
Gearing (note 8 and 9) 328.1% 108.1% 120.8% 74.0% 112.6%
Business development summary Number of franchises 301 354 390 289 244
GROUP REVIEW
Pend
rago
n PL
CA
nnua
l Rep
ort
08
1
note 1 Total operating margin is calculated after adding back goodwill impairment/amortisation and exceptional items, and excluding other income.
note 2 Return on equity is profit for the year as a percentage of average shareholders’ funds.
note 3 Basic earnings per share has been restated for the impact of the 2006 subdivision of the ordinary shares of 25p each into five new ordinary shares of 5p each.
note 4 Basic earnings per share adjusted to eliminate the effects of non-recurring operating and tax items, see note 10 of the financial statements. It has been restated for the impact of the 2006 subdivision of the ordinary shares of 25p each into five new ordinary shares of 5p each.
note 5 Dividends per share are based on the interim dividend paid and final dividend declared for the year. Dividends per share has been restated for the impact of the 2006 subdivision of the ordinary shares of 25p each into five new ordinary shares of 5p each.
note 6 All comparative amounts have been adjusted to eliminate the results of the discontinued operation (see note 6 of the financial statements).
note 7 Net borrowings comprise interest bearing loans and borrowings, cash and cash equivalents and derivate financial instruments.
note 8 Gearing is calculated as net borrowings as a percentage of net assets.
note 9 Net assets have been adjusted for the impact of the adoption of IFRIC 14 (see note 1ad).

OPERATIONAL & BUSINESS REVIEW
Pend
rago
n PL
CA
nnua
l Rep
ort
08
2
INTRODUCTIONIntroduction
The Group has faced the most challenging market conditions since the
early nineties. The severe market conditions have resulted in the Group
making an adjusted loss before tax of £29.6 million (2007: adjusted profit
£42.0 million). After non recurring largely non-cash items, this increased to
a loss before tax of £200.6 million for the year (2007: profit £46.5 million).
Cash generated from operations was £53.6 million (2007: £160.0 million).
Pendragon swiftly and decisively reduced its cost base and closed locations
which ceased to be viable trading points yielding annual savings of £60
million.
Despite the severe market conditions, the Group has negotiated a new three
year secured financing package with its lenders in the sum of £530 million.
The principal terms of this secured financing package are as follows:
• three year financing package including the extension of the bank facilities
and loan notes to April 2012
• the new bank facility has a margin of 3.25% above LIBOR, up from 0.9%
above LIBOR under the previous arrangements
• warrants granted to the lender group amounting to 7.5% of the entire
issued share capital
• a 1% fee on signing and a fee throughout the three year period of
between 2.5% and 5.5% in total depending on certain conditions
• covenants are at levels that provide sufficient headroom and flexibility for
the Group for the next three years
The implementation of the cost reduction measures, saving £60 million
annually, and the Group’s refinancing mean that it is now well placed to take
advantage of markets when they recover and is currently trading in line with
our expectations. Further information is set out below.
FINANCIAL PERFORMANCE SUMMARYFinancial performance summary
Primarily as a consequence of poor trading conditions and dealership
closures, revenues fell to £4.2 billion in 2008 from £5.1 billion in 2007.
Of the reduction, approximately £200 million related to businesses which
we closed in the year with the balance being due mainly to the overall
reduction in the new car market. Underlying operating profits were £25.8
million compared to £101.3 million in 2007 and each of our operating
divisions remained profitable at this level other than Stratstone which
made a small loss. The reduction in these trading profits is mainly due to a
reduced volume of new car sales and lower margins in used car sales. After
financing costs we made a loss before tax and non recurring items of £29.6
million compared to a profit of £42.0 million before tax and non recurring
items in 2007.
£m 2008 2008 2007 2007 Before Total Before Total non- non- recurring recurring
Revenue 4,025.5 4,162.4 5,024.1 5,060.2
Underlying operating profit 25.8 25.8 101.3 101.3
Non recurring operating items - (156.7) - (14.0)
Operating (loss) / profit before other income 25.8 (130.9) 101.3 87.3
Other income – (loss) / gain on sale of property and businesses - (5.2) - 18.5
Operating (loss) / profit 25.8 (136.1) 101.3 105.8
Finance costs (57.6) (57.6) (60.1) (60.1)
Non recurring finance costs - (2.9) - -
Share of joint venture profit / (loss) 2.2 (4.0) 0.8 0.8
(Loss) / profit before tax (29.6) (200.6) 42.0 46.5
Tax 10.4 40.5 (9.2) (3.3)
Discontinued operation - - - (2.1)
(Loss) / profit after tax (19.2) (160.1) 32.8 41.1
Earnings per share – basic - (25.2)p - 6.5p
Earnings per share – adjusted (3.0)p (3.0)p 5.0p 5.0p
Dividend per share 0.5p 0.5p 4.0p 4.0p

Pend
rago
n PL
CA
nnua
l Rep
ort
08
3
OPERATIONAL & BUSINESS REVIEWContinued
NON RECURRING ITEMSNon recurring items
We have recognised a number of one off impairments and exceptional
costs in 2008. These have arisen primarily due to the downturn in the UK
economy. We have taken an appropriately prudent view on the valuation of
assets and of potential future liabilities when assessing the level of provisions
required in the current economic climate.
We are reporting net non recurring costs before tax of £171.0 million for
2008. These include £24.9 million of provisions relating to new and used
car stock, £19.7 million of losses on closed businesses and £5.4 million of
redundancy costs. We have impaired goodwill by £58.1 million and written
off the total investment of £6.2 million in our property joint venture. We
have impaired the carrying value of assets held for resale, mainly property,
by £11.9 million, recorded an impairment charge for other fixed assets
of £15.2 million and incurred losses on disposal of fixed assets of £5.2
million. In addition, we have incurred costs of £12.7 million relating to the
refinancing of our borrowings. We have taken a cautious view relating to
open VAT issues and made a provision of £26.8 million against them. During
the year we received a VAT refund of £15.1 million in relation to claims
which we had made for prior years. After net non recurring costs the
Group made pre tax losses of £200.6 million. In 2007 the losses on closed
businesses were not treated as non recurring costs. The 2007 comparative
has been disclosed as a non recurring cost this year to ensure consistent
presentation.
DIVIDENDDividend
An interim dividend of 0.5 pence was paid in October 2008 and no final
dividend is proposed. This compares with 4.0 pence paid in respect of
2007. In the near term management will be focussed on conservation of
cash and reduction of borrowings.
2008 2007 £m £m
Goodwill impairment (58.1) (6.8)
Impairment of Joint Venture (6.2) -
Fixed asset impairment and disposal (losses) / profit (32.3) 18.5
Closed businesses and redundancy costs (25.1) (7.2)
Inventory write down (24.9) -
Refinancing related fees (12.7) -
VAT refund 15.1 -
VAT provision (26.8) -
Total (171.0) 4.5

Pend
rago
n PL
CA
nnua
l Rep
ort
08
4
OPERATIONAL & BUSINESS REVIEWContinued
STRATEGY Strategy
Pendragon has become the largest independent operator of franchised
motor car dealerships in the UK, mainly as a result of acquisitions, although
there has also been substantial investment in greenfield sites. The Group now
operates 292 franchises in the UK. As a result of its expansion Pendragon
sells a broad range of new and used motor cars and commercial vehicles
and has a substantial presence in the UK vehicle leasing, wholesale parts and
dealership management software markets. Pendragon has developed and
operates nine motor car franchises in California.
Our strategy has been to grow the number of franchises we operate
and have scale with selected manufacturer brands. This has enabled us
to reduce fixed overheads related to operating car franchises and realise
benefits of economies of scale. The scale of our business has also enabled
us to maintain a diversified portfolio of franchises representing both volume
and luxury brands. These are sold through Evans Halshaw and Stratstone
respectively.
The franchise portfolio is constantly reviewed and dealerships that
are determined to be uneconomical are closed or sold, or the location
refranchised. This strategy has led to a number of closures during the last
two years. It remains our intention to represent a broad range of vehicle
manufacturers and have meaningful scale with them. Where we believe
the long term prospects for a particular franchise are poor we will exit that
franchise as soon as is practicable.
Our strategy to grow the business has led to competitive advantage over
smaller rivals in a number of areas, for example, through the Group’s shared
services centre, central marketing, IT capability and through its buying power.
The critical mass of the Group also drives profitable functional integration
in contract hire, wholesale parts distribution and dealership management
systems.
We have an established platform of businesses in California. It remains our
intention to grow this part of the Group when there is an opportunity to
do so.
OUR MARKETSOur markets
Our principal market is in the UK and splits into three main areas: new
vehicle sales, used vehicle sales and after sales service. The UK new car
market is split in half between retail and fleet. Fleet business tends to be
high volume and low margin. Whilst the Group does some fleet business
we are highly selective as to which business we transact. In addition to
being low margin, fleet business is higher risk than retail and consumes
a disproportionate amount of working capital compared to the profits it
generates. In 2008 the Group reduced its activity in this area for those
reasons. The primary focus of the Group in the new car market is on retail
sales.
On average over the last five years, the market for new cars in the UK has
been 2.4 million. In 2008 the total number of new car registrations in the
UK was 2.1 million, a reduction of 11.3% from 2007. In the brands that we
represent the UK registrations were down 12.2% year on year. Like for like
our new unit sales were down 14.4% year on year. The reduction in new
car sales volume is expected to continue in 2009 with industry estimates
ranging between 1.6 million and 1.9 million new vehicle registrations.
Pendragon sold 158,000 new vehicles in 2008, which equates to 6.4% of
the total market. This proportion is down on 2007 where Pendragon sales
were 6.6% of the market.
Volumes of used cars sold in the UK have been around 7.5 million per
annum over the last five years. In 2008 the Group sold 129,000 used cars
in the UK, which was approximately 2% of the market. The Group has
traditionally operated in only part of the market and retails used cars up to
three or four years old. Over the past 18 months we have been moving
into the older used car market and see this as strengthening the used car
sales part of our business.
The total number of cars on the road in the UK has increased each year for
the last five years and now stands at approximately 32 million. The size of
the market for after sales has grown in line with the car parc in the UK and
tends to be less affected by economic cycles as motor cars require regular
maintenance and repair for both safety and performance reasons.
The Group also operates in certain ancillary markets. We operate a vehicle
leasing and contract hire business in the UK. In the near term due to the
recent unprecedented fall in used car values we expect the profitability of
the leasing business to be lower. Profits are generated when we sell the
used car after it is returned to us at the end of the lease period. Within the
next two years we expect the profitability of our leasing business to return
to more normal levels as the used car market becomes more stable.
We are a significant operator in the commercial van and truck market in
the UK which has a market size of around 0.3 million new units per annum
down 10.7% on the prior year. The key area in this market is after sales
service which remained strong in 2008.
In the UK we have continued to build a presence in the market for dealer
management software systems. The market for these systems is primarily
linked to the number of franchised dealers and is served by a relatively small
number of providers. We mainly sell into the UK and we see this as a good
growth area for our business.
We operate a small division in California with Land Rover, Jaguar and Aston
Martin franchises. The USA total car market was 13.2 million units in 2008,
down by 18% on 2007. Land Rover volumes fell by 40% having been more
significantly affected by consumer confidence and volatile fuel prices. The
Jaguar brand was supported by the new XF model launched in April 2008
and as a consequence the decrease in Jaguar volumes of 5% was well ahead
of the overall market. Although a low volume brand, Aston Martin unit sales
increased by 33% in the year.

Pend
rago
n PL
CA
nnua
l Rep
ort
08
5
OPERATIONAL & BUSINESS REVIEWContinued
OPERATIONAL REVIEWOperational Review
Our Group is structured operationally to reflect the range of business
activities we undertake and we have five distinct trading divisions. The core
vehicle retail business consists of two divisions, Stratstone and Evans Halshaw.
Support businesses consist of leasing, parts wholesale and software.
During the year management has taken action in a number of areas to
reduce the cost base of the business to reflect the downturn which has
taken place in the market. The principal actions that we have taken have
been to close loss making dealerships, reduce employee numbers primarily
in the core business and reduce the levels of vehicle stock held by the
Group. Management will continue to take action on the cost base of the
business over the coming year to maintain it in line with expected activity
levels. This is a dynamic area of management which is supported by our
technology platform and management information systems.
The annualised estimated benefit to operating profit across the business
of actions already taken to address the cost base of the business is in the
region of £60 million.
In terms of dealership closures we completed the programme which we
announced in 2007 and identified for closure additional businesses which
had become unviable in the current economic climate. In total in the year
we closed or sold 53 dealerships which had combined operating losses
and closure costs of £19.7 million in 2008. We have also identified seven
dealerships which will be closed in 2009. When deciding upon dealership
closures management considers the level of losses which will be eliminated,
the amount of business which will migrate to adjacent Group owned
dealerships and the costs of closure which will primarily be stock disposal,
redundancy and property costs.
In light of the falling market for new and used cars in 2008 a headcount
reduction exercise was initiated early in the year. As a consequence there
has been a 2,736 reduction in job roles on a like for like basis through
a compulsory redundancy programme and through natural attrition and
3,712 overall including job roles relating to closed businesses. The job losses
have been spread across all areas of the business. Resource levels continue
to be monitored to ensure that the correct level is in place for the existing
and projected activity levels. The annualised cost saving of this exercise is
estimated at £49 million. The one off redundancy cost was £5.4 million.
A key dynamic in the used car market has been the unprecedented fall
in wholesale used car prices. A number of industry leading sources have
calculated the average fall in used car prices during 2008 and their analyses
range from a 15% to a 25% fall. The impact on the 4x4 and premium
sectors has been significantly more and hence has impacted our Stratstone
brand to a greater degree than our volume business, Evans Halshaw, in
2008. The trend of falling prices appears to have run its course, with a
strengthening of the market in early 2009.
BCA reports a 16% fall in wholesale prices between December 2007 and
December 2008. Importantly, we have seen a recovery and stabilisation in
wholesale prices in 2009, with prices rising by 15%.
In order to mitigate the impact of the falling prices in 2008 we embarked
on a significant stock reduction programme. Our level of used stocks in the
UK was reduced by nearly £100m in 2008 compared to the prior year, with
£73m of the reduction achieved from June 2008 to December 2008. In
addition, vehicles registered for our own use were reduced by £23m over
the prior year. These stock reductions have been a key area of focus for
local management who have been able to increase average used car stock
turn in the second half of the year.
Revenues and operating profits by division are summarised below:
£m 2008 2007 Revenue Operating Revenue Operating (loss) / profit profit
Stratstone 1,357.7 (2.5) 1,889.2 32.3
Evans Halshaw 2,271.2 6.1 2,666.5 35.6
Chatfields 174.6 3.6 195.5 5.0
Support businesses 142.3 17.2 160.9 23.8
USA 148.9 1.4 180.3 4.6

Pend
rago
n PL
CA
nnua
l Rep
ort
08
6
OPERATIONAL & BUSINESS REVIEWContinued
STRATSTONEStratstone
Our Stratstone brand is the UK’s leading luxury motor car retailer with 133
franchise points. Each location sells new and used vehicles and undertakes
after sales service and parts sales. Stratstone holds franchises to sell and
service Aston Martin, BMW, Cadillac, Chrysler Jeep, Corvette, Dodge, Ferrari,
Honda, Jaguar, Land Rover, Lotus, Maserati, Mercedes-Benz, MINI, Porsche,
Saab, Smart and Volvo. Stratstone also holds six motorcycle franchises.
Nationally the market for new vehicle registrations for brands we represent
in this luxury sector fell by 13.1%. The overall reduction disguises some big
movements in individual brands. For example Jaguar was up 8.6% year on
year, reflecting the impact of the new XF model. By contrast, Land Rover
registrations were down 30.0% whilst BMW and Mercedes-Benz were
down 6.9% and 9.0% respectively. In total our new car volumes were 24.6%
down on 2007 on a like for like basis although our gross margins were
2.5% up on 2007. The used car market across all brands was very difficult,
especially in the second half due to significant falls in wholesale prices. Like
for like volumes were down by 0.2% on 2007 and gross margins down by
6.3% year on year. Our after sales activity continued to perform well and its
proportion of Stratstone’s total gross profit increased by 10%.
The split of activities within the Stratstone brand is detailed below to show
the respective shares of revenue, gross profit and the gross margins achieved.
PPU is the margin achieved on sales before overheads and includes income
from finance and insurance products.
The relative proportion of gross profit generated by activity has changed
in line with the market in 2008. A higher proportion of profits have been
generated by the after sales function as it is less impacted by a downturn.
“Trade” represents cars sent to auction which did not fit the Group’s sales
profile. Trade sales margins were down in line with the general market for
used cars and increased losses were made partly as a consequence of the
aggressive reduction of stock in the last quarter.
47%
36%38%
18%
10%
48%
5%
(2%)
New Used Aftersales Wholesale/Trade(5%)
-
5%
10%
15%
20%
25%
30%
35%
40%
45%
50%
55%
Revenue Gross Profit
43%
33%
41%
18%
11%
53%
5%
(4%)
New Used Aftersales Wholesale/Trade(5%)
-
5%
10%
15%
20%
25%
30%
35%
40%
45%
50%
55%
Revenue Gross Profit(10%)
Gross Margin % 2008 2007
New 10.0% 9.7%
Used 5.8% 6.2%
Aftersales 59.9% 61.9%
Trade/Wholesale (9.1%) (3.3%)
Gross Margin (%) 13.0% 12.8%
New & Used Units (‘000) 54.9 70.0
PPU (£) 1,527 1,803
20072008
Revenue Gross Gross Operating Operating Profit Margin (Loss) / Margin profit £m £m % £m %
Existing 1,336.7 175.4 13.1 (0.1) 0.0
Disposed 21.0 1.4 6.9 (2.4) (11.3)
Total 2008 1,357.7 176.8 13.0 (2.5) (0.2)
Total 2007 1,889.2 241.3 12.8 32.3 1.7
Revenue at our existing dealerships was down year on year by £335.1
million mainly due to a reduction in the volume of new cars sold. The gross
margin was up due to after sales activity representing a larger proportion of
total Stratstone gross profits than in 2007.

Pend
rago
n PL
CA
nnua
l Rep
ort
08
7
OPERATIONAL & BUSINESS REVIEWContinued
The impact of the reduction in volume of new cars sold was £27.5 million.
Only our Jaguar brand contributed more unit sales this year than last. Land
Rover was hardest hit with a unit sales reduction of 40.6% on 2007. However,
manufacturer incentives meant that profit per unit for new cars was in line
with the previous year. Used car volumes were down with a profit impact
of £5.3 million and profit per unit was down significantly resulting in lower
profits by £7.2 million. After sales revenues and profits for retail customers
were marginally behind last year as consumers initially delayed the servicing
of their vehicles at the height of the economic slowdown. Within the
overall after sales performance retail service sales were marginally down,
by 2%, which again demonstrates the resilience of our after sales business
in periods of economic decline. The reductions in profits were mitigated
by reducing the operating costs in the division by £29.6 million, principally
consisting of lower advertising costs and fewer team members.
29 dealerships were closed or sold during the year and incurred operating
losses of £2.4 million. This included seven Volvo dealerships, three BMW/
MINI dealerships in the less profitable Home Counties area and other
individual loss making dealerships.
(2.5)
0.1-
2007 Operating
Profit
Reduction inoperating costs
Reduction inaftersales gross
profit
Reduction intrade gross profit
Used volumeimpact
New volumeimpact
New PPUimpact
Used PPU impact
2008 Operating
Profit
32.3
29.6(22.0)
(27.5)
(2.5)
(5.3)
(7.2)
Stratstone operating profit bridge
70m
60m
50m
40m
30m
20m
10m
(10m)

Pend
rago
n PL
CA
nnua
l Rep
ort
08
8
OPERATIONAL & BUSINESS REVIEWContinued
EVANS HALSHAWEvans Halshaw
Our Evans Halshaw brand is the UK’s leading volume motor car retailer,
with 138 franchise points. Evans Halshaw holds franchises to sell and
service Chevrolet, Citroen, Fiat, Ford, Hyundai, Kia, Nissan, Peugeot, Renault
and Vauxhall.
Nationally the market for new vehicle registrations for brands we represent
in this volume sector fell by 11.9%. The overall reduction disguises some
big movements in individual brands. For example Ford and Vauxhall were
down 7.6% and 9.8% respectively whilst Renault was down by 29.4%. In
total our new car volumes were 9.7% down on 2007 on a like for like basis
and our gross margins were 4.5% down on 2007 on a like for like basis.
The used car market across all brands was more competitive. Like for like
volumes were down by 13.2% on 2007 and gross margins down by 9.0%
year on year, reflecting the significant reduction in used car prices during
2008. After sales revenues and profits for retail customers were marginally
behind last year as consumers initially delayed the servicing of their vehicles
at the height of the economic slowdown.
Difficult market conditions caused new and used margins to fall and
increased the losses we suffered on trade cars, which represent cars sent to
auction which do not fit the Group’s sales profile.
After sales increased its proportion of the total gross profit and revenue.
Motor vehicles are regularly serviced and repaired to ensure safety and
performance standards and, importantly, to protect their resale value.
After sales therefore plays an important role in mitigating the effect of the
economic cycle.
Revenue at our existing dealerships was down year on year by £294.0
million, mainly due to a reduction in the volume of new cars sold. The gross
margin was down primarily due to the impact of falling used car prices.
61%
27%24%
30%
10%
44%
5%
(1%)
New Used Aftersales Wholesale/Trade(5%)
-
5%
10%
15%
20%
25%
30%
35%
40%
45%
50%
55%
Revenue Gross Profit
60%
65%59%
26% 26%
33%
9%
41%
6%
(1%)
New Used Aftersales Wholesale/Trade(5%)
-
5%
10%
15%
20%
25%
30%
35%
40%
45%
50%
55%
Revenue Gross Profit
60%
65%
Gross Margin % 2008 2007
New 5.2% 5.5%
Used 14.1% 15.6%
Aftersales 53.1% 55.9%
Trade/Wholesale (3.4%) (1.7%)
Gross Margin (%) 11.6% 12.4%
New & Used Units (‘000) 219.9 254.6
PPU (£) 664 765
20072008
Revenue Gross Gross Operating Operating Profit Margin (Loss) / Margin profit £m £m % £m %
Existing 2,246.6 260.5 11.6 6.7 0.3
Disposed 24.6 2.6 10.9 (0.6) (2.2)
Total 2008 2,271.2 263.1 11.6 6.1 0.3
Total 2007 2,666.5 331.8 12.4 35.6 1.3

Pend
rago
n PL
CA
nnua
l Rep
ort
08
9
OPERATIONAL & BUSINESS REVIEWContinued
Evans Halshaw operating profit bridge
(1.6)
-
2007 Operating
Profit
Reduction inoperating costs
Reduction inaftersales gross
profit
Reduction intrade gross profit
Used volumeimpact
New volumeimpact
New PPUimpact
Used PPU impact
2008 Operating
Profit
35.6
39.2
(20.0)
10.9
6.1
(16.9)
(15.3)
(4.0)
The impact of the reduction in volume of new cars sold was £10.9 million.
All our brands were impacted in line with the market. However, the
market deterioration in our key Ford and Vauxhall franchises was less than
in franchises such as Citroen and Renault. A reduction in profit per unit for
new cars impacted profits by £4.0 million which is a relatively small amount
due to incentives from manufacturers which helped maintain new car
margins. Used car volumes were down with a profit impact of £16.9 million.
Profit per unit was down significantly due to wholesale price reductions
resulting in profits lower by £15.3 million.
After sales revenues and profits for retail customers were marginally behind
last year as consumers initially delayed the servicing of their vehicles at the
height of the economic slowdown. However, our retail service sales were
marginally down by 3% on the prior year which illustrates the resilience of
our after sales business in the economic slowdown. This was mitigated by
a £1.6 million improvement in warranty service sales. Internal work fell as
a result of lower used volumes, particularly in the second half of the year.
The reductions in profits were mitigated by reducing the operating costs in
the division by £39.2 million which consisted principally of lower advertising
costs and fewer team members.
22 dealerships were closed during the year and incurred operating losses
of £0.6 million. The closed dealers were largely in the non core franchises
and other individual loss making dealerships.
70m
60m
50m
40m
30m
20m
10m
(10m)
80m

Pend
rago
n PL
CA
nnua
l Rep
ort
08
10
OPERATIONAL & BUSINESS REVIEWContinued
68%
25%
5% 4%
25%
70%
2% 1%
New Used Aftersales Wholesale/Trade(5%)
-
5%
10%
15%
20%
25%
30%
35%
40%
45%
50%
55%
Revenue Gross Profit
60%
65%
70%
75%
CHATFIELDSChatfields
Under our Chatfields brand we sell and service commercial vans and trucks
in the UK with 21 franchise points. Chatfields holds franchises to sell and
service Iveco, DAF and LDV.
The market for new truck sales in 2008 was up by 13.1% overall whereas
the van market was down by 14.3%. The van market has been affected
by the economic downturn as customers defer purchases and the general
economy slows.
Nearly three quarters of gross profits in this division are derived from
the after sales activity. This tends to be a higher proportion than in the
motor car divisions because of the shorter service intervals required for
commercial vehicles and the operation of overnight servicing in many of the
locations. Gross margins for new vehicles were in line with 2007 and used
margins were significantly down.
The operating profit is down £1.4 million. This is mainly due to the
reduction in new van volumes. The results for the trucks division have been
satisfactory although the market for new and used trucks has weakened
significantly and we expect it to remain subdued for the next 18 months.
However, the after sales business is likely to continue to be resilient.
Gross Margin % 2008 2007
New 5.2% 5.0%
Used 5.6% 9.5%
Aftersales 38.4% 38.3%
Trade/Wholesale (7.5%) 5.8%
Gross Margin (%) 13.7% 13.5%
New & Used Units (‘000) 4.1 5.2
PPU (£) 1,497 1,519
20072008
Revenue Gross Gross Operating Operating Profit Margin profit Margin £m £m % £m %
Total 2008 174.6 23.9 13.7 3.6 2.1
Total 2007 195.5 26.4 13.5 5.0 2.6
67%
26%
4%2%
26%
74%
3%(2%)
New Used Aftersales Wholesale/Trade(5%)
-
5%
10%
15%
20%
25%
30%
35%
40%
45%
50%
55%
Revenue Gross Profit
60%
65%
70%
75%

Pend
rago
n PL
CA
nnua
l Rep
ort
08
11
OPERATIONAL & BUSINESS REVIEWContinued
LEASINGLeasing
In 2008 we consolidated the three separate brands of Pendragon Contracts,
Bramall Contracts and Vardy Contract Motoring under the umbrella brand
of Pendragon Contracts Limited. The leasing business offers a range of
products and services mainly to the small corporate and fleet market for
fleet sizes of up to 1,000 vehicles.
The fleet size reduced due to greater price competition within the contract
hire sector in the second half of 2008. The impact of lower used car values
in the latter stages of 2008 significantly reduced our underlying profits from
vehicle disposals.
Fleet Revenue Gross Gross Operating Operating Numbers Profit Margin profit Margin ‘000 £m £m % £m %
Total 2008 15.5 39.6 11.2 28.4 8.7 21.9
Total 2007 17.6 47.2 13.0 27.5 10.3 21.7
QUICKCOQuickco
Under our Quickco brand we operate an independent genuine parts
wholesale business serving wholesale and dealer customers throughout the
UK. Quickco operates seven different manufacturer franchises, from ten
depots across the country, with a fleet of 190 vans making in excess of
60,000 deliveries per month on a next day or same day basis.
Currently 70% of revenues come from Ford related business. In 2008 Ford
rolled out a new distribution network for their OEM parts named 3D and
this reduced the profit of the Quickco division in 2008. Looking forward,
we have replaced an element of the lost Ford income by expanding our
product range and have built on our other franchise relationships.
Revenue Gross Gross Operating Operating Profit Margin profit Margin £m £m % £m %
Total 2008 76.8 16.5 21.4 1.5 1.9
Total 2007 81.1 20.2 24.9 5.4 6.6
PINEWOODPinewood
Pinewood is one of three main Dealer Management System (DMS)
suppliers in the UK and its Pinnacle product has pioneered the delivery
of Software as a Service (SaaS) in the motor industry. Pinewood’s main
product is ‘Pinnacle’, a browser based, web delivered DMS which manages
and reports on most aspects of a franchised motor dealer’s business.
The rollout of the Pinnacle DMS system into the Evans Halshaw and
Stratstone dealers was completed early 2008. The proportion of Pinnacle
DMS profit generated from Pendragon dealers has reduced to around
50% of total DMS revenues as sales to external dealers has continued to
increase. At the end of 2008 Pinnacle systems were supplied to around
14% of UK franchised car dealerships.
Revenue Gross Gross Operating Operating Profit Margin profit Margin £m £m % £m %
Total 2008 25.9 15.9 61.4 7.0 27.0
Total 2007 32.5 17.3 53.0 8.1 25.0

0%
Pend
rago
n PL
CA
nnua
l Rep
ort
08
OPERATIONAL & BUSINESS REVIEWContinued
CALIFORNIACalifornia
At the end of the year the division consisted of nine franchises in Southern California which operate Jaguar, Land Rover and Aston Martin brands.
The reduction in revenue is attributed both to market conditions adversely
affecting unit sales and to the reduced number of locations. In 2008, we
sold our remaining Saab dealership in Santa Monica and we closed the loss
making Saturn store.
The reduction in gross profit is the net effect of lower vehicle sales and the
increase in after sales margins at Newport Beach following the completion
of the development project in the summer of 2008. Our new car volumes
have declined by 35% in the year although margins have been maintained as
a result of the new Jaguar XF model. The business has also been disrupted
during 2008 by the redevelopment of the Newport Beach dealership which
brings the redevelopments to a close.
Gross Margin % 2008 2007
New 10.9% 11.0%
Used 10.1% 7.5%
Aftersales 52.8% 51.1%
Trade/Wholesale (3.8%) (1.4%)
Gross Margin (%) 17.5% 16.0%
New & Used Units (‘000) 4.6 6.0
PPU (£) 2,670 2,497
20072008
Revenue Gross Gross Operating Operating Profit Margin (Loss) / Margin profit £m £m % £m %
Existing 147.0 25.8 17.6 1.6 1.1
Disposed 1.9 0.3 13.9 (0.2) (10.7)
Total 2008 148.9 26.1 17.5 1.4 1.0
Total 2007 180.3 28.8 16.0 4.6 2.6
Reve e G it
66%
46%
14%
7%
15%
47%
5%
0%
New Used Aftersales Wholesale/Trade(5%)
-
5%
10%
15%
20%
25%
30%
35%
40%
45%
50%
55%
nu ross Prof
60%
65%
70%
SHARED SERVICES CENTRE Shared services centre
Our scale allows us to invest in information technology solutions and to
use a shared services business model. The Group operates on the Pinnacle
system which has been developed by Pinewood. Our shared services
centre now has a team of 456, down by 24% on last year, reflecting the
reduction in the level of activity in the Group overall. The costs of the
centre are borne proportionately by the operating divisions.
58%
36%
20%
11%
18%
53%
4%
New Used Aftersales Wholesale/Trade(5%)
-
5%
10%
15%
20%
25%
30%
35%
40%
45%
50%
55%
Revenue Gross Profit
60%
65%
70%
12

Pend
rago
n PL
CA
nnua
l Rep
ort
08
OPERATIONAL & BUSINESS REVIEWContinued
PROPERTY Property
Our property portfolio is an important aspect of our business which we
seek to utilise in the most cost effective manner. We operate from both
leasehold and freehold properties. In addition, through strategic investment
choices and the decision to close some dealerships, we have a number of
vacant property assets which are held for sale. At the year end we held
£175.0 million of properties on the balance sheet plus £37.3 million of
properties held for sale.
Regarding our investment in our joint venture property company, we have
written the value down from £6.2 million to £nil. This is as a consequence
of falling property values and the joint venture company being in breach
of its banking covenants. The structure is non recourse to the Group and
therefore we have no obligations to the joint venture other than as tenants
to pay the rents and as service provider, to manage the property portfolio.
In 2008 we disposed of eight properties which were operationally surplus
to requirements. This resulted in proceeds of £13.3 million and losses of
£6.1million, which includes write offs of leasehold improvements for which
no proceeds were received. Given the rapid decline in the commercial
property market, we have reviewed all of our property assets which are
held for sale and we have decided to record an impairment charge of £11.9
million against these assets. We have sold one property for £1.9 million
since the year end at approximately book value and currently have surplus
properties under offer with estimated proceeds of £4.9 million and a book
value of £3.7 million.
An impairment review has also been undertaken on our operational
freehold property assets as part of the assessment of all fixed asset values.
An impairment charge of £8.9 million has been recorded in this respect.
CASH FLOWCash flow
Our borrowings as at 31 December 2008 were £357.3 million compared to
£332.0 million at the end of 2007 mainly due to the decrease in profitability
of the Group. We reviewed our cash management processes during the
year and initiated a wide range of debt management actions which are
continuing in 2009. These have included new procedures on vehicle stock
management, eliminating discretionary capital expenditure, more rigorous
debt collection processes and a reduction in the amount of fleet business.
We have seen the impact of the “credit crunch” through changed behaviour
from both our suppliers and customers as everybody tries to conserve
cash. This has manifested itself in shorter credit terms offered to us and a
need for us to consider risk more carefully when dealing on credit terms
with customers.
The cash flows of the business are summarised as follows:
2008 2007 £m £m
Cash generated from operations 53.6 160.0
Net interest paid (64.1) (63.2)
Tax 15.0 (4.8)
Replacement capital expenditure (18.3) (59.7)
Free cash flow (13.8) 32.3
Acquisitions (14.5) (34.2)
Disposals 21.0 68.8
Dividend (15.9) (25.4)
Other (2.1) (3.8)
(Increase) / reduction in net debt (25.3) 37.7
Cash flow generated from operations was £53.6 million, which compares
with £160.0 million generated in 2007. This is made up of two key
components: operating profit and working capital movements. The
operating profit element after adding back depreciation, intangible charges
and property profits was £22.3 million, down £130.3 million from the
£152.6 million in 2007. This includes the impact of a reduction in adjusted
operating profit of £75.5 million and £52.8 million of non recurring costs in
2008 compared to £7.2 million in 2007. In respect of working capital there
was a net reduction of £31.3 million in 2008, and this is stated after £19.0
million cash payments made to reduce the deficit in our pension schemes.
In 2007 we reduced working capital by £7.4 million.
Net interest paid includes the benefit of £8.3 million interest received in
connection with a VAT refund in relation to demonstrator vehicles which
is treated as an exceptional, non recurring interest item in the income
statement. The small increase in underlying net interest charge reflects the
impact of the slightly higher borrowing levels during the year.
Replacement capital expenditure was £18.3 million which includes plant
and machinery, fixtures and fittings and motor vehicles (2007: £59.7
million). Expenditure on plant and machinery and fixtures and fittings was
£2.5 million (2007: £15.8 million). The balance of the expenditure of £15.8
million (2007: £43.9 million) is in respect of motor vehicles used either for
our contract hire fleet or for service loan cars for our customers.
Refunds of taxation payments made in advance in previous periods were
£15.0 million in comparison to taxation payments made in 2007 of £4.8
million.
Business disposals raised £7.7 million in 2008 (2007: £20.6 million), which
related to the sale of five dealerships and the Extra Leasing business.
Surplus property disposals raised £13.3 million (2007: £48.2 million).
13

Pend
rago
n PL
CA
nnua
l Rep
ort
08
OPERATIONAL & BUSINESS REVIEWContinued
YEAR END FINANCINGYear end financing
As part of our cost reduction programme in 2008 we targeted the reduction
of vehicle stocks during the second half of the year to reduce holding costs
and trade losses. We were very successful in reducing used car stock
and vehicles registered for our own use which generally speaking is not
funded by manufacturer related finance companies. This category of stock
was reduced by £102 million in the second half of the year. New vehicle
stocks are traditionally harder to control as stock levels are often linked to
manufacturer sales targets. Last year order commitments were made well
in advance of the serious downturn in the market in the second half with
the consequence that overall new car stock held by the Group increased
in the second half. Actions in conjunction with vehicle manufacturers have
been taken during the second half of 2008 and are continuing in 2009 to
address the overall new stock position.
When considering vehicle stocks from a funding risk view point we split the
funding into that which is funded by the manufacturer through their related
finance arm and that funded by ourselves through stock finance facilities and
bank borrowings. Financing for stock other than through bank borrowings
is shown in trade creditors in the balance sheet. The breakdown of funding
at the year end was as follows:
2008 2007 £m £m
Stock finance 134.1 246.0
Bank 349.4 322.3
Non manufacturer funding 483.5 568.3
Manufacturer finance arm 486.4 413.7
Total funding 969.9 982.0
Our current non manufacturer stock finance facility is from Lombard.
Manufacturers’ finance arms tend to vary the level of finance facilities
offered dependent on the amount of stocks their manufacturer wishes to
put into the network and this varies depending on the time of year and the
level of production. Although stock financed by the manufacturers’ finance
arms has increased during the year as a consequence of falling demand and
continuing supply prior to manufacturers reducing production, we are now
seeing manufacturer financed stocks reducing as supply is constrained.
NEW BORROWING FACILITIESNew borrowing facilities
Over the last six months we have undertaken a rigorous review of the
financing structure of the business and considered disposals of assets such
as our Pinewood software company, a share placing or rights issue and a
restructuring of our debt facilities. The purpose of the review was to ensure
that the Group’s financing structure is appropriate during a period when
we expect the economic environment for trading to be difficult. We have
put in place a new three year debt facility. In the light of this the Group has
decided that an equity issue is not necessary.
We have successfully negotiated a new £530 million three year borrowing
facility, providing us with much improved headroom on covenants and
extending our refinancing timescale. The new arrangements comprise a
revolving facility of £210 million repayable in three years and a term facility
which is currently £210 million and amortises by £20 million in June and
December each year with the balance remaining repayable in three years.
We have also changed the maturity profile on our £110 million of loan
notes to mature in April 2012. As expected, in order to secure this new
financing deal we have had to pay considerably more in fees and increased
margin than before the “credit crunch”.
The new facility has three financial covenants with which the Group must
comply that provide sufficient headroom and flexibility for the next three
years. The first is the ratio of net debt to EBITDA and the second is fixed
charge cover being the ratio of interest and rent cost to EBITDA excluding
rent costs. These two are tested at June and December each year and
have been set on a ratchet basis to reflect improvements in profitability
and debt pay down. The third covenant is EBITDA which has been set
against our downside profit projections over the next three years and is
tested quarterly. The covenants are calculated after making adjustments for
stocking interest and overseas businesses, certain non cash items and other
adjustments to our EBITDA figure such as excluding certain fees on the
new facilities. We have also negotiated new bank facilities for our overseas
businesses in an amount of approximately £36 million.
14

Pend
rago
n PL
CA
nnua
l Rep
ort
08
OPERATIONAL & BUSINESS REVIEWContinued
PENSIONSPensions
The Group operates six final salary pension schemes which are all closed
for future accruals. The schemes’ deficit increased during 2008 due to a
reduction in the fair value of scheme assets, mainly as a result of falling
equity prices. As part of the refinancing of the Group we have agreed
to allow the pension trusts to participate in the security offered to the
other lenders to the Group. We sought and were given clearance by the
Pension Regulator for the arrangements entered into with the lenders and
the Pension Trustees. Contributions to the schemes will be at a reduced
level for a period of twelve months and then revert to previous levels which
were £19 million per annum.
VATVAT
In common with other companies in the industry, the Group is in discussion
with HM Revenue and Customs over a number of issues arising from recent
developments in case law, the treatment of partial exemption within our
finance and insurance operations and the VAT treatment of sales of vehicles
to certain disabled customers.
Additional amounts of VAT receivable and payable may be recognised in
future periods in relation to these outstanding matters, and although these
amounts, if any, could potentially be significant, it is difficult at present to
quantify them. However, in light of the uncertainty surrounding possible
future payments we have decided to make a provision of £26.8 million
which is shown under non recurring items in this year’s accounts.
OUTLOOKOutlook
In 2008 we continued with our cost reduction programme which we
embarked upon in 2007. This has yielded over £60 million of savings
annually and we have closed loss making dealerships. We have put in place
new loan facilities to take us through to 2012. We anticipate a stabilisation
in the used car market this year which is a key area for us going forward.
We expect the new car market to remain subdued for the next 12 months
and then we believe a gradual improvement will be seen. We have taken
actions which give us confidence that we will improve the performance of
the Group in 2009 despite the difficult markets anticipated. The Group is
now well placed to take advantage of markets when they recover and is
currently trading is in line with our expectations.
TREVOR FINN
CHIEF EXECUTIVE
30 APRIL 2009
15

Pend
rago
n PL
CA
nnua
l Rep
ort
08
DIRECTORS AND ADVISORS
Sir Nigel Rudd (62)
Non-executive Chairman (N) (R)*
Appointed non-executive chairman of Pendragon in October 1989. He
is chairman of BAA Limited, deputy chairman and chairman designate of
Invensys Plc and a non-executive director of BAE Systems PLC and Sappi
Limited. Sir Nigel chairs the Company’s Nomination Committee.
John Holt (69)
Non-executive Director (A) (N) (R)†
Joined Pendragon in November 1999. He was previously head of Coopers
& Lybrand’s (now PricewaterhouseCoopers) computer assurance practice
in the North of England. Mr Holt is the senior non-executive director and
chairman of the Audit Committee.
Mike Davies (61)
Non-executive Director (A) (N) (R)
Joined Pendragon in October 2004. Mr Davies is non-executive chairman
of the Royal Mint, Marshalls PLC and Manchester Airports Group PLC as
well as a non-executive director of Taylor Wimpey PLC. He is the chairman
of the Remuneration Committee.
David Joyce (61)
Non-executive Director (A) (N) (R)*
Joined Pendragon on 1 March 2006. He is a civil engineer and chief
operating officer of Vinci PLC (formerly Norwest Holst Group PLC).
Malcolm Le May (51)
Non-executive Director (A) (N) (R)
Joined Pendragon on 1 March 2006. Mr Le May is also a non-executive
director of Royal & Sun Alliance Insurance Group Plc.
Trevor Finn (51)
Chief Executive
Joined the vehicle division of Williams PLC in 1982 and subsequently
became divisional managing director. He was appointed chief executive of
Pendragon prior to the demerger from Williams.
Martin Casha (49)
Chief Operating Officer
Joined the vehicle division of Williams PLC in 1982 and subsequently
became a group general manager. He was appointed operations director
of Pendragon in September 1995 and chief operating officer in November
2001.
David Forsyth (53)
Finance Director
Joined Pendragon in October 1997 from Lonrho PLC where, since 1986, he
held a number of senior finance positions. He is a chartered accountant.
Hilary Sykes (48)
Corporate Services Director
Hilary Sykes is a solicitor and prior to joining Pendragon, advised the
company as a corporate lawyer with Geldards LLP. She joined Pendragon
in 1994 as company secretary and became a director in April 1999.
(A) Member of the Audit Committee
(N) Member of the Nomination Committee
(R) Member of the Remuneration Committee
† retires annually at the AGM, proposed for re-election
* retiring by rotation at the AGM, proposed for re-election
Secretary
Hilary Sykes
Registered Office
Loxley House, 2 Oakwood Court, Little Oak Drive
Annesley, Nottingham NG15 0DR
Telephone 01623 725000
Facsimile 01623 725015
Registered number
2304195
Registrars
Capita IRG Plc
Northern House, Woodsome Park, Fenay Bridge, Huddersfield
West Yorkshire, HD8 0GA
Bankers
Barclays Bank PLC
Lloyds TSB Bank plc
Royal Bank of Scotland plc
Stockbrokers
Arden Partners Plc
Citigroup Global Markets Limited
Auditors
KPMG Audit Plc
Solicitors
CMS Cameron McKenna LLP
Geldards LLP
Osborne Clarke LLP
16

Pend
rago
n PL
CA
nnua
l Rep
ort
08
REPORT OF THE DIRECTORS
The directors present their annual report and the audited financial statements for the year ended 31 December 2008.
RESULTS AND DIVIDENDSResults and dividends
The results of the Group for the year are set out in the financial statements
on pages 42 to 94. An interim dividend of 0.5 pence per share was paid to
shareholders on 3 October 2008. The current intention of the Board is to
use its free cash flow to reduce the Group’s indebtedness, and therefore the
Board does not intend to pay any dividends in the near term, including the
final dividend for the year ended 31 December 2008. The total dividend
for the year was 0.5 pence per share. The Board’s intention is to focus on
conservation of cash and reduction of borrowings. Accordingly, we do not
intend to pay any dividends during 2009. Total dividends amount to £15.9
million, leaving a retained loss for the year of £176.0 million. Movements in
reserves are set out in note 21 to the financial statements.
REVIEW OF OPERATIONSReview of operations
A detailed review of the Group’s activities and future developments is
presented in the Operational and Business Review on pages 2 to 15. The
following businesses were disposed of during the year ended 31 December
2008:
DateBusiness Location Franchise 2008
Evans Halshaw Dorchester Ford January
Evans Halshaw Poole Ford February
Evans Halshaw Reading Ford March
Extra Leasing Derby Contract hire June
Stratstone Tring BMW July
Stratstone Milton Keynes BMW September
During the course of 2008, dealerships which were determined to be uneconomical were closed, sold or the location refranchised. The following table
summarises dealership closures by franchise during 2008:
Franchise Closures
BMW 3
Cadillac/Corvette 3
Citroen 1
Ferrari/Maserati 2
Fiat 2
Ford 6
Hyundai 2
Jaguar 2
Jeep/Dodge 4
Kia 5
Land Rover 2
Franchise Closures
Lotus 1
Mini 3
Peugeot 1
Renault 4
SAAB 2
Saturn 1
Suzuki 1
Vauxhall 1
Volvo 7
Total 53
BUSINESS REVIEWBusiness review
Certain information required by the Companies Act 2006 to be included in
the Directors’ Report is contained in the Operational and Business Review
Report on pages 2 to 15. The Operational and Business Review principally
covers the development and performance of the business and the external
environment. Other requisite disclosures are contained within the Directors’
Report, which includes the principal risks and uncertainties affecting the
business and corporate social responsibility issues. The Company has not
disclosed certain specific non financial Key Performance Indicators in the
absence of relevant measures that have been monitored consistently over
the past three years.
PRINCIPAL RISKS AND UNCERTAINTIESPrincipal risks and uncertainties
We have set out below certain risk factors that we believe could cause
our actual future Group results to differ materially from expected results.
However, other factors could also adversely affect the Group results.
Accordingly, the factors set out below are not intended to represent
an exhaustive list of all potential risks and uncertainties. The risk factors
outlined should be considered in connection with the statement on internal
control and risk management in the Corporate Governance Report on
pages 24 to 29. Health and safety is addressed within the Corporate Social
Responsibility Report on pages 30 to 31.
17

Pend
rago
n PL
CA
nnua
l Rep
ort
08
REPORT OF THE DIRECTORSContinued
BUSINESS CONDITIONS Business conditions
The profitability of Pendragon’s businesses is influenced by the economic
environment in the United Kingdom, where over ninety per cent of its
revenues are generated and could be adversely affected by a worsening
of general economic conditions. Factors such as unemployment, the
level and volatility of equity markets, consumer confidence, the level of
discretionary spending, fuel prices, interest rates, inflation, action taken by
the UK Government on the taxation of engine emissions or fuel for cars
and the availability and cost of credit could significantly affect the market
for the sale of new and used vehicles. An adverse movement in any one,
or a combination of these factors could have a material negative impact on
Pendragon’s trading, financial position and prospects.
VEHICLE MANUFACTURER DEPENDENCIESVehicle manufacturer dependencies
We depend on the vehicle manufacturers’ financial condition, marketing,
vehicle design, production and distribution capabilities, reputation,
management and industrial relations. Although we do not depend on any
single vehicle manufacturer, a failure by a manufacturer in the areas noted
could lead to significant losses especially in the case of the insolvency of
a manufacturer. Vehicle manufacturers provide sales incentive, warranty
and other programmes that are intended to promote new vehicle sales.
A withdrawal or reduction in these programmes would have an adverse
impact on our business.
CHANGES TO MANUFACTURERS’ INCENTIVE PROGRAMMESChanges to manufacturers’ incentive programmes
We depend on the manufacturers for sales incentives, warranties and
other programmes that are intended to promote and support new vehicle
sales at our dealerships. Some of these programmes include customer
rebates on new vehicles, dealer incentives on new vehicles, special financing
or leasing terms, warranties on new and used vehicles and sponsorship
of used vehicles sales. Manufacturers have historically made changes to
their incentive programmes during each year. If manufacturers reduce or
discontinue incentive programmes, this could have an adverse impact on
our business.
USED CAR PRICESUsed car prices, and therefore profit margins, can decline significantly
Used car prices can decline significantly. As a significant proportion of our
business comprises used car sales, these declines can have a material impact
on our business. The impact of declines in used car prices manifests itself not
only through reduced profits on sales, but also through related write-downs
in the value of its used car inventory.
FRANCHISE AGREEMENTSFranchise agreements
We operate franchised motor vehicle dealerships. Franchises are awarded
to us by the vehicle manufacturers. Failure to continue to hold franchises
could result in a significant reduction in the profits of the Group as this
would end its rights to source new vehicle stock directly to sell, to perform
warranty repairs and display vehicle manufacturer trade marks.
Profitability can be significantly affected by the level of new vehicle production
A significant proportion of the Group’s income is generated from vehicle
manufacturers in the form of sales incentivisation programmes. These are
typically structured to include a fixed payment once a pre-determined target
level of new cars from a certain manufacturer is registered by a dealership
or dealership group. In recent years, these manufacturer sales targets had
not been adjusted downward to reflect declining demand levels. This, in
turn, required dealers to reduce prices and/or pre-register new vehicles in
order to meet the sales targets. Decreasing new car prices also negatively
impacts prices and profit margins for used cars. Although manufacturers
have recently, in general, reduced their sales targets to levels more readily
achievable by car dealers, there can be no assurance that these reductions
will be sufficient to offset the decline in demand for new cars or that these
sales targets will not be increased in the future.
PROFITABILITY
LIQUIDITY AND FINANCINGLiquidity and financing
Liquidity and financing risks relate to our ability to pay for goods and services
required by the Group to trade on a day to day basis. We have two main
sources of financing facilities: (i) from banks by way of committed borrowing
facilities; and (ii) from suppliers by way of trade credit. A withdrawal of
financing facilities or a failure to renew them as they expire could lead to a
significant reduction in the trading ability of the Group.
REGULATORY COMPLIANCE RISKRegulatory compliance risk
The Group is subject to regulatory compliance risk which can arise from a
failure to comply fully with the applicable laws, regulations or codes. Non-
compliance can lead to fines, cessation of certain business activities or
public reprimand.
18

Pend
rago
n PL
CA
nnua
l Rep
ort
08
REPORT OF THE DIRECTORSContinued
COMPETITIONCompetition
We compete with other franchised vehicle dealerships, private buyers and
sellers, internet based dealers, independent service and repair shops and
vehicle manufacturers who have entered the retail market. We compete
for the sale of new and used vehicles, the performance of warranty repairs,
non warranty repairs, routine maintenance business and for the provision
of spare parts. The principal competitive factors in service and parts sales
are price, utilisation of customer databases, familiarity with a manufacturer’s
brands and models and the quality of customer service. We also compete
with a range of financial institutions in arranging finance for vehicle purchases.
Some of our competitors may have greater resources and lower overhead
and sales costs. This could lead to our failure to be able to compete and
result in a reduction in our profitability.
RELIANCE ON CERTAIN MEMBERS OF MANAGEMENT AND STAFFReliance on certain members of management and staff
The Group is dependent on members of its senior management team and
skilled personnel and the future financial well-being of the Group could
depend in part on our ability to attract and retain highly skilled management
and personnel. The loss of the service of a number of such individuals could
have a material adverse effect on the business. Additionally, if we fail to
recruit and retain skilled staff it may not be possible to continue to grow
the Group’s businesses.
FAILURE OF INFORMATION SYSTEMSFailure of information systems
Our businesses are dependent on the efficient and uninterrupted
operation of our information technology and computer systems, which are
vulnerable to damage or interruption from power loss, telecommunications
failure, sabotage, vandalism or similar misconduct. Whilst we have put in
place contingency and recovery plans in order to mitigate the impact of
such failures it can never be certain that these plans could cover every
eventuality or situation.
RELIANCE ON THE USE OF SIGNIFICANT ESTIMATESReliance on the use of significant estimates
The Company exercises judgement over certain critical accounting matters
in respect of goodwill impairment, intangible assets, consignment inventories,
repurchase commitments, employee post-retirement benefit obligations,
deferred tax and income tax. Any significant variance in these accounting
judgements could be material to the financial position of the Group.
LEGISLATIVE CHANGESLegislative changes in relation to the distribution and sales of vehicles
Legislative changes in relation to the distribution and sales of vehicles could
have a material impact on the operations and financial performance of
the Group. Pursuant to the Motor Vehicle Block Exemption Regulation
(Commission Regulation EC 1400/2002) (“MVBER”) , franchise agreements
in the motor vehicle franchise sector are regulated by a specific EU
competition law regime. The MVBER permits the suspension of the usual
competition rules in order to allow efficient, well-equipped pan-European
networks of specialised distributors and repairers to be set up. Such a
suspension is justified by the relatively high value and technical complexity
of a motor vehicle.
Any modification of the MVBER could potentially have an adverse effect on
the Group’s business operations. In 2010 the MVBER expires, and it is not
yet clear whether it will be renewed (in its current, or a modified form) or
whether motor distribution and repair will be brought under the parallel
regime covering agreements for distributions of all types of goods and
services, known as the Vertical Agreements Block Exemption Regulation
(Commission Regulation EC 2790/1999), a simplification which the EC has
consistently worked towards. The final position is unlikely to be known until
Autumn 2009.
DIRECTORS Directors
The directors of the Company are listed on page 16. Details of the
terms of appointment and notice period of each of the current directors,
together with their respective interests in the Company’s shares, appear
in the Remuneration Report on pages 32 to 39. The Combined Code
and the Company’s Articles of Association require directors to retire by
rotation or, in the case of directors who have served more than nine years,
annually. The circular to shareholders describes the business of the Annual
General Meeting and includes details of the directors proposed for election
or re-election. Following the performance evaluation of individual directors,
the Board has confirmed that the non-executive directors standing for re-
election at this year’s AGM continue to perform effectively and demonstrate
commitment to their roles. The directors in question are: Sir Nigel Rudd,
Mr J H Holt and Mr D A L Joyce, each of whom, being eligible, will stand
for re-election. Each of the non-executive directors, Sir Nigel Rudd, Mr J H
Holt, Mr D A L Joyce, Mr M T Davies and Mr M J Le May considers that he
has sufficient time to commit to the Company’s affairs notwithstanding his
other business commitments, and has no conflicting interests.
At no time during the year did any of the directors have an interest in any
contract with the Group. The interests of the directors in the share capital
of the Company, other than with respect to options to acquire ordinary
shares (which are detailed in the Directors’ Remuneration Report) were
as follows:-
19

Pend
rago
n PL
CA
nnua
l Rep
ort
08
REPORT OF THE DIRECTORSContinued
DIRECTORS Directors (continued)
Ordinary Shares of Nature of holding 31 December 2008 31 December 20075 pence each Shares Shares
T G Finn Beneficial 17,384,496 16,514,996
Sir Nigel Rudd Beneficial 11,000,000 11,000,000
M S Casha Beneficial 5,101,972 5,101,972
D R Forsyth Beneficial 1,865,439 1,865,439
H C Sykes Beneficial 1,844,662 1,844,662
M T Davies Beneficial 150,000 150,000
J H Holt Beneficial 125,000 125,000
D A L Joyce Beneficial 50,000 50,000
M J Le May Beneficial 19,000 19,000
These shares include the investment shares the executive directors hold in
the 2006 Long Term Incentive Plan (“LTIP”), 2006, 2007 and 2008 awards
(further details of which appear in the Directors’ Remuneration Report).
There were no changes to the directors’ interests shown between 31
December 2008 and the date of this report.
APPOINTMENT AND REPLACEMENTAppointment and replacement of the Company’s directors
The rules for the appointment and replacement of the Company’s
directors are detailed in the company’s Articles of Association. Directors
are appointed by ordinary resolution at a general meeting of holders of
ordinary shares or by the Board either to fill a vacancy or as an addition to
the existing Board. The appointment of non-executive directors is on the
recommendation of the Nomination Committee; the procedure is detailed
in the Corporate Governance Report on page 26.
POWERS OF THE COMPANY’S DIRECTORS Powers of the Company’s directors
Subject to the Company’s Memorandum and Articles of Association, relevant
legislation and any directions given by special resolution, the Company and
its Group is managed by its Board of directors. The directors have been
authorised to allot and issue ordinary shares, offer and allot ordinary shares
in lieu of some or all of the dividends and to make market purchases of the
Company’s ordinary shares. These powers are exercised under authority of
resolutions of the Company passed at its Annual General Meeting. Further
details of resolutions the Company is seeking are set out in the explanatory
notes to the notice of Annual General Meeting.
DIRECTORS’ INDEMNITIESDirectors’ indemnities
The Company’s Articles of Association permit the Board to grant the
directors indemnities in relation to their duties as directors in respect
of liabilities incurred by them in connection with any negligence, default,
breach of duty or breach of trust in relation to the Company. In line with
market practice, each director has the benefit of a deed of indemnity
which includes provisions in relation to duties as directors of an associated
company, qualifying third party indemnity provisions and protection against
derivative actions.
COMPENSATION FOR LOSS OF OFFICECompensation for loss of office
In the event of an executive director’s employment with the Company being
terminated as a result of a take-over offer or otherwise 50% or more of
the Company’s issued share capital being acquired, he is entitled to receive
from the Company a sum equivalent to 0.75 times his salary which applied
immediately before the take-over event, 0.75 times his available bonus and
a sum equal to that proportion of the available bonus which the expired
part of the measurement period for annual bonus bears to the whole of
such measurement period.
In the event of a non-executive director’s employment with the Company
being terminated as a result of a take-over offer or otherwise 50% or more
of the Company’s issued share capital being acquired, he is entitled to one
times his annual director’s fees at the rate prevailing immediately before the
take-over event. In addition, where a non-executive director has elected to
receive part of his fee in the form of vehicle provision, he will be entitled
to receive one times the annual cost of the provision and one times the
annual cost of the insurance and road tax for such vehicle provision in the
event of a take-over.
20

Pend
rago
n PL
CA
nnua
l Rep
ort
08
REPORT OF THE DIRECTORSContinued
SIGNIFICANT DIRECT OR INDIRECT SHAREHOLDINGSSignificant direct or indirect shareholdings
At 1 April 2009 the directors had been advised of the following interests in the shares of the Company:-
Shareholder Shares %
Trefick Limited 81,433,290 12.41
Schroder Investment Management 73,910,534 11.27
JP Morgan Chase Bank 58,005,855 8.84
HSBC 53,837,724 8.21
AXA Investment Managers UK Limited 31,038,250 4.73
Barclays PLC 25,700,590 3.92
Fidelity International Limited 24,202,040 3.69
SHARE CAPITALShare capital
As at 31 December 2008, the issued share capital of the Company
comprised a single class of share capital which is divided into ordinary
shares of 5 pence each. Details of the share capital of the Company are
set out in note 20 to the accounts on page 81. The Company issued no
shares during the period under review. The rights and obligations attaching
to the Company’s ordinary shares are set out in the Company’s Articles of
Association, copies of which can be obtained from Companies House in the
UK or by writing to the Company Secretary.
RIGHTS AND OBLIGATIONS ATTACHING TO SHARESRights and obligations attaching to shares
Subject to applicable statutes and other shareholders rights, shares may be
issued with such rights and restrictions as the Company may by ordinary
resolution decide, or, if no resolution has been passed or so far as the
resolution does not make specific provision, as the Board (as defined in the
Articles) may decide.
Holders of ordinary shares are entitled to attend and speak at general
meetings of the Company, to appoint one or more proxies (and, if they
are corporations, corporate representatives) and to exercise voting rights.
Holders of ordinary shares are entitled to receive a dividend. Ordinary
shareholders are entitled to receive a copy of the Company’s annual report
and accounts. Subject to meeting certain thresholds, holders of ordinary
shares may requisition a general meeting of the Company or the proposal
of resolutions at Annual General Meetings.
VOTING RIGHTSVoting rights, restrictions on voting rights and deadlines for voting rights
Shareholders (other than any who, under the provisions of the Articles or the
terms of the shares they hold, are not entitled to receive such notices from the
Company) and the Company’s auditors have the right to receive notice of, and
to attend and in the case of shareholders to vote at all general meetings of the
Company. A resolution put to the vote at any general meeting is to be decided
on a show of hands unless (before or on the declaration of the result of the
show of hands or on the withdrawal of any other demand for a poll) a poll is
properly demanded.
Every member present in person at a general meeting has, upon a show of
hands, one vote for every 5p nominal amount of share capital of which he is the
holder. In the case of joint holders of a share, the vote of the member whose
name stands first in the register of members is accepted to the exclusion of any
vote tendered by any other joint holder. Unless the Board decides otherwise, a
shareholder may not vote at any general or class meeting or exercise any rights
in relation to meetings while any amount of money relating to his shares remains
outstanding.
A member is entitled to appoint a proxy to exercise all or any of their rights
to attend and speak at the vote on their behalf at a general meeting. Further
details regarding voting at the Annual General Meeting can be found in the notes
to the notice of the Annual General Meeting. Details of the exercise of voting
rights attached to the ordinary shares held by the Employee Benefit Trust are
set out in the section entitled ‘Shares held by the Pendragon Employee Benefit
Trust’ on page 22. None of the ordinary shares, including those held by the
Employee Benefit Trust, carry any special voting rights with regard to control of
the Company.
To be effective, electronic and paper proxy appointments and voting instructions
must be received by the Company’s registrars not later than 48 hours before a
general meeting.
There are no restrictions on the transfer of ordinary shares in the Company
other than certain restrictions which may be imposed pursuant to the Articles
of Association of the Company, certain restrictions which may from time to time
be imposed by laws and regulations (for example in relation to insider dealing),
restrictions pursuant to the Company’s share dealing code whereby directors
and certain employees of the Company require prior approval to deal in the
Company’s shares, and where a person has been served with a disclosure notice
and has failed to provide the Company with information concerning the interests
in those shares.
The Company is not aware of any arrangements or agreements between
shareholders that may result in restrictions on the transfer of ordinary shares
or on voting rights.
21

Pend
rago
n PL
CA
nnua
l Rep
ort
08
REPORT OF THE DIRECTORSContinued
TEAM MEMBER SHARESAVE SCHEMETeam member sharesave scheme
The Company continues to encourage employee share ownership through
the provision of a save as you earn (SAYE) scheme, administered by the
Yorkshire Building Society (the “Pendragon 1998 Sharesave Scheme”). The
SAYE Scheme was renewed at the 2008 AGM. As at 31 December 2008,
703 team members, representing 6.48% of total team members participated
in the scheme. Share options are exercisable by participant team members
upon expiry of either a 3, 5 or 7 year savings contract, at a pre-determined
option price. Full details of options remaining under this scheme can be
found in note 28 to the financial statements on page 84.
SHARES HELD BY THE PENDRAGON EMPLOYEE BENEFIT TRUSTShares held by the Pendragon Employee Benefit Trust
The Company established an Employee Benefit Trust in June 1999 with
Investec Trust (Guernsey) Limited. As at the 31 December 2008, the
trustee held 19,844,141 shares, representing 3.02% of the total issued share
capital at that date, which are used to satisfy options under the Pendragon
1999 Approved Executive Share Option Scheme, the Pendragon 1999
Unapproved Executive Share Option Scheme and the Pendragon 1998
Sharesave Scheme. The voting rights in relation to these shares are
ordinarily exercisable by the trustee; however these rights are waived and
the trustee does not vote the shares held.
During the year, 836,335 shares with a nominal value of £41,816.75 were
transferred to beneficiaries of the Sharesave Scheme, the 1999 Approved
Executive Share Option Scheme and the 1999 Unapproved Share Option
Scheme by the trustees of the Employee Benefit Trust.
ARTICLES OF ASSOCIATIONArticles of Association
The Company’s existing Articles of Association were adopted by special
resolution at the Annual General Meeting held on 25 April 2008. These new
Articles of Association included a provision allowing general meetings of the
Company to be called on the minimum notice period provided for in the
Companies Act 2006. For meetings other than an AGM this is currently a
period of 14 days. The Companies Act 2006 provisions relating to meetings
are due to be amended with effect from August 2009, as a result of the
implementation of the EU Shareholder Rights Directive. The Board believes
that it should ensure that the minimum period for notice of meetings of the
Company can remain at 14 days after August 2009, and a special resolution
will be put to shareholders to approve 14 days as the minimum period
of notice for all general meetings of the Company other than AGMs. Full
details of this resolution are contained in the circular to shareholders.
SIGNIFICANT AGREEMENTSSignificant agreements
The Company has entered into a number of significant agreements which
ordinarily would be terminable upon a change of control of the Company.
Franchise Agreements – our dealerships operate under franchised •
new vehicle dealer agreements and authorised repairer agreements
with various vehicle manufacturers and importers. Without a franchise
agreement, it is not generally possible to obtain new vehicles from a
manufacturer or display vehicle manufacturer trade marks. Whilst some
of the franchise agreements contain provisions entitling the vehicle
manufacturers to terminate in the event of a change of control, this
entitlement is circumscribed by the applicable EC Regulation 1400/2002
(commonly known as the motor vehicle Block Exemption). In the event of
a change of control, a vehicle manufacturer is unable to terminate either
the franchise agreements or authorised repairer agreements held by the
Group if the new controlling entity already holds that manufacturer’s
brand of franchise.
• A Facilities Agreement dated 3 December 2005 (as subsequently
amended and supplemented by amendment letters dated 3 February
2006, 8 February 2006, 14 February 2006 and 17 February 2006, an
amendment and restatement agreement dated 8 March 2006 and an
override agreement dated 30 April 2009 between the Company and its
subsidiaries and the Royal Bank of Scotland plc and others under which
the Royal Bank of Scotland agreed to make available term and revolving
facilities to Pendragon up to an aggregate sum of £530 million – in the
event of a change of control, the lenders under this facility are able to
cancel the facility and declare all outstanding together with all accrued
interest, commission and other amounts immediately due and payable.
• A Loan Note Purchase Agreement dated 25 February 2004 in relation
to US $110,000,000 5.65% Guaranteed Senior Loan Notes Series A due
in April 2012 and US $67,000,000 5.95% Guaranteed Senior Loan Notes
Series B due in April 2012 subsequently amended and supplemented by
an override agreement dated 30 April 2009. In the event of a change of
control, the Company must offer to prepay all outstanding loan notes no
more than 90 days and not less than 50 days from the date of the change
of control event.
22
REPURCHASE OF SHARES Repurchase of shares
Details of movements in the Company’s share capital are given in note 20
to the financial statements. The Company has not repurchased any of its
own shares during the year. The authority to purchase the Company’s own
shares is exercised only if the directors expect it to result in an increase in
earnings per share.
Pend
rago
n PL
CA
nnua
l Rep
ort
08
REPORT OF THE DIRECTORSContinued
PAYMENTS TO SUPPLIERS Payments to suppliers
The Group’s policy is to settle the terms of payment to its suppliers
when agreeing the terms of the transaction and to abide by those terms,
provided it is satisfied that the supplier has provided the goods or services
in accordance with the agreed terms and conditions. The Group has not
adopted any specific code or standard on payment practice. The number
of days’ purchases outstanding for payment by the Group at 31 December
2008 was 61 days (2007: 59 days). The Company had no trade creditors.
AUDITORS Auditors
KPMG Audit Plc has indicated its willingness to continue as independent
auditor and a resolution concerning its reappointment will be proposed at
the Annual General Meeting.
The directors who held office at the date of approval of this directors’
report confirm that, so far as they are each aware, there is no relevant audit
information of which the Group’s auditors are unaware; and each director
has taken all the steps that they ought to have taken as a director to make
themselves aware of any relevant audit information and to establish that the
Group’s auditors are aware of that information.
By order of the Board
H C Sykes
Secretary
30 April 2009
23
CORPORATE SOCIAL RESPONSIBILITY Corporate social responsibility
The Company’s approach to corporate social responsibility is set out on
pages 30 to 31. No political donations were made (2007: £ nil) and the
Company does not intend the Company or any member of the group to
make any such donations.

Pend
rago
n PL
CA
nnua
l Rep
ort
08
COMPLIANCECompliance
Pendragon PLC is committed to maintaining high standards of corporate
governance, in line with the UK Listing Authority listing rules and its Board
supports the principles of the Combined Code on Corporate Governance
issued by the Financial Reporting Council (“the Code”). This statement,
together with the Remuneration Report, on pages 32 to 39 below, explains
how the Company has applied the principles and complied with the
provisions of the Code. The Board regularly reviews corporate governance
matters, taking into account both guidance issued by bodies representing
institutional shareholders and individual institutional shareholders’ policies
and feedback, together with appropriate best practice. The Company has
complied with the Code throughout the year.
DIRECTORSDirectorsThe Company and its Group is managed by its board of directors (“the
Board”). The Board is responsible for overall group strategy, acquisition
and divestment policy, approval of major capital expenditure projects and
consideration of significant financing matters. Through the Company’s
divisional structure, the Board reviews the strategic direction of individual
trading businesses, their annual budgets and their progress towards
achievement of those budgets. The Board also takes charge of the
Company’s standards in matters of corporate governance and policy
matters affecting the Company’s stakeholders. The Board has overall
responsibility for the Group’s system of internal control, including financial
control and risk management and the Group’s record on matters of health
and safety and environmental compliance. It is also responsible for approving
appointments to the Board and of the company secretary and approving
policies relating to directors’ remuneration and severance. All matters of an
operational nature and within the executive directors’ capital expenditure
authority are dealt with by the executive directors. Certain of the Board’s
duties are delegated to committees of the Board, whose responsibilities and
composition are set out on pages 26 to 27 of this Report.
There is a clear separation of the functions of chairman and chief executive,
recorded in a written statement reviewed annually by the Board and
published on the Pendragon PLC website. This statement is also available
for shareholders’ inspection at the Annual General Meeting and at any time
from the company secretary upon request.
The Board operates to a standing agenda which ensures that all matters
reserved for its decision are dealt with in an appropriate manner, and all
matters requiring regular or annual review receive adequate scrutiny and
debate. Between meetings, information packs containing key performance
data are circulated to directors. The chairman holds meetings with the
non-executive directors without the executives present when he deems it
appropriate. In addition to formal meetings of the Board, informal meetings
to familiarise with particular operations or address strategic matters are
held as dictated by the requirements of the Company’s business and any
new developments. The attendance of directors at meetings of the Board
and (where applicable) its committees during the year is set out in the
table below.
(A) Audit Committee member (N) Nomination Committee member (R) Remuneration Committee member
The Nomination Committee did not meet during the year.
* Attendance is displayed showing the number of meetings attended out of the total directors were eligible to attend e.g. 22/22 means 22 out of the 22 meetings held were attended.
Director Board Audit Remuneration Total
Sir Nigel Rudd (N, R) 11/12 n/a 4/5 15/17
J H Holt (A, N, R) 11/12 5/5 5/5 21/22
M T Davies (A, N, R) 11/12 5/5 5/5 21/22
D A L Joyce (A, N, R) 12/12 5/5 5/5 22/22
M J Le May (A, N, R) 10/12 4/5 5/5 19/22
T G Finn 12/12 n/a n/a 12/12
M S Casha 9/12 n/a n/a 9/12
D R Forsyth 12/12 n/a n/a 12/12
H C Sykes 12/12 n/a n/a 12/12
The names, brief biographical details and committee appointments of each
of the directors appear on page 16. The Company has not identified any
individual as deputy chairman. The senior non-executive director has met
with the other non-executive directors, without the chairman present, to
conduct the annual appraisal of the chairman’s performance during the
year. Directors have the opportunity at each meeting of the Board, and
informally between meetings, to raise any concerns they may have regarding
the way the Company is being run or any proposed course of action. Any
such concerns, if voiced at a meeting of the Board or any of its committees,
would be recorded in the minutes. No such concerns have been raised
during the year.
The Company supports the principles of the Code regarding board
balance and the ability of board members to bring to bear an independent
judgement on the matters put before them. For 2008, the Board comprised
four executive directors and four non-executive directors, all of whom are
considered by the Code to be independent, and the chairman. Each of
the Audit and Remuneration Committees is composed entirely of non-
executive directors treated by the Code as independent.
CORPORATE GOVERNANCE REPORT
24

Pend
rago
n PL
CA
nnua
l Rep
ort
08
CORPORATE GOVERNANCE REPORTContinued
INDEPENDENCEIndependence
In the view of the Board, every non-executive director serving during the
year has demonstrated the required degree of independence, both in
character and judgement, taking into account all the relevant circumstances.
At least half the Board, excluding the chairman, consists of non-executive
directors determined by the Board to be independent. Due to the
rebuttable presumption in the Code that a director who has served on
the Board for more than nine years is not independent, Mr J H Holt would
not, due to his long service, be treated by the Code as independent, unless
the Company was able to rebut such presumption. Throughout the year,
the Company continued to regard Mr J H Holt as independent. The only
matter relevant for consideration in relation to Mr J H Holt is the duration
of his appointment as a director, which commenced in 1999. The Board
considers that, notwithstanding his length of service, throughout the year,
Mr Holt remained independent in character and judgement and continued
to be committed to his role. There are no relationships or circumstances in
relation to any director which are regarded by the Company as having the
potential to affect his exercising independent judgement.
BOARD COMPOSITION AND EFFECTIVENESSBoard composition and effectiveness
The Board reviews annually the composition of the Board and its committees
and the respective contributions of each director. The effectiveness of the
Board and committee structure is considered, together with the adequacy
and appropriateness of the skill set of the Board, taking into account any
new developments in the Company’s business or strategy, and the range
of expertise, knowledge and experience represented. The latest of these
reviews concluded that the Board and its committees were operating
effectively and that in particular, the clear demarcation of the respective
responsibilities of the individual directors, the committees and the Board
contributed strongly to their effective operation. The Board also concluded
that the skills and experience present are appropriate to the Company’s
business activities and provide adequate oversight of the assessment and
management of risk.
All directors seek election to the Board at the Annual General Meeting
following their appointment. In accordance with the Company’s Articles
of Association, all directors seek re-election by rotation at least once every
three years.
For the year under review, the Board has evaluated the performance of
each director. The non-executive directors, led by the senior non-executive
director and assisted by the chief executive have reviewed the performance
of the other executive directors, the non-executives have reviewed the
performance of the chief executive, and the Board has reviewed the
performance of the non-executive directors.
Each non-executive director’s performance in furthering the Company’s
objectives was assessed, together with his contribution in his areas of
expertise, reflected in his committee work, participation in Board discussion
and, where applicable, familiarisation visits. Attendance at meetings was also
considered.
The evaluation of the non-executive directors also addressed their
capability, time commitment and, where applicable, effectiveness in the role
of committee chairman. The assessment of executive directors covered
two aspects of performance: the director’s individual contribution towards
achievement of the Company’s goals; and the achievement of individual
objectives appropriate to his or her role.
The performance review of the chairman was conducted by the non-
executive directors led by the senior non-executive director. They
considered the responsibilities of the role as set out in the Code, including
capability, time commitment, effectiveness and shareholder communication.
The chairman’s principal commitments outside the Company as at 30
April 2009 were as, deputy chairman and chairman designate of Invensys
PLC, non-executive director of BAE Systems PLC and Sappi Limited, non-
executive chairman of BAA Limited and chairman of the Boardroom Issues
Group of the Confederation of British Industry. The Board is satisfied that
the chairman and each non-executive director is able to devote the amount
of time required to attend to the Company’s affairs and his duties as a
Board member.
INFORMATION AND ADVICEInformation and advice
The directors regularly receive financial and other information concerning
the Group’s activities, plans and performance. Each director is entitled
on request to receive from the Company information to enable him to
make informed judgements and adequately to discharge his duties and has
access to the advice and services of the company secretary on all matters
of Board procedures and corporate governance. The company secretary
also provides advice and support to each of the Board’s committees and,
in particular, to the chairman on all corporate governance matters. The
directors’ terms of appointment also permit them, at the Company’s
expense, to take independent professional advice in connection with their
duties.
In line with common practice, the Company maintains insurance cover in
respect of the liability of its directors and officers to third parties.
25

Pend
rago
n PL
CA
nnua
l Rep
ort
08
PROFESSIONAL DEVELOPMENTProfessional development
The Board includes individuals from various backgrounds with many years’
experience of senior positions either in listed companies or professional life.
In carrying out their duties, the directors are expected to bring to bear an
independent judgement on issues of strategy, performance, resource and
standards of conduct. New Board members receive an induction tailored
to their needs. An induction information pack, comprising constitutional
documents, terms of reference and historical and accounting information is
provided and operational site visits are undertaken to enable familiarisation
with the Group’s business. Where appropriate, both upon appointment
and subsequently, formal training by external providers in matters such as
the duties of directors, pension trusteeship and corporate governance is
arranged. All directors are encouraged to maintain an awareness of new
developments in the areas of the Group’s principal activities and attend
appropriate briefings on individual aspects of the Group’s business or new
developments. Where necessary, directors have access to professional
training relating to their Board or committee functions. During the year,
the chairmen of the Audit and Remuneration Committees have attended
specialist briefings on issues relevant to their professional development and
the business of their committees.
BOARD COMMITTEESBoard committees
The Board delegates certain matters to committees of the Board, each of
which operates under written terms of reference. These, together with the
committees’ membership, can be found on the Pendragon PLC website, at
www.pendragonplc.com
NOMINATION COMMITTEENomination Committee
The Committee is composed of the non-executive directors, and its
chairman is Sir Nigel Rudd. The Committee did not meet in 2008. The
Committee is responsible for leading the process for appointments to
the Board. The Committee and the Board operate to a protocol for the
selection and appointment of executive and non-executive directors. This
includes a six stage process, from the identification of the vacancy to the
making of a recommendation to the Board for an appointment. Having
identified a vacancy, the Committee assesses the current skills profile of the
Board and produces a skills profile for the vacant position, with the aim of
strengthening and enhancing the skills, knowledge base and experience of
the Board. The need to advertise the vacancy or engage executive search
advisors is considered. Interviews with short-listed candidates follow,
conducted by an appropriately constituted panel of directors, comprising
a majority of non-executive directors and excluding directors with any
personal or business connections to the candidates. All Board members
are given the opportunity to meet a recommended candidate before a
nomination is put to the Board.
REMUNERATION COMMITTEERemuneration Committee
The Chairman of the Remuneration Committee, Mr M T Davies, is an
independent non-executive director. The Committee is composed of
non-executive directors considered by the Code to be independent, and
the chairman, and meets at least once a year. In 2008 it met five times.
The Committee has responsibility for determining the remuneration
packages of the executive directors in the context of the policy adopted
by the Board. It also liaises with the Nomination Committee to ensure
the remuneration packages set for new executive directors are consistent
with the Company’s overall remuneration policy. It sets the targets for any
performance related pay schemes applicable to executive directors and
determines the policy for and scope of pension agreements, termination
packages and compensation commitments for the executive directors. It
is also responsible for ensuring that due regard is given to best practice in
matters of executive remuneration and that the Company complies with all
applicable regulations relating to executive remuneration.
The Directors’ Remuneration Report is considered by the Remuneration
Committee, but adopted by the Board as a whole. That Report is set out
on pages 32 to 39.
AUDIT COMMITTEESAudit Committee
The Committee is chaired by Mr J H Holt who is also the senior non-
executive director. It is composed of the non-executive directors of the
Company (except the chairman). The Committee is comprised entirely of
non-executive directors considered by the Code to be independent.
Mr J H Holt is regarded by the Board as having recent and relevant
financial experience, due to his lengthy career in accountancy, with
PricewaterhouseCoopers, and as a result of his regular attendance at
appropriate continuing professional development seminars. Meetings of
the Audit Committee are held at least four times a year and are attended,
by invitation, by the finance director, the head of the internal audit function
and representatives of the company’s external auditors, at the chairman’s
discretion. The Committee met five times in 2008.
CORPORATE GOVERNANCE REPORTContinued
26

Pend
rago
n PL
CA
nnua
l Rep
ort
08
CORPORATE GOVERNANCE REPORTContinued
AUDIT COMMITTEE ACTIVITIESAudit Committee activities
The meetings in April and August take place in advance of the preliminary
and interim results announcements. At these meetings, the Committee
considers the draft financial statements and the preliminary and interim
results announcements. It also considers the report of the external auditors
on the full-year audit, concentrating on issues of judgement and audit focus
identified in the audit plan. Additional meetings, held in June and November,
are concerned primarily with the review of the business risk management
process, the outcomes from risk control visits, and the effectiveness of the
visit plan for the current year, as well the external audit plan for the year, the
audit fee and other significant corporate governance issues, such as those
with Financial Services regulation implications.
At each meeting attended by the external auditors, the members of the
Committee have the opportunity for discussion with the auditors without
the finance director or head of internal audit being present. This permits
any issues to be reviewed with, and assurances to be sought from, the
external auditors independent of executive management involvement.
The chairman of the Committee also makes himself available for meetings
with the head of the Company’s internal audit function to allow issues
concerning controls and, in particular, the working and resourcing of
the internal audit function, to be reviewed. The Committee’s terms of
reference are published on the Pendragon PLC website and, in summary,
include responsibility for : monitoring the integrity of the Company’s financial
statements and any formal announcement relating to the Company’s
financial performance; making recommendations to the Board in relation
to the appointment and removal of the external auditors, reviewing the
external auditors independence and objectivity and the effectiveness of
the audit process, and developing and implementing the Company’s policy
on the engagement of the external auditor to provide non-audit services. The Committee is also responsible for reviewing the Company’s internal financial controls and system of internal control and risk management, monitoring and reviewing the effectiveness of the Company’s internal audit department and ensuring adequate levels of staffing and ensuring that the Company’s systems of control as they relate to activities regulated by the Financial Services Authority are adequate and functioning properly and are adequately resourced.
The review of the arrangements for employees to raise, in confidence,
concerns about possible improprieties in relation to financial reporting or
other matters also falls within the Audit Committee’s responsibilities. The
Committee reviews at least twice annually the Company’s whistleblowing
policy together with any follow up action taken, and its procedures for the
reporting and recording of suspected fraud and dishonest acts. These items
also form part of the Committee’s standing agenda. As part of its regular
monitoring activities during the year, the Committee reviewed and approved
amendments to the Company’s procedures, in particular regulated activities
in the the areas of general insurance mediation regulated by the FSA, Anti-
Fraud, Theft and Corruption, whistleblowing and Anti-Money Laundering.
The Company’s Anti-Fraud, Theft and Corruption Policy and Anti-Money
Laundering Policy are available on the Company’s website.
During the year the Committee chairman has carried out an evaluation of
the independence of the Company’s external auditor KPMG Audit Plc and
reviewed the effectiveness of the external audit process. Matters addressed
in the evaluation included an assessment of the quality of communication
between the external auditor and the Audit Committee, the manner in
which the relationship between the auditor and the Company is managed
and the ability of the auditor to challenge practices and procedures and to
communicate appropriately with the Company on any significant control
weakness discovered in the course of their audit work. Also considered
were the level of non-audit services provided by the external auditor and
the potential this may have to impair the independence of the audit. The
effectiveness of the internal audit function has also been formally assessed.
The views of management and of the external auditor have been taken
into account in the review of the internal audit function and the views of
management have been taken into account in the review of the external
auditor. Each review concluded that the functions were performing
effectively.
The Committee has considered the policy in relation to the supply of non-audit services by the Company’s auditor during the year. The Company’s policy is not to exclude its auditor from undertaking non-audit work, but to permit the supply of such services in areas where, in the opinion of
the Committee, it is appropriate to do so. The objective of the policy
is to ensure that non-audit work is carried out in a way that affords full
value for money, whilst obtaining a service that best serves the interests of
the Company. Contracts for non-audit work are not therefore awarded
to the Company’s auditor where there is a perceived conflict of interest.
Where appropriate, the provision of non-audit services is formally market
tested through a tender process. The Committee has during the year
reviewed the independence and objectivity of the external auditor, taking
into consideration relevant professional and regulatory requirements with
the aim of establishing that these are not impaired by the provision to the
Company of non-audit services.
Aegon Actuarial Services (part of the Scottish Equitable Plc group of
companies) continue to act as advisors and actuary for the Company’s
occupational pension schemes, having been selected by competitive
tender.
A full statement of the fees paid to KPMG Audit Plc and KPMG LLP for audit
and non-audit services is provided in note 3 to the financial statements on
page 61. The Committee has concluded that the provision of these services
has not impaired audit independence.
27

Pend
rago
n PL
CA
nnua
l Rep
ort
08
SYSTEMS OF INTERNAL CONTROL Systems of internal control
The Board is ultimately responsible for maintaining a sound system of
internal control and for reviewing its effectiveness. The Board has adopted
a risk-based approach to establishing a sound system of internal control.
The system of control has been in place throughout the year. High level
risk assessment occurs at one meeting of the Board during the year in the
context of the Company’s annual strategic review. Operational management
is charged with responsibility for identifying and evaluating risks facing the
Group’s businesses on a day-to-day basis. In establishing and maintaining
the Company’s system of internal control, the Board has paid due regard to
the Turnbull Guidance on risk management and internal controls.
The Board’s process for satisfying itself of the effectiveness of the system
of internal control relies on: assurance from executive management with
regard to the design, communication and implementation of controls
and provision of monitoring information; and assurance from the Audit
Committee on the regular monitoring of the system and correction of any
material control failures. The system is designed to manage rather than
eliminate the risk of failure to achieve business objectives, and can provide
only reasonable and not absolute assurance against material misstatement
or loss. The Board has during the year reviewed all relevant risk areas
and the system of internal controls and received reports on new risks and
changes to the existing risks, based on the following broad areas:
• financial • socio-economic
• physical • political and regulatory
• transactional • reputational
• technological
Operational management is supported in its role by a multi-disciplinary
team, known as the Risk Control Group. This group is formed from senior
representatives of the central finance, internal audit, information technology,
legal and insurance functions, is chaired by the finance director and usually
meets at least twice a year. The group met twice during 2008. It is attended
by invitation by the chairman of the Audit Committee and representatives
of the external auditor, at the discretion of the chairman. Its responsibilities
include the regular review and rating of risks together with rating of the
likelihood of the risk occurring and its potential impact on the Group, the
identification of the need for corresponding controls and the monitoring
of the design, communication and implementation of new controls and
adaptation of existing controls to improve their effectiveness. The Risk
Control Group has a reporting line direct to the Board. The internal audit
function reports on matters of financial control each month directly to the
Board.
Major commercial, technological and financial risks are assessed at the
Board’s annual planning meeting, which reviews the Company’s principal
areas of business and considers any adaptation to the Company’s business
strategy required to meet specific commercial and other risks or threats.
The conclusions are incorporated in the Company’s business strategy and
formally adopted by the Board.
The Board has established a strong control framework within which the
Group operates. This contains the following elements:
Management structure
Pendragon is a large multi-franchise retailer of motor vehicles and ancillary
services, which operates through a divisional structure. The Group consists
of two principal operating divisions, Evans Halshaw for volume franchises
and Stratstone for luxury franchises and four support divisions (Information
Technology, Parts Supply & Distribution, Finance & Insurance and Contract
Hire) each headed by a Divisional Managing Director. Each Divisional
Managing Director participates in a monthly operational board meeting,
chaired by the Chief Operating Officer. Best practice meetings for each
division, at which key operating controls and improvements to their
implementation are discussed, are generally held monthly, chaired by each
Divisional Managing Director.
Communication
There is an embedded culture of openness of communication between
management and the Board on matters relating to risk and control. Face-
to-face and video-conferencing meetings of all operational teams occur
regularly. Processes are reinforced at operational meetings and via the
Company’s intranet and video communications.
Financial reporting
The Group operates to comprehensive management reporting disciplines
which involve the preparation of financial plans by all operating units. The
plans are reviewed by executive management and are subsequently passed
to the Board for approval. Monthly actual results are reported against the
approved plans.
Investment appraisal
The Group has a clearly defined framework for capital expenditure
including appropriate authorisation levels, beyond which such expenditure
requires the approval of the executive directors and, for larger capital
projects, acquisitions and disposals, the Board. There is a prescribed format
for capital expenditure applications which places heavy emphasis on the
commercial strategic logic for the investment and demands a detailed
financial presentation of the business case.
Functional reporting
The Group has identified a number of key areas which are subject to periodic
reporting to the Board. These areas are given particular emphasis through
the operation of appropriately constituted teams which meet regularly, and
report to the Board via a designated executive director. These include
the following central functions: group finance, treasury, corporate tax, value
added tax, health and safety, human resources, information systems, internal
audit, insurance, legal, payroll, property and training.
Risk Control
The work of the Risk Control Group is described above. Its remit includes
the identification and assessment of new risks facing the Group’s businesses,
CORPORATE GOVERNANCE REPORTContinued
28

Pend
rago
n PL
CA
nnua
l Rep
ort
08
CORPORATE GOVERNANCE REPORTContinued
SYSTEM OF INTERNAL CONTROL System of internal control (Continued)
business continuity planning and the establishment of policies and
procedures for risk control for implementation in the Group’s businesses.
It has the power to co-opt representatives from the Group’s operating
business to assist in the design of new controls and the improvement of
existing ones. A twice-yearly review of the Risk Control Group’s work is
included in the Board’s agenda.
Processes, responsibilities and monitoring mechanisms and frequencies are
defined and communicated to the directors and executives concerned and
a regular pattern of meetings and reporting requirements established to
ensure that the Board is sufficiently informed of risk management measures
to enable them to review the effectiveness of the Group’s systems of
internal control.
Going concern
The directors are satisfied that the Group is in a sound financial position
with adequate resources to continue in operation for the foreseeable
future. In forming this view, the directors have reviewed budgets and other
financial information. The financial statements of the Group have therefore
been prepared on the basis that the Group is a going concern. For further
information concerning the Group’s liquidity and financing risk, see page
18 of the Report of Directors and note 18 to the Financial Statements,
together with the directors’ assessment of going concern.
Shareholder relationsThe Board as a whole takes responsibility for ensuring that the Company is engaged in dialogue with shareholders which is constructive and fosters mutual understanding of the Company’s and shareholders’ objectives. The Board’s statement concerning the respective roles of chairman and
chief executive also deals with the Company’s approach to shareholder communication and is available on the Pendragon PLC website. The chief executive, Mr T G Finn, is responsible for implementation of the strategy set by the Board. Among his duties is the conduct of communications with shareholders on the Company’s performance. He must ensure that major shareholders have the opportunity for regular dialogue with the Company on issues of concern to them, and, in particular, that any changes in policy or strategy are effectively articulated to shareholders. In the main, shareholder communication is based around meetings with shareholders at key points in the financial reporting year. These are conducted by the chief executive and the finance director, rather than the non-executive chairman. In this respect the Company’s approach is not compliant with the Code. The directors believe this to be the most practical and efficient way of communicating on matters such as strategic direction, financial performance, underlying market conditions and operational issues. Issues raised by shareholders on these occasions are carefully noted and fed back to the Board, and, where appropriate, access to the chairman for further discussion is arranged. Each of the chairman and the senior non-executive director also holds himself available at all times for contact with shareholders. Unless specifically requested to participate in discussions or to provide information and explanations, each of them will, however, refer enquiries he receives to the chief executive. If the matter concerns the chairman’s remuneration or performance or any other matter with which it is inappropriate for him to deal, it is referred to the senior non-executive director. The Board is always willing, where practicable, to enter into dialogue with shareholders based on mutual understandings of their respective objectives and being mindful of the Company’s obligations under the listing rules. The respective chairmen of the Audit Committee, the Nomination Committee and the Remuneration Committee are available to answer shareholders’ questions at the Annual General Meeting (“AGM”).
BUSINESS AT THE ANNUAL GENERAL MEETINGBusiness at the Annual General Meeting
As well as dealing with formal business, the Company takes the opportunity
afforded at the AGM to provide up-to-date information about the
Company’s trading position and to invite and answer questions from
shareholders on its policies and business. At the AGM a separate resolution
is being proposed for each substantive matter. The Company’s annual
report and financial statements are despatched to shareholders, together
with the Notice of AGM, giving the requisite period of notice. The business
being proposed at the AGM will be summarised in the Notice of AGM, to
follow separately to this report.
29

Pend
rago
n PL
CA
nnua
l Rep
ort
08
PHILOSOPHYPhilosophy
Our culture is about the way we behave as an organisation. As a large
employer and provider of goods and services to many thousands of
customers, Pendragon PLC and its group touch the lives of many. As the
occupier of hundreds of business premises and a customer of a wide range
of businesses the Group benefits from and contributes to relationships with
many suppliers and communities. Pendragon believes that long term success
in business is greatly enhanced by valuing and developing relationships with
key stakeholders. As a company, we operate within a framework of five
core values, which recognise the broad needs and aspirations within each
relationship. These values are the foundation of our culture and by ensuring
that these values are known and understood, we can ensure that they can
be applied by team members across all divisions and at all levels of the
organisation.
CORPORATE SOCIAL RESPONSIBILITY REPORT
VALUESValues
The Company has adopted value statements which reflect the stakeholder
groups. For each, Pendragon’s vision is to be “the Number One Choice”.
Employees are encouraged to see themselves as part of a team, hence the
expression “team member” is used for all those working within the Group’s
businesses. Team members are introduced to the Pendragon vision and
values on joining and through regular communication, which reinforces the
Company’s philosophy and approach.
The Pendragon Vision
to be “the Number One Choice”
Our Customers
we provide a good value, personalised service to existing and potential customers
Our Manufacturers
we provide quality, brand focussed representation, meeting mutual aspirations of customer retention and sales volume
Our Suppliers
we provide long term, profitable partnerships in return for quality service and competitive pricing
Our Team Members
we provide secure, satisfying employment, recognising the contribution of each individual to the success of our business
Our Shareholders
we provide the best earnings per share performance over a rolling five year view against defined sector competition
INVOLVEMENT AND DEVELOPMENT Involvement and development
The Group recognises the importance of good communications and
relations with its team members, as its ability to meet the needs of its
customers in a profitable and competitive manner depends on the
contribution of team members throughout the Group. Team members
are encouraged to develop their contribution to the business, wherever
they work. In many areas ongoing programmes, focused on quality and
customer service, provide an opportunity for everyone to be involved
in making improvements and in developing their own skills to that end.
The Company has been awarded Investors in People accreditation, first
achieved in 1999, and renewed in 2006. The Company’s well-established
practices in encouraging team member development and involvement
provide substantial support for the renewal of this award.
PENSION TRUSTEESHIP Pension trusteeship
Team member involvement also extends to the boards of trustees of the
Company’s various occupational pension schemes, details of which appear
on page 33 within the Directors’ Remuneration Report. A total of eight
employee representatives, who broadly reflect the businesses from which
scheme beneficiaries originate, served either directly as trustees or as
directors of the schemes’ corporate trustees during the year.
SHARE SCHEMES AND INCENTIVES Share schemes and incentives
Team members’ financial participation is encouraged through the Company’s
Sharesave scheme, which attracts membership from all levels within the
Group’s business. A variety of bonus schemes provide team members
with rewards linked to the growth and prosperity of the business. At 31
December 2008 a total of 1,703 team members (15.72%) participated
in ownership of shares and/or schemes linked to the Company’s share
performance.
30
Pend
rago
n PL
CA
nnua
l Rep
ort
08
CORPORATE SOCIAL RESPONSIBILITY REPORTContinued
COMMUNICATION Communication
The challenges presented by the size of the Group and the importance
of consistency drive the Company to devise and implement ever more
innovative and timely means of communication. Video, internal website
messaging and face to face presentations are used to keep team members
up-to-date with the Company’s strategy and performance. The leadership of
the Group’s businesses are a particular focus for channelling communications
and regular briefings for all team members at each location provide a forum
for sharing both corporate and local information. The Company promotes
a number of internal publications based on its divisional structure which aim
particularly to recognise the achievements of individual team members and
celebrate outstanding business performance.
COMMUNITY Community
As a multi-site, predominantly retail operator, the Group’s community
involvement is generated by its local businesses, which contribute to their
local areas in a variety of ways. At a national level, predominantly through
its Stratstone brand, the group has been a key sponsor and fundraiser of
Sparks, the children’s medical research charity. Local schools, hospitals
and medical charities as well as Comic Relief and the BBC’s Children in
Need Appeal have all been beneficiaries of charity events organised by
team members. The Company supports and encourages these activities
and welcomes the opportunities they present for team-building within the
businesses and relationship-building with the communities they serve.
ENVIRONMENT Environment
Although not generally regarded as a high environmental impact sector,
motor retailing and its associated after sales service activities carries with
it a range of responsibilities relating to protection of the environment.
The Company’s policy is to promote and operate processes and
procedures which, so far as is reasonably practicable, avoid or minimise the
contamination of water, air or the ground; and to manage responsibly the
by-products of our activities, such as noise, waste packaging and substances
and vehicle movements. During the year, the Company has registered
with the Department of the Environment, Food and Rural Affairs’ carbon
reduction commitment scheme. The Company’s statement of environment
policy is available on the Pendragon PLC website.
HEALTH AND SAFETY Health and safety
The Company recognises its responsibility to all team members and
others working in or visiting its facilities to provide, so far as is reasonably
practicable, an environment which is safe and without risk to their health.
The Company’s policy is to identify all potential hazards and assess the
risks presented by its activities and to provide systems and procedures
which allow team members at all levels to take responsible decisions in
their day to day work in relation to their own and others’ health and safety.
The Company’s health and safety policy is available on the Pendragon PLC
website.
In matters of health and safety, the Company promotes awareness of potential
risks and hazards and implementation of corresponding preventative or
remedial actions through its on-line health and safety systems, operations
manuals and regular communication on topical issues. A clear hierarchy
of responsibility is published to team members and reinforced through
regular on-site monitoring. Team members are supported in discharging
their responsibilities by specialist guidance from the Company’s health and
safety function and on-line training tool.
DISABLED PEOPLE Disabled people
The Group recognises its responsibilities in employing and training people
who are disabled, not all of whom are formally registered disabled persons
in UK terms. If any team member becomes disabled it is standard practice,
in all but the most extreme circumstances, to offer an alternative job or
adapt the existing job and provide retraining where necessary.
EQUAL OPPORTUNITIES Equal opportunities
The quality of the Company’s relationships with its stakeholders will, in large
measure, determine its success. Critical to those relationships is its ability
to attract, motivate and retain the best team members. The Company’s
policy is to ensure that team members achieve their full potential within
the business and that all employment decisions, from the advertisement of
a vacancy through to the offer of development opportunities and further
advancement, are taken without reference to any form of discriminatory
criteria. The Company’s equal opportunities policy is available on the
Pendragon PLC website. Vacancies are first advertised internally on the
Pendragon intranet to maximise the opportunity for career progression
within the Group. The Company’s bonus and incentive programmes are
carefully researched and designed to ensure they are tailored to match
reward to performance and recognise outstanding contributions to the
Group’s business.
31

Pend
rago
n PL
CA
nnua
l Rep
ort
08
DIRECTORS’ REMUNERATION REPORT
REMUNERATION COMMITTEE Remuneration Committee
The remuneration policy is determined by the Board and is described
below. At 31 December 2008, the Remuneration Committee of the Board
was composed of the non-executive directors Mr M T Davies (chairman),
Mr J H Holt, Mr M J Le May, Mr D A L Joyce and Sir Nigel Rudd, who
rejoined the Committee in February 2008 (the “Committee”).
The Committee recommends to the Board the specific remuneration
packages for executive directors and the chairman, although he is not
party to any discussions in relation to his own remuneration. All of its
recommendations made to the Board during the year were accepted.
The Committee meets as often as necessary to discharge its duties, which
during 2008 was five times. Details of members’ attendance are set out in
the Corporate Governance report on page 24. The terms of reference of
the Committee are available on the Company’s website.
ADVISORS Advisors
During 2008, Sir Nigel Rudd and Mr T G Finn, provided internal advice to
the Committee but not in respect of their own pay. The secretary to the
Committee is Richard Maloney, the Group Solicitor.
REMUNERATION POLICYRemuneration policy
• Bonus targets for 2008 were set at the beginning of this year. It was
considered that the performance target structure, originally set in 2007,
remained appropriate, and should continue unchanged. This is made up
of three elements: (i) adjusted PBT; (ii) gearing; and (iii) fulfilment of
personal objectives. In the event, the 2008 targets have not been met
and therefore bonus is not payable to executive directors.
• Executive directors’ basic salary levels should remain unchanged from
their 2007 levels. No increases in basic pay were made.
• Long Term Incentive Plan awards were made used the same performance
measure structure as those adopted in 2006, as this was considered to
be appropriate for 2008.
• Share options were awarded to below board level executives under the
Pendragon 1999 Approved and Unapproved Share Option Schemes and
these schemes should be renewed upon their expiry in April 2009.
• The exceptional circumstances presenting during 2009 and likely to
prevail during 2009 require a broad range of incentive schemes to be
available to motivate and retain executive directors and below board
executives and the Company should both seek renewal of its existing
executive share option schemes upon their expiry in 2009 and approval
of an additional share ownership award scheme known as the ExSOP,
which is a shared ownership share plan discussed in more detail on page
36.
• The Committee should consider awards to executive directors under
any combination of the available share incentive schemes, subject to
appropriate and robust performance targets and vesting conditions.
NON-EXECUTIVE DIRECTORS REMUNERATION POLICY Non-executive directors remuneration policy
The Company’s policy on non-executive directors’ remuneration is
reviewed annually by the Board. Remuneration for non-executive directors
is confined to fees alone, without a performance related element. Non-
executive directors may elect to receive all or part of their fees in the
form of benefits in kind, typically the provision of a motor vehicle for their
use. The Company considers that the remuneration of the non-executive
directors is consistent with the time commitments associated with individual
positions and wider market practice among companies of a comparable
size. As such, remuneration for the chairmanship of Board committees, and
the fees payable to the committee chairmen, first introduced in 2007, were
considered to remain appropriate for 2008.
EXECUTIVE DIRECTORS REMUNERATION POLICY Executive directors remuneration policy
The Company’s policy in respect of executive director’s remuneration recognises the need to attract and retain directors with levels of remuneration that are arrived at responsibly and reflect their individual contribution and value to the company.
The remuneration policy places great emphasis on ensuring that the executive directors’ incentive arrangements have the potential to provide a greater reward than base salary. Combined with an approach that requires all incentive arrangements to be linked directly to business specific measures, this ensures that rewards will be based on the continued creation of shareholder value.
The Committee concluded in early 2008 that its remuneration policy,
first introduced in February 2007, remains appropriate and supports the corporate strategy. For 2008, the remuneration policy remained as follows:
• Annual bonus linked with corporate performance targets, and capped at 100% of salary for exceptional performance;
• Awards under the Long Term Incentive Plan, first introduced in 2006, with a matching element of share based incentives.
• Going forward, it is considered desirable to broaden the range of equity incentives available for retention and incentive purposes, by once again including executive share option awards and a new plan intended to reward the creation of shareholder value and share price growth, detailed further under Equity Incentives below.
A summary of the Committee’s conclusions and policies implemented during the year were:
32
Pend
rago
n PL
CA
nnua
l Rep
ort
08
DIRECTORS’ REMUNERATION REPORTContinued
IMPORTANCE OF SHARE OWNERSHIP Importance of share ownership
The Company recognises the importance and value of having executive
directors who are significant shareholders in the Company.
To promote this goal for the next generation of executive directors,
in 2005, the Company adopted share ownership guidelines. These guidelines
encourage executive directors to hold shares costing 100% of salary
(200% of salary for the chief executive) within three years of being
appointed to the Board.
Details of the current directors’ beneficial interest in shares is displayed in
the table on page 20 of the Report of the Directors.
BASE SALARY Base salary
Base salaries are reviewed annually and are set by reference to the individual’s
skill, experience and contribution. For 2008, it was not felt appropriate
given the prevailing economic climate to increase the base salaries of the
executive directors. The Committee therefore remained satisfied with both
the salary level and the existing balance between fixed and variable pay.
BENEFITSBenefits
Life assurance, private health cover, professional subscriptions, contribution
to home telephone costs and the provision of two cars, one of which is fully
expensed, are provided to the executive directors.
PENSIONS Pensions
The executive directors did not receive any pension benefits during the
year under review. Historically, they participated in the Pendragon Pension
Plan, a defined benefit pension scheme providing a pension of up to two
thirds of final salary on retirement. Certain executive directors remain
entitled to a deferred pension, calculated up to the date of leaving the Plan.
Details of their entitlements are set out on page 38.
The executive directors continue to receive a payment in lieu of pension
contribution, which is circa 26% of salary for executive directors. This
payment is not consolidated into the base salary for the purpose of future
annual bonus payments or the LTIP, but will be monitored as a percentage
of base salary.
ANNUAL BONUS Annual bonus
The executive directors can earn up to 100% of salary in any one year on
a sliding scale with 50% being awarded for achieving expected results and a
further 50% for outstanding performance.
At the start of 2007, the Committee concluded that the executive directors’
annual bonus potential of 100% of salary would be based on three separate
measures of performance. The measures were as follows: adjusted profit
before tax (weighted at 40%), gearing (weighted at 30%) and a personal
objective for each executive (weighted at 30%), set by the chief executive
or in the case of the chief executive, the chairman. Bonus awards at the
highest available percentage of salary are made only upon achievement of
outstanding performance. Bonuses are not pensionable. The bonus policy
set in 2007 remained in place for the 2008 bonus awards. For the 2008
performance period, the Committee concluded that, given the prevailing
economic climate, no bonuses would be awarded.
EQUITY INCENTIVESEquity incentives
The extraordinary market and economic conditions in 2008 render the
performance conditions for all LTIP awards made to date unattainable.
Details of awards are set out on page 35. Whilst this does not necessarily
lead to the conclusion that the LTIP structure has become inappropriate,
these circumstances have led the Committee to review the range of equity
incentives available to the Company for award to executive directors and
below board executives. It has concluded that, subject to suitably stretching
performance measures, the Company should maintain the flexibility to
make incentive awards to executive directors under executive schemes
of the kind it has traditionally operated, and under any newly introduced
scheme, as may be appropriate in the circumstances of a performance
year. Details of the equity incentives, both existing and proposed, and the
Company’s approach to their use, are set out below. Approval of the
Replacement Executive Schemes and adoption of the ExSOP will afford
the Company a range of equity-based incentives from which to select the
appropriate reward structure. Performance conditions will continue to
be set at the time of award and will incorporate a mix of earnings per
share (“EPS”) growth and, where considered appropriate, total shareholder
return (“TSR”), measures. It is intended that when awards, whatever their
combination, are made to executive directors, the cumulative potential
reward will remain proportionate in the context of the total remuneration
of the individual director and the balance of his fixed and variable pay,
and the vesting conditions will not disproportionately concentrate the
crystallisation of reward into any one year.
33

Pend
rago
n PL
CA
nnua
l Rep
ort
08
DIRECTORS’ REMUNERATION REPORTContinued
LONG TERM INCENTIVE PLAN (“LTIP”) Long Term Incentive Plan (“LTIP”)
• executive directors may choose to re-invest
their annual bonus in purchasing Pendragon
shares or buy shares from their own personal
resources of an amount up to 100% of salary
(referred to as “Investment Shares”) which will
then be matched with an award over shares
with the same pre-tax value as the monies
used to buy the shares;
• Matching Share Awards are an award over
a fixed number of shares that “matches” the
gross number of Investment Shares that the
directors have chosen to purchase using their
annual bonus. The executive directors each
invested their total net bonus for 2005, 2006
and 2007 in Pendragon shares, at purchase
prices of £1.24, £1.107 and £0.33 pence per
share respectively.
• Matching Share Awards will vest on the third
anniversary of their grant date (a) provided the
executive is still employed by Pendragon; (b) to
the extent that a performance condition has
been satisfied; and (c) to the extent that the
Investment Shares purchased by the executive
have been retained for the three years;
The 2006 Pendragon Long Term Incentive Plan (“LTIP”) operated during 2008 as the sole discretionary long term incentive plan for executive directors.
The key features of the LTIP are:
• Awards are subject to adjusted earnings per share (“EPS”) growth targets:
EPS growth per annum Vesting percentage
less than RPI + 4% 0%
RPI + 4% 30%
RPI + 10% or more 100%
between RPI + 4% and RPI + 10% straight-line vesting between 30% and 100%
adjusted EPS has been used because it is a key internal measure of long term company performance.
• additionally, under the LTIP, the executive may
be granted performance share awards worth
up to 100% of base salary per annum;
• the vesting of Performance Share Awards will
occur on the third anniversary of the grant
date, provided that the executive is still
employed by the Company and the same
performance conditions as described above
have been satisfied and
• The adjusted EPS growth targets for 2008
are underpinned by a requirement that the
Company’s total shareholder return (“TSR”)
outperforms the FTSE 350 total return
index over the performance period, with
TSR calculations being averaged over a three
monthly period prior to both the beginning
and end of the performance period.
Details of awards made to the incumbent executive directors are set out on page 35.
34

Pend
rago
n PL
CA
nnua
l Rep
ort
08
DIRECTORS’ REMUNERATION REPORTContinued
DIRECTORS’ LTIP AWARDS Directors’ LTIP Awards
Details of the conditional awards made to the executive directors under the LTIP are set out below:
Interests Awarded Exercised Lapsed Total Date of Total of all Vesting under LTIP on Interests Award Investment Date at 01.01.08 31.03.08 under LTIP Shares (subject to at 31.12.08 Purchased as conditions at 31.12.08 being satisfied)
T G Finn
Matching Shares 2008 - 336,828 - - 336,828 31.03.08 191,017 31.03.12
Performance Shares 2008 - 1,439,440 - - 1,439,440 31.03.08 n/a 31.03.12
Matching Shares 2007 176,222 - - - 176,222 15.03.07 297,001 15.03.10
Performance Shares 2007 419,580 - - - 419,580 15.03.07 n/a 15.03.10
Matching Shares 2006 329,100 - - - 329,100 09.05.06 196,270 09.05.09
Performance Shares 2006 359,020 - - - 359,020 09.05.06 n/a 09.05.09
M S Casha
Matching Shares 2008 - 187,129 - - 187,129 31.03.08 106,122 31.03.12
Performance Shares 2008 - 799,689 - - 799,689 31.03.08 n/a 31.03.12
Matching Shares 2007 97,901 - - - 97,901 15.03.07 152,787 15.03.10
Performance Shares 2007 233,100 - - - 233,100 15.03.07 n/a 15.03.10
Matching Shares 2006 162,355 - - - 162,355 09.05.06 96,825 09.05.09
Performance Shares 2006 199,355 - - - 199,355 09.05.06 n/a 09.05.09
D R Forsyth
Matching Shares 2008 - 130,991 - - 130,991 31.03.08 74,286 31.03.12
Performance Shares 2008 - 559,782 - - 559,782 31.03.08 n/a 31.03.12
Matching Shares 2007 68,530 - - - 68,530 15.03.07 115,063 15.03.10
Performance Shares 2007 163,170 - - - 163,170 15.03.07 n/a 15.03.10
Matching Shares 2006 127,250 - - - 127,250 09.05.06 75,890 09.05.09
Performance Shares 2006 139,620 - - - 139,620 09.05.06 n/a 09.05.09
H C Sykes
Matching Shares 2008 - 93,566 - - 93,566 31.03.08 53,062 31.03.12
Performance Shares 2008 - 399,844 - - 399,844 31.03.08 n/a 31.03.12
Matching Shares 2007 48,950 - - - 48,950 15.03.07 79,271 15.03.10
Performance Shares 2007 116,550 - - - 116,550 15.03.07 n/a 15.03.10
Matching Shares 2006 86,000 - - - 86,000 09.05.06 51,290 09.05.09
Performance Shares 2006 99,725 - - - 99,725 09.05.06 n/a 09.05.09
The details of the performance targets applying to all matching share and performance share awards under the LTIP are set out on page 34.
SHARE OPTIONS Share options
Executive directors have historically participated in the Pendragon 1999
Approved Executive Share Option Scheme, which is an HM Revenue
and Customs approved scheme, and the Pendragon 1999 Unapproved
Executive Share Option Scheme (the “Executive Schemes”), each of which
was approved at the Company’s 1999 Annual General Meeting. Options
become exercisable between three and ten years after grant subject to
fulfilment of the performance conditions which require the Company’s
adjusted earnings per share over the three consecutive financial years
beginning with the financial year in which the option is granted exceeding
by at best 3 percent per annum compound the increase in the Retail
Price Index over the same period. No variation has been made during
the financial year in the terms and conditions of the share options or the
Executive Schemes. No awards were made to executive directors under
the Executive Schemes during the year under review. The Committee
considers the ability to make awards under schemes of this type an
important feature of the Company’s overall portfolio of available incentives,
both at executive director and below board level. At its forthcoming annual
general meeting the Company is seeking shareholders’ approval to renew
the Expiring Schemes on substantially the same terms but updated in line
with market practice. Further details are provided on page 36.
35

Pend
rago
n PL
CA
nnua
l Rep
ort
08
DIRECTORS’ REMUNERATION REPORTContinued
DIRECTORS’ SHARE OPTIONS Directors’ share options (audited information)
At Number of Number of Number of At Exercise Exercise 01.01.08 options options options 31.12.08 price period lapsed exercised granted (pence) during year during year during year
T G Finn *27,355 - - - *27,355 60.4 01.07.10 to 31.12.10
M S Casha *27,355 - - - *27,355 60.4 01.07.10 to 31.12.10
D R Forsyth *14,450 - - - *14,450 24.56 01.07.10 to 31.12.10
H C Sykes *21,880 - - - *21,880 60.4 01.07.10 t0 31.12.10
Total 91,040 91,040
None of the directors exercised share options during 2008 and none were exercisable.
There have been no changes in directors’ share options outstanding or exercised since 31 December 2008.
* Sharesave options granted under the Pendragon 1998 Sharesave Scheme that have no performance conditions.
PROPOSED NEW SHARE PLANProposed new share plan
Pendragon 2009 Executive Shared Ownership Plan (“Plan” or “ExSOP”) It
is proposed to adopt a new executive share plan, in addition to the renewal
of the Expiring Schemes. This is a selective share incentive plan entailing the
recipient of an award acquiring, jointly with an employees’ trust, ordinary
shares in the Company and benefiting from growth in the market value of
the jointly-owned shares. Vesting of the Plan shares may, and, in the case of
executive directors, will be, made subject to performance conditions relating
to a minimum three year period. The ExSOP differs from an executive share
option in that, from the outset, the participant holds a restricted interest,
as joint owner, in Plan shares. A participant pays a nominal amount to
acquire such interest, rather than paying an option exercise price at time of
acquisition of the option shares. The Company’s approach to performance
targets is expected to be broadly the same as for the Company’s expiring
executive share option schemes, through the adoption of EPS growth, and,
where considered appropriate, TSR measures. These will be determined
and set when awards are made. A detailed description of the ExSOP will
be provided in the circular to shareholders accompanying the Notice of
Annual General Meeting, but in summary the key features are:
• individual participants may be invited to acquire (for a nominal payment),
jointly with an employee benefit trust, the beneficial interest in a number
of shares under the terms of a “joint ownership agreement”;
• participating team members benefit from any growth in the value of
Plan shares that exceeds the market value at the time of award, less a
contribution towards the cost of funding the initial acquisition of the Plan
shares (“carrying cost”) determined by the Company, and expected to
be the equivalent of no more than 5% per annum simple, accruing over
a three year period;
• specific performance targets relating to a minimum three year period,
and other vesting conditions, will be determined at the time of any award,
relative to role and seniority of the intended recipient, and will take into
account the cumulative effect of potential rewards he may receive under
awards made to him under other Company equity-related schemes in
respect of the same performance period.
Proposed Replacement Share Plans: The Pendragon 2009 Approved
Executive Share Option Scheme and the Pendragon 2009 Unapproved
Executive Share Option Scheme (“Replacement Executive Schemes”)
Proposed replacements for the Pendragon 1999 Approved Executive
Share Option Scheme (the Company’s existing HM Revenue and Customs
approved executive share option scheme) and the Pendragon 1999
Unapproved Executive Share Option Scheme (together the “Expiring
Schemes”).
The Committee proposes that a new HM Revenue and Customs approved
executive share option scheme and an new unapproved executive share
option scheme (together “Replacement Executive Schemes”), substantially
on the same terms as the Expiring Schemes, be adopted. A detailed
description of the Replacement Executive Schemes will be provided in
the circular to shareholders accompanying the Notice of Annual General
Meeting. However, their terms and features are substantially similar to
those of the Expiring Schemes, details of which are set out on page 34.
Both executive directors and below Board executives will be eligible to
participate in the Replacement Executive Schemes.
Although the Company has no current proposals to make awards to
executive directors either under the ExSOP or the Replacement Executive
Schemes, it is intended that, going forward, awards under any or all of
them may be made to executive directors as well as to below Board
level executives. Where awards are proposed to be made to executive
directors, under either the ExSOP or Replacement Executive Schemes, the
Company intends to consult shareholders as to the appropriateness of the
performance conditions to be adopted.
The incumbent directors’ beneficial interests in shares are displayed in the table on page 20 of the Report of the Directors.
36
Pend
rago
n PL
CA
nnua
l Rep
ort
08
DIRECTORS’ REMUNERATION REPORTContinued
SHARE PRICE INFORMATION AND PERFORMANCE Share price information and performance (not subject to audit)
There are no other share option or long term incentive schemes for which
the directors are eligible outside of those detailed above. The middle
market price of Pendragon PLC ordinary shares at 31 December 2008 was
1.65 pence and the range during the year was 1.4 pence to 42.75 pence.
DIRECTORS’ SERVICE CONTRACTS Directors’ service contracts
All four of the executive directors have service contracts that commenced
on 20 December 1999 and do not have an expiry date but can be
terminated on giving one year’s notice. The appointment to the Board of
any further executive directors would be expected to be on similar terms.
Compensation payable to directors in the event of loss of office is detailed
in the Report of the Directors on page 20.
Each of the executive directors’ contract includes protection for the
director in the event of a termination arising from a change of control.
These are more particularly detailed in the Report of Directors on page 20.
The Company continues to believe that these provisions are appropriate.
Copies of the individual contracts of appointment are available for inspection
by shareholders at the AGM.
NON-EXECUTIVE DIRECTORSNon-executive directors
Each non-executive director has a fixed two year contract, renewable
upon expiry at the Company’s discretion. When making a decision on
reappointment, the Board reviews the non-executive director’s attendance
and performance at meetings and the composition and skills of the Board
as a whole. Individual details of contracts are:
Name Commencement Expiry Unexpired Term (months)
Sir Nigel Rudd 01.01.09 31.12.10 20
J H Holt 01.01.08 31.12.09 8
M T Davies 01.01.09 31.12.10 20
D A L Joyce 01.01.08 31.12.09 8
M J Le May 01.01.08 31.12.09 8
Consistent with the policy for executive directors, the contracts include a
provision that the non-executive director will be entitled to a year’s total
fees and benefits if the contract is terminated by either party following a
change of control. Copies of the individual contracts of appointment are
available for inspection by shareholders at the AGM.
FEES FROM EXTERNAL DIRECTORSHIPS Fees from external directorship
None of the executive directors holds non-executive directorships at
other companies other than voluntary or honorary (that is, unpaid) offices.
Accordingly, no formal policy has been adopted to deal with whether or
not the executive director would be entitled to retain the fees from any
such position.
37

Pend
rago
n PL
CA
nnua
l Rep
ort
08
DIRECTORS’ REMUNERATION REPORT
Directors’ emoluments for the year to 31 December 2008 (audited information)
Salary/Fees Committee Bonus Benefits‡ Salary Total Total /Chair Fees supplement emoluments emoluments in lieu of 2008 2007 Pension Contribution £000 £000 £000 £000 £000 £000 £000
Executive directors
T G Finn 464 - - 51 121 636 730
M S Casha 258 - - 24 67 349 405
D R Forsyth 180 - - 26 47 253 293
H C Sykes 129 - - 16 33 178 207
Non-executive directors
Sir Nigel Rudd 160 - - - - 160 160
J H Holt 35 10 * - - - 45 45
M T Davies 35 5 ** - - - 40 40
D A L Joyce 35 - - - - 35 35
M J Le May 35 - - - - 35 35
Total 1,331 15 - 117 268 1,731 1,950
‡ Benefits include life assurance, private health cover, professional subscriptions, contribution to home telephone costs and the provision of two cars, one
of which is fully expensed.
* in relation to chairmanship of Audit Committee (£7,500) and senior non-executive director (£2,500).
** in relation to chairmanship of the Remuneration Committee.
Pension contributions paid in 2008 were £0 (2007: £0). Each executive director withdrew from the Pendragon Pension Plan during 2006.
DIRECTORS’ EMOLUMENTS
DIRECTORS’ PENSION ENTITLEMENTSDirectors’ pension entitlements (audited information)
Pensions The assets of the Pendragon Pension Plan, established for the
benefit of the Group’s eligible employees, are held by trustees separately
from those of the Group. The Plan operates through a trustee company of
which Mr W W Rhodes, a former non-executive director of the Company, is
the chairman. The management of the Plan’s assets is delegated to specialist
independent investment managers and there is no direct investment in
Pendragon PLC. During 2006, the executive directors withdrew from
the Plan. Mr Casha and Miss Sykes remain entitled to a deferred pension,
calculated up to the date of leaving the Plan. The non-executive directors
are not eligible to participate in the Pendragon Pension Plan.
£000 T G Finn M S Casha D R Forsyth H C Sykes
Total annual accrued pension entitlement at 31.12.07 (p.a) 392 136 69 44
Total annual accrued pension entitlement at 31.12.08(p.a) * 141 * 46
Increase in accrued pension during the year excluding inflation (p.a) 0 0 0 0
Increase in accrued pension during the year including inflation (p.a) 0 5 0 2
Transfer value of increase excluding inflation 0 0 0 0
Transfer value of accrued benefit at 31.12.07 7,130 2,059 629 338
Transfer value of accrued benefit at 31.12.08 * 1,920 * 302
Increase in transfer value over the year n/a (139) n/a (36)
*Mr D R Forsyth elected to transfer his accrued pension entitlement to another registered pension scheme on 27 November 2008. Mr T G Finn elected to take early retirement benefits on 8 February
2008; hence there are no transfer values of accrued benefits for these participants as at 31 December 2008.
The pension benefits shown are those which would be paid annually on
retirement, based on service up until the date the director withdrew from
the Plan. The benefits allow for any retained benefits which the directors
may have relating to previous employment.
The transfer values have been calculated on the basis of actuarial advice in
accordance with actuarial advice and exclude directors’ contributions. All
the above pension benefits exclude any additional pension purchased by
additional voluntary contributions.
38

Pend
rago
n PL
CA
nnua
l Rep
ort
08
DIRECTORS’ REMUNERATION REPORTContinued
TOTAL SHAREHOLDER RETURNTotal shareholder return (not subject to audit)
The graph below shows the growth in total shareholder return on the
Company’s shares in comparison to the FTSE 350 Index (excluding
investment companies. For the purposes of the graph, total shareholder
return has been calculated as the percentage change during the relevant
period in the market price of the shares, assuming that any dividends paid are
reinvested. The relevant period is the five years ending 31 December 2008.
A more detailed description of the total shareholder return calculation is
set out in the Notes.
180
160
140
120
100
80
60
40
20
0
2005 2006 2007 2008
Pendragon PLC FTSE350 Index Source: Thomson Datastream
1. This report is required, pursuant to the Regulations, to contain this graph as a visual interpretation of the share price performance against a comparator
stock market index.
2. Total Shareholder Return (“TSR”) is calculated over the period of five years ended on 31 December 2008 and reflects the theoretical growth in the
value of a shareholding over that period, assuming dividends are reinvested in shares in the Company. The price at which the dividends are reinvested
is assumed to be the amount equal to the closing price of the shares on the ex-dividend date plus the gross amount of annual dividend. The calculation
ignores tax and reinvestment charges. For each company in the index the TSR statistics are normalised to a common start point, which gives the
equivalent to investing the same amount of money in each company at that time. The percentage growth in TSR is measured over the chosen period. To
obtain the TSR growth of the relevant index over the chosen period, the weighted average TSR growth for all the companies in the index is calculated.
In this case, it is the FTSE350 Index (excluding investment companies) as explained in Note 3. The weighting is by reference to the market capitalisation
of each company in the index in proportion to the total market capitalisation of all the companies in the index at the end of the chosen measurement
period.
3. The FTSE 350 Index has been selected as it represents the equity market in which the Company was a constituent member for the majority of the five
year period.
Whilst reporting on remuneration issues, I am pleased to advise that below
Board level, 21% of the Company’s costs of employing its team members
related to team incentives, reflecting the performance culture that exists
throughout the Company. In addition as at 31 December 2008, 15.72%
of the Company’s team members were participants in one or more of its
share based incentive plans.
Mike Davies
Chairman of the Remuneration Committee
30 April 2009
39

Pend
rago
n PL
CA
nnua
l Rep
ort
08
The directors are responsible for preparing the Annual Report and the
group and parent company financial statements in accordance with
applicable law and regulations.
Company law requires the directors to prepare group and parent company
financial statements for each financial year. Under that law they are required
to prepare the group financial statements in accordance with IFRSs as
adopted by the EU and applicable law and have elected to prepare the parent
company financial statements in accordance with UK Accounting Standards
and applicable law (UK Generally Accepted Accounting Practice).
The group financial statements are required by law and IFRSs as adopted
by the EU to present fairly the financial position and the performance of
the Group. The Companies Act 1985 provides in relation to such financial
statements that references in the relevant part of that Act to financial
statements giving a true and fair value are references to their achieving a
fair presentation.
The parent company financial statements are required by law to give a true
and fair view of the state of affairs of the parent company.
In preparing each of the group and parent company financial statements,
the directors are required to:
• select suitable accounting polices and then apply them consistently;
• make judgements and estimates that are reasonable and prudent;
• for the group financial statements, state whether they have been
prepared in accordance with IFRSs as adopted by the EU;
• for the parent company financial statements, state whether applicable
UK Accounting Standards have been followed, subject to any material
departures disclosed and explained in the parent company financial
statements; and
• prepare the financial statements on the going concern basis unless it is
inappropriate to presume that the group and the parent company will
continue in business.
The directors are responsible for keeping proper accounting records that
disclose with reasonable accuracy at any time the financial position of the
parent company and enable them to ensure that its financial statements
comply with the Companies Act 1985. They have a general responsibility
for taking such steps as are reasonably open to them to safeguard the assets
of the Group and to prevent and detect fraud and other irregularities.
Under applicable law and regulations, the directors are also responsible
for preparing a Directors’ Report, Directors’ Remuneration Report and
Corporate Governance Statement that comply with that law and those
regulations.
The directors are responsible for the maintenance and integrity of the
corporate and financial information included on the Company’s website.
Legislation in the UK governing the preparation and dissemination of
financial statements may differ from legislation in other jurisdictions.
STATEMENT OF DIRECTORS’ RESPONSIBILITIES IN RESPECT OF THE ANNUAL REPORT AND THE FINANCIAL STATEMENTS
40

Pend
rago
n PL
CA
nnua
l Rep
ort
08
We have audited the group and parent company financial statements (the
‘’financial statements’’) of Pendragon PLC for the year ended 31 December
2008 which comprise Consolidated Income Statement, the Consolidated
and Parent Company Balance Sheets, the Consolidated Cash Flow Statement,
the Consolidated Statement of Recognised Income and Expense and the
related notes. These financial statements have been prepared under the
accounting policies set out therein. We have also audited the information
in the Directors’ Remuneration Report that is described as having been
audited.
This report is made solely to the Company’s members, as a body, in
accordance with section 235 of the Companies Act 1985. Our audit work
has been undertaken so that we might state to the Company’s members
those matters we are required to state to them in an auditor’s report and
for no other purpose. To the fullest extent permitted by law, we do not
accept or assume responsibility to anyone other than the Company and the
Company’s members as a body, for our audit work, for this report, or for
the opinions we have formed.
Respective responsibilities of directors and auditors
The directors’ responsibilities for preparing the Annual Report and
the group financial statements in accordance with applicable law and
International Financial Reporting Standards (IFRSs) as adopted by the
EU, and for preparing the parent company financial statements and the
Directors’ Remuneration Report in accordance with applicable law and
UK Accounting Standards (UK Generally Accepted Accounting Practice)
are set out in the Statement of Directors’ Responsibilities on page 40.
Our responsibility is to audit the financial statements and the part of the
Directors’ Remuneration Report to be audited in accordance with relevant
legal and regulatory requirements and International Standards on Auditing
(UK and Ireland).
We report to you our opinion as to whether the financial statements give
a true and fair view and whether the financial statements and the part of
the Directors’ Remuneration Report to be audited have been properly
prepared in accordance with the Companies Act 1985 and, as regards the
group financial statements, Article 4 of the IAS Regulation. We also report
to you whether in our opinion the information given in the Directors’
Report is consistent with the financial statements. The information given
in the Directors’ Report includes that specific information presented in the
Operational and Business Review that is cross referred from the Business
Review section of the Directors’ Report,
In addition we report to you if, in our opinion, the Company has not kept
proper accounting records, if we have not received all the information and
explanations we require for our audit, or if information specified by law
regarding directors’ remuneration and other transactions is not disclosed.
We review whether the Corporate Governance Statement reflects the
Company’s compliance with the nine provisions of the 2006 Combined
Code specified for our review by the Listing Rules of the Financial Services
Authority, and we report if it does not. We are not required to consider
whether the board’s statements on internal control cover all risks and
controls, or form an opinion on the effectiveness of the Group’s corporate
governance procedures or its risk and control procedures.
We read the other information contained in the Annual Report and
consider whether it is consistent with the audited financial statements.
We consider the implications for our report if we become aware of any
apparent misstatements or material inconsistencies with the financial
statements. Our responsibilities do not extend to any other information.
Basis of audit opinion
We conducted our audit in accordance with International Standards on
Auditing (UK and Ireland) issued by the Auditing Practices Board. An audit
includes examination, on a test basis, of evidence relevant to the amounts
and disclosures in the financial statements and the part of the Directors’
Remuneration Report to be audited. It also includes an assessment of
the significant estimates and judgments made by the directors in the
preparation of the financial statements, and of whether the accounting
policies are appropriate to the Group’s and Company’s circumstances,
consistently applied and adequately disclosed.
We planned and performed our audit so as to obtain all the information and
explanations which we considered necessary in order to provide us with
sufficient evidence to give reasonable assurance that the financial statements
and the part of the Directors’ Remuneration Report to be audited are free
from material misstatement, whether caused by fraud or other irregularity
or error. In forming our opinion we also evaluated the overall adequacy of
the presentation of information in the financial statements and the part of
the Directors’ Remuneration Report to be audited.
Opinion
In our opinion:
• the group financial statements give a true and fair view, in accordance with
IFRSs as adopted by the EU, of the state of the group’s affairs as at 31
December 2008 and of its loss for the year then ended;
• the group financial statements have been properly prepared in accordance
with the Companies Act 1985 and Article 4 of the IAS Regulation;
• the parent company financial statements give a true and fair view, in
accordance with UK Generally Accepted Accounting Practice, of the state
of the parent company’s affairs as at 31 December 2008;
• the parent company financial statements and the part of the Directors’
Remuneration Report to be audited have been properly prepared in
accordance with the Companies Act 1985; and
• the information given in the Directors’ Report is consistent with the
financial statements.
KPMG Audit Plc
Chartered Accountants, 2 Cornwall Street, Birmingham, B3 2DL.
Registered Auditor
30 April 2009
INDEPENDENT AUDITORS’ REPORT TO THE MEMBERS OF PENDRAGON PLC
41

Pend
rago
n PL
CA
nnua
l Rep
ort
08
CONSOLIDATED INCOME STATEMENTYear Ended 31 December 2008
Before Before non- Non- non- Non- recurring recurring 2008 recurring recurring 2007 £m £m £m £m £m £m
Revenue 4,025.5 136.9 4,162.4 5,024.1 36.1 5,060.2
Cost of sales (3,495.8) (123.4) (3,619.2) (4,354.5) (33.0) (4,387.5)
Gross profit 529.7 13.5 543.2 669.6 3.1 672.7
Operating expenses (503.9) (170.2) (674.1) (568.3) (17.1) (585.4)
Operating (loss) / profit before other income 25.8 (156.7) (130.9) 101.3 (14.0) 87.3
Other income - (losses) / gains on the sale of businesses
and property - (5.2) (5.2) - 18.5 18.5
Operating (loss) / profit 25.8 (161.9) (136.1) 101.3 4.5 105.8
Finance expense (83.0) (11.2) (94.2) (83.5) - (83.5)
Finance income 25.4 8.3 33.7 23.4 - 23.4
Net finance costs (57.6) (2.9) (60.5) (60.1) - (60.1)
Share of (loss) / profit before tax from joint venture 2.2 (6.2) (4.0) 1.2 - 1.2
Share of income tax expense from joint venture - - - (0.4) - (0.4)
Share of post tax profit from joint venture 2.2 (6.2) (4.0) 0.8 - 0.8
(Loss) / profit before taxation (29.6) (171.0) (200.6) 42.0 4.5 46.5
Income tax credit / (expense) 10.4 30.1 40.5 (9.2) 5.9 (3.3)
(Loss) / profit from continuing operations (19.2) (140.9) (160.1) 32.8 10.4 43.2
Discontinued operation
Loss from discontinued operation (net of income tax) - (2.1)
(Loss) / profit for the year (160.1) 41.1
Earnings per share
Basic (25.2)p 6.5p
Diluted (25.2)p 6.4p
Earnings per share continuing operations
Basic (25.2)p 6.8p
Diluted (25.2)p 6.7p
Notes
2
3
3
7
8
13
13
9
6
10
10
The notes on pages 46 to 94 form part of these financial statements
42

Pend
rago
n PL
CA
nnua
l Rep
ort
08
restated * 2008 2007 £m £m
Non-current assets
Property, plant and equipment 336.3 385.1
Goodwill 372.2 427.2
Other intangible assets 2.4 2.1
Derivative financial instruments 38.5 -
Deferred tax assets 25.1 -
Investment in joint venture - 4.0
Total non-current assets 774.5 818.4
Current assets
Inventories 655.8 786.5
Trade and other receivables 133.6 205.9
Cash and cash equivalents 154.6 52.6
Non-current assets classified as held for sale 37.3 59.7
Total current assets 981.3 1,104.7
Total assets 1,755.8 1,923.1
Current liabilities
Interest bearing loans and borrowings (82.2) (81.8)
Trade and other payables (922.5) (1,081.2)
Deferred income - (0.9)
Current tax payable (19.8) (13.5)
Provisions (33.4) (3.5)
Total current liabilities (1,057.9) (1,180.9)
Non-current liabilities
Interest bearing loans and borrowings (468.2) (297.2)
Derivative financial instruments - (5.6)
Deferred income (19.7) (20.2)
Deferred tax liabilities (29.1) (44.0)
Retirement benefit obligations (65.4) (58.8)
Provisions (6.6) (9.2)
Total non-current liabilities (589.0) (435.0)
Total liabilities (1,646.9) (1,615.9)
Net assets 108.9 307.2
Capital and reserves
Called up share capital 32.8 32.8
Share premium account 56.8 56.8
Capital redemption reserve 2.5 2.5
Other reserves 12.6 12.6
Translation reserve (1.7) (0.4)
Retained earnings 5.9 202.9
Total equity attributable to equity shareholders of the Company 108.9 307.2
Notes
12
11
11
18
9
13
14
15
25
31
17
16
30
19
17
18
30
9
28
19
20
21
21
21
21
21
Approved by the Board of directors on 30 April 2009 and signed on its behalf by :
T G Finn D R ForsythChief Executive Finance Director
CONSOLIDATED BALANCE SHEETat 31 December 2008
* see changes of accounting policy - note 1ad The notes on pages 46 to 94 form part of these financial statements
43

Pend
rago
n PL
CA
nnua
l Rep
ort
08
The notes on pages 46 to 94 form part of these financial statements
CONSOLIDATED CASH FLOW STATEMENTYear Ended 31 December 2008
2008 2007 £m £m
Cash flows from operating activities
(Loss) / profit for the year (160.1) 41.1
Adjustment for loss / (income) from joint venture 4.0 (0.8)
Adjustment for taxation (40.5) 3.3
Adjustment for net financing expense 60.5 60.9
(136.1) 104.5
Depreciation and amortisation 56.3 59.3
Share based payments 0.2 -
Loss/(profit) on sale of businesses and property 5.2 (18.0)
Impairment of property, plant and equipment 15.2 -
Impairment of assets held for sale 11.9 -
Goodwill impairment 58.1 6.8
Changes in inventories 77.0 80.1
Changes in trade and other receivables 68.1 55.0
Changes in trade and other payables (110.6) (109.6)
Changes in retirement benefit obligations (19.0) (18.9)
Changes in provisions 27.3 0.8
Cash generated from operations 53.6 160.0
Taxation refunds received / (taxation paid) 15.0 (4.8)
Interest received 11.0 1.3
Interest paid (75.1) (64.5)
Net cash from operating activities 4.5 92.0
Cash flows from investing activities
Business acquisitions, net of cash acquired - (16.3)
Proceeds from sale of businesses 7.7 20.6
Purchase of investment in joint venture - (0.2)
Purchase of property, plant, equipment and intangible assets (150.1) (163.8)
Proceeds from sale of property, plant and equipment 130.6 134.6
Payments for investments - (1.2)
Receipts from sales of investments 0.1 1.0
Net cash used in investing activities (11.7) (25.3)
Cash flows from financing activities
Payment of capital element of finance lease rentals (4.1) (5.4)
Repayment of unsecured bank loans (44.0) (20.0)
Repayment of loan notes - (7.8)
Proceeds from issue of unsecured loans 169.4 25.0
Dividends paid to shareholders (15.9) (25.4)
Net cash inflow / (outflow) from financing activities 105.4 (33.6)
Effects of exchange rate changes on cash held 3.8 (0.2)
Net increase in cash and cash equivalents 102.0 32.9
Cash and cash equivalents at 1 January 52.6 19.7
Cash and cash equivalents at 31 December 154.6 52.6
Notes
23
24
13
22
25
44
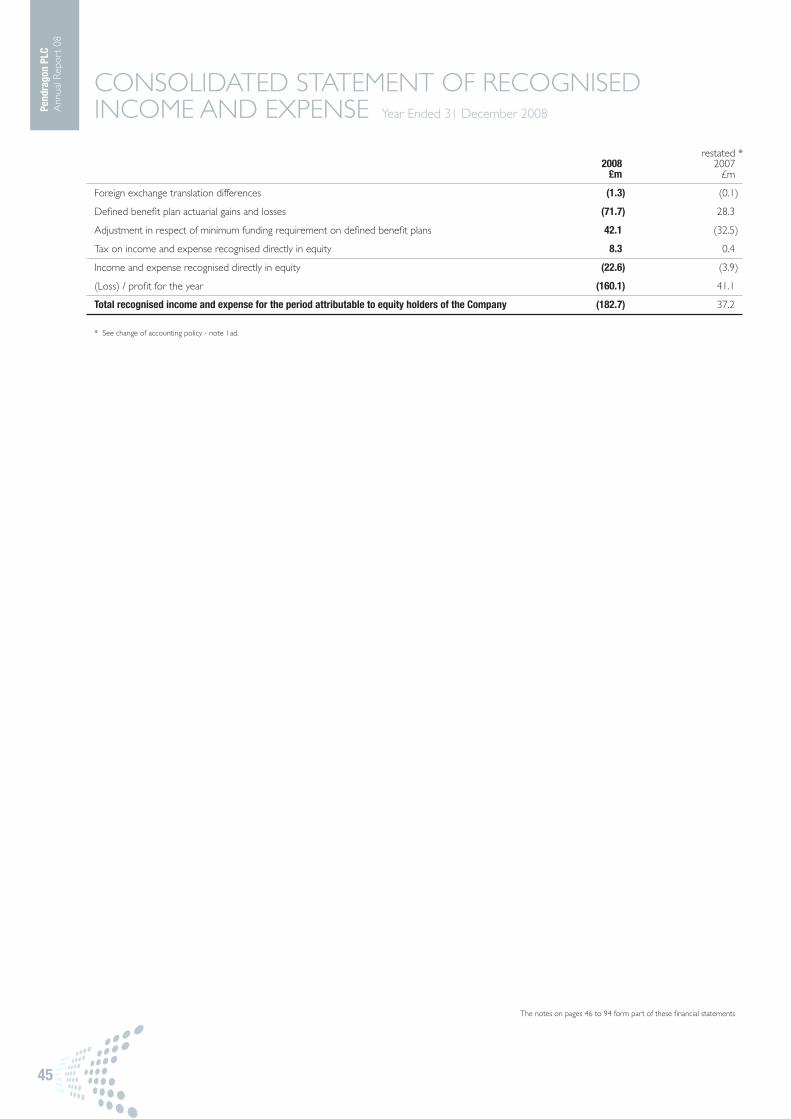
Pend
rago
n PL
CA
nnua
l Rep
ort
08
The notes on pages 46 to 94 form part of these financial statements
restated * 2008 2007 £m £m
Foreign exchange translation differences (1.3) (0.1)
Defined benefit plan actuarial gains and losses (71.7) 28.3
Adjustment in respect of minimum funding requirement on defined benefit plans 42.1 (32.5)
Tax on income and expense recognised directly in equity 8.3 0.4
Income and expense recognised directly in equity (22.6) (3.9)
(Loss) / profit for the year (160.1) 41.1
Total recognised income and expense for the period attributable to equity holders of the Company (182.7) 37.2
CONSOLIDATED STATEMENT OF RECOGNISED INCOME AND EXPENSE Year Ended 31 December 2008
* See change of accounting policy - note 1ad.
45

Pend
rago
n PL
CA
nnua
l Rep
ort
08
NOTES TO THE FINANCIAL STATEMENTS
Accounting policies
Pendragon PLC is a company domiciled in the United Kingdom. The consolidated financial statements of the Group for the year ended 31 December 2008
comprise the Company and its subsidiaries and the Group’s interest in jointly controlled entities.
(a) Statement of compliance The Group financial statements have been prepared and approved by the directors in accordance with International Financial
Reporting Standards as adopted by the EU (“adopted IFRSs”).
The Company has elected to prepare its parent company financial statements in accordance with UK GAAP, these are presented on pages 95 to 102.
(b) Basis of preparation The financial statements are presented in millions of UK pounds, rounded to the nearest £0.1million. They have been prepared
under the historical cost convention except for certain financial instruments which are stated at their fair value. In addition non-current assets held for sale
are stated at the lower of carrying amount and fair value less costs to sell.
The financial statements have been prepared on a going concern basis. In determining the appropriate basis of preparation of the financial statements, the
directors are required to consider whether the Group can continue in operational existence for the foreseeable future.
Further information in relation to the Group’s business activities, together with the factors likely to affect its future development, performance and position
is set out in the Operational and Business Review on pages 2 to 15.
As described in the directors’ report on page 17 the current economic environment is challenging and the Group has reported an operating loss for the
year. The directors consider that the outlook presents significant challenges in terms of sales volume and pricing as well as input costs and the directors
have instituted significant measures to reduce operating costs and preserve cash.
The financial position of the Group, its cashflows, liquidity position and borrowing facilities are described in the Operational and Business Review. In addition,
Note 18 to the financial statements includes the Group’s objectives, policies and processes for managing its capital, its financial risk management objectives,
details of its financial instruments and hedging activities and its exposures to credit, market and liquidity risk. Further details of the Group’s cash balances
and borrowings are included in Notes 17, 18 and 25 of the financial statements.
On 30 April 2009, the Group concluded facility negotiations with its lenders, as set out below. The directors have assessed the future funding requirements
of the Group and the Company and compared them to the level of committed available borrowing facilities. The assessment included a detailed review
of financial forecasts, financial instruments and hedging arrangements for the 14 months from the balance sheet date and a review of group cash flow
projections to December 2012. Recognising that a number of industries and especially the automotive sector continue to be affected by a sharp decline
in demand, the directors considered a range of potential scenarios within the key markets the Group serves and how these might impact on the Group’s
cash flow, facility headroom and banking covenants. The directors also considered what mitigating actions the Group could take to limit any adverse
consequences. The Group’s forecasts and projections, taking account of reasonably possible scenarios, show that the Group should be able to operate
within the level of its borrowing facilities for the foreseable future.
Having undertaken this work, the directors are of the opinion that the Company and the Group have adequate resources to continue in operational
existence for the foreseeable future. Accordingly they continue to adopt the going concern basis in preparing the annual report and accounts.
The preparation of financial statements in conformity with adopted IFRSs requires the use of estimates and assumptions that affect the reported amounts of
assets and liabilities at the date of the financial statements and the reported amounts of revenues and expenses during the reporting year. Although these
estimates are based on management’s best knowledge of the amount, events or actions, actual results ultimately may differ from those estimates.
The estimates and underlying assumptions are reviewed on an ongoing basis. Revisions to accounting estimates are recognised in the period in which the
estimate is revised if the revision affects only that period, or in the period of the revision and future periods if the revision affects both current and future
periods.
Judgements made by the directors in the application of accounting policies that have significant effect on the financial statements and estimates with a
significant risk of material adjustment in the next year are discussed in note 32.
1.
46

Pend
rago
n PL
CA
nnua
l Rep
ort
08
NOTES TO THE FINANCIAL STATEMENTSContinued
Accounting policies (continued)
(c) Basis of consolidation The consolidated financial statements include the financial statements of Pendragon PLC, all its subsidiary undertakings and the
Group’s share of its joint venture under the equity accounting method. Consistent accounting policies have been applied in the preparation of all such
financial statements including those of the joint venture.
(i) Subsidiaries
Subsidiaries are entities controlled by the Group. Control exists when the Group has the power, directly or indirectly, to govern the financial and operating
policies of an entity so as to obtain benefits from its activities. In assessing control, potential voting rights that presently are exercisable or convertible are
taken into account. The financial statements of subsidiaries are included in the consolidated financial statements from the date that control commences
until the date that control ceases.
(ii) Joint ventures
Joint ventures are those entities over whose activities the Group has joint control, established by contractual agreement and requiring unanimous consent
for strategic, financial and operating decisions. The consolidated financial statements include the Group’s proportionate share of the entities’ net assets and
profit after tax, on an equity accounted basis, from the date joint control commences until the date that joint control ceases.
(iii) Transactions eliminated on consolidation
Intragroup balances and any unrealised gains or losses or income and expenses arising from intragroup transactions, are eliminated in preparing the
consolidated financial statements. Unrealised gains and losses arising from transactions with joint ventures are eliminated against the investment to the
extent of the Group’s interest in the entity.
(d) Accounting for business combinations and disposals The results of companies and businesses acquired or disposed of during the year are included
from the effective date of acquisition or up to the effective date of disposal using the acquisition method of accounting. The purchase consideration is
allocated to assets and liabilities on the basis of fair value at the date of acquisition.
(e) Revenue Revenue from the sale of goods is recognised in the income statement, net of discounts, when the significant risks and rewards of ownership
have been transferred to the buyer. In general this occurs when vehicles or parts have been supplied or when service has been completed. Revenue from
services rendered is recognised in the income statement in proportion to the stage of completion of the transaction at the reporting date. The stage of
completion is assessed by reference to time expended on services that are charged on labour rate basis.
Where vehicles are supplied to a leasing company for contract hire purposes and the Group undertakes to repurchase the vehicle at a predetermined date
and value the significant risks and rewards of ownership are deemed not to have transferred outside the Group and consequently no sale is recognised. As
a result the accounting for the arrangement reflects the Group’s retention of the asset to generate future rentals and, in accordance with IAS 17 ‘Leases’, the
Group is being considered to be an operating lessor for all arrangements in place. The initial amounts received in consideration from the leasing company
are held as deferred income allocated between the present value of the repurchase commitment and a residual amount of deferred revenue, both amounts
being held within trade and other payables. A finance charge is accrued against the present value of the repurchase commitment and recorded as a
finance expense in the income statement. The remaining deferred revenue, which effectively represents rentals received in advance, is taken to the income
statement on a straight line basis over the related lease term. No additional disclosures are made under IAS 17 as there are no future rentals receivable.
These vehicles are held as plant and equipment at their cost to the Group and are depreciated to their residual values over the terms of the leases. Revenue
also comprises commissions receivable for arranging vehicle finance.
Profit in respect of warranty policies administered by the Group is recognised only on expiry of a policy, as prior to this the directors consider it appropriate
to defer income against the future warranty service costs of those policies.
(f) Non-recurring items Non-recurring items are those items that are unusual because of their size, nature or incidence. The Group’s management consider
that these items should be disclosed separately to enable a full understanding of the Group’s results.
1. cont
47

Pend
rago
n PL
CA
nnua
l Rep
ort
08
NOTES TO THE FINANCIAL STATEMENTSContinued
Accounting policies (continued)
(g) Intangible assets and goodwill
(i) All business combinations are accounted for by applying the purchase method. Goodwill represents the excess of the cost of acquisition over the net fair
value of the identifiable assets, liabilities and contingent liabilities of the acquired subsidiary undertakings at the effective date of acquisition and is included
in the balance sheet under the heading of intangible assets. The goodwill is allocated to cash generating units and an impairment test is performed annually.
Goodwill is then held in the balance sheet at cost less any accumulated impairment losses.
If the cost on acquisition is less than the net fair value of the identifiable assets, liabilities and contingent liabilities acquired the difference is recognised directly
in the consolidated income statement.
Adjustments are applied to bring the accounting policies of the acquired businesses into alignment with those of the Group. The costs associated with
reorganising or restructuring are charged to the post acquisition income statement. For those acquisitions made prior to 1 January 2004, goodwill is
recorded on the basis of its deemed cost which represented its carrying value as at 1 January 2004 under UK GAAP. Fair value adjustments are made in
respect of acquisitions. If at the balance sheet date the fair value of the acquiree’s identifiable assets, liabilities and contingent liabilities can only be established
provisionally then these values are used. Any adjustments to these values made within 12 months of the acquisition date are taken as adjustments to
goodwill.
(ii) Internally generated intangible assets relate to development activities that involve the development of dealer management software by the Group’s
Pinewood division. Development expenditure is capitalised only if development costs can be measured reliably, the product is technically and commercially
feasible, future economic benefits are probable and the Group intends to and has sufficient resources to complete development and to use or sell the asset.
The expenditure capitalised includes the costs of labour and overhead costs that are directly attributable to preparing the asset for its intended use.
Capitalised development expenditure is measured at cost less accumulated amortisation and accumulated impairment losses.
(iii) Intangible assets other than goodwill are stated at cost less accumulated amortisation and any impairment losses. This category of asset includes
purchased computer software and internally generated intangible assets which are amortised by equal instalments over four years and the fair value of the
benefit of forward sales orders assumed on acquisition, which is amortised by reference to when those orders are delivered.
(iv) Subsequent expenditure on capitalised intangible assets is capitalised only when it increases the future economic benefits embodied in the specific asset
to which it relates. All other expenditure is expensed as incurred.
Intangible assets arising on an acquisition are recognised separately from goodwill if the fair value of the asset can be identified separately and measured
reliably. Amortisation is calculated on a straight line basis over the estimated useful life of the intangible asset. Amortisation methods and useful lives are
reviewed annually and adjusted if appropriate.
(h) Property, plant and equipment Freehold land is not depreciated. Depreciation is provided to write off the cost less the estimated residual value of other
assets by equal instalments over their estimated useful economic lives. On transition to IFRS as at 1 January 2004, all land and buildings were restated to
fair value as permitted by IFRS 1, which is then treated as the deemed cost. All other assets are initially measured and recorded at cost.
Depreciation rates are as follows:
Freehold buildings – 2% per annum
Leasehold property improvements – 2% per annum or over the period of the lease if less than 50 years
Fixtures, fittings and office equipment – 10 – 20% per annum
Plant and machinery – 10 – 33% per annum
Motor vehicles – 20 – 25% per annum
Motor vehicles held for contract hire depreciated to their residual value over the period of their lease.
The residual value of all assets, depreciation methods and useful economic lives, if significant, are reassessed annually.
1. cont
48
Pend
rago
n PL
CA
nnua
l Rep
ort
08
NOTES TO THE FINANCIAL STATEMENTSContinued
1. cont Accounting policies (continued)
The Group recognises in the carrying amount of an item of property, plant and equipment the cost of replacing part of such an item when that cost is
incurred if it is possible that the future economic benefits embodied with the item will flow to the Group and the cost of the item can be measured reliably.
All other costs are recognised in the income statement as an expense as incurred.
Gains and losses on disposal of an item of property, plant and equipment are determined by comparing the proceeds from disposal with the carrying
amount of property, plant and equipment and are recognised net within ‘other income’ in the income statement.
(i) Non-current assets held for sale Non-current assets that are expected to be recovered primarily through sale rather than through continuing use are
classified as held for sale. Immediately before classification as held for sale, the assets are remeasured in accordance with the Group’s accounting policies.
Thereafter the assets are measured at the lower of their carrying amount and fair value less costs to sell. Impairment losses on remeasurement are
recognised in the income statement. Gains are not recognised in excess of any cumulative impairment loss. Non-current assets classified as held for sale
are available for immediate sale and a resultant disposal is highly probable within one year.
(j) Impairment The carrying amounts of the Group’s assets, other than inventories (see accounting policy k) and deferred tax assets (see accounting policy
p), are reviewed at each balance sheet date to determine whether there is any indication of impairment. If any such indication exists, the asset’s recoverable
amount is estimated.
For goodwill the recoverable amount is estimated at each balance sheet date. The recoverable amount is the higher of fair value less costs to sell and value
in use. In assessing value in use, the estimated future cash flows are discounted to their present value using a pre-tax discount rate that reflects current
market assessments of the time value of money and the risks specific to the asset for which the estimates of future cash flows have not been adjusted.
For the purpose of impairment testing, assets are grouped together into the smallest group of assets that generates cash inflows from continuing use that
are largely independent of the cash inflows from other groups of assets (‘the cash generating unit’). The goodwill acquired in a business combination, for
the purpose of impairment testing is allocated to cash generating units. Management have determined that the cash generating units of the Group are the
motor franchise groups and other business divisions.
An impairment loss is recognised whenever the carrying amount of an asset or its cash-generating unit exceeds its recoverable amount. Impairment losses
are recognised in the income statement.
Impairment losses recognised in respect of cash-generating units are allocated first to reduce the carrying amount of any goodwill allocated to cash-
generating units and then, to reduce the carrying amount of the other assets in the unit on a pro-rata basis.
The recoverable amount of assets is the greater of their fair value less costs to sell and value in use. In assessing value in use, the estimated future cash
flows are discounted to their present value using a pre-tax discount rate that reflects current market assessments of the time value of money and the risks
specific to the asset. For an asset that does not generate largely independent inflows, the recoverable amount is determined for the cash-generating unit
to which the asset belongs.
An impairment loss in respect of goodwill is not reversed.
In respect of other assets, an impairment loss is reversed if there has been a change in the estimates used to determine the recoverable amount.
An impairment loss is reversed only to the extent that the asset’s carrying amount does not exceed the carrying amount that would have been determined,
net of depreciation or amortisation, if no impairment loss had been recognised.
The impact of the current year impairment review can be seen in note 11.
49

Pend
rago
n PL
CA
nnua
l Rep
ort
08
NOTES TO THE FINANCIAL STATEMENTSContinued
1. cont Accounting policies (continued)
(k) Inventories
(i) Consignment vehicles are regarded as being effectively under the control of the Group and are included within inventories on the balance sheet as the
Group has the significant risks and rewards of ownership even though legal title has not yet passed. The corresponding liability is included in trade and
other payables.
(ii) Motor vehicles (including consignment and demonstrator vehicles) and parts inventories are stated at the lower of cost and fair value less costs to sell.
Parts inventories are based on an average purchase cost principle and are written down to net realisable value by providing for obsolescense on a time in
stock based formula approach.
(l) Trade and other receivables Trade and other receivables are recognised initially at fair value and are subsequently stated at amortised cost using the
effective interest method, less any impairment losses.
(m) Trade and other payables Trade and other payables are recognised initially at fair value and are subsequently stated at amortised cost using the effective
interest method, less any impairment losses.
(n) Cash and cash equivalents For the purposes of the cash flow statement, cash and cash equivalents comprise deposits with banks and financial
institutions, bank and cash balances, and liquid investments, net of bank overdrafts. Bank overdrafts that are repayable on demand and form an integral part
of the Group’s cash management are included as a component of cash and cash equivalents for the purpose of the statement of cash flows. In the balance
sheet, bank overdrafts are included in current borrowings.
(o) Provisions A provision is recognised if as a result of a past event the Group has a present legal or constructive obligation that can be estimated reliably,
and it is probable that an outflow of economic benefits will be required to settle the obligation. Provisions are determined by discounting the expected
future cash flows at a pre-tax rate that reflects current market assessments of the time value of money and the risks specific to the liability.
(i) Warranty service provision: A provision for warranties is recognised when the warranty service is sold. The provision is based on historical warranty data
and a weighting of all possible outcomes against their associated probabilities.
(ii) Vacant property provision: A provision for vacant properties is recognised when the expected benefits to be derived by the Group from a contract are
lower than the unavoidable cost of meeting its obligation under the contract. The provision is measured at the present value of the lower of the expected
cost of terminating the contract and the expected net cost of continuing with the contract.
(p) Income tax Income tax comprises current and deferred tax. Income tax is recognised in the income statement except to the extent that it relates to
items recognised directly in equity, in which case it is recognised in equity.
Current tax is the expected tax payable on the taxable income for the year, using tax rates enacted or substantively enacted at the balance sheet date, and
any adjustment to tax payable in respect of previous years.
Deferred tax is recognised using the balance sheet liability method, recognising temporary differences between the carrying amounts of assets and liabilities
for financial reporting purposes and the amounts used for taxation purposes. The following temporary differences are not recognised: initial recognition
of goodwill, the initial recognition of assets or liabilities in a transaction that is not a business combination that affect neither accounting nor taxable profit,
and differences relating to investments in subsidiaries to the extent that they will probably not reverse in the foreseeable future. The amount of deferred
tax recognised is based on the expected manner of realisation or settlement of the carrying amount of assets and liabilities, using tax rates enacted or
substantively enacted at the balance sheet date.
A deferred tax asset is recognised only to the extent that it is probable that future taxable profits will be available against which the asset can be utilised.
Deferred tax assets are reduced to the extent that it is no longer probable that the related tax benefit will be realised.
Additional income taxes that arise from the distribution of dividends are recognised at the same time as the liability to pay the related dividend.
50

Pend
rago
n PL
CA
nnua
l Rep
ort
08
NOTES TO THE FINANCIAL STATEMENTSContinued
1. cont Accounting policies (continued)
(q) Discontinued operations A discontinued operation is a component of the Group’s business that represents a separate major line of business or
geographical area of operations that has been disposed. Classification as a discontinued operation occurs upon disposal or when the operation meets
the criteria to be classified as held for sale, if earlier. When an operation is classified as a discontinued operation, the comparative income statement is re-
presented as if the operation had been discontinued from the start of the comparative period.
(r) Earnings per share The Group presents basic and diluted earnings per share (eps) data for its ordinary shares. Basic eps is calculated by dividing the
profit or loss attributable to ordinary shareholders of the Company by the weighted average number of ordinary shares outstanding during the period.
Diluted eps is determined by adjusting the profit and loss attributable to ordinary shareholders and the weighted average number of ordinary shares
outstanding for the effects of all dilutive potential ordinary shares, which comprise of share options granted to employees.
(s) Foreign currencies
(i) Foreign currency transactions. Transactions in foreign currencies are translated to the respective functional currency of Group entities at the foreign
exchange rate ruling at the date of the transaction. Monetary assets and liabilities denominated in foreign currencies at the balance sheet date are translated
to the functional currency at the foreign exchange rate ruling at that date. Non-monetary assets and liabilities that are measured in terms of historical
cost in a foreign currency are translated using the exchange rate at the date of the transaction. Non-monetary assets and liabilities denominated in foreign
currencies that are stated at fair value are translated to sterling at foreign exchange rates ruling at the dates the fair value was determined. Foreign currency
differences arising on retranslation are recognised in profit or loss.
(ii) Financial statements of foreign operations. The assets and liabilities of foreign operations, including goodwill and fair value adjustments arising on
consolidation, are translated to sterling at foreign exchange rates ruling at the balance sheet date. The revenues and expenses of foreign operations are
translated to sterling at rates approximating to the foreign exchange rates ruling at the dates of the transactions.
(iii) Net investment in foreign operations. Foreign currency differences arising on the retranslation of a financial liablity designated as a hedge of a net
investment in a foreign operation are recognised directly in equity, in the foreign currency translation reserve, to the extent the hedge is effective. To the
extent the hedge is ineffective, such differences are recognised in profit or loss. When the hedged net investment is disposed of, the cumulative amount in
equity is transferred to profit and loss on disposal.
In respect of all foreign operations, any differences that have arisen after 1 January 2004, the date of transition to IFRS, are presented as a separate
component of equity.
(t) Financial instruments The Group holds derivative financial instruments to hedge currency and interest risks arising from its activities.
Derivative financial instruments are recognised at fair value. Any gain or loss on remeasurement is recognised in the income statement. However, the
treatment of gains or losses arising from derivatives which qualify for hedge accounting depends on the type of hedge arrangement. The fair value of
derivatives is the estimated amount receivable or payable to terminate the contract determined by reference to the market prices prevailing at the balance
sheet date.
Hedging
(i) Fair value hedges
Where a derivative financial instrument hedges the changes in fair value of recognised assets or liabilities, any gain or loss is recognised within finance costs
or finance income, as appropriate, in the income statement. The hedged item is also stated, separately from the derivative, at fair value in respect of the
risk being hedged with any gain or loss also recognised within finance costs or finance income, as appropriate, in the income statement. This will result in
variations in the balance sheet values of the gross debt and the offsetting derivatives as the market value fluctuates. If the hedging instrument no longer
meets the criteria for hedge accounting or is terminated then hedge accounting is discontinued prospectively.
(ii) Hedges of net investments in overseas operations
A gain or loss in respect of an effective hedge of a net investment in an overseas operation is recognised directly in equity. Any ineffective portion of the
hedge is recognised in the income statement.
51

Pend
rago
n PL
CA
nnua
l Rep
ort
08
NOTES TO THE FINANCIAL STATEMENTSContinued
1. cont Accounting policies (continued)
Non-derivative financial instruments
Non-derivative financial instruments comprise investments in equity and debt securities, trade and other receivables, cash and cash equivalents, loans and
borrowings, and trade and other payables.
Non-derivative financial instruments are recognised initially at fair value. Subsequent to initial recognition non-derivative financial instruments are measured
as described below.
A financial instrument is recognised if the Group becomes a party to the contractual provisions of the instrument. Financial assets are derecognised if the
Group’s contractual rights to the cash flows from the financial asset expires. Financial liabilities are derecognised if the Group’s obligations specified in the
contract expire or are discharged and cancelled. See also policy (n) and (o) above.
Cash and cash equivalents comprise cash on hand and demand deposits, and other short-term highly liquid investments that are readily convertible to a
known amount of cash and are subject to an insignificant risk of changes in value.
(u) Interest-bearing borrowings Interest-bearing borrowings are recognised initially at fair value less attributable transaction costs. Subsequent to initial
recognition, interest-bearing borrowings are stated at amortised cost with any difference between cost and redemption value being recognised in the
income statement over the period of the borrowings on an effective interest basis. The effective interest basis is a method of calculating the amortised cost
of a financial liability and of allocating interest payments over the relevant period. The effective interest rate is the rate that exactly discounts estimated
future cash payments through the expected life of the financial liability, or where appropriate, a shorter period.
(v) Finance income and expense Finance income comprises interest income on funds invested and gains on hedging instruments that are recognised in
profit and loss. Interest income is recognised as it accrues in profit and loss, using the effective rate method.
Finance expense comprise interest expense on borrowings, unwinding of the discount on provisions and losses on hedging instruments recognised in profit
and loss. All borrowing costs are recognised in profit and loss using the effective interest method.
(w) Employee benefits – pension obligations The Group operates a number of defined benefit and defined contribution plans, the assets of which are held
in independent trustee administered funds. Pension accounting costs for defined benefit plans are assessed by determining the pension obligation using
the projected unit credit method after including a credit for the expected return on plan assets separately for each plan. Under this method, in accordance
with the advice of qualified actuaries, the amounts charged in respect of employee benefits reflect the cost of benefits accruing in the year and the cost of
financing historical accrued benefits. The Group recognises all actuarial gains and losses arising from defined benefit plans in the statement of recognised
income and expense immediately.
The present value of pension obligations is measured by reference to market yields on high quality corporate bonds which have terms to maturity
approximating to the terms of the related pension liability. Plan assets are measured at fair value. When the calculation results in a benefit to the Group,
the recognised asset is limited to the total of the present value of economic benefits available in the form of any future refunds from the plan or reductions
in future contributions to the plan. An economic benefit is available to the Group if it is realisable during the life of the plan, or on settlement of the plan
liabilities.
A defined benefit contribution plan is one under which the Group pays fixed contributions and has no legal or constructive obligation to pay further
amounts. Obligations for contributions to defined contribution pension plans are recognised as an employee benefit expense in the income statement
when they are due.
Surpluses in schemes are recognised as assets only if they represent unconditional economic benefits available to the Group in the future. Provision is made
for future unrecognisable surpluses that will arise as a result of regulatory funding requirements. Movements in unrecognised surpluses are included in the
statement of recognised income and expense. If the fair value of the assets exceeds the present value of the defined benefit obligation then the surplus will
only be recognised if the nature of the arrangements under the trust deed, and funding arrangements between the trustee and the Company support the
availability of refunds or recoverability through agreed reductions in future contributions. In addition, if there is a consecutive obligation for the Company
to pay deficit funding, this is also recognised.
52

Pend
rago
n PL
CA
nnua
l Rep
ort
08
NOTES TO THE FINANCIAL STATEMENTSContinued
1. cont Accounting policies (continued)
(x) Employee benefits – Share based payments The Group operates a number of employee share option schemes. The fair value at the date at which the
share options are granted is recognised in the income statement on a straight line basis over the vesting period, taking into account the number of options
that are expected to vest. The fair value of the options granted is measured using an option pricing model, taking into account the terms and conditions
upon which the options were granted. The number of options that are expected to become exercisable is reviewed at each balance sheet date and if
necessary estimates are revised. In accordance with the transitional provisions of IFRS 2, no income statement expenses are recorded in respect of grants
of share options made prior to 7 November 2002.
(y) Leases Leases are classified as finance leases wherever the lease transfers substantially all the risks and rewards of ownership to the Group. All other
leases are treated as operating leases.
Assets held under finance leases are recorded at inception at the lower of the fair value of the asset and the present value of the minimum payments
required to be made under the lease. Subsequent to initial recognition, the asset is accounted for in accordance with the accounting policy applicable to
that asset. The corresponding liability is recorded as a finance lease obligation. The finance charge element of rentals paid under these leases is expensed so
as to give a constant rate of finance charge on the remainder of the obligation. Finance charges are expensed in the income statement and the capitalised
leased asset is depreciated over the shorter of the lease term and the asset’s useful economic life.
Rentals paid under operating leases are charged directly to the income statement on a straight line basis over the period of the lease. Leases subject to
predetermined fixed rental uplifts have their rentals accounted for on a straight line basis recognised over the life of the lease. Lease incentives received
and paid are recognised in the income statement as an integral part of the total lease expense over the term of the lease.
(z) Dividends Final dividends proposed by the Board and unpaid at the end of the year are not recognised in the financial statements until they have been
approved by the shareholders at the AGM. Interim dividends are recognised when they are paid.
(aa) Capitalisation of finance costs Gross finance costs directly attributable to the construction of property, plant and equipment are capitalised as part of
the cost of those assets until such a time as the assets are substantially ready for their intended use or sale.
(ab) Segment reporting A business segment is a group of assets and operations engaged in providing products or services that are subject to risks and
returns that are different from those of other business segments. A geographic segment is engaged in providing products or services within a particular
economic environment that are subject to risks and returns that are different from those of segments operating in other economic environments. The
Group’s primary format for segmental reporting is based on business segments, determined based on the Group’s management and internal reporting
structure.
(ac) Own shares held by ESOP trust Transactions of the Group-sponsored ESOP trust are included in the group financial statements. In particular, the
trust’s purchases / sales of shares in the Company which are classified as own shares are debited / credited directly to equity. When own shares are sold or
re-issued, the amount received is recognised as an increase in equity and the resulting surplus or deficit on the transaction is transferred to / from retained
earnings.
(ad) Adoption of new and revised standards and new standards and interpretations not yet adopted In the current year, the Group has adopted the
following new standards and interpretations:
IFRIC 11 which refers to ‘IFRS 2 Group and Treasury Share Transactions’ which requires a share-based payment arrangement in which an entity receives
goods or services as consideration for its own equity instruments to be accounted for as an equity-settled share-based payment transaction. There has
been no impact upon the financial statements.
IFRIC 13 ‘Customer Loyalty Programmes’ addresses the accounting by entities who operate customer loyalty programmes with their customers which offer
free or discounted goods on redemption of credits. IFRIC 13 has not had any impact on the consolidated financial statements.
IAS 23 Revised ‘Borrowing costs’ removes the option to expense borrowing costs and requires that an entity capitalise borrowing costs directly attributable
to the acquisition, construction or production of a qualifying asset as a cost of that asset. The Group already capitalise borrowing costs as described above
in (aa).
53

Pend
rago
n PL
CA
nnua
l Rep
ort
08
NOTES TO THE FINANCIAL STATEMENTSContinued
1. cont Accounting policies (continued)
IFRIC 14 ‘IAS 19 The Limit on a Defined Benefit Asset, Minimum Funding Requirements and their Interaction’ clarifies when refunds or reductions in future
contributions in relation to defined benefit assets should be regarded as available and provides guidance on the impact of minimum funding requirements
(MFR) on such assets. It also addresses when a MFR might give rise to a liability. The adoption of IFRIC 14 required retrospective recognition and
comparatives have been restated accordingly.
The adoption of IFRIC 14 had the following impact on these financial statements:
Consolidated Statement of Recognised Income and Expense 2008 2007 £m £m
Increase / (decrease) in net income recognised directly in equity 30.3 (23.6)
Increase / (decrease) in total recognised income and expense for the year 30.3 (23.6)
Consolidated Balance Sheet 2008 2007 2006 £m £m £m
Cumulative decrease in retirement benefit obligations (2.9) (45.0) (12.5)
Cumulative increase in deferred tax asset 0.8 12.6 3.7
Cumulative decrease in retained earnings (2.1) (32.4) (8.8)
There is no impact on the Consolidated Income Statement and consequently no impact on earnings per share measurements.
The adoption of these interpretations has led to a change in the Group’s accounting policies in respect of employee benefits - pension obligations referred to in policy (w) above.
The following standards and interpretations have been published, endorsed by the EU, and are available for early adoption but have not yet been applied by the Group in these financial statements:
IFRS 8 ‘Operating segments’ introduces the ‘management approach’ to segment reporting. This will require the disclosure of segmental information based on the internal reports regularly reviewed by the board in order to assess each segment’s performance and allocate resources to them. IFRS 8 becomes effective for the Group’s 2009 financial statements. This standard amends the requirements for disclosure of segmental performance and will not have any effect on the Group’s overall reported results.
IFRS 8 requires entities to adopt the ‘management approach’ to reporting the financial performance of its operating segments similar to the requirements under the US standard SFAS 131, ‘Disclosures about Segments of an Enterprise and Related Information’. The amount of each operating segment item to be reported is the measure reported to the chief operating decision maker, which in some instances will be non-GAAP. IFRS 8 will require the Group to provide an explanation of the basis on which the segment information is prepared and a reconciliation to the amount recognised in the Group’s consolidated financial statements. The Group is currently assessing the impact of these amendments on its presentation of the financial statements.
Revised IAS 1 ‘Presentation of Financial Statements (2007)’ introduces the term total comprehensive income, which represents changes in equity during a period other than those changes resulting from transactions with owners in their capacity as owners. The new statement of comprehensive income may be presented as either a single statement of comprehensive income which combines the requirements of the existing income statement and statement of recognised income and expense, or in an income statement and a separate statement of comprehensive income. Revised IAS1, which becomes mandatory for the Group’s 2009 consolidated financial statements, is expected to have an impact on the presentation of the consolidated financial statements. The Group has yet to decide on whether to present combined or separate statements.
Amendment to IFRS 2 ‘Share-based Payment - Vesting Conditions and Cancellations’ clarifies the definition of vesting conditions, introduces the concept of non-vesting conditions, requires non-vesting conditions to be reflected in grant date fair value and provides the accounting treatment for non-vesting conditions and cancellations. The amendments to IFRS 2 will become mandatory for the Group’s 2009 consolidated financial statements, with retrospective application. The Group has yet to determine the potential effect of the amendment.
The following have been published but have not yet been endorsed by the EU:
IFRIC 12 ‘Service Concession Arrangements’ provides guidance on certain recognition and measurement issues that arise in accounting for public-to-private service concession arrangements. There will be no impact upon the financial statements.
54

Pend
rago
n PL
CA
nnua
l Rep
ort
08
NOTES TO THE FINANCIAL STATEMENTSContinued
1. cont Accounting policies (continued)
IFRIC 16 ‘Hedges of a Net Investment in a Foreign Operation’. There will be no impact upon the financial statements.
Amendments to IAS 32 ‘Financial Instruments : Presentation’ and IAS 1 ‘Presentation of Financial Statements - Puttable Financial Instruments and Obligations
Arising on Liquidation’ requires puttable instruments, and instruments that impose on the entity an obligation to deliver to another on a pro rata share of
the net assets of the entity only on liquidation, to be classified as equity if certain conditions are met. The amendments, which become mandatory for the
Group’s 2009 consolidated financial statements are not expected to have any impact on the consolidated financial statements.
Revised IFRS 3 ‘Business Combinations (2008)’ incorporates certain changes that amend the Group’s current accounting policies in respect of business
combinations, the main change being that transaction costs, other than share and debt issue costs, will be expensed as incurred. Revised IFRS 3 becomes
mandatory for the Group’s 2010 consolidated financial statements and will be applied prospectively.
Amendment to IAS 27 ‘Consolidated and Separate Financial Statements (2008)’ addresses changes in ownership interests in subsidiaries by the Group. The
amendments to IAS 27 becomes mandatory for the Group’s 2010 consolidated financial statements are not expected to have a significant impact on the
consolidated financial statements.
Amendment to IAS 39 ‘Financial Instruments : Recognition and Measurement’ permits reclassification of non-derivate financial assets out of the fair value
through profit or loss category in particular cirumstances. This amendment is not expected to have a significant impact on the consolidated financial
statements.
2. Segmental analysis
Segment information is presented in respect of the Group’s business and geographical segments. The primary format, business segments, is based on the
Group’s management and internal reporting structure.
Segment results, assets and liabilities include items directly attributable to a segment as well as those that can be allocated on a reasonable basis. Central
items comprise of mainly corporate assets and expenses, loans and borrowings.
Inter-segment transfers and transactions are entered into under normal commercial terms and conditions that would also be available to unrelated third
parties.
Segment capital expenditure is the total cost incurred during the period to acquire segment assets that are expected to be used for more than one
period.
Primary reporting format - business segments
The Group comprises the following main business segments:
Stratstone. This segment comprises the Group’s luxury car brand encompassing the sale of new and used motor cars and motorbikes, together with
associated aftersales activities of service, body repair and parts sales. The operation in the United States of America and the discontinued operation in
Germany are both reported within the Stratstone segment.
Evans Halshaw. This segment comprises the Group’s volume car brand encompassing the sale of new and used motor cars, together with associated
aftersales activities of service, body repair and parts sales.
Chatfields. This segment comprises the Group’s truck and commercial vans brand encompassing the sale of new and used trucks and commercial vehicles,
together with associated aftersales activities of service, body repair and parts sales.
Contracts. This segment comprises the Group’s contract hire activities.
Parts. This segment comprises the Group’s parts distribution businesses which trade under the Quickco name.
Technology. This segment comprises the Group’s activities as a dealer management system provider and shared service centre.
55
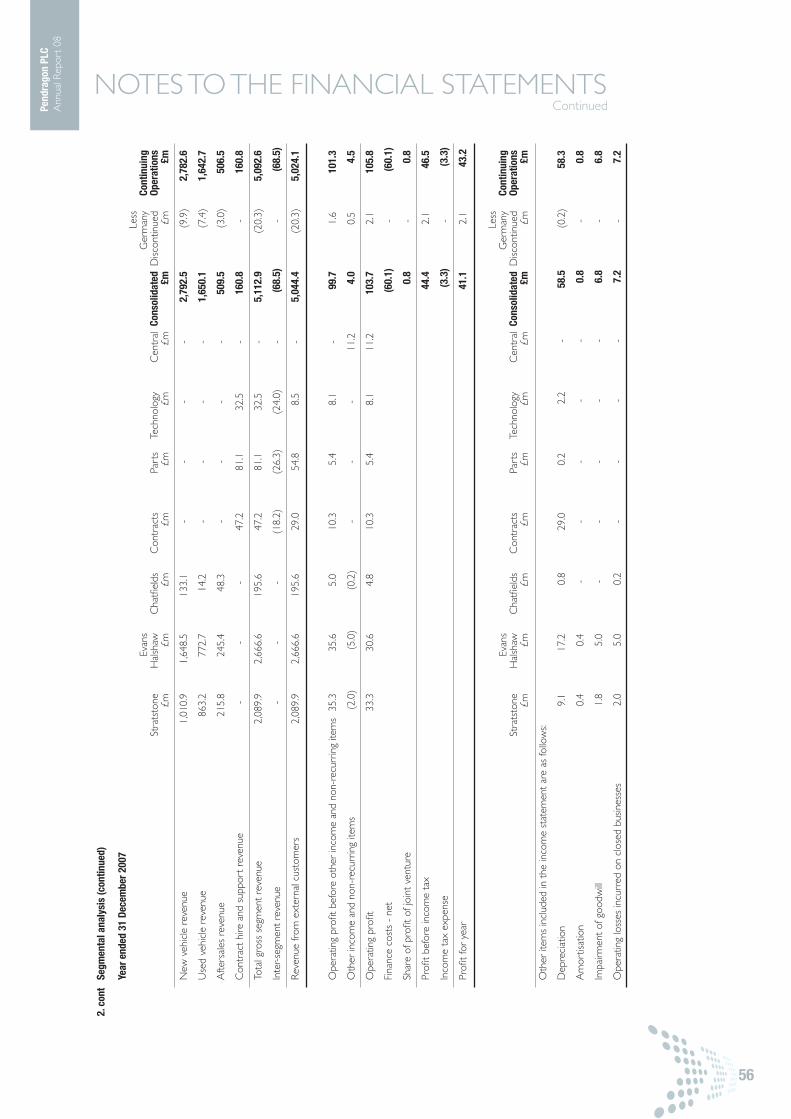
Pend
rago
n PL
CA
nnua
l Rep
ort
08
NOTES TO THE FINANCIAL STATEMENTSContinued
Segm
enta
l ana
lysi
s (c
ontin
ued)
Year
end
ed 3
1 De
cem
ber 2
007
Le
ss
Ev
ans
Ger
man
y Co
ntin
uing
St
rats
tone
H
alsh
aw
Cha
tfiel
ds
Con
trac
ts
Part
s Te
chno
logy
C
entr
al C
onso
lidat
ed D
iscon
tinue
d Op
erat
ions
£m
£m
£m
£m
£m
£m
£m
£m
£m
£m
New
veh
icle
rev
enue
1
,010
.9
1,6
48.5
1
33.1
-
-
-
-
2
,792
.5
(9.9
) 2,
782.
6
Use
d ve
hicl
e re
venu
e 86
3.2
7
72.7
1
4.2
-
-
-
-
1
,650
.1
(7.4
) 1,
642.
7
Afte
rsal
es r
even
ue
215.
8
245
.4
48.
3
-
-
-
-
509
.5
(3.0
) 50
6.5
Con
trac
t hi
re a
nd s
uppo
rt r
even
ue
-
-
-
4
7.2
81
.1
32.
5
-
1
60.8
-
160.
8
Tota
l gro
ss s
egm
ent
reve
nue
2,08
9.9
2
,666
.6
195
.6
47.
2
81.
1
32.
5
-
5
,112
.9
(20.
3)
5,09
2.6
Inte
r-seg
men
t re
venu
e -
-
-
(18
.2)
(26
.3)
(24
.0)
- (6
8.5)
-
(68.
5)
Rev
enue
from
ext
erna
l cus
tom
ers
2,0
89.9
2
,666
.6
195
.6
29.
0
54.
8
8.5
-
5,0
44.4
(2
0.3)
5,
024.
1
Ope
ratin
g pr
ofit
befo
re o
ther
inco
me
and
non-
recu
rrin
g ite
ms
35.
3
35.
6
5.0
10
.3
5.4
8
.1
-
9
9.7
1.
6 10
1.3
Oth
er in
com
e an
d no
n-re
curr
ing
item
s (
2.0)
(
5.0)
(
0.2)
-
-
-
11.
2
4.0
0.
5 4.
5
Ope
ratin
g pr
ofit
33.3
3
0.6
4
.8
10.
3
5.4
8
.1
11.
2
103
.7
2.1
105.
8
Fina
nce
cost
s -
net
(6
0.1)
-
(60.
1)
Shar
e of
pro
fit o
f joi
nt v
entu
re
0
.8
- 0.
8
Profi
t be
fore
inco
me
tax
44
.4
2.1
46.5
Inco
me
tax
expe
nse
(3
.3)
- (3
.3)
Profi
t fo
r ye
ar
41
.1
2.1
43.2
Le
ss
Ev
ans
Ger
man
y Co
ntin
uing
St
rats
tone
H
alsh
aw
Cha
tfiel
ds
Con
trac
ts
Part
s Te
chno
logy
C
entr
al C
onso
lidat
ed D
iscon
tinue
d Op
erat
ions
£m
£m
£m
£m
£m
£m
£m
£m
£m
£m
Oth
er it
ems
incl
uded
in t
he in
com
e st
atem
ent
are
as fo
llow
s:
Dep
reci
atio
n 9
.1
17.
2
0.8
2
9.0
0.
2 2.
2 -
58.
5
(0.2
)
58.
3
Am
ortis
atio
n 0.
4
0.4
-
-
-
-
-
0.8
-
0
.8
Impa
irmen
t of
goo
dwill
1.8
5
.0
-
-
-
-
-
6
.8
-
6.8
Ope
ratin
g lo
sses
incu
rred
on
clos
ed b
usin
esse
s 2
.0
5.0
0
.2
-
-
-
-
7.2
-
7
.2
2. c
ont
56

Pend
rago
n PL
CA
nnua
l Rep
ort
08
NOTES TO THE FINANCIAL STATEMENTSContinued
Segm
enta
l ana
lysi
s (c
ontin
ued)
Year
end
ed 3
1 De
cem
ber 2
008
Le
ss
Ev
ans
Ger
man
y Co
ntin
uing
St
rats
tone
H
alsh
aw
Cha
tfiel
ds
Con
trac
ts
Part
s Te
chno
logy
C
entr
al C
onso
lidat
ed D
iscon
tinue
d Op
erat
ions
£m
£m
£m
£m
£m
£m
£m
£m
£m
£m
New
veh
icle
rev
enue
6
73.2
1
,454
.0
117
.0
-
-
-
-
2,2
44.2
-
2,2
44.2
Use
d ve
hicl
e re
venu
e 6
51.6
5
96.7
1
1.5
-
-
-
-
1
,259
.8
-
1
,259
.8
Afte
rsal
es r
even
ue
181
.8
220
.5
46.
0
-
-
-
-
448
.3
-
4
48.3
Con
trac
t hi
re a
nd s
uppo
rt r
even
ue
-
-
-
3
9.6
7
6.8
25
.9
-
1
42.3
-
142
.3
Tota
l gro
ss s
egm
ent
reve
nue
1,5
06.6
2
,271
.2
174
.5
39.
6
76.
8
25.
9
-
4
,094
.6
-
4
,094
.6
Inte
r-seg
men
t re
venu
e -
-
-
(23
.1)
(28
.8)
(17
.2)
- (6
9.1)
-
(69.
1)
Rev
enue
from
ext
erna
l cus
tom
ers
1,5
06.6
2
,271
.2
174
.5
16.
5
48.
0
8.7
-
4,0
25.5
-
4,0
25.5
Ope
ratin
g pr
ofit
befo
re o
ther
inco
me
and
non-
recu
rrin
g ite
ms
(1.
1)
6.1
3
.6
8.7
1
.5
7.0
-
2
5.8
-
25.
8
Oth
er in
com
e an
d no
n-re
curr
ing
item
s (
56.9
) (
33.0
) (
13.2
)
(8.8
)
-
-
(50
.0)
(1
61.9
) -
(161
.9)
Ope
ratin
g (lo
ss)/
profi
t (
58.0
) (
26.9
)
(9.6
) (
0.1)
1
.5
7.0
(
50.0
)
(136
.1)
-
(1
36.1
)
Fina
nce
cost
s -
net
(6
0.5)
-
(60.
5)
Shar
e of
pro
fit o
f joi
nt v
entu
re
(4
.0)
-
(4
.0)
Loss
bef
ore
inco
me
tax
(2
00.6
) -
(200
.6)
Inco
me
tax
cred
it
40.
5
-
4
0.5
Loss
for
year
(160
.1)
-
(1
60.1
)
Le
ss
Ev
ans
Ger
man
y Co
ntin
uing
St
rats
tone
H
alsh
aw
Cha
tfiel
ds
Con
trac
ts
Part
s Te
chno
logy
C
entr
al C
onso
lidat
ed D
iscon
tinue
d Op
erat
ions
£m
£m
£m
£m
£m
£m
£m
£m
£m
£m
Oth
er it
ems
incl
uded
in t
he in
com
e st
atem
ent
are
as fo
llow
s:
Dep
reci
atio
n 8
.4
11.
6
0.7
3
4.3
-
0.6
-
55.
6
-
5
5.6
Am
ortis
atio
n 0
.3
0.4
-
-
-
-
-
0.7
-
0.7
Shar
e ba
sed
paym
ents
0
.1
0.1
-
-
-
-
-
0.2
-
0.2
Impa
irmen
t of
goo
dwill
33.
5
16.
3
5.8
2.5
-
-
-
58.
1
-
5
8.1
Impa
irmen
t of
pro
pert
y, pl
ant
and
equi
pmen
t 4
.5
2.0
-
6.3
-
- 2
.4
15.
2
- 1
5.2
Ope
ratin
g lo
sses
and
clo
sure
cos
ts in
curr
ed o
n cl
osed
bus
ines
ses
8.5
7
.6
-
-
-
-
3.6
1
9.7
-
19.
7
Impa
irmen
t of
ass
ets
held
for
sale
-
-
-
-
-
-
1
1.9
1
1.9
-
11.
9
Red
unda
ncy
cost
s -
-
-
-
-
-
5
.4
5.4
-
5.4
Inve
ntor
y w
rite
dow
n 1
0.4
7.
1 7.
4 -
-
- -
24.
9
- 2
4.9
Prof
essio
nal f
ees
-
-
-
-
-
-
1.5
1
.5
- 1
.5
VAT
ass
esss
men
t pr
ovisi
on
-
-
-
-
-
-
26.
8
26.
8
- 2
6.8
Exce
ptio
nal V
AT r
efun
d -
net
of c
osts
-
-
-
-
-
-
(
6.8)
(6
.8)
- (6
.8)
2. c
ont
57
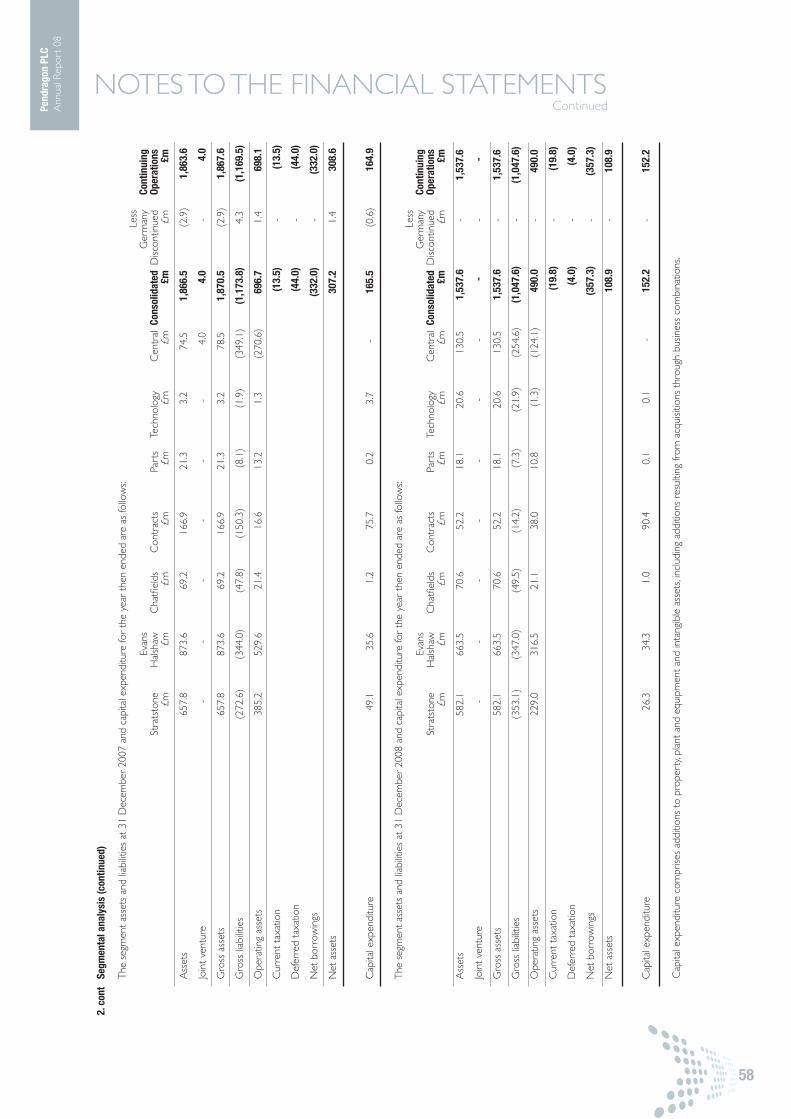
Pend
rago
n PL
CA
nnua
l Rep
ort
08
NOTES TO THE FINANCIAL STATEMENTSContinued
Segm
enta
l ana
lysi
s (c
ontin
ued)
The
seg
men
t as
sets
and
liab
ilitie
s at
31
Dec
embe
r 20
07 a
nd c
apita
l exp
endi
ture
for
the
year
the
n en
ded
are
as fo
llow
s:
Less
Evan
s
G
erm
any
Cont
inui
ng
Stra
tsto
ne
Hal
shaw
C
hatfi
elds
C
ontr
acts
Pa
rts
Tech
nolo
gy
Cen
tral
Con
solid
ated
Disc
ontin
ued
Oper
atio
ns
£m
£m
£m
£m
£m
£m
£m
£m
£m
£m
Ass
ets
657.
8 87
3.6
69.2
1
66.9
2
1.3
3
.2
74.
5
1,8
66.5
(
2.9)
1
,863
.6
Join
t ve
ntur
e -
-
-
-
-
-
4
.0
4.0
-
4.0
Gro
ss a
sset
s 6
57.8
8
73.6
6
9.2
1
66.9
2
1.3
3
.2
78.
5
1,8
70.5
(
2.9)
1
,867
.6
Gro
ss li
abilit
ies
(272
.6)
(34
4.0)
(
47.8
) (
150.
3)
(8.
1)
(1.
9)
(34
9.1)
(1
,173
.8)
4.3
(1
,169
.5)
Ope
ratin
g as
sets
38
5.2
5
29.6
2
1.4
1
6.6
1
3.2
1
.3
(27
0.6)
6
96.7
1
.4
698
.1
Cur
rent
tax
atio
n
(13.
5)
-
(1
3.5)
Def
erre
d ta
xatio
n
(44.
0)
-
(4
4.0)
Net
bor
row
ings
(332
.0)
-
(3
32.0
)
Net
ass
ets
3
07.2
1
.4
308
.6
Cap
ital e
xpen
ditu
re
49.1
35
.6
1.2
75.
7
0.2
3
.7
-
1
65.5
(
0.6)
1
64.9
The
seg
men
t as
sets
and
liab
ilitie
s at
31
Dec
embe
r 20
08 a
nd c
apita
l exp
endi
ture
for
the
year
the
n en
ded
are
as fo
llow
s:
Less
Evan
s
G
erm
any
Cont
inui
ng
Stra
tsto
ne
Hal
shaw
C
hatfi
elds
C
ontr
acts
Pa
rts
Tech
nolo
gy
Cen
tral
Con
solid
ated
Disc
ontin
ued
Oper
atio
ns
£m
£m
£m
£m
£m
£m
£m
£m
£m
£m
Ass
ets
582.
1 66
3.5
70.6
5
2.2
1
8.1
2
0.6
1
30.5
1
,537
.6
-
1
,537
.6
Join
t ve
ntur
e -
-
-
-
-
-
-
-
-
-
Gro
ss a
sset
s 58
2.1
6
63.5
7
0.6
5
2.2
1
8.1
2
0.6
1
30.5
1
,537
.6
-
1
,537
.6
Gro
ss li
abilit
ies
(35
3.1)
(
347.
0)
(49
.5)
(14
.2)
(7.
3)
(21
.9)
(25
4.6)
(1
,047
.6)
-
(1
,047
.6)
Ope
ratin
g as
sets
2
29.0
3
16.5
2
1.1
3
8.0
1
0.8
(
1.3)
(
124.
1)
490
.0
-
4
90.0
Cur
rent
tax
atio
n
(19.
8)
-
(19.
8)
Def
erre
d ta
xatio
n
(4.0
) -
(4.0
)
Net
bor
row
ings
(357
.3)
-
(357
.3)
Net
ass
ets
10
8.9
-
108
.9
Cap
ital e
xpen
ditu
re
26.
3
34.3
1.
0 9
0.4
0
.1
0.1
-
152
.2
-
1
52.2
2. c
ont
Cap
ital e
xpen
ditu
re c
ompr
ises
addi
tions
to
prop
erty
, pla
nt a
nd e
quip
men
t an
d in
tang
ible
ass
ets,
incl
udin
g ad
ditio
ns r
esul
ting
from
acq
uisit
ions
thr
ough
bus
ines
s co
mbi
natio
ns.
58

Pend
rago
n PL
CA
nnua
l Rep
ort
08
NOTES TO THE FINANCIAL STATEMENTSContinued
2. cont Accounting policies (continued)
Secondary reporting format - geographic segments
The Group’s business segments operate in two main geographical areas and are managed on a worldwide basis. These segments are the UK and the USA.
Due to the immaterial nature of the operations in the USA no further analysis is provided.
Net operating expenses and non-recurring items 2008 2007 £m £m
Net operating expenses:
Distribution costs (295.5) (363.9)
Administrative expenses (386.3) (222.0)
Exceptional VAT refund 6.8 -
Rents received 0.9 0.5
(674.1) (585.4)
3.
Expenses and income incurred or received during the year, which due to their size and nature of being items that are typically non-recurring, are drawn out
for separate disclosure as non-recurring items.
2008 2007 £m £m
Within operating expenses:
Goodwill impairment (58.1) (6.8)
Impairment of property, plant and equipment (15.2) -
Operating losses incurred on closed businesses (19.7) (7.2)
Impairment of assets held for sale (11.9) -
Redundancy costs (5.4) -
Inventory write down (24.9) -
Professional fees (1.5) -
VAT assessment provision (26.8) -
Exceptional VAT refund - net of costs 6.8 -
(156.7) (14.0)
Within other income - (losses) / gains on the sale of businesses and property:
Gains on the sale of businesses 0.9 1.1
(Losses) / gains on the sale of property (6.1) 17.4
(5.2) 18.5
Within finance expense:
Refinancing related professional costs and bank waiver fees (11.2) -
Within finance income:
Interest received on VAT refund 8.3 -
Within share of (loss) / profit before tax from joint venture:
Impairment of investment in joint venture (6.2) -
59

Pend
rago
n PL
CA
nnua
l Rep
ort
08
NOTES TO THE FINANCIAL STATEMENTSContinued
3. cont Net operating expenses and non-recurring items (continued)
The following amounts have been presented as non-recurring items in these financial statements:
Goodwill impaired during the year was £58.1m (2007: £6.8m) (see note 11).
Group tangible fixed assets and assets held for sale have been reviewed for possible impairments in the light of economic conditions, in particular the
significant fall in commercial property prices. As a result of this review, an impairment charge of £8.9m has been recognised against tangible fixed assets
(2007: £nil) and £11.9m against assets held for sale (2007: £nil).
Losses incurred on the closure of business amounted to £19.7m (2007: £7.2m). These costs include wind down expenses, losses on assets, redundancy
and vacant property occupancy costs.
The Group also undertook a significant programme of redundancies in its core businesses in light of market conditions as a result of the current economic
situation, resulting in non-recurring payments of £5.4m (2007: £nil).
A VAT refund of £6.8m net of costs in respect of VAT overpaid on demonstrator vehicles over the period 1973 to 1996 was received during the year.
Associated interest received of £8.3m is disclosed within finance income.
The Group is in continuing discussion with HM Revenue and Customs over the treatment of partial exemption within our finance and insurance operations
and the VAT treatment of sales of vehicles to certain disabled customers. We have received VAT assessments in respect of these issues, and received
advice that it is possible that the Group will not be succcessful defending these claims. Whilst we are continuing to defend our position vigorously, we have
recognised a provision of £26.8m for our best estimate of amounts payable in respect of these two issues, including potential interest and penalties.
During 2008, particularly the second half of the year, values of used cars fell dramatically resulting in certain stock suffering an exceptional loss in value
compared to its realisable value. In addition, given the dramatic fall in demand for certain types of new cars which resulted in significantly higher stock levels,
the cost of this stock was higher than its realisable value. This fall in value is unprecedented and is not expected to recur. A stock provision of £24.9m has
therefore been recognised in respect of these issues and presented as a non-recurring item. These conditions have also had a knock-on impact in our
Contract Hire business where the repurchase commitments in respect of vehicles at the end of the contract life has resulted in the need for an impairment
provision of £6.3m in respect of the vehicles which are classified in fixed assets.
During 2008 as previously announced we investigated the potential disposal of Pinewood. This disposal process did not proceed to completion and the
professional costs of £1.5m of the exercise have been written off as a non-recurring item.
Other income, being the profit on disposal of businesses and property comprises £0.9m profit on the disposal of motor vehicle dealerships (2007: £1.1m)
and a £6.1m loss on sale of properties (2007: £17.4m profit).
During the year the Group has incurred a fee of £2.9m in respect of deferral of covenant measurements at the year end as part of the bank refinancing
negotiations. Under IAS 39, this amount should be treated as modification of terms of the loan and as such be amortised over the life of the loan using the
effective interest rate method. Management consider there is no future economic benefit derived from this payment as it relates only to the deferral of
covenant measurements at December 2008 and as such have recorded this amount directly in the income statement as a non-recurring item. In addition
the non-recurring professional fees and costs of £8.3m in respect of the refinancing of the Group have been expensed in the year and presented as a
non-recurring item.
60

Pend
rago
n PL
CA
nnua
l Rep
ort
08
NOTES TO THE FINANCIAL STATEMENTSContinued
3. cont Net operating expenses and non-recurring items (continued)
Continuing Discontinued operations operations Total The following items have been charged to the income statement 2008 2007 2008 2007 2008 2007 as operating expenses during the year : £m £m £m £m £m £m
Depreciation of property, plant and equipment - owned 53.9 55.8 - 0.2 53.9 56.0
- held under finance leases 1.7 2.5 - - 1.7 2.5
Impairment of property, plant and equipment 15.2 - - - 15.2 -
Impairment of assets held for sale 11.9 - - - 11.9 -
Amortisation of internally generated intangible assets 0.3 0.1 - - 0.3 0.1
Amortisation of other intangible assets 0.4 0.7 - - 0.4 0.7
Impairment of goodwill 58.1 6.8 - - 58.1 6.8
Cost of inventories recognised as an expense 3,553.2 4,314.1 - 17.8 3,553.2 4,331.9
Research and development costs 0.7 0.3 - - 0.7 0.3
Operating lease rentals payable - hire of plant and machinery 2.4 3.3 - - 2.4 3.3
- property rentals 43.8 44.6 - 0.5 43.8 45.1
2008 2007 Auditors’ remuneration: £000 £000
Audit of these financial statements 287.2 169.3
Amounts receivable by the auditors and their associates in respect of:
Audit of financial statements of subsidiaries pursuant to legislation 298.8 225.4
Other services supplied pursuant to such legislation 30.0 25.0
Other services relating to taxation 289.6 106.9
Pension valuation and actuarial services - 575.2
Services relating to corporate finance transactions entered into (including debt refinancing) 1,844.8 -
All other services - 87.8
2,750.4 1,189.6
Of the above, £nil (2007: £nil) in relation to the corporate finance transactions entered into has been capitalised as part of the costs relating to these
transactions. £490,000 of corporate finance transactions were contracted for at the year end.
Employees
The average number of people employed by the Group in the following areas was: 2008 2007 Number Number
Sales 3,760 4,743
Aftersales 5,742 7,006
Administration 3,177 3,998
12,679 15,747
Costs incurred in respect of these employees were: 2008 2007 £m £m
Wages and salaries 291.9 346.1
Social security costs 28.0 33.0
Contributions to defined contribution plans 4.4 5.3
Decrease in liability for defined benefit plans (4.0) (4.2)
Share based payments 0.2 -
320.5 380.2
4.
61
Pend
rago
n PL
CA
nnua
l Rep
ort
08
NOTES TO THE FINANCIAL STATEMENTSContinued
Directors
Total emoluments of directors (including pension contributions) amounted to £1.7m (2007 : £2.0m).
Information relating to directors’ emoluments, share options and pension entitlements is set out in the Directors’ Remuneration Report on pages 32
to 39.
5.
Results of discontinued operation6.
2008 2007 £m £m
Revenue - 20.3
Expenses - (21.9)
Results from operating activities - (1.6)
Income tax expense - -
Results from operating activities net of income tax - (1.6)
Loss on sale of discontinued operation - (0.5)
Loss for the period - (2.1)
During the previous year, on 30 June 2007 the Group sold the trading assets of all its German based motor vehicle dealerships. The German operation
contributed a cash outflow of £2.9m to the Group’s net operating cash flows and contributed £5.2m in respect of investing activities during 2007. There
were no financing cash flows.
Finance expense 2008 2007 Recognised in profit and loss £m £m
Interest payable on bank borrowings 20.4 19.1
Interest payable on loan notes 9.6 9.4
Debt issuance costs 0.9 1.1
Refinancing related professional costs and bank waiver fees 11.2 -
Vehicle stocking plan interest 28.5 32.9
Interest payable on finance leases 0.5 0.6
Interest on pension scheme obligations 18.7 17.9
Less: interest capitalised (0.1) (0.1)
Total interest expense 89.7 80.9
Fair value losses - interest rate swaps 0.1 0.1
Unwinding of discounts in contract hire residual values 4.4 2.5
Total finance expense 94.2 83.5
Interest expense in respect of financial liabilities held at amortised cost 80.1 71.5
Interest expense in respect of financial liabilities held at fair value 9.6 9.4
Fair value losses - interest rate swaps 0.1 0.1
Unwinding of discounts in contract hire residual values 4.4 2.5
Total finance expense 94.2 83.5
Interest of £0.1m (2007: £0.1m) has been capitalised during the year at an average rate of 5.49% (2007: 6.52%) on assets under construction.
7.
62

Pend
rago
n PL
CA
nnua
l Rep
ort
08
NOTES TO THE FINANCIAL STATEMENTSContinued
Finance income 2008 2007 Recognised in profit and loss £m £m
Interest receivable on bank deposits 2.7 1.3
Interest on pension scheme assets 22.7 22.1
Exceptional interest income on VAT refund (note 3) 8.3 -
Total finance income 33.7 23.4
8.
Taxation 2008 2007 £m £m
UK corporation tax:
Current tax on (loss) / profit for the year (5.1) 9.5
Adjustments in respect of prior periods (3.7) (10.7)
(8.8) (1.2)
Overseas taxation:
Current tax on income for the year - 0.4
- 0.4
Total current tax credit (8.8) (0.8)
Deferred tax (credit) / expense:
Origination and reversal of temporary differences (10.2) 4.1
Benefit of tax losses recognised (21.5) -
(40.5) 3.3
9.
2008 2007 The total aggregate tax (credits) / charges recognised in the income statement are analysed as: £m £m
Current tax (8.8) (0.8)
Deferred tax (31.7) 4.1
Total income tax (credit) / expense in the income statement (40.5) 3.3
63

Pend
rago
n PL
CA
nnua
l Rep
ort
08
NOTES TO THE FINANCIAL STATEMENTSContinued
Taxation (continued)
Factors affecting the tax (credit) / charge for the period:
The tax assessed is different from the standard rate of corporation tax in the UK (28.5% (2007: 30%))
2008 2007 The differences are explained below: £m £m
Loss / (profit) before taxation:
Continuing operations (200.6) 46.5
Discontinued operations - (2.1)
(200.6) 44.4
Tax on (loss) / profit at UK rate of 28.5% (2007: 30%) (57.2) 13.3
Differences:
Tax effect of share of results from joint venture 1.1 (0.2)
Accounting depreciation for which no tax relief is due 0.6 0.1
Difference between accounts profits and taxable profits on capital asset disposals 0.3 (1.4)
Other disallowables 1.3 0.4
Unrecognised losses 0.2 0.7
Tax rate differential on overseas income (0.2) 0.1
Movement in rolled over and held over chargeable gains (0.1) -
Asset impairment charge 16.6 2.1
Impact of Finance Act 2007 changes 0.6 (7.7)
Adjustments to tax charge in respect of previous periods (3.7) (4.1)
Total tax (credit) / charge (40.5) 3.3
9. cont
2008 2007 The impact of the Finance Act 2007 changes are: £m £m
Removal of balancing adjustments on disposal of Industrial Buildings - 3.7
Reduction in the tax rate from April 2008 onwards from 30% to 28% (see factors affecting future tax charge below) (0.6) 4.0
(0.6) 7.7
Deferred tax (expense) / credit recognised directly in equity
restated * 2008 2007 £m £m
Relating to share based payments - (2.0)
Actuarial gains and losses 8.3 0.4
8.3 (1.6)
Tax rate
The standard rate of corporation tax changed from 30% to 28% with effect from 1 April 2008. Accordingly, the average rate UK corporation tax rate
applicable for this accounting period is 28.5%. However, the deferred tax credit in respect of the Group’s losses for this accounting period has been
calculated using the future applicable rate of 28%.
Factors affecting the future tax charge
The tax credit / charge is increased / decreased by the release of prior year provisions relating to UK tax returns and certain capital allowances that are
treated as permanent differences. The tax credit / charge is decreased / increased by non-deductible expenses including the impairment of goodwill and
non-qualifying depreciation.
64

Pend
rago
n PL
CA
nnua
l Rep
ort
08
NOTES TO THE FINANCIAL STATEMENTSContinued
Taxation (continued)
Unrecognised deferred tax assets
There are unutilised tax losses within the group of £18.6m (2007: £17.9m) relating to overseas businesses for which no deferred tax asset has been
recognised pending clarity of the availability of intra-EU losses.
Deferred tax assets / (liabilities)
Deferred income tax assets and liabilities are offset when there is a legally enforceable right to offset current tax assets against current tax liabilities and when
the deferred income taxes relate to the same fiscal authority. The offset amounts are as follows:
9. cont
restated * 2008 2007 £m £m
Deferred tax assets 25.1 -
Deferred tax liabilities (29.1) (44.0)
(4.0) (44.0)
A deferred tax asset has been recognised in respect of tax loses carried forward at 31 December 2008 as it is expected that the Group will generate
sufficient taxable profits in the foreseable future for these tax losses to be utilised against.
The movements in temporary differences for the year are as follows: Charged / (credited) to restated * At consolidated At 31 1 January income Credited December 2007 statement to equity 2007 £m £m £m £m
Property, plant and equipment 58.6 (8.8) - 49.8
Rolled over and held over gains 9.9 2.9 - 12.8
Retirement benefit obligations (26.2) 9.6 (0.4) (17.0)
Share based payments (2.0) - 2.0 -
Financial instruments (0.2) - - (0.2)
Provisions (1.8) 0.4 - (1.4)
Tax liabilities 38.3 4.1 1.6 44.0
The movements in temporary differences for the year are as follows:
Charged / (credited) to At consolidated At 31 1 January income Credited December 2008 statement to equity 2008 £m £m £m £m
Property, plant and equipment 49.8 (16.8) - 33.0
Rolled over and held over gains 12.8 (1.0) - 11.8
Retirement benefit obligations (17.0) 6.8 (8.3) (18.5)
Financial instruments (0.2) - - (0.2)
Provisions (1.4) 0.8 - (0.6)
Losses - (21.5) - (21.5)
Tax liabilities / (assets) 44.0 (31.7) (8.3) 4.0
* See change of accounting policy - note 1ad.
65

Pend
rago
n PL
CA
nnua
l Rep
ort
08
NOTES TO THE FINANCIAL STATEMENTSContinued
Earnings per share
2008 2008 2007 2007 Earnings per Earnings Earnings per Earnings share Total share Total pence £m pence £m
Basic earnings per share - continuing operations (25.2) (160.1) 6.8 43.2
Basic earnings per share - discontinued operations - - (0.3) (2.1)
Basic earnings per share (25.2) (160.1) 6.5 41.1
Adjusting items:
Goodwill impairment 9.1 58.1 1.1 6.8
Impairment of investment in joint venture 1.0 6.2 - -
Impairment of property, plant and equipment 2.4 15.2 - -
Impairment of assets held for sale 1.9 11.9 - -
Losses incurred on closed businesses 3.1 19.7 1.1 7.2
Redundancy costs 0.9 5.4 - -
Exceptional VAT refund (1.1) (6.8) - -
Loss / (profit) on business and property disposals 0.8 5.2 (2.8) (18.0)
Refinancing related professional costs and bank waiver fees 1.8 11.2 - -
Professional fees 0.2 1.5 - -
VAT assessment provision 4.2 26.8 - -
Inventory write down 3.9 24.9 - -
Interest received on VAT refund (1.3) (8.3) - -
Exceptional deferred tax credit (see note 9) - - (1.2) (7.7)
Tax effect of adjusting items (4.7) (30.1) 0.3 1.8
Adjusted earnings per share (3.0) (19.2) 5.0 31.2
Diluted earnings per share - continuing operations (25.2) (160.1) 6.7 43.2
Diluted earnings per share - total (25.2) (160.1) 6.4 41.1
Diluted earnings per share - adjusted (3.0) (19.2) 5.0 31.2
10.
The calculation of basic, adjusted and diluted earnings per share is 2008 2007 based on the following number of shares in issue (millions) Number Number
Weighted average number of ordinary shares in issue 636.1 635.2
Weighted average number of dilutive shares under option - 6.6
Weighted average number of shares in issue taking account of applicable outstanding share options 636.1 641.8
The directors consider that the adjusted earnings per share figure provides a better measure of comparative performance.
There are 3.1m shares under option (2007: 3.0m) that are non dilutive in accordance with IAS 33 ‘Earnings Per Share’.
66

Pend
rago
n PL
CA
nnua
l Rep
ort
08
NOTES TO THE FINANCIAL STATEMENTSContinued
Intangible assets
Development Other Goodwill costs intangibles Total £m £m £m £m
Cost
At 1 January 2007 437.7 - 12.7 450.4
Additions through business combinations 1.3 - - 1.3
Other additions - 1.1 0.8 1.9
Exchange adjustments (0.2) - - (0.2)
Disposals (0.9) - (0.4) (1.3)
At 31 December 2007 437.9 1.1 13.1 452.1
At 1 January 2008 437.9 1.1 13.1 452.1
Other additions - 0.8 0.3 1.1
Exchange adjustments 4.8 - - 4.8
Disposal of businesses (0.6) - - (0.6)
Other disposals (0.3) - (0.4) (0.7)
At 31 December 2008 441.8 1.9 13.0 456.7
Amortisation
At 1 January 2007 3.9 - 11.3 15.2
Amortised during the year - 0.1 0.7 0.8
Impairment 6.8 - - 6.8
At 31 December 2007 10.7 0.1 12.0 22.8
At 1 January 2008 10.7 0.1 12.0 22.8
Amortised during the year - 0.3 0.4 0.7
Exchange adjustments 0.8 - - 0.8
Impairment 58.1 - - 58.1
Disposals - - (0.3) (0.3)
At 31 December 2008 69.6 0.4 12.1 82.1
Carrying amounts
At 1 January 2007 433.8 - 1.4 435.2
At 31 December 2007 427.2 1.0 1.1 429.3
At 1 January 2008 427.2 1.0 1.1 429.3
At 31 December 2008 372.2 1.5 0.9 374.6
11.
67

Pend
rago
n PL
CA
nnua
l Rep
ort
08
NOTES TO THE FINANCIAL STATEMENTSContinued
Intangible assets (continued)
The amortisation charge in respect of other intangibles is recognised within operating expenses in the income statement.
Development costs are amortised over a period of five years. These constitute expenditure on development of the Group’s software products that is
capitalised as incurred. Software is amortised over a period of four years.
Impairment losses of £14.9m of goodwill attaching to business units pending closure where the future cash flows from these are not expected to recover
the goodwill carrying value are recognised within operating expenses in the income statement (2007: £6.8m). In addition, on review of the future cashflows
of the business and primarily due to the current performance of the Group, the directors do not expect to recover the carrying value of the goodwill
attached to a number of CGUs (cash generating units). Therefore an impairment charge of £43.2m was recognised within operating expenses in the income
statement (2007: £nil).
Goodwill is allocated across multiple cash generating units which are franchise groups and other business units and consequently a consistent approach in
assessing the carrying value of this amount is taken. This value was determined by discounting the future cash flows generated from the continuing use of
the unit and was based on the following key assumptions:
Future cash flows were projected into perpetuity based on actual operating results and the current business plan as approved by the directors, with regard
to the long term strategy of the Group in terms of business representation. The business plan has been prepared based on detailed plans prepared by
each CGU. The detailed plans were formulated based on vehicle manufacturer forecasts and other external sources of automotive industry forecasts, the
experience of the impact of previous recessions and subsequent recovery in the automotive industry and consequent expectations for profit per unit
performance. The cash flow projections included the benefit of cost saving actions already implemented.
Whilst it is anticipated that the units will grow revenues in the future, for the purpose of the impairment testing, no growth has been assumed beyond the
business plan.
A pre-tax discount rate of 13.3% (2007: 5.8%) was applied in determining the recoverable amount of the units which the Group has estimated to be the
approximate weighted average cost of capital of the Group. The discount rate used reflects the best estimate by the directors of the rate reflective of the
risks specific to all cash generating units for which the future cash estimates have not been adjusted. A key assumption made by the directors lies in the
discount rate used, an increase in the pre-tax discount rate of 1% would cause an increase in the impairment by £7.2m.
11. cont
Goodwill by segment 2008 2007 £m £m
Stratstone 126.5 156.5
Evans Halshaw 210.7 227.5
Chatfields 12.0 17.8
Support 1.0 0.9
Contract Hire 22.0 24.5
372.2 427.2
68

Pend
rago
n PL
CA
nnua
l Rep
ort
08
NOTES TO THE FINANCIAL STATEMENTSContinued
Property, plant and equipment
Land & Plant & Motor buildings equipment vehicles Total £m £m £m £m
Cost
At 1 January 2007 235.1 65.1 216.1 516.3
Additions through business combinations 6.8 1.0 - 7.8
Other additions 17.8 16.5 131.2 165.5
Exchange adjustments 0.2 0.1 - 0.3
Disposal of businesses (3.7) (1.4) - (5.1)
Other disposals (21.1) (3.7) (113.5) (138.3)
Classified as non-current assets held for sale (42.0) - - (42.0)
At 31 December 2007 193.1 77.6 233.8 504.5
At 1 January 2008 193.1 77.6 233.8 504.5
Other additions 14.5 12.8 124.9 152.2
Exchange adjustments 7.0 1.6 0.3 8.9
Disposal of businesses (2.6) (2.0) (3.1) (7.7)
Other disposals (8.0) (17.4) (154.7) (180.1)
Classified as non-current assets held for sale (7.9) - - (7.9)
At 31 December 2008 196.1 72.6 201.2 469.9
Depreciation
At 1 January 2007 8.2 30.0 57.7 95.9
Exchange adjustments 0.1 0.1 - 0.2
Charge for the year 3.6 12.7 42.2 58.5
Disposal of businesses (0.7) (1.3) - (2.0)
Other disposals 0.3 (1.5) (29.9) (31.1)
Classified as non-current assets held for sale (2.1) - - (2.1)
At 31 December 2007 9.4 40.0 70.0 119.4
At 1 January 2008 9.4 40.0 70.0 119.4
Exchange adjustments 0.7 1.0 0.1 1.8
Charge for the year 3.6 11.1 40.9 55.6
Impairment 8.5 0.4 6.3 15.2
Disposal of businesses (0.2) (1.1) (2.1) (3.4)
Other disposals (0.9) (8.5) (45.6) (55.0)
At 31 December 2008 21.1 42.9 69.6 133.6
Carrying amounts
At 1 January 2007 226.9 35.1 158.4 420.4
At 31 December 2007 183.7 37.6 163.8 385.1
At 1 January 2008 183.7 37.6 163.8 385.1
At 31 December 2008 175.0 29.7 131.6 336.3
12.
69

Pend
rago
n PL
CA
nnua
l Rep
ort
08
NOTES TO THE FINANCIAL STATEMENTSContinued
Property, plant and equipment (continued)
Included in the amounts for plant, equipment and motor vehicles above are the following amounts relating to leased assets and assets acquired under hire
purchase contracts:
12. cont
Land & Plant & Motor buildings equipment vehicles Total £m £m £m £m
Depreciation
Charge for the year - - 1.7 1.7
Carrying amounts
At 31 December 2007 0.6 - 7.0 7.6
At 31 December 2008 0.3 - 6.1 6.4
Cumulative interest charges of £0.5m (2007: £0.5m) have been capitalised as construction costs and included in land and buildings.
Land and buildings include £4.4m (2007: £2.6m) in respect of building projects currently under construction for which no depreciation has been charged
during the year.
Future capital expenditure which has been contracted for but not yet provided in the financial statements amounted to £1.4m (2007: £4.7m).
Interest in joint venture
The Group has a 51% ordinary share capital interest in a joint venture PPH0 Limited, a company that is incorporated and trading in the United Kingdom,
whose principal activity is that of a property company. The joint venture is accounted for under the equity accounting method. The directors have made a
full provision against the carrying value of the investment, as at the balance sheet date the value of the investment was assessed to have been substantially
impaired due to the difficulties faced by PPH0 Limited in adhering to its existing financing covenants.
The Group, whilst holding a 51% holding in the ordinary share capital of PPH0 Limited, holds by way of a contractual agreement 50% of the voting rights
attaching to that company, thereby giving the Group joint control.
13.
2008 2007 £m £m
Non-current assets 189.0 189.0
Current assets 6.7 5.7
Current liabilities (189.5) (190.7)
Share of net assets 6.2 4.0
Provision for impairment (6.2) -
- 4.0
The Group’s share of revenues and expenses of the joint venture 2008 2007 included in the income statement is presented: £m £m
Income 12.7 11.8
Expenses (10.5) (10.6)
Provision for impairment (6.2) -
Income tax expense - (0.4)
(4.0) 0.8
Reconciliation of movement in interest in joint venture £m
Interest in joint venture at 31 December 2007 4.0
Share of profit after income tax expense 2.2
Provision for impairment (6.2)
Interest in joint venture at 31 December 2008 -
70

Pend
rago
n PL
CA
nnua
l Rep
ort
08
NOTES TO THE FINANCIAL STATEMENTSContinued
Interest in joint venture (continued)
The non-current assets shown above relate to properties held at original cost to the joint venture. An indicative valuation performed on these properties in
April 2008 indicated that at that date the value of these properties to the Group was £173.6 million. At that time the joint venture bankers informed PPH0
Limited (the joint venture holding company) that it was in default of the bank facility loan to value covenant and on this basis the entire banking debt has been
shown as current in 2008 and in the comparative year.
The directors of PPH0 Limited have concluded that as at 31 December 2008 the carrying value of the properties shown above is impaired, however no
adjustment in respect of this impairment has yet been finally agreed or adjusted for in these accounts. The directors of PPH0 Limited have decided to finalise
the accounting entries for the joint venture at the relevant time when finalising discussions with its bankers to resolve the covenant default.
However the carrying value of the Group’s investment in the joint venture has been fully impaired in 2008 on the grounds that the directors consider the
investment to be impaired due to the difficulties faced by the joint venture in adhering to its existing financing covenants and as such the actual booking of
any impairment within the joint venture accounts will have no further impact on the Group financial statements.
PPH0 Limited has borrowings secured on its land and buildings.
At 31 December 2008 PPH0 Limited has no contractual capital commitments.
Inventories
2008 2007 £m £m
New and used vehicles 517.5 592.3
Consignment vehicles 96.2 141.7
Vehicle parts and other inventories 42.1 52.5
655.8 786.5
Inventories recognised as an expense during the year 3,553.2 4,314.1
Inventories stated at net realisable value 237.8 0.7
Carrying value of inventories subject to retention of title clauses 564.8 600.8
During the year £25.1m was recognised as an expense in respect of the write down of inventories (2007: £0.4m credit).
Trade and other receivables
2008 2007 £m £m
Trade receivables 64.9 116.3
Allowance for doubtful debts (1.0) (0.5)
63.9 115.8
Other receivables 57.3 77.8
Prepayments 12.4 12.3
133.6 205.9
All amounts are due within one year.
Total trade receivables held by the Group at 31 December 2008 was £63.9m (2007: £115.8m). No trade receivables have been classified as held for sale
(2007: £nil).
The average credit period taken on sales of goods is 29 days (2007 : 24 days). No interest is charged on trade receivables. The Group makes an impairment
provision for all debts that are considered unlikely to be collected plus a proportion of all debts over 120 days past their due date. At 31 December 2008
trade receivables are shown net of an allowance for impairment of £1.0m (2007: £0.5m). The expense recognised for impairment losses during the year
was £0.6m (2007: £0.2m).
13. cont
14.
15.
71

Pend
rago
n PL
CA
nnua
l Rep
ort
08
NOTES TO THE FINANCIAL STATEMENTSContinued
15. cont Trade and other receivables (continued)
Before granting any new customer credit terms the Group uses external credit scoring systems to assess the potential new customer’s credit quality and
defines credit limits by customer. These limits and credit worthiness are regularly reviewed and use is made of monitoring alerts provided by the providers
of the credit scoring systems. The Group has no customer that represents more that 5% of the total balance of trade receivables.
The ageing of trade receivables at the reporting date was: 2008 2007 £m £m
Not past due 37.0 80.4
Past due 0-30 days 19.2 25.0
Past due 31-120 days 6.6 10.0
Past due 120+ days subject to impairment 2.1 0.9
64.9 116.3
Impairment (1.0) (0.5)
63.9 115.8
The movement in the allowance for impairment in respect of trade receivables 2008 2007 during the year was as follows: £m £m
Balance at 1 January 0.5 0.3
Utilisation (0.1) -
Expense recognised 0.6 0.2
Balance at 31 December 1.0 0.5
Trade and other payables
2008 2007 £m £m
Trade payables 639.4 723.3
Consignment vehicle liabilities 96.2 141.7
Payments received on account 8.2 15.0
Other taxation and social security 9.3 11.5
Accruals 169.4 189.7
922.5 1,081.2
As at 31 December 2008, the outstanding commitment to purchase ex-contract vehicles that were not supplied by the Company amounted to £nil
(2007: £7.6m). Expected losses in respect of these commitments of £nil (2007 : £2.6m included in accruals).
16.
Interest bearing loans and borrowings
2008 2007 £m £m
Non-current liabilities
Unsecured bank loans 314.7 185.2
Unsecured loan notes 148.9 105.0
Finance lease liabilities (see note 26) 4.6 7.0
468.2 297.2
Current liabilities
Unsecured bank loans 78.9 75.1
Unsecured other loans - 4.0
Finance lease liabilities (see note 26) 3.3 2.7
82.2 81.8
17.
Note 18 sets out the maturity profile of non-current liabilities.
The directors consider that the carrying amount of trade and other receivables approximates their fair value.
72

Pend
rago
n PL
CA
nnua
l Rep
ort
08
NOTES TO THE FINANCIAL STATEMENTSContinued
Financial instruments and derivatives
Financial risk management
The Group is exposed to the following risks from its use of financial instruments:
Funding and liquidity risk - the risk that the Group will not be able to meet its financial obligations as they fall due.
Credit risk - the risk of financial loss to the Group on the failure of a customer or counterparty to meet its obligations to the Group as they fall due.
Market risk - the risk that changes in market prices, such as interest rates and foreign exchange rates, have on the Group’s financial performance.
Due to significant changes in the economic climate experienced in the year the Group has increased its focus on managing credit and liquidity risk. The
main actions the Group has taken have been to reduce credit terms to customers, reduce stocks of vehicles and therefore the related payment obligation
and increased focus on working capital management. The Group’s quantitative exposure to these risks is explained throughout these financial statements
whilst the Group’s objectives and management of these risks is set out below.
Treasury policy and procedures
Group treasury matters are managed within policy guidelines set by the Board with prime areas of focus being liquidity, interest rate and foreign exchange
exposure. Management of these areas is the responsibility of the Group’s central treasury function. Derivative financial instruments are utilised to reduce
exposure to movements in foreign exchange rates and interest rates. The Board does not permit the speculative use of derivatives.
Funding and liquidity management
The Group is financed primarily by loan notes, bank loans, vehicle stocking credit lines and operating cash flow. Committed facilities have a range of
maturities, are maintained at levels in excess of planned requirements and are in addition to short term uncommitted facilities that are also available to the
Group.
Each business within the Group is responsible for its own day to day cash management and the overall cash position is monitored on a daily basis by the
Group treasury department. Where our overseas subsidiaries borrow to fund their businesses they do so independently of and without recourse to the
UK parent company. Liquidity risk of the Group has significantly increased in the current economic climate and, consequently, the Group has refinanced as
set out below under “post balance sheet events” and in the operational and business review on pages 2 to 15.
Interest rate risk management
The objective of the Group’s interest rate policy is to minimise interest costs whilst protecting the Group from adverse movements in interest rates.
Borrowings issued at variable rates expose the Group to cash-flow interest rate risk whereas borrowings issued at fixed rates expose the Group to fair
value interest rate risk. The Group does not actively manage cash flow interest rate risk as the Board believes that the retail sector in which the Group
operates provides a natural hedge against interest rate movements. Consequently, it is Group policy to borrow on a floating rate basis and all fair value
interest rate risk arising from fixed rate borrowings entered into by the Group is managed by swaps into floating rate.
Interest rate risk sensitivity analysis
As all of the Group’s borrowings and vehicle stocking credit lines, after taking into account the effect of swaps, are floating rate instruments they have a
sensitivity to changes in market rates of interest. The table below shows the effect of a 100 basis points change in interest rates for floating rate instruments
outstanding at the period end, showing how profit or loss would have varied in the period on the assumption that the instruments at the period end were
outstanding for the entire period. Although this sensitivity analysis is merely illustrative, it should be noted that interest rates varied during 2008 by as much
as 350 basis points.
18.
73

Pend
rago
n PL
CA
nnua
l Rep
ort
08
NOTES TO THE FINANCIAL STATEMENTSContinued
18. cont Financial instruments and derivatives (continued)
Profit / (loss) Profit / (loss) 2008 2007 £m £m
100 bps increase (7.5) (10.2)
Tax effect 2.1 3.1
Effect on net assets (5.4) (7.1)
100 bps decrease 7.5 10.2
Tax effect (2.1) (3.1)
Effect on net assets 5.4 7.1
Foreign exchange risk management
The Group faces currency risk in respect of its net assets denominated in currencies other than sterling. On translation into sterling movements in currency
will affect the value of these assets. The Group’s policy is therefore to match, where possible, net assets in overseas subsidiaries which are denominated in a
foreign currency with borrowings in the same currency. Similarly, where the Group borrows in a foreign currency to finance assets denominated in sterling
the borrowings are swapped into sterling. In line with these policies the Group has swapped all of its fixed rate loan notes denominated in US dollars into
floating rate sterling and has borrowed USD 50.0m (2007: USD 50.0m) against its net assets held in overseas subsidiaries.
Credit risk management
The Group is exposed to credit risk primarily in respect of its trade receivables and financial assets. Trade receivables are stated net of provision for
estimated impairment losses. Exposure to credit risk in respect of trade receivables is mitigated by the Group’s policy of only granting credit to certain
customers after an appropriate evaluation of credit risk. Credit risk arises in respect of amounts due from vehicle manufacturers in relation to bonuses and
warranty receivables. This risk is mitigated by the range of manufacturers dealt with, the Group’s procedures in effecting timely collection of amounts due
and management’s belief that it does not expect any manufacturer to fail to meet its obligations. Financial assets comprise cash balances and assets arising
from transactions involving derivative financial instruments. The counterparties are banks and, despite the current economic conditions, management does
not expect any counterparty to fail to meet its obligations. The maximum exposure to credit risk is represented by the carrying amount of each financial
asset, including derivative financial instruments, in the balance sheet.
Capital management
The Board’s policy is to maintain a strong capital base to maintain market confidence and to sustain the development of the business, whilst maximising the
return on capital to the Company’s shareholders. Under normal conditions, the Group seeks to achieve an increase in earnings per share growth of RPI +
10% per annum and increase dividends each year. The Group attempts to maintain an optimal balance between borrowings and equity and seeks a debt/
equity ratio of between 70% and 100% under normal trading conditions. Due to the extreme changes in economic climate, the Group has been unable
to achieve these objectives for 2008. After tax return on equity for 2008 was (70.6)% (2007: 12.7%). During a downturn in the UK economy the Board
intends to reduce debt by applying any surplus cash against its borrowings rather than to buy back shares or pay dividends.
The Company has from time to time repurchased its own shares in the market and cancelled them. There is no predetermined plan for doing this although
the Company has permission from shareholders to buy back up to 10% of its equity at any one time. The Company may use profits made on surplus
property sales to purchase its own shares and cancel them in order to promote growth in earnings per share, or to satisfy share incentives issued to
employees of the Group. The Company encourages its employees to be shareholders of the Company with the provision of a sharesave scheme as an
all-employee share scheme to being one example.
Certain of the Company’s subsidiaries are required to maintain issued share capital at levels to support capital adequacy under Financial Services Authority
(FSA) requirements. The Company ensures these requirements are met by injections of equity to the subsidiaries in question, when required.
There were no changes in the approach to the Group’s capital management in the year.
74

Pend
rago
n PL
CA
nnua
l Rep
ort
08
NOTES TO THE FINANCIAL STATEMENTSContinued
18. cont Financial instruments and derivatives (continued)
Accounting for derivative financial instruments and hedging activities
The Group holds derivative financial instruments to hedge currency and interest risks arising from its activities. Derivative financial instruments are measured
at fair value at each balance sheet date. Where a derivative financial instrument hedges the changes in fair value of recognised assets or liabilities, any gain
or loss is recognised in the income statement. The hedged item is also stated, separately from the derivative, at fair value in respect of the risk being hedged
with any gain or loss also recognised in the income statement. This will result in variations in the balance sheet values of the hedged item and the offsetting
derivatives as the market value fluctuates. The fair value of derivatives and hedged items is the estimated amount receivable or payable to terminate the
contract determined by reference to calculations provided by financial institutions utilising market prices prevailing at the balance sheet date.
Hedges
Fair value hedges of interest rate and currency risk
The Group classifies its interest rate and currency swaps as fair value hedges and states them at fair value. The net fair value of swaps used as hedges of
the Group’s USD and GBP loan notes is set out below:
Assets Liabilities Assets Liabilities carrying carrying carrying carrying value & value & value & value & fair value fair value fair value fair value 2008 2008 2007 2007 Fair value hedge £m £m £m £m
Currency and interest swap (USD 110m / GBP: fixed rate to floating rate) expiring 2011 21.6 - - (3.4)
Currency and interest swap (USD 67m / GBP: fixed rate to floating rate) expiring 2014 15.5 - - (2.1)
Interest swap (GBP 17m: fixed rate to floating rate) expiring 2014 1.4 - - (0.1)
Total 38.5 - - (5.6)
All derivative financial instrument assets and liabilities are non-current. The critical terms of the derivative financial instrument and the hedged item match
(i.e. currency, notional amount, and timing of rate resets and payments) and therefore changes in the fair value attributable to the risk being hedged are
expected to be offset by the hedging derivative financial instrument. Changes in the fair value of the risk being hedged, being changes in the fair value of the
loan notes, amounted to £43.9m, which was offset by changes in the fair value of the hedging derivative financial instrument of £44.1m.
Hedges of net investments in overseas operations
Included within bank borrowings are balances denominated in US dollar which are designated as a hedge of the net investment in the Company’s US
subsidiaries. The aggregate fair value of these borrowings was £34.7m at 31 December 2008. Foreign exchange losses of £9.5m on translation of the
borrowings to sterling at the balance sheet date are recognised within the translation differences reserve in equity, net of exchange gains of £8.2m in respect
of the net investments being hedged.
Cash and cash equivalents
Bank balances and bank overdrafts set out below are stated net of legal rights of set-off resulting from pooling arrangements operated by individual banks.
Carrying Carrying value & value & fair value fair value 2008 2007 £m £m
Bank balances and cash equivalents 154.6 52.6
75

Pend
rago
n PL
CA
nnua
l Rep
ort
08
NOTES TO THE FINANCIAL STATEMENTSContinued
18. cont Financial instruments and derivatives (continued)
Borrowings Carrying Carrying Fair value & value value fair value 2008 2008 2007 £m £m £m
Non-current:
Bank borrowings 314.7 280.1 185.2
5.65% USD 110 million loan notes 2011 79.2 79.2 54.6
5.95% USD 67 million loan notes 2014 51.0 51.0 33.3
5.95% GBP 17 million loan notes 2014 18.5 18.5 16.9
Other loan notes 0.2 0.2 0.2
Finance leases 4.6 4.6 7.0
Total non-current 468.2 433.6 297.2
Current:
Bank borrowings 78.9 70.2 75.1
Finance leases 3.3 3.3 2.7
Other loans - - 4.0
Total borrowings 550.4 507.1 379.0
In order to calculate the fair value of the floating rate borrowings the effective interest rate of the renegotiated bank borrowings (see post balance sheet
events below) has been applied to discount the cashflows of the borrowings existing at the year end. It has been assumed that the effective interest rate
of the renegotiated bank borrowing would not be significantly different if negotiations had been complete at the year end. The effective interest rates for
all borrowings after taking into account derivative financial instruments are all based on LIBOR for the relevant currency. Finance leases are effectively held
at fixed rates of interest within the range set out below. Information regarding classification of balances and interest, the range of interest rates applied in
the year to 31 December 2008 and repricing periods, is set out in the table below:
76

Pend
rago
n PL
CA
nnua
l Rep
ort
08
NOTES TO THE FINANCIAL STATEMENTSContinued
18. cont Financial instruments and derivatives (continued)
Effect of Carrying interest rate Swapped value Interest Interest rate and currency interest rate Repricing £m Classification classification range swaps range periods
Bank balances and cash equivalents 154.6 Amortised cost Floating GBP 2.00% - 5.50% n/a n/a 6 months or less
Bank overdrafts - Amortised cost Floating GBP 3.00% - 6.50% n/a n/a 6 months or less
154.6
Borrowings
Non-current:
Bank borrowings 280.0 Amortised cost Floating GBP 4.66% - 7.66% n/a n/a 6 months or less
Bank borrowings 34.7 Amortised cost Floating USD 2.86% - 6.15% n/a n/a 6 months or less
5.65% USD 110 million loan notes 2011 79.2 Fair value Fixed USD 5.65% Floating GBP 8.52% - 9.43% 6 months or less
5.95% USD 67 million loan notes 2014 51.0 Fair value Fixed USD 5.95% Floating GBP 8.30% - 9.20% 6 months or less
5.95% GBP 17 million loan notes 2014 18.5 Fair value Fixed GBP 6.66% Floating GBP 8.29% - 9.20% 6 months or less
Other loan notes 0.2 Amortised cost Floating GBP 12.50% n/a n/a n/a
Finance leases 4.6 Amortised cost Fixed GBP 5.29% - 7.15% n/a n/a see note 26
Total non-current 468.2
Current:
Bank borrowings 65.0 Amortised cost Floating GBP 4.66% - 7.81% n/a n/a 6 months or less
Bank borrowings 13.9 Amortised cost Floating USD 3.30% - 6.95% n/a n/a 6 months or less
Finance leases 3.3 Amortised cost Fixed GBP 5.29% - 7.15% n/a n/a see note 26
Total borrowings 550.4
The carrying amounts of the Group’s borrowings are denominated in the following currencies:
2008 2007 £m £m
Pound sterling 501.8 353.8
US dollar 48.6 25.2
550.4 379.0
The maturity of non-current borrowings is as follows: 2008 2007 £m £m
Between one and two years 314.7 40.0
Between two and five years 80.9 255.0
Over five years 72.6 2.2
468.2 297.2
77

Pend
rago
n PL
CA
nnua
l Rep
ort
08
NOTES TO THE FINANCIAL STATEMENTSContinued
18. cont Financial instruments and derivatives (continued)
The Group has the following undrawn borrowing facilities 2008 2007 £m £m
Expiring in more than one year but not more than two years 155.4 -
Expiring in more than two years - 294.8
155.4 294.8
The Group has a £510m credit facility, expiring as set out below and USD and GBP loan notes expiring 2011/2014. Both are subject to covenants with
respect to debt / EBITDA and fixed charge coverage.
Term loan Expiry date £m
June 2009 20.0
December 2009 20.0
June 2010 20.0
December 2010 100.0
Total term loan 160.0
Revolving credit facility December 2010 350.0
510.0
Post balance sheet events
Due to the abnormal trading conditions experienced in the year, covenants due to be measured at 31 December 2008 in relation to the £510 million
credit facility and USD and GBP loan notes were deferred at a cost of £2.9m. The full £2.9m should under IAS 39 be capitalised and amortised over
the remaining life of the loan using the effective interest rate method but has been expensed in the current year income statement given the refinancing
activities undertaken as described below.
The Group has since been refinanced and on 30 April 2009 new loan agreements restructuring the existing loans and loan notes have been made as
follows:
Term loan Expiry date £m
June 2009 20.0
December 2009 20.0
June 2010 20.0
December 2010 20.0
June 2011 20.0
December 2011 20.0
April 2012 90.0
Total term loan 210.0
Revolving credit facility April 2012 210.0
420.0
Fair value net Fair value at of swaps atLoan notes Expiry date 31 December 2008 31 December 2008
5.65% USD 110 million loan notes 2011 April 2012 79.2 57.6
5.95% USD 67 million loan notes 2014 February 2014 51.0 35.5
5.95% GBP 17 million loan notes 2014 February 2014 18.5 17.1
148.7 110.2
78
The holders of the 2014 loan notes have an option to require payment in April 2012.

Pend
rago
n PL
CA
nnua
l Rep
ort
08
NOTES TO THE FINANCIAL STATEMENTSContinued
18. cont Financial instruments and derivatives (continued)
Terms of refinancing
Margin
Term loan and revolving credit facility: 3.25%, an increase of 2.35% over the margin currently payable.
USD denominated loan notes: a new coupon of 9.310%.
GBP denominated loan notes: a new coupon of 9.834%.
Both of these new coupon rates reflect a blended increase in margin over that currently payable of 2.50% after taking into account the new maturities.
A commitment fee in respect of undrawn amounts is payable at 1.625% of the undrawn amount.
Restructuring fee
1% of the total commitments (term loan, revolving credit facility and loan notes).
Warrants
5% of the issued share capital at 30 April 2009 plus a further 2.5% consequent on shareholder approval (or the cash equivalent of such 2.5% payable on
the earlier of maturity or repayment of facilities).
Success and stabilisation fee
At each anniversary of the facility agreements, 1% of the commitments at that date, payable in cash or shares of the Company, or 1.25% if settlement
deferred.
At repayment or maturity, 1% of the commitments at that date pro-rata for the period of time elapsed between the final anniversary and the date of
repayment or maturity, payable in cash or shares in the Company.
At maturity or repayment, 2.50% of the commitments at that date, payable in cash or shares in the Company.
The estimated cost of the restructuring fee, warrants and success and stabilisation fee will be capitalised from April 2009 as part of the facility balance and
are to be amortised over the life of the loan using the effective interest rate. Total estimated fees capitalised at April 2009 are £35m.
Covenants
The new facilities are subject to covenants with respect to debt / EBITDA, absolute EBITDA and fixed charge cover.
Security
The Group has granted security over certain of its assets, not subject to any other arrangements, mainly comprising property, debtors and certain vehicle
stocks. If security over these assets had been granted at 31 December 2008, the balance sheet value of those assets would have been £540m.
Professional fees and other items expensed
Total professional fees of the refinancing were £8.3m which have been expensed in 2008 as a non-recurring item. Existing loan arrangements which were
in place as at 31 December 2008 have been extinguished in full as part of this refinancing exercising. The effect of this on the 2009 financial statements
will be to recognise a loss in the income statement in respect of all previously unamortised fees, amounting to £1.5m.
Financing of overseas businesses
Current bank borrowings shown above include a £25m facility to finance our property holding company in the Netherlands and a USD 20m facility used
to fund our US businesses.
79

Pend
rago
n PL
CA
nnua
l Rep
ort
08
NOTES TO THE FINANCIAL STATEMENTSContinued
18. cont Financial instruments and derivatives (continued)
As part of the refinancing, the following facilities have been agreed:
Currency Amount Expiry date Margin
Netherlands Floating GBP £23.5m Earlier of April 2012 or on demand 3.25%
USA Floating USD $18m Earlier of July 2010 or on demand 3.50%
The refinanced Netherlands facility results in an increased margin over that currently payable of 1.75%. An arrangement fee of 1% of the commitment is also
payable at April 2009 together with a fee of 5% of the average outstanding commitment over the term, payable at maturity or repayment of the facility.
The refinanced USA facility results in an increase in margin over that currently payable of 1.25%. An arrangement fee of 1% of the commitment is also
payable at April 2009.
Both facilities are not subject to covenants but security over assets has been granted, mainly comprising property, debtors and certain vehicle stocks
(included within the £540m quoted above).
Provisions
The movements in provisions for the year are as follows: Warranty service Vacant VAT provision property assessment Total £m £m £m £m
At 31 December 2007 9.6 3.1 - 12.7
Impact of changes in discount rate - 0.1 - 0.1
Provisions made during the year 4.4 3.8 26.8 35.0
Provisions used during the year (6.6) (1.2) - (7.8)
At 31 December 2008 7.4 5.8 26.8 40.0
Non-current 2.5 4.1 - 6.6
Current 4.9 1.7 26.8 33.4
7.4 5.8 26.8 40.0
The provision on warranty service contracts relates to future repair costs expected against income received in advance, on products sold during the last
three years. It is expected this expenditure will be incurred within three years of the balance sheet date.
The vacant property provision is comprised of the future costs of vacated properties, being predominantly future lease commitments. The present value of
future lease commitments is calculated using an 5% discount rate and assumes that any sub-let properties will remain so until the end of the sub-lease. It
is expected that the majority of this expenditure will be incurred over the next three years.
The provision for VAT follows discussions with HM Revenue and Customs over a number of issues arising from the treatment of partial exemption within
the companies acquired with Reg Vardy PLC supplying finance and insurance services and the VAT treatment of sales of vehicles to certain disabled
customers. The directors consider that full provision against these VAT assessments is prudent. The tribunal for each case is expected to be heard within
the next twelve months (see also note 3).
19.
80

Pend
rago
n PL
CA
nnua
l Rep
ort
08
NOTES TO THE FINANCIAL STATEMENTSContinued
Called up share capital
Number £m
Authorised shares of 5p each at 31 December 2007 and at 31 December 2008 800,000,000 40.0
Allotted, called up and fully paid shares of 5p each at 31 December 2007 and 31 December 2008 656,027,350 32.8
No ordinary shares were issued during the year.
The holders of ordinary shares are entitled to receive dividends as declared from time to time and are entitled to one vote per share at meetings of the
Company. All shares rank equally with regard to the Company’s residual assets.
20.
Capital and reserves
Reconciliation of movement in capital and reserves Capital restated * restated * Share Share redemption Other Translation Retained capital premium reserve reserves reserve earnings Total £m £m £m £m £m £m £m
Balance at 1 January 2007 32.8 56.8 2.5 12.6 (0.3) 201.6 306.0
Total recognised income and expense for 2007 - - - - (0.1) 60.9 60.8
Dividends - - - - - (25.4) (25.4)
Share based payments - - - - - (1.6) (1.6)
Disposal of own shares in share trusts - - - - - 1.0 1.0
Acquisition of own shares in share trusts - - - - - (1.2) (1.2)
Balance at 31 December 2007 as previously stated 32.8 56.8 2.5 12.6 (0.4) 235.3 339.6
Effect of change in accounting policy on adoption of IFRIC 14 * - - - - - (32.4) (32.4)
Balance at 31 December 2007 as restated 32.8 56.8 2.5 12.6 (0.4) 202.9 307.2
Balance at 1 January 2008 32.8 56.8 2.5 12.6 (0.4) 202.9 307.2
Total recognised income and expense for 2008 - - - - (1.3) (181.4) (182.7)
Dividends - - - - - (15.9) (15.9)
Share based payments - - - - - 0.2 0.2
Disposal of own shares in share trusts - - - - - 0.1 0.1
Balance at 31 December 2008 32.8 56.8 2.5 12.6 (1.7) 5.9 108.9
* See change of accounting policy - note 1ad.
21.
Capital redemption reserve
The capital redemption reserve has arisen following the purchase by the Company of its own shares and comprises the amount by which distributable
profits were reduced on these transactions in accordance with Chapter VII of Part V of the Companies Act 1985.
81

Pend
rago
n PL
CA
nnua
l Rep
ort
08
NOTES TO THE FINANCIAL STATEMENTSContinued
Called up share capital
Other reserves
Other reserves comprise the amount of demerger reserve arising on the demerger of the Company from Williams PLC in 1989.
The market value of the investment in the Company’s own shares at 31 December 2008 was £0.3m (2007: £7.2m), being 19.8m (2007: 20.4m) shares with
a nominal value of 5p each, acquired at an average cost of £0.40 each (2007 : £0.44). The amounts deducted from retained earnings for shares held by
ESOP trusts at 31 December 2008 was £8.0m (2007: £8.1m). The investment in own shares represents shares in the Company held by Pendragon Quest
Trustees Limited and Investec Trust Guernsey Limited (employee share ownership trusts) which may subsequently be awarded to executive directors and
employees under the Pendragon 1999 Approved Executive Share Option Scheme, Pendragon 1999 Unapproved Executive Share Option Scheme and the
1998 Pendragon Sharesave Scheme. Details of the plans are given in the Directors’ Remuneration Report on pages 32 to 39.
Dividends on the shares owned by the trusts, the purchase of which were funded by interest free loans to the trusts from Pendragon PLC, are waived. All
expenses incurred by the trusts are settled directly by Pendragon PLC and charged in the accounts as incurred.
The trusts are regarded as quasi subsidiaries and their assets and results are consolidated into the financial statements of the Group.
Translation reserve
The translation reserve comprises all foreign exchange differences arising from the translation of the net investment in foreign operations as well as from
the translation of liabilities held to hedge the respective net investment in foreign operations.
Dividends
2008 2007 £m £m
Ordinary shares
Final dividend in respect of 2007 of 2.00p per share (2006: 2.00p) 12.7 12.7
Interim dividend in respect of 2008 of 0.50p per share (2007: 2.00p) 3.2 12.7
15.9 25.4
22.
The Board is not recommending a final dividend for 2008.
Dividends on the 19.8m shares held by Pendragon Quest Trustees Limited and Investec Trust Guernsey Limited are waived.
Business combinations
There were no business combinations made during the year.
During the previous year business combinations were made with a net cash outflow equalling the fair value of consideration of £16.3m.
No business combinations have been made between the balance sheet date and the date of this report.
23.
21.
82

Pend
rago
n PL
CA
nnua
l Rep
ort
08
NOTES TO THE FINANCIAL STATEMENTSContinued
Business disposals
Net assets at date of disposal Net book value £m
Property, plant and equipment 4.3
Intangible assets - goodwill 0.6
Inventories 4.1
Trade and other receivables 0.1
Trade and other payables (2.3)
6.8
Profit on sale of businesses 0.9
Proceeds on sale satisfied by cash and cash equivalents 7.7
No cash was disposed as part of any business disposal during the year.
Proceeds on sale satisfied by cash and cash equivalents for the previous period was £20.6m.
24.
Cash and cash equivalents
2008 2007 £m £m
Bank balances and cash equivalents 154.6 52.6
Cash and cash equivalents in the statement of cash flows 154.6 52.6
25.
Obligations under finance leases Present value of Minimum minimum lease payments lease payments 2008 2007 2008 2007 £m £m £m £m
Amounts payable under finance leases:
Within one year 3.7 3.4 3.3 2.7
In the second to fifth years inclusive 3.8 6.5 3.3 5.6
After five years 6.3 8.3 1.3 1.4
13.8 18.2 7.9 9.7
Less: future finance charges (5.9) (8.5) - -
Present value of lease obligations 7.9 9.7 7.9 9.7
Amount due for settlement within one year 3.3 2.7
Amount due for settlement in over one year 4.6 7.0
7.9 9.7
The Group’s obligations under finance leases comprise certain items of plant and equipment, the average lease term of which is two to three years and
two properties on long term leases with a lease term of between 59 and 84 years. The effective interest rates are shown in note 18 above. The Group’s
obligations under finance leases are secured by the lessors’ charges over the leased assets.
All leases are on a fixed repayment basis and no arrangements have been entered into for contingent rental payments.
26.
83

Pend
rago
n PL
CA
nnua
l Rep
ort
08
NOTES TO THE FINANCIAL STATEMENTSContinued
2008 2007 £m £m
Within one year 43.3 48.5
In the second to fifth years inclusive 165.5 171.7
After five years 692.9 567.1
901.7 787.3
Operating lease arrangements
The Group as lessee
At the balance sheet date, the Group had outstanding commitments for future minimum lease payments under non-cancellable operating leases, which fall
due as follows:
27.
The Group leases a number of properties, the majority of which are motor vehicle showrooms with workshop and parts retail facilities, with varying lease
periods. None of the leases include contingent rentals. In addition there are other leases in respect of items of plant and equipment which includes the
rental of motor vehicles hired for short term usage typically as courtesy cars.
2008 2007 £m £m
Within one year 1.2 0.7
In the second to fifth years inclusive 4.7 2.0
After five years 6.4 2.1
12.3 4.8
The Group as lessor
Property rental income earned during the year was £0.9m (2007: £0.5m). No contingent rents were recognised in income (2007 : £nil). The Group
currently receives rental income on eight properties on short term leases.
At the balance sheet date, the Group had contracted with tenants for the following future minimum lease payments:
In addition, the Group is a lessor in respect of vehicle sales with committed repurchase terms. There are no future minimum lease payments outstanding.
The options outstanding at 31 December 2008 have an exercise price in the range of 10.2 pence to 130.6 pence and a weighted contractual life of six and
a half years. All share options are settled in equity.
Movements in the number of options to acquire ordinary shares under the Group’s various share option schemes, together with exercise prices and the
outstanding position at 31 December 2008 were as follows:
Employee benefits
Share SchemesThe number and weighted average exercise prices of share options is as follows: Weighted Number Weighted Number average of average of exercise options exercise options price millions price millions 2008 2008 2007 2007
Outstanding at beginning of period 60.43p 17.6 66.87p 24.3
Lapsed during the period 66.34p (7.3) 99.92p (5.0)
Exercised during the period 23.47p (0.8) 27.43p (1.7)
Granted during the period 10.39p 6.4 - -
Outstanding at the end of the period 38.85p 15.9 60.43p 17.6
Exercisable at the end of the period 42.60p 6.3 25.84p 4.1
28.
84

Pend
rago
n PL
CA
nnua
l Rep
ort
08
NOTES TO THE FINANCIAL STATEMENTSContinued
Employee benefits (continued) At 31 At 31 Exercise December December Scheme price per 2007 Granted Exercised Lapsed 2008Exercise period Date of grant description share Number Number Number Number Number
17 March 2001 to 16 March 2008 17 March 1998 1989 Executive Scheme 24.6p 106,250 - - (106,250) -
9 October 2001 to 8 October 2008 * 9 October 1998 1989 Executive Scheme 10.2p 106,250 - - (106,250) -
21 June 2002 to 20 June 2009 21 June 1999 1999 Executive Scheme 13.0p 12,500 - - - 12,500
9 March 2004 to 8 March 2011 9 March 2001 1999 Executive Scheme 18.7p 349,995 - - - 349,995
1 July 2008 to 31 December 2008 1 July 2001 1998 Sharesave Scheme 18.0p 68,955 - - (68,955) -
24 March 2006 to 23 March 2013 24 March 2003 1999 Executive Scheme 23.4p 681,400 - (187,500) - 493,900
24 March 2008 to 23 March 2013 24 March 2003 1999 Executive Scheme 23.4p 2,339,995 - (590,000) - 1,749,995
1 July 2008 to 31 December 2008 1 July 2003 1998 Sharesave Scheme 24.6p 1,382,880 - - (1,329,385) 53,495
1 July 2010 to 31 December 2010 1 July 2003 1998 Sharesave Scheme 24.6p 419,040 - (23,835) (181,360) 213,845
30 September 2006 to 29 September 2013 30 September 2003 1999 Executive Scheme 40.2p 696,135 - - (97,765) 598,370
20 September 2009 to 19 September 2014 20 September 2004 1999 Executive Scheme 60.2p 3,500,000 - - (425,000) 3,075,000
1 July 2008 to 31 December 2008 1 July 2005 1998 Sharesave Scheme 60.4p 2,958,375 - - (2,885,650) 72,725
1 July 2010 to 31 December 2010 1 July 2005 1998 Sharesave Scheme 60.4p 1,516,915 - - (267,630) 1,249,285
1 July 2012 to 31 December 2012 1 July 2005 1998 Sharesave Scheme 60.4p 468,620 - - (185,790) 282,830
1 July 2009 to 31 December 2009 1 July 2006 1998 Sharesave Scheme 130.6p 1,399,545 - - (745,390) 654,155
1 July 2011 to 31 December 2011 1 July 2006 1998 Sharesave Scheme 130.6p 1,271,060 - - (689,045) 582,015
1 July 2013 to 31 December 2013 1 July 2006 1998 Sharesave Scheme 130.6p 305,110 - - (176,345) 128,765
19 September 2011 to 18 September 2018 19 September 2008 1999 Executive Scheme 10.39p - 6,375,000 - (30,000) 6,345,000
17,583,025 6,375,000 (801,335) (7,294,815) 15,861,875
* Parallel grant
The share option arrangements scheduled above include a number of arrangements granted before 7 November 2002. The recognition and measurement
principles in IFRS 2 have not been applied to those grants in accordance with the transitional provisions of IFRS 1 and IFRS 2.
On 19 September 2008 options over 6,375,000 ordinary shares of 5p were granted pursuant to the 1999 Executive Option Scheme at an exercise price
of 10.39p per share.
The grants of share options under the 1999 Scheme prescribed an earnings per share performance criterion. It is a pre-condition to the exercise of grants
made under the 1999 Scheme that the growth in the Company’s earnings per share over the prescribed three year period must exceed by at least 3 percent
per annum compound the annual rate of inflation as shown by the RPI Index.
The weighted average share price at the date of exercise for share options exercised in the year was 34.4 pence (2007: 98.0 pence).
The vesting conditions attaching to the 1998 Pendragon Sharesave schemes are that the option holder must be employed by the Group on the date of
exercise.
All options are settled by physical delivery of shares.
The fair value of the services received in return for share options is measured by reference to the fair value of the options granted. The estimate of the fair
value of the services received in respect of share option and share save schemes is measured using the Black-Scholes option pricing model. The estimate of
the fair value of services received in respect of the Long Term Incentive Plan (LTIP) (see Directors’ Remuneration Report) is measured using a stochastic
model which incorporates the discount factor required for the total shareholder return performance condition. The weighted average fair value of the
options at the date of grant for those that are outstanding at 31 December 2008 is 18.1 pence (2007: 25.7 pence).
28. cont
85

Pend
rago
n PL
CA
nnua
l Rep
ort
08
NOTES TO THE FINANCIAL STATEMENTSContinued
Employee benefits (continued)
There were no sharesave options granted during 2008 to any team members. The average assumptions input into the models for options granted under
the sharesave schemes and LTIP in each year were as follows:
28. cont
1999 Executive Sharesave Long term Scheme Scheme incentive plan 2008 2007 2008 2007 2008 2007
Number of share options granted in year 6,375,000 - - - - 1,330,109
Weighted average share price (pence) 10.39 - - - - 110.30
Weighted average exercise price (pence) 10.39 - - - - -
Expected volatility (%) 57.6% - - - - 32.8%
Expected life (years) 3.0 - - - - 3.0
Risk free rate (%) 3.81% - - - - 5.2%
Expected dividend yield (%) 5.0% - - - - -
Expected volatility was determined by calculating the historical volatility of the Company’s share price over the corresponding historical period. The expected
life used in the model has been adjusted, based on management’s best estimate, for the effects of exercise restrictions and team member turnover.
The Group recognised a total net expense of £0.2m related to equity-settled share based payment transactions (2007: £nil of which a credit of £0.3m was
in respect of the LTIP).
Pension obligations
The Group operates six defined benefit pension schemes (one of which has a defined contribution section) which closed to future benefits on 30
September 2006 and employees were offered membership of a stakeholder pension arrangement. The asset values shown do not include those of the
defined contribution sections. Actuarial gains and losses are immediately recognised directly in equity. Actuarial gains and losses are the differences between
actual and expected returns on scheme assets during the year, experience losses on scheme liabilities and the impact of any changes in assumptions. Details
of the last independent statutory actuarial valuation and assumptions are set out below by scheme.
The Group increased its level of contributions to all of the schemes. Four of the schemes have had formal actuarial valuations as at April 2006 and two at
April 2007. All the actuarial valuations have been issued under the UK Government’s new Scheme Specific Funding arrangements. The Group has agreed
recovery plans with the six schemes which aim to eliminate the current deficits over a five year period.
Pendragon Pension Plan
The Pendragon Pension Plan is a funded defined benefit scheme with a defined contribution section. The last actuarial valuation of the Plan was carried
out as at 5 April 2006 using the projected unit credit method. At this date the market value of the Plan’s assets relating to the defined benefit section
was £100.4m; these assets represented 71.8% of the value of technical provisions (excluding defined contribution assets). The main assumptions used
for this valuation were that the annual rate of return on existing investments would be 5% and the annual rate of pension increases would be between
2.5%-3%.
The Pendragon Pension Plan assumed all assets and obligations of the Stripestar Pension Scheme after it was merged on 6 April 2007.
The employer contributions paid to the defined benefit section of the Plan during the year were £5.8m, based upon actuarial advice.
86

Pend
rago
n PL
CA
nnua
l Rep
ort
08
NOTES TO THE FINANCIAL STATEMENTSContinued
Employee benefits (continued)
CD Bramall Pension Scheme
The CD Bramall Pension Scheme is a funded defined benefit scheme. The last actuarial valuation was carried out as at 5 April 2006 using the projected
unit credit method. At the valuation date, the market value of assets was £22.6m; these assets represented 70.5% of the value of technical provisions. The
main assumptions used for this valuation were that the annual rate of return on existing investments would be 5% and the annual rate of pension increases
would be between 2.5%-3%.
The employer contributions paid to the Scheme during the year were £1.9m, based upon actuarial advice.
CD Bramall Dealerships Limited Pension Scheme
The CD Bramall Dealerships Limited Pension Scheme is a funded defined benefit scheme. The last actuarial valuation was carried out as at 5 April 2006
using the projected unit credit method. At the valuation date, the market value of assets was £23.5m; these assets represented 65.5% of the value of accrued
liabilities. The main assumptions used for this valuation were that the annual rate of return on existing investments would be 5% and the annual rate of
pension increases would be between 2.5%-3%.
The employer contributions paid to the Scheme during the year were £1.9m, based upon actuarial advice.
CD Bramall Retirement Benefits Scheme
The CD Bramall Retirement Benefits Scheme is a funded defined benefit scheme. The defined contribution section has been wound up. The last actuarial
valuation was carried out as at 31 March 2006 using the projected unit credit method. At the valuation date, the market value of assets relating to the
defined benefit section was £5.2m; these assets represented 67.2% of the value of the technical provisions (excluding defined contribution assets). The
main assumptions used for this valuation were that the annual rate of return on existing investments would be 5% and the annual rate of pension increases
would be between 2.5%-3%.
The employer contributions paid to the Scheme during the year were £0.5m, based upon actuarial advice.
Quicks Pension Scheme
The Quicks Pension scheme is a funded defined benefit scheme. The last actuarial valuation was carried out as at 5 April 2007 using the projected unit
credit method. At the valuation date, the market value of assets was £74.5m; these assets represented 79% of the value of the technical provisions. The
main assumptions used for this valuation were that the annual rate of return on existing investments would be 5.5% and the annual rate of pension increases
would be between 3.2%-3.6%.
The employer contributions paid to the Scheme during the year were £6.5m, based upon actuarial advice.
Reg Vardy Retirement Scheme
The Reg Vardy Retirement Scheme is a funded defined benefit scheme. The last actuarial valuation was carried out as at 30 April 2007 using the projected
unit credit method. At the valuation date, the market value of assets was £40.4m; these assets represented 81% of the value of the technical provisions.
The main assumptions used for this valuation were that the annual rate of return on existing investments would be 5.4% and the annual rate of pension
increases would be between 2.0%-3.0%.
The employer contributions paid to the Scheme during the year were £2.4m, based upon actuarial advice.
28. cont
87
Pend
rago
n PL
CA
nnua
l Rep
ort
08
NOTES TO THE FINANCIAL STATEMENTSContinued
Employee benefits (continued)
Stakeholder arrangements
With effect from April 2006, new contributions to the defined contribution sections of the schemes ceased. For the employees affected the Group offered
to pay contributions to a new stakeholder arrangement with Friends Provident. This arrangement was also made available to the employees affected by
the closure of the defined benefit sections of the schemes on 30 September 2006. Total contributions paid by the Group in 2008 to the Stakeholder
arrangement were £4.4m.
IAS19 assumptions
The principal assumptions used by the independent qualified actuaries for the purposes of IAS 19 for all schemes were:
28. cont
2008 2007 2006
Inflation 3.00% 3.20% 2.90%
Rate of increase in salaries n/a n/a n/a
Rate of increase to pensions in payment 3.20% * 3.20% 2.90%
Discount rate 6.30% 6.00% 5.20%
Mortality table assumption 115% PNMA00 / 110% PNFA00 PA92YOB ** PA92YOB ** YOB** mc min 1% imp
* A full breakdown of the assumptions for the rates of increase to pensions in payment for the 31 December 2008 valuation is as follows:
RPI to max 5% 3.20%
RPI to max 3% 2.30%
RPI to min 3% to max 5% 3.90%
The sensitivities regarding the principal assumptions used to measure scheme liabilities are set out below:
The expected long term rates of return on the main asset classes were: 2008 2007 2006
Equities 7.90% 8.30% 8.60%
Bonds 4.20% 4.80% 4.70%
Cash 2.00% 5.00% 4.60%
Assumption Change in assumption Impact on scheme liabilities
Discount rate Increase / decrease by 0.1% Decrease / increase of £5.4m
Rate of inflation Increase / decrease by 0.1% Increase / decrease of £3.5m
The overall expected return on assets reflects the directors’ long term view of future returns taking into account market conditions at the year end and
asset allocation of the schemes.
The assumptions used by the actuary are the best estimates chosen from a range of possible actuarial assumptions which, due to the timescale covered,
may not necessarily be borne out in practice. The IAS assumptions have been updated at 31 December 2008 and differ from those used for the earlier
independent statutory actuarial valuations explained above.
The weighted average expected long term rates of return were: 2008 2007 2006
6.18% 7.35% 7.66%
88

Pend
rago
n PL
CA
nnua
l Rep
ort
08
NOTES TO THE FINANCIAL STATEMENTSContinued
28. cont Employee benefits (continued)
** The mortality table assumption implies the following expected future lifetime from age 65:
2008 2007 2006 Years Years Years
Males aged 45 22.9 21.0 20.9
Females aged 45 25.7 24.0 23.9
Males aged 65 21.0 19.7 19.6
Females aged 65 23.8 22.7 22.7
The fair value of the schemes’ assets which are not intended to be realised in the short term and may be subject to significant change before they are
realised, and the value of the schemes’ liabilities, which is derived from cash flow projections over long periods and thus inherently uncertain, are:
Scheme assets and liabilities restated restated 2008 2007 2006 £m £m £m
Equities 140.8 223.0 215.9
Bonds 100.3 73.8 59.9
Cash 10.2 10.5 8.0
Fair value of scheme assets 251.3 307.3 283.8
Present value of funded defined benefit obligations (313.8) (321.1) (349.0)
(62.5) (13.8) (65.2)
Adjustment in respect of minimum funding requirement and non-recognition of surplus (2.9) (45.0) (12.5)
Net liability on the balance sheet (65.4) (58.8) (77.7)
Movements in the net liability for defined benefit obligations recognised in the balance sheet
restated 2008 2007 £m £m
Net liability for defined benefit obligations at 1 January (58.8) (77.7)
Contributions received 19.0 18.9
Income recognised in the income statement 4.0 4.2
Actuarial gains and losses recognised in equity (71.7) 28.3
Adjustment in respect of minimum funding requirement and non-recognition of surplus 42.1 (32.5)
Net liability for defined benefit obligations at 31 December (65.4) (58.8)
2008 2007 £m £m
Actual return on assets (58.7) 12.9
Expected contributions in following year 19.0 18.5
89

Pend
rago
n PL
CA
nnua
l Rep
ort
08
NOTES TO THE FINANCIAL STATEMENTSContinued
28. cont Employee benefits (continued)
Total expense recognised in the income statement
2008 2007 £m £m
Current service cost - -
Interest on obligation 18.7 17.9
Expected return on assets (22.7) (22.1)
(4.0) (4.2)
The expense is recognised in the following line items in the income statement:
2008 2007 £m £m
Finance costs 18.7 17.9
Finance income (22.7) (22.1)
(4.0) (4.2)
Actuarial gains and losses recognised directly in equity
2008 2007 £m £m
Cumulative amount at 1 January 27.4 (0.9)
Recognised during the period (71.7) 28.3
Cumulative amount at 31 December (44.3) 27.4
Amounts recognised in the statement of recognised income and expense restated 2008 2007 £m £m
Difference between actual and expected return on scheme assets (81.4) (9.3)
Experience loss on scheme liabilities (1.6) (1.0)
Changes in assumptions underlying the present value of scheme obligations 11.3 38.6
(71.7) 28.3
Adjustment in respect of minimum funding requirement and non-recognition of surplus 42.1 (32.5)
(29.6) (4.2)
Changes in the present value of the defined benefit obligation 2008 2007 £m £m
Opening present value of defined benefit obligation 321.1 349.0
Interest cost 18.7 17.9
Actuarial gains (9.7) (37.6)
Less benefits paid (16.3) (8.2)
Closing present value of defined benefit obligation 313.8 321.1
90

Pend
rago
n PL
CA
nnua
l Rep
ort
08
NOTES TO THE FINANCIAL STATEMENTSContinued
28. cont Employee benefits (continued)
Movement in fair value of scheme assets during the period 2008 2007 £m £m
Opening fair value of assets 307.3 283.8
Expected return on assets 22.7 22.1
Actuarial losses on assets (81.4) (9.3)
Contributions by employer 19.0 18.9
Less benefits paid (16.3) (8.2)
End of period 251.3 307.3
History of experience adjustments restated restated 2008 2007 2006 2005 2004 £m £m £m £m £m
Present value of defined benefit obligation 313.8 321.1 349.0 300.9 249.6
Fair value of scheme assets 251.3 307.3 283.8 210.5 169.4
Adjustment in respect of minimum funding requirement and non-recognition of surplus (2.9) (45.0) (12.5) - -
Deficit in schemes 65.4 58.8 77.7 90.4 80.2
Experience adjustments on scheme liabilities
Amount (9.7) (37.6) (8.0) 38.5 10.1
Percentage of scheme liabilities (%) (3.1)% (11.7)% (2.3)% 12.8% 4.0%
Experience adjustments on scheme assets
Amount (81.4) (9.3) 10.1 21.4 8.3
Percentage of scheme liabilities (%) (25.9)% (2.9)% 2.9% 7.1% 3.3%
Related party transactions
Subsidiaries
The Group’s ultimate parent company is Pendragon PLC. A listing of all principal trading subsidiaries is shown within the financial statements of the
Company on pages 98 and 99.
Joint venture
The Group has a 51% ordinary share capital interest in a joint venture PPH0 Limited, whose principal activity is that of a property company. The Group
occupies properties owned by PPH0 Limited and its group on short term leases.
During the year the Group entered into transactions with its related party and has balances outstanding at 31 December as follows:
29.
2008 2007 £m £m
Rent paid to related party 23.5 23.1
Proceeds of property sold to related party - 2.1
Management fee received from related party 0.3 0.2
Amounts owed to related party - -
Amounts owed from related party - -
91
Pend
rago
n PL
CA
nnua
l Rep
ort
08
NOTES TO THE FINANCIAL STATEMENTSContinued
29. cont Related party transactions (continued)
Transactions with key management personnel
The key management personnel of the Group comprise the executive and non-executive directors. The details of the remuneration, long term incentive
plans, shareholdings, share option and pension entitlements of individual directors are included in the Directors’ Remuneration Report on pages 32 to 39.
Directors of the Company and their immediate relatives control 5.72% of the ordinary shares of the Company.
During the year key management personnel compensation was as follows:
2008 2007 £m £m
Short term employee benefits 1.4 1.7
Post-employment benefits 0.3 0.3
1.7 2.0
Deferred Income
The Group entered into a sale and leaseback arrangement in December 2006 with its joint venture Company PPH0 Limited, in which a number of
properties were disposed of generating total proceeds of £250.1m. The arrangement entitles PPH0 Limited to lease back those properties to the Group
over a period of 25 years, a factor resulting in the Group receiving a consideration in excess of the deemed fair value as at the date of disposal, when
measured under an open market valuation in accordance with IFRS. The proceeds received were estimated to be greater than the fair value of the
properties by £17.8m and as required by IAS 17 ‘Leases’ this excess over fair value is deferred and will be amortised over the period of the leases. At 31
December 2008 the unamortised amount of the deferred income was £15.1m, all shown within non-current liabilities. In addition, the leases include fixed
rental increases. Deferred income includes £4.6m in this respect, which is recorded within non-current liabilities. (2007 total deferred revenue: £21.1m,
£0.9m current, £20.2m non-current).
30.
Non-current assets classified as held for sale
The Group holds a number of freehold properties that are currently being marketed for sale which are expected to be disposed of during 2009.
During the year impairment losses of £11.9m on the remeasurement of these assets to the lower of their carrying amount and their value less costs to sell
were recognised in the income statement within operating expenses (2007: £nil).
During the year non-current assets classified as held for sale disposed of realised a loss of £1.6m which is included on the income statement under ‘Other
income - gains on the sale of businesses and property’ (2007: profit of £6.8m).
These properties form part of central segment assets.
31.
Accounting estimates and judgements
Estimates and judgements are continually evaluated and are based on historical experience and other factors, including expectations of future events that
are believed to be reasonable under the circumstances.
Critical accounting judgements when applying the Group’s accounting policies
Certain critical accounting judgements in applying the Group’s accounting policies are described below:
Goodwill impairment
The carrying value of goodwill is tested annually for impairment by using cash flow projections for each cash generating unit. These projections are based
upon planned results for the next four years and cash flows then projected into perpetuity. An average discount rate of 13.3% is used.
32.
92

Pend
rago
n PL
CA
nnua
l Rep
ort
08
NOTES TO THE FINANCIAL STATEMENTSContinued
32. cont Accounting estimates and judgements
Intangible assets
Management undertook a review of intangible assets that are pertinent to the motor business. This included consideration of customer lists, franchise rights,
brands and other intangible assets. The review concluded that for acquisitions undertaken since 1 January 2004 no intangible assets or rights had been
acquired with the exception of the value attaining to the order book that existed at the point of acquisition.
Consignment inventories
Consignment vehicles are regarded as being effectively under the control of the Group and are included within inventories on the balance sheet as the
Group has the significant risks and rewards of ownership even though legal title has not yet passed. The corresponding liability is included in trade and
other payables.
Repurchase commitments
The Group enters into leasing arrangements whereby it agrees to repurchase vehicles from lessees or providers of lease finance at the end of the lease
agreement, typically two to four years in the future. The repurchase price is determined at the time the agreement is entered into based on the then
estimate of a vehicle’s future residual value. The actual value of the vehicles at the end of the lease contract, and therefore the proceeds that can be realised
from eventual sale, can vary materially from these estimates. Annual reviews are undertaken to reappraise residual values and to recognise impairment
write downs where necessary.
Employee post retirement benefit obligations
The Group has six defined benefit pension plans. The obligations under these plans are recognised in the balance sheet and represent the present value
of the obligation calculated by independent actuaries, with input from management. These actuarial valuations include assumptions such as discount rates,
return on assets and mortality rates. These assumptions vary from time to time according to prevailing economic conditions. Details of assumptions used
are provided in note 28.
Deferred tax
Deferred tax assets and liabilities require management judgement in determining the amounts to be recognised. In particular, judgement is used when
assessing the extent to which deferred tax assets should be recognised with consideration given to the timing and level of future taxable income.
Income tax
The actual tax on the Group’s profits is determined according to complex laws and regulations. Where the effect of these laws and regulations is unclear,
estimates are used in determining the liability for the tax to be paid on past profits which are recognised in the financial statements. The Group considers
the estimates, assumptions and judgements to be reasonable but this can involve complex issues which may take a number of years to resolve. The final
determination of prior year tax liabilities could be different from the estimates reflected in the financial statements.
Value Added Tax
The Group is in discussion with HM Revenue and Customs over a number of issues arising from recent developments in case law, the treatment of partial
exemption within the companies supplying finance and insurance services and the VAT treatment of sales of vehicles to certain disabled customers. Whilst
the outcome of these issues have still to be resolved, management have made an assessment as to the potential liabilities that may arise in the future.
93
Pend
rago
n PL
CA
nnua
l Rep
ort
08
NOTES TO THE FINANCIAL STATEMENTSContinued
Term loan Expiry date £m
June 2009 20.0
December 2009 20.0
June 2010 20.0
December 2010 20.0
June 2011 20.0
December 2011 20.0
April 2012 90.0
Total term loan 210.0
Revolving credit facility April 2012 210.0
420.0
Subsequent events
Due to the abnormal trading conditions experienced in the year covenants due to be measured at 31 December 2008 in relation to the £510m credit
facility and USD and GBP loan notes were deferred at a cost of £2.9m. The full £2.9m should under IAS 39 be capitalised and amortised over the remaining
life of the loan but has been expensed in the current year income statement given the refinancing activities undertaken as described below.
The Group has since been refinanced and on 30 April 2009 new loan agreements restructuring the existing loans and loan notes have been made as
follows:
33.
Fair value at Fair value net of swapsLoan notes Expiry date 31 December 2008 at 31 December 2008
5.65% USD 110 million loan notes 2011 April 2012 79.2 57.6
5.95% USD 67 million loan notes 2014 April 2012 51.0 35.5
5.95% GBP 17 million loan notes 2014 April 2012 18.5 17.1
148.7 110.2
The terms of the refinancing are shown in detail in note 18.
94
Contingent liabilities
The Group is in discussion with HM Revenue and Customs over issues which may result in additional liabilities to be recognised in future periods and
although these liabilities, if any, could potentially be significant, it is not possible at present to quantify them. Accordingly no amounts have been included in
the 2008 financial statements in respect of these issues.
33.

Pend
rago
n PL
CA
nnua
l Rep
ort
08
COMPANY BALANCE SHEETat 31 December 2008
2008 2007 £m £m
Fixed assets
Investments 850.6 930.9
Loans to subsidiary undertakings 90.0 90.0
940.6 1,020.9
Current assets
Debtors 57.7 23.4
Cash at bank and in hand 26.0 32.8
83.7 56.2
Creditors: amounts falling due within one year (480.6) (639.4)
Net current liabilities (396.9) (583.2)
Total assets less current liabilities 543.7 437.7
Creditors: amounts falling due after more than one year (463.4) (295.6)
Net assets 80.3 142.1
Capital and reserves
Called up share capital 32.8 32.8
Share premium account 56.8 56.8
Capital redemption reserve 2.5 2.5
Other reserves 13.9 13.9
Profit and loss account (25.7) 36.1
Equity shareholders’ funds 80.3 142.1
Notes
5
6
7
8
10
11
11
11
11
Approved by the Board of Directors on 30 April 2009 and signed on its behalf by:
T G Finn
Chief Executive
D R Forsyth
Finance Director
The notes on pages 96 to 102 form part of these financial statements
95

Pend
rago
n PL
CA
nnua
l Rep
ort
08
RECONCILIATION OF MOVEMENTS IN SHAREHOLDERS’ FUNDSYear ended 31 December 2008
NOTES TO THE FINANCIAL STATEMENTS OF THE COMPANY
2008 2007 £m £m
Loss for the financial year (46.0) (19.5)
Dividends paid (15.9) (25.4)
(61.9) (44.9)
Purchase of own shares in share trusts 0.1 1.0
Disposal of own shares in share trusts - (1.2)
Net reduction to shareholders’ funds (61.8) (45.1)
Opening shareholders’ funds 142.1 187.2
Closing shareholders’ funds 80.3 142.1
Notes
4
The notes on pages 96 to 102 form part of these financial statements
Pend
rago
n PL
CA
nnua
l Rep
ort
08
Accounting policies
(a) Accounting convention The financial statements have been prepared in accordance with applicable UK accounting standards using the historical cost
convention. The financial statements have been prepared on a going concern basis.
(b) Deferred taxation Full provision is made for deferred taxation on all timing differences which have arisen but have not reversed at the balance sheet
date, except as follows:
(i) tax payable on the future remittance of the past earnings of subsidiaries is provided only to the extent that dividends have been accrued as receivable
or a binding agreement to distribute all past earnings exists;
(ii) deferred tax assets are recognised only to the extent that it is more likely than not that they will be recovered.
Deferred tax is measured on a non discounted basis at the tax rates that are expected to apply in the periods in which the timing differences reverse, based
on tax rates and laws substantively enacted at the balance sheet date.
(c) Financial instruments The Company holds derivative financial instruments to hedge currency and interest risks arising from its activities. Derivative
financial instruments are recognised at fair value. Any gain or loss on remeasurement is recognised in the profit and loss account. However, the treatment
of gains or losses arising from derivatives which qualify for hedge accounting depends on the nature of the hedged item itself. The fair value of derivatives is
the estimated amount receivable or payable to terminate the contract determined by reference to the market prices prevailing at the balance sheet date.
In accordance with its treasury policy, the Company has swapped its fixed rate USD liabilities into floating rate GBP liabilities by utilising cross currency
interest rate swaps.
As permitted by Financial Reporting Standard 26 ‘Financial Instruments: Measurement’ these policies were adopted on 1 January 2005.
Fair value hedges
Where a derivative financial instrument hedges the changes in fair value of recognised assets or liabilities, any gain or loss is recognised in profit and loss.
The hedged item is also stated, separately from the derivative, at fair value in respect of the risk being hedged with any gain or loss also recognised in profit
and loss. This will result in variations in the balance sheet values of the gross debt and the offsetting derivatives as the market value fluctuates.
1.
96

Pend
rago
n PL
CA
nnua
l Rep
ort
08
NOTES TO THE FINANCIAL STATEMENTS OF THE COMPANYContinued
1. cont Accounting policies (continued)
(d) Investments Investments held as fixed assets are stated at cost less any impairment losses.
(e) Employee benefits – Share based payments The Company operates a number of employee share option schemes. The fair value at the date at which
the share options are granted is recognised in profit and loss on a straight line basis over the vesting period, taking into account the number of options that
are expected to vest. The number of options that are expected to become exercisable is reviewed at each balance sheet date and if necessary estimates
are revised. In accordance with the transitional provisions of FRS 20, no profit and loss expenses are recorded in respect of grants of share options made
prior to 7 November 2002.
(f) Pensions The Company participates in a Group wide defined contribution pension scheme. The assets of the scheme are held separately from those
of the Company in an independently administered fund. The amount charged to the profit and loss account represents the contributions payable to the
scheme in respect of the accounting period.
The Company participates in a Group wide pension scheme providing benefits based on final pensionable pay. The assets of the scheme are held separately
from those of the Company. The Company is unable to identify its share of the underlying assets and liabilities of the scheme on a consistent and reasonable
basis and therefore, as required by FRS 17 ‘Retirement benefits’, accounts for the scheme as if it were a defined contribution scheme. As a result, the amount
charged to the profit and loss account represents the contributions payable to the scheme in respect of the accounting period.
(g) Related parties Under FRS 8 the Company has relied upon the exemption not to disclose related party transactions with other Group undertakings
as they are all included in the Pendragon PLC consolidated financial statements.
(h) Dividends Dividends proposed by the Board and unpaid at the end of the year are not recognised in the financial statements until they have been
approved by the shareholders at the Annual General Meeting. Interim dividends are recognised when they are paid.
(i) Own shares held by ESOP trust Transactions of the Group-sponsored ESOP trust are included in the Company financial statements. In particular, the
trust’s purchases and sales of shares in the Company are debited and credited directly to equity.
(j) Contingent liabilities Where Pendragon PLC, the Company enters into financial guarantee contracts to guarantee the indebtedness of other companies
within its Group, the Company considers these to be insurance arrangements, and accounts for them as such. In this respect, the Company treats the
guarantee contract as a contingent liability until such time as it becomes probable that the Company will be required to make a payment under the
guarantee.
Profit and loss account of the Company
In accordance with the exemption allowed by Section 230 (4) of the Companies Act 1985, the profit and loss account of the Company is not presented.
The loss after taxation attributable to the Company dealt with in its own accounts for the year ended 31 December 2008 is £46.0m (2007: £19.5m).
2.
Directors
Total emoluments of directors (including pension contributions) amounted to £1.7m (2007: £2.0m). Information relating to directors’ emoluments, share
options and pension entitlements is set out in the Directors’ Remuneration Report on pages 32 to 39.
The directors are the only employees of the Company.
3.
97

Pend
rago
n PL
CA
nnua
l Rep
ort
08
NOTES TO THE FINANCIAL STATEMENTS OF THE COMPANYContinued
4. Dividends
2008 2007 £m £m
Ordinary shares
Final dividend in respect of 2007 of 2.00p per share (2006: 2.00p) 12.7 12.7
Interim dividend in respect of 2008 of 0.50p per share (2007: 2.00p) 3.2 12.7
15.9 25.4
The Board are not recommending a final dividend for 2008.
5. Investments
Shares in Shares in joint subsidiary venture undertakings Total £m £m £m
At 31 December 2007 21.7 909.2 930.9
Provision for impairment (21.7) (58.6) (80.3)
At 31 December 2008 - 850.6 850.6
Shares in jointly controlled undertakings represent a 51 percent holding of the issued ordinary share capital of PPH0 Limited, a property Company
incorporated and trading in the United Kingdom.
The investment in PPH0 Limited has been fully impaired as a result of the circumstances described in note 13 of the group financial statements. An
impairment charge of £58.6m has been recognised in respect of shares in subsidiary undertakings as a result of business units pending closure and current
trading conditions.
Shares in subsidiary undertakings are stated at cost. Pendragon PLC owns directly or indirectly 100 percent of the issued ordinary share capital of the
following principal subsidiaries.
Name Activity
Incorporated in Great Britain:
Alloy Racing Equipment Limited Motor vehicle dealer
Andre Baldet Limited Motor vehicle dealer
Bramall Contracts Limited Contract hire & fleet management
Bramall Quicks Dealerships Limited Motor vehicle dealer
Bridgegate Limited Motor vehicle dealer
Car Fleet Control Limited Computer systems and services
CD Bramall (York) Limited Motor vehicle dealer
CD Bramall Dealerships Limited Motor vehicle dealer
CD Bramall Motors Limited Motor vehicle dealer
Charles Sidney Holdings Limited Motor vehicle dealer
Chatfields-Martin Walter Limited Motor vehicle dealer
Derwent Vehicles Limited Motor vehicle dealer
Evans Halshaw (Chesham) Limited Motor vehicle dealer
Evans Halshaw Motors Limited Motor vehicle dealer
Executive Motors Limited Motor vehicle dealer
National Fleet Solutions Limited Motor vehicle dealer
Pendragon Contracts Limited Contract hire & fleet management
Pendragon Extra Limited Plant leasing and rentals
Pendragon Finance and Insurance Limited Motor vehicle finance and insurance services
Pendragon Javelin Limited Motor vehicle dealer
Pendragon Management Services Limited Management services
98

Pend
rago
n PL
CA
nnua
l Rep
ort
08
Investments (continued)
Name Activity
Incorporated in Great Britain:
Pendragon Motor Group Limited Motor vehicle dealer
Pendragon Motorcycles Limited Motor vehicle dealer
Pendragon Orient Limited Motor vehicle dealer
Pendragon Premier Limited Motor vehicle dealer
Pendragon Property Holdings Limited Property holdings
Pendragon Sabre Limited Motor vehicle dealer
Pendragon Viking Limited Motor vehicle dealer
Petrogate Limited Property holdings
Pinewood Technologies PLC * Computer systems and services
Reg Vardy (AMC) Limited Motor vehicle dealer
Reg Vardy (MML) Limited Motor vehicle repairs
Reg Vardy (Property Management) Limited Property holdings
Reg Vardy (TMC) Limited Motor vehicle dealer
Reg Vardy (VMC) Limited ** Motor vehicle dealer
Reg Vardy Limited * Motor vehicle dealer
Stratstone Specialist Limited Motor vehicle dealer
Stripestar Limited Motor vehicle dealer
Trust Properties Limited Property holdings
Vardy (Continental) Limited Motor vehicle dealer
Vardy Marketing Limited Marketing services
Vertcell Limited Motor vehicle parts distribution
Victoria (Bavaria) Limited Motor vehicle dealer
Incorporated in the United States of America:
Bauer Motors Inc. Motor vehicle dealer
Penegon West Inc. Motor vehicle dealer
Penegon Mission Viejo Inc. Motor vehicle dealer
Penegon Newport Beach Inc. Motor vehicle dealer
5. cont
* Direct subsidiary of Pendragon PLC
** Pendragon PLC owns 95% of the issued ordinary share capital and operates the company under an agreement with the manufacturer.
6. Debtors
2008 2007 £m £m
Amounts due within one year :
Corporation tax 10.6 20.9
Other debtors 0.2 2.5
10.8 23.4
Amounts due after more than one year :
Deferred tax (see note 9) 8.4 -
Derivative financial instruments 38.5 -
46.9 -
57.7 23.4
NOTES TO THE FINANCIAL STATEMENTS OF THE COMPANYContinued
99

Pend
rago
n PL
CA
nnua
l Rep
ort
08
NOTES TO THE FINANCIAL STATEMENTS OF THE COMPANYContinued
7. Creditors : amounts falling due within one year
2008 2007 £m £m
Unsecured bank loans 40.0 40.0
Amounts due to subsidiary undertakings 440.6 599.4
480.6 639.4
8. Creditors : amounts falling due after more than one year
2008 2007 £m £m
Unsecured bank loans (repayable between one and two years) 40.0 40.0
Unsecured bank loans (repayable between two and five years) 274.7 145.2
Unsecured loan notes (repayable between two and five years) 79.2 54.6
Unsecured loan notes (repayable after five years) 69.5 50.2
Derivative financial instruments - 5.6
463.4 295.6
Unsecured loan notes (repayable after five years) comprise: 2008 2007 £m £m
5.95% USD 67 million loan notes 2014 51.0 33.3
5.95% GBP 17 million loan notes 2014 18.5 16.9
69.5 50.2
9. Deferred tax
The movements in the deferred tax asset for the year are as follows: Deferred tax £m
At 31 December 2007 -
Profit and loss account 8.4
At 31 December 2008 8.4
Deferred tax asset is shown within debtors (see note 6)
The amount of deferred tax asset in the financial statements is as follows:
2008 2007 £m £m
Losses 7.7 -
Other timing differences 0.7 -
8.4 -
100
A deferred tax asset has been recognised in respect of tax losses carried forward at 31 December 2008 as it is expected that the Company will generate
sufficient taxable profits in the foreseable future for these tax losses to be utlised against.

Pend
rago
n PL
CA
nnua
l Rep
ort
08
NOTES TO THE FINANCIAL STATEMENTS OF THE COMPANYContinued
10. Called up share capital
Number £m
Authorised shares of 5p each at 31 December 2007 and at 31 December 2008 800,000,000 40.0
Allotted, called up and fully paid shares of 5p each at 31 December 2007 and at 31 December 2008 656,027,350 32.8
Movements in the number of options to acquire ordinary shares under the Group's various share option schemes, together with exercise prices and the
outstanding position at 31 December 2008 are fully disclosed above on page 85 of this report.
11. Reserves
Share Capital Profit premium redemption Other and loss account reserve reserves account £m £m £m £m
At 31 December 2007 56.8 2.5 13.9 36.1
Loss for the financial year - - - (46.0)
Dividends paid - - - (15.9)
Disposal of own shares in share trusts - - - 0.1
At 31 December 2008 56.8 2.5 13.9 (25.7)
The market value of the investment in the Company's own shares at 31 December 2008 was £0.3m (2007: £7.2m), being 19.8m (2007: 20.4m) shares with
a nominal value of 5p each, acquired at an average cost of £0.40 each (2007 : £0.44). The amounts deducted from retained earnings for shares held by
ESOP trusts at 31 December 2008 was £8.0m (2007: £8.1m). The investment in own shares represents shares in the Company held by Pendragon Quest
Trustees Limited and Investec Trust Guernsey Limited (employee share ownership trusts) which may subsequently be awarded to executive directors and
employees under the Pendragon 1999 Approved Executive Share Option Scheme, Pendragon 1999 Unapproved Executive Share Option Scheme and the
1998 Pendragon Sharesave Scheme. Details of the plans are given in the Directors' Remuneration Report on pages 32 to 39.
Dividends on the shares owned by the trusts, the purchase of which were funded by interest free loans to the trusts from Pendragon PLC, are waived. All
expenses incurred by the trusts are settled directly by Pendragon PLC and charged in the accounts as incurred.
12. Financial instruments and derivatives
2008 2007 £m £m
Changes in fair value charged to profit and loss 0.1 (0.1)
Details of valuation techniques and fair values of each category of financial instruments are given above in note 18 to the consolidated financial statements
on page 75 in the section headed 'Fair value hedges of interest rate and currency risk'.
13. Pensions
The Company is a member of a funded Group wide pension scheme (Pendragon Pension Plan) providing benefits based on final pensionable pay. The
Company is unable to identify its share of the scheme assets and liabilities on a consistent and reasonable basis and as permitted by FRS 17 ‘Retirement
Benefits’, the scheme has been accounted for in these financial statements as if the scheme was a defined contribution scheme. At 31 December 2008 the
scheme had a deficit on an FRS 17 basis of £27.2m (2007: £3.8m).
The latest full actuarial valuation was carried out at 5 April 2006 and was updated for FRS 17 purposes to 31 December 2008 by a qualified independent
actuary.
The Company has no outstanding pension contributions (2007: £nil).
101

Pend
rago
n PL
CA
nnua
l Rep
ort
08
NOTES TO THE FINANCIAL STATEMENTS OF THE COMPANYContinued
14. Contingent liabilities
(a) The Company has entered into cross-guarantees with its bankers whereby it guarantees payment of bank borrowings in respect of UK subsidiary
undertakings.
(b) The Company has given performance guarantees in the normal course of business in respect of subsidiary undertaking obligations.
Term loan Expiry date £m
June 2009 20.0
December 2009 20.0
June 2010 20.0
December 2010 20.0
June 2011 20.0
December 2011 20.0
April 2012 90.0
Total term loan 210.0
Revolving credit facility April 2012 210.0
420.0
15. Post balance sheet event
Due to the abnormal trading conditions experienced in the year covenants due to be measured at 31 December 2008 in relation to the £510m credit
facility and USD and GBP loan notes were deferred at a cost of £2.9m.
The Company has since been refinanced and on 30 April 2009 new loan agreements restructuring the existing loans and loan notes have been made as
follows:
Fair value at Fair value net of swapsLoan notes Expiry date 31 December 2008 at 31 December 2008
5.65% USD 110 million loan notes 2011 April 2012 79.2 57.6
5.95% USD 67 million loan notes 2014 February 2014 51.0 35.5
5.95% GBP 17 million loan notes 2014 February 2014 18.5 17.1
148.7 110.2
The holders of the 2014 loan notes have an option to require repayment in April 2012.
The terms of the refinancing are shown in detail in note 18 to the consolidated financial statements on page 79.
102

Pend
rago
n PL
CA
nnua
l Rep
ort
08
103
SHAREHOLDER INFORMATION
Stock classification The ordinary shares of the Company are traded on the London Stock Exchange. Information concerning the day to day movement
of the share price can be found on the London Stock Exchange’s website under the code PDG. Users of GlobalTOPIC Trader and Reuters can identify the
stock by the code PDG.L, and Bloomberg users by the code PDG LN.
Share dealing service The following companies offer private investors a quick and easy telephone share dealing service for dealings in the Company’s
shares.
Barclays Stockbrokers Limited will purchase and sell shares at the following commission rates plus stamp duty and PTM Levy of £1 where applicable, subject
to the minimum dealing charge of £15.00 per transaction.
1.5% commission on first £5,000
0.85% commission on the next £5,000
0.15% commission thereafter
Calls made to 0845 numbers are free for BT residential customers part of their inclusive call package; otherwise calls will cost no more than 4p per minute
plus 8p call set-up fee (current as at February 2009). The price on non-BT phone lines may vary; please check with your service provider. You can only
use these numbers if you are calling from within the UK. Calls may be recorded to monitor the quality of service, to check instructions and for security
purposes.
Barclays Stockbrokers is the group name for the businesses of: Barclays Stockbroker Limited, a member of the London Stock Exchange and PLUS.
Registered No. 1986161; Barclays Sharedealing, Registered No. 20941; and Barclays Bank Trust Company Limited, Registered No. 920880. All companies
are registered in England and the registered address is: 1 Churchill Place, London, E14 5HP. All companies are authorised and regulated by the Financial
Services Authority.
Capita Registrars, a Trading Division of Capita IRG Trustees Limited, will purchase and sell shares at the following commission rates plus stamp duty and PTM
Levy where applicable. Online (via www.capitadeal.com) at commission of 1% of the value of the trade, minimum £20/maximum £52.50 dealing charge, or
by telephone on 0871 664 0364* at commission of 1.5% of the value of the trade, minimum £25/maximum £102.50 dealing charge.
Further details of the services including full Terms and Conditions may be obtained by telephoning 0871 664 0364 (*calls charged at national rates).
In so far as this statement constitutes a financial promotion it has been approved for the purpose of Section 21 (2) (b) of the Financial Services and Markets
Act 2000 only by Capita IRG Trustees Limited who are authorised and regulated by the Financial Services Authority (www.fsa.gov.uk/register Register
Number 184113).
This is not a recommendation to buy, sell or hold shares in Pendragon PLC. If you are unsure of what action to take, you should contact a financial advisor
authorised under the Financial Services and Markets Act 2000. Please note that share values may go down as well as up, which may result in you receiving
less than the amount originally invested.
Where the document containing this Shareholder Information on share dealing services has been received in a country where the provision of such a
service would be contrary to local laws or regulations, this should be treated as for information only.

ADDR
ESS
Pend
rago
n PL
C, N
eway
Hou
se, L
ittle
Oak
Driv
e, A
nnes
ley,
Not
tingh
am, N
G15
0D
R
TELE
PHON
E FA
X01
623
7250
00
0162
3 72
5010
WEB
ww
w.p
endr
agon
plc.
com
DESI
GNSt
rats
tone
Mar
ketin
g, N
eway
Hou
se, L
ittle
Oak
Driv
e, A
nnes
ley,
Not
tingh
am, N
G15
0D
R