pell grants - ed
TRANSCRIPT
Jenna Ashley Robinson and Duke Cheston
J U N E 2 0 1 2 P O P E C E N T E R S E R I E S O N H I G H E R E D U C A T I O N
Pell Grants: Where Does All the Money Go?
About the Authors
Jenna Ashley Robinson joined the Pope Center as outreach coordinator in
January 2007. She was previously the E.A. Morris Fellowship assistant at the
John Locke Foundation, where she has worked since 2001. Robinson graduated
from North Carolina State University in 2003 with a major in political science
and French. She received her master’s degree in political science from UNC-Chapel
Hill in December 2005 and her Ph.D. in political science, with a concentration in
American politics and a minor in methods, in 2012.
Duke Cheston joined the Pope Center in 2010 as a reporter and writer. He is
a 2010 graduate of UNC-Chapel Hill, where he studied biology. At UNC he wrote
for Carolina Review, UNC’s only conservative publication. He wrote a number
of provocative articles and won several awards, including “Article of the Year.”
Since starting work for the Pope Center, Cheston has also participated in the
Claremont Institute’s Publius Fellowship Program and the E.A. Morris Fellowship
for Emerging Leaders.
Pell Grants: Where Does All the Money Go?
Copyright 2012 John W. Pope Center for Higher Education Policy
This paper is available on the Pope Center website: popecenter.org.
Distribution of this paper is encouraged as long as proper credit is given to the authors and the Pope Center.
333 E. Six Forks Road
Suite 150
Raleigh, NC 27609
919.828.1400
Fax: 919.828.7455
popecenter.org
2 PELL GRANTS: WHERE DOES ALL THE MONEY GO?
To the Reader
The federal Pell Grant Program provides grants to millions of college students. It is the federal
government’s largest education expenditure and costs taxpayers over $35 billion per year.
Although the program started out as a way to provide college access to low-income students, it has
grown so vast in recent years that nearly 60 percent of all undergraduates received a Pell grant for the
academic year 2009-10. Out of the 16.4 million undergraduate students enrolled in the United States,
9.6 million students received Pell grants.
In spite of the high cost, few people have scrutinized the effectiveness of Pell grants. This report, “Pell
Grants: Where Does All the Money Go?” by Jenna Ashley Robinson and Duke Cheston, brings together
what is known about Pell grants to determine how well the program serves the students who receive
them and the taxpayers who fund them.
I urge you to review these surprising findings and consider whether the program should be modified.
Unlike today’s program, it could be directed only to low-income students, and it could be reserved for
those who have shown a degree of commitment to academic work.
This paper is sponsored by the John W. Pope Center for Higher Education Policy, whose mission is
excellence in education. For additional copies, contact the center at [email protected].
Jane S. Shaw President John W. Pope Center for Higher Education Policy
3POPE CENTER SERIES ON HIGHER EDUCATION JUNE 2012
Pell grants are need-based grants given to millions of undergraduate students every year, in amounts ranging from $555 to $5,550 per student.1
The Pell Grant Program is the federal government’s
largest education expenditure. In the 2010-2011
academic year, Pell grants cost taxpayers $35.6 billion.2
Although the program began as a way to provide college
access to low-income students, it has grown so vast in
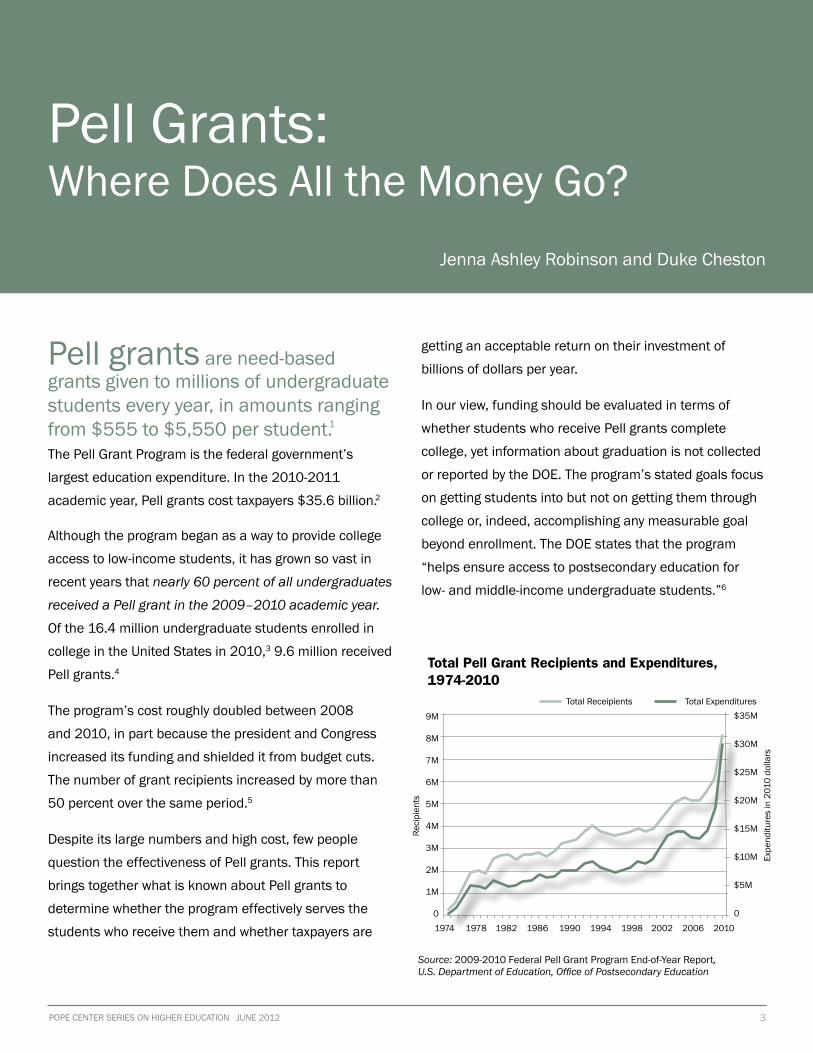
recent years that nearly 60 percent of all undergraduates received a Pell grant in the 2009–2010 academic year. Of the 16.4 million undergraduate students enrolled in
college in the United States in 2010,3 9.6 million received
Pell grants.4
The program’s cost roughly doubled between 2008
and 2010, in part because the president and Congress
increased its funding and shielded it from budget cuts.
The number of grant recipients increased by more than
50 percent over the same period.5
Despite its large numbers and high cost, few people
question the effectiveness of Pell grants. This report
brings together what is known about Pell grants to
determine whether the program effectively serves the
students who receive them and whether taxpayers are
getting an acceptable return on their investment of
billions of dollars per year.
In our view, funding should be evaluated in terms of
whether students who receive Pell grants complete
college, yet information about graduation is not collected
or reported by the DOE. The program’s stated goals focus
on getting students into but not on getting them through
college or, indeed, accomplishing any measurable goal
beyond enrollment. The DOE states that the program
“helps ensure access to postsecondary education for
low- and middle-income undergraduate students.”6
Pell Grants: Where Does All the Money Go?
Jenna Ashley Robinson and Duke Cheston
Source: 2009-2010 Federal Pell Grant Program End-of-Year Report, U.S. Department of Education, Office of Postsecondary Education
1974 1978 1982 1986 1990 1994 1998 2002 2006 2010
9M
8M
7M
6M
5M
4M
3M
2M
1M
0
$35M
$30M
$25M
$20M
$15M
$10M
$5M
0
Expe
nditu
res
in 2
010
dolla
rs
Total Pell Grant Recipients and Expenditures, 1974-2010
Total Receipients Total Expenditures
Reci
pien
ts
4 PELL GRANTS: WHERE DOES ALL THE MONEY GO?
BACKGROUND
Pell began as a 1972 amendment to the Higher
Education Act of 1965. Originally called the Basic
Educational Opportunity Grant, it was renamed in
1980 after Senator Claiborne Pell, who initiated
the amendment.
Profile of a Pell Recipient
The public perception of Pell grant recipients as
eighteen- to twenty-two-year-olds living with low-income
parents is erroneous on several counts. For one thing,
as the figures above indicate, more than half of all
students enrolled in college receive Pell grants, so many
recipients are middle-income, not low-income. Typical
Pell grantees are also older than the typical college
student and are financially independent. They may have
families of their own.
The average Pell grant recipient differs from the typical
undergraduate in a number of ways, as a 2009 study by
Christina Chang Wei and Laura Horn indicates.7 These
researchers used the latest National Center for Education
Statistics (NCES) figures for Pell and non-Pell students
who earned bachelor’s degrees. Thus, they included only
academically successful students and did not include
students who pursued two-year degrees (even though
such individuals do receive Pell grants). Wei and Horn
included all bachelor’s degree recipients, not just lower-
income students who earned bachelor’s degrees.
Sixty percent of Pell recipients in the NCES data were
women, compared with only 56 percent of all
undergraduates. Pell students were 63 percent white,
13 percent Hispanic, 12 percent black, and 7 percent
Asian. Non-Pell students were 80 percent white,
6 percent Hispanic, 6 percent black, and 5 percent Asian.
Grantees also had a number of risk factors that made
them more likely to drop out before obtaining a degree.
For instance, many Pell recipients had delayed enrolling
in college. This is reflected in the data, which show
that 45.7 percent were twenty-five or older when they
graduated, compared to only 27.4 percent of non-
recipients. Another NCES study conducted by Alexandria
Walton Radford et al., reports that Pell grant recipients
also have lower SAT scores than non-recipients: 914 as
compared to 1010.8
The Wei and Horn 2009 study also indicates that Pell
grant recipients who earned bachelor’s degrees are more
likely than non-recipients to be financially independent
(60 percent versus 34 percent), to have dependents
(24 percent versus 13 percent), and to be a single parent
(11 percent versus 4 percent). In addition, nearly twice
as many Pell recipients (proportionally) had parents with
only a high school diploma or less (41 percent versus
21 percent), and nearly twice as many came from non-
English-speaking homes (16 percent versus 8 percent).
All of these circumstances are considered risk factors for
dropping out.
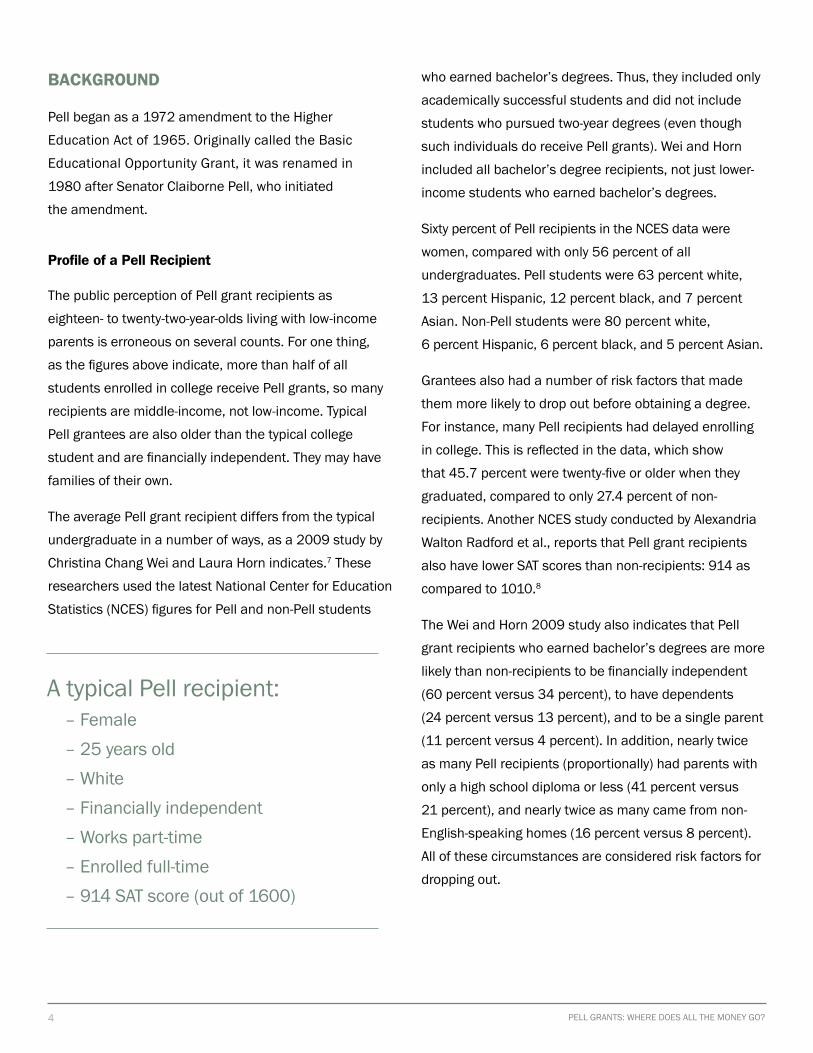
A typical Pell recipient:– Female– 25 years old– White– Financially independent– Works part-time– Enrolled full-time– 914 SAT score (out of 1600)
5POPE CENTER SERIES ON HIGHER EDUCATION JUNE 2012
Who Gets Pell Grants?
Pell grant eligibility is based on several, primarily
financial, criteria and on whether a student is enrolled in
college full-time or part-time.
Eligibility and awards are based on the Expected Family
Contribution (EFC), a figure that is the measure of a
family’s financial strength, including income and assets
as well as family size and other characteristics. Low-
income students often have an EFC of zero, which
guarantees Pell eligibility. (For details on calculating the
amount, see the Appendix.)
Even if a family has a middle-class income, it can
sometimes qualify for a Pell grant. One reason is that
multiple students in the family will be enrolled in college;
another is that the Cost of Attendance (COA) of the
school the student wishes to attend may be high.
Including a COA to calculate the grant means that some
students may qualify for Pell grants if they attend an
expensive school, but not if they select one that is more
affordable. (See the Appendix for details.)
Most Pell grant recipients come from families making
$20,000 per year or less: the figure was 58.9 percent
in 2009–2010.9 This is a large number, and the family
income is low. However, the image may be misleading.
As stated above, the majority of Pell grant recipients,
regardless of income, are independent. That is, they no
longer live with, or depend upon, their parents. As the
2009-2010 end-of-year report from the NCES indicates,
in that year, only 39 percent of all recipients were
dependents. The recipients who were not dependents
fell into two groups—20 percent of all recipients had no
dependents other than a spouse and 39 percent had
dependents other than a spouse.10
Many students do not come from families living in
poverty. As the NCES review shows, in 2009–2010,
roughly 6 percent of Pell grant recipients had a family
income of more than $50,000.11 (The median household
income of the United States was $49,445 in 2007.)12
Almost 20 percent of students who receive Pell grants
come from families in the top three income quartiles
(i.e., earning more than $36,080 in 2009–2010).13
And nearly a quarter of Pell grant students report
family income of more than 133 percent of the federal
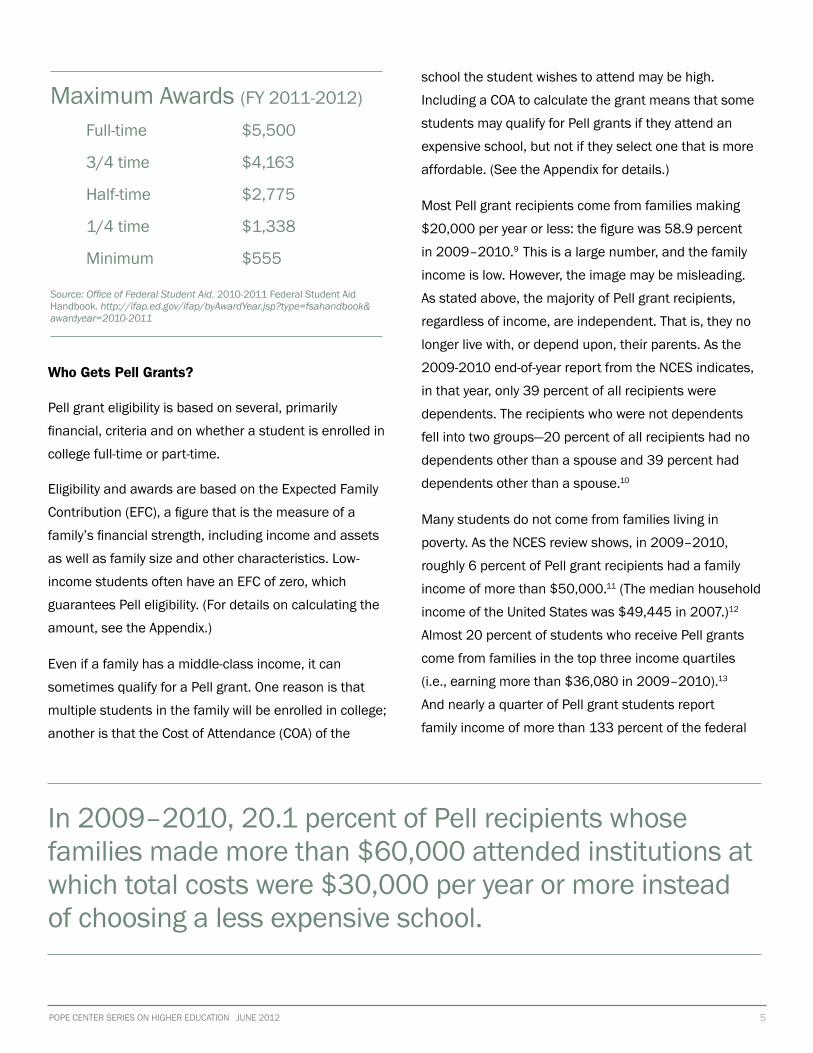
Maximum Awards (FY 2011-2012)
Full-time $5,500
3/4 time $4,163
Half-time $2,775
1/4 time $1,338
Minimum $555
Source: Office of Federal Student Aid. 2010-2011 Federal Student Aid Handbook. http://ifap.ed.gov/ifap/byAwardYear.jsp?type=fsahandbook&awardyear=2010-2011
In 2009–2010, 20.1 percent of Pell recipients whose families made more than $60,000 attended institutions at which total costs were $30,000 per year or more instead of choosing a less expensive school.
6 PELL GRANTS: WHERE DOES ALL THE MONEY GO?
poverty level (that is, income above $30,000), a cutoff
commonly used for qualification for other federal
programs such as Medicaid.14
Many students from this category choose to attend
private schools or expensive public schools. In 2009–
2010, 20.1 percent of Pell recipients whose families
made more than $60,000 attended institutions at which
total costs were $30,000 per year or more (like Wake
Forest University) instead of choosing a less expensive
school (like UNC-Chapel Hill). By comparison, only
13 percent of students whose families made between
$15,001 and $20,000 attended such institutions.15
ACADEMIC QUALIFICATIONS
Academic requirements to receive a Pell grant are fairly
minimal. To be eligible, a student must have earned
a high school diploma or GED (a diploma considered
equivalent to a high school degree), or passed a federally
approved Ability to Benefit test (however, after July 1,
2012, this test will be eliminated as an option.)16 In
order to keep receiving the grant, a student must make
“satisfactory academic progress” toward a college
degree, a standard defined by each institution. This
standard generally includes maintaining a certain GPA
and a certain level of attendance, and passing a certain
percentage of courses.
There is no minimum SAT or ACT score; nor is there a
high school GPA requirement.
Students receiving Pell grants are generally less
academically prepared than other students, as Christina
Chang Wei and Laura Horn indicate in a 2002 NCES
report on Pell recipients.17 This study looked at those
who received Pell grants, not just those who attained
bachelor’s degrees, and found that grantees were twice
as likely to score in the bottom quartile for SAT scores
(25 percent as compared to 12 percent for non-
recipients). Only 21 percent of Pell recipients scored
in the top quartile, compared to 34 percent of non-
recipients. Wei and Horn also showed that Pell recipients
were significantly less likely to have passed through a
rigorous high school curriculum.
While there are highly prepared and poorly prepared
students in both categories, the consistent theme
of these figures is that Pell grant recipients are less
academically prepared than other students to succeed in
and graduate from college.
In Wei and Horn’s 2009 study, Pell grant recipients
tended to have slightly lower GPAs among students who
graduated with a bachelor’s degree (46.2 percent with
GPAs over 3.5, as compared to 50.6 of non-recipients).
Considering the low SAT scores of recipients, this is quite
good, but we can reasonably speculate that GPAs for
Pell grantees would be considerably lower if dropouts
had been included in the study.
Choice of major among Pell recipients was generally
in line with non-recipients, with a few exceptions.
Recipients were more likely to major in education (11.4
percent compared to 7.4 percent) and less likely to major
in business (16.8 percent compared to 23.5 percent).
PARTICIPATION, RETENTION, AND GRADUATION
To determine whether the goals of the Pell Grant
Program are being achieved, we looked at several
standard ways to measure academic success. Do Pell
grants bring more students to college who otherwise
would not attend—that is, do they increase participation
(i.e., enrollment)? Do those recipients stay in college
(that is, do Pell grants increase retention)? And finally,
do grantees graduate in larger numbers than in
the past?
7POPE CENTER SERIES ON HIGHER EDUCATION JUNE 2012
The DOE does not regularly track or publish graduation
rates of Pell recipients. However, Pell recipients are
included in the federal Beginning Postsecondary
Students Longitudinal Study, which publishes graduation
rates about once a decade. Together, these studies
provide a fairly accurate picture of the academic
achievement of Pell grant recipients.
In addition, there are reports on outcomes for low-income
students, many of whom receive Pell grants. Researchers
do not always agree on the definition of low-income. For
the purposes of this report, we consider anyone with an
income in the bottom quartile (less than $36,080 per
year in 2009) to be low-income.
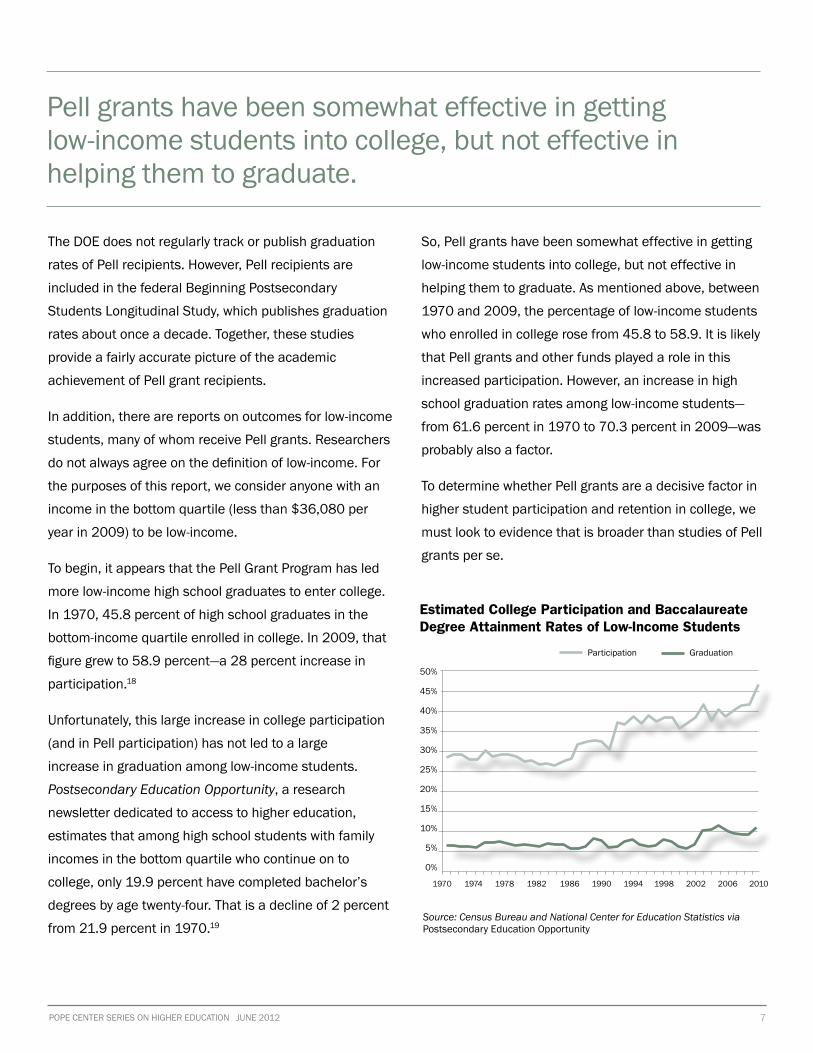
To begin, it appears that the Pell Grant Program has led
more low-income high school graduates to enter college.
In 1970, 45.8 percent of high school graduates in the
bottom-income quartile enrolled in college. In 2009, that
figure grew to 58.9 percent—a 28 percent increase in
participation.18
Unfortunately, this large increase in college participation
(and in Pell participation) has not led to a large
increase in graduation among low-income students.
Postsecondary Education Opportunity, a research
newsletter dedicated to access to higher education,
estimates that among high school students with family
incomes in the bottom quartile who continue on to
college, only 19.9 percent have completed bachelor’s
degrees by age twenty-four. That is a decline of 2 percent
from 21.9 percent in 1970.19
So, Pell grants have been somewhat effective in getting
low-income students into college, but not effective in
helping them to graduate. As mentioned above, between
1970 and 2009, the percentage of low-income students
who enrolled in college rose from 45.8 to 58.9. It is likely
that Pell grants and other funds played a role in this
increased participation. However, an increase in high
school graduation rates among low-income students—
from 61.6 percent in 1970 to 70.3 percent in 2009—was
probably also a factor.
To determine whether Pell grants are a decisive factor in
higher student participation and retention in college, we
must look to evidence that is broader than studies of Pell
grants per se.
Pell grants have been somewhat effective in getting low-income students into college, but not effective in helping them to graduate.
Source: Census Bureau and National Center for Education Statistics via Postsecondary Education Opportunity
1970 1974 1978 1982 1986 1990 1994 1998 2002 2006 2010
50%
45%
40%
35%
30%
25%
20%
15%
10%
5%
0%
Estimated College Participation and Baccalaureate Degree Attainment Rates of Low-Income Students
Participation Graduation
8 PELL GRANTS: WHERE DOES ALL THE MONEY GO?
The National Bureau of Economic Research (NBER), a
private research organization, recently reviewed and
published a study on the available literature on financial
aid. It concluded that lowering the annual price of higher
education by $1,000 (either through tuition reductions
or non-repayable aid) leads to a 3 to 5 percentage point
increase in postsecondary attendance.20 In other words,
the effect of $100,000 spent on one hundred students
would be that three to five students who would not
have chosen to go to college would change their minds
because of the availability of increased aid.
The effect of that $1,000 per student is five times
stronger on students whose families earn $25,000
annually than on students whose families earn $75,000.
This suggests that when Pell grants are targeted toward
very low-income students, they can be effective at
increasing participation rates. However, Pell grants are
no longer targeted toward the very poor.
As mentioned, while the DOE does not regularly release
graduation rates for Pell grantees, it often releases
retention rates. Various scholars have studied these
rates, which reveal two trends: (1) Pell grants have done
little to increase retention rates among most students,
and (2) high school academic performance is more
important than financial aid in determining education
outcomes.
A 2011 study by the American Enterprise Institute
reviewed the existing literature on retention rates in
higher education. The author reported that the estimated
effect of an additional $1,000 in any kind of need-based
aid (not limited to Pell grants) was a 2 to 4 percentage
point increase in retention.21 This is approximately the
same increase reported in the NBER study.
However, the initial positive effects of receiving a Pell
grant do not last throughout a student’s college career.
A 1990 study published in Research in Higher Education
revealed that grants and loans have differential results
on student retention depending on which years the
student is in college when he or she receives them.
Grants become less important the longer a student stays
in school; loans and money earned from work become
more important.22
According to this study, for example, for a first-year
student deciding whether to continue attendance
in college, a $100 increase in grants increased the
probability of attendance by .36 percentage points,
and a $100 increase in loans increased this probability
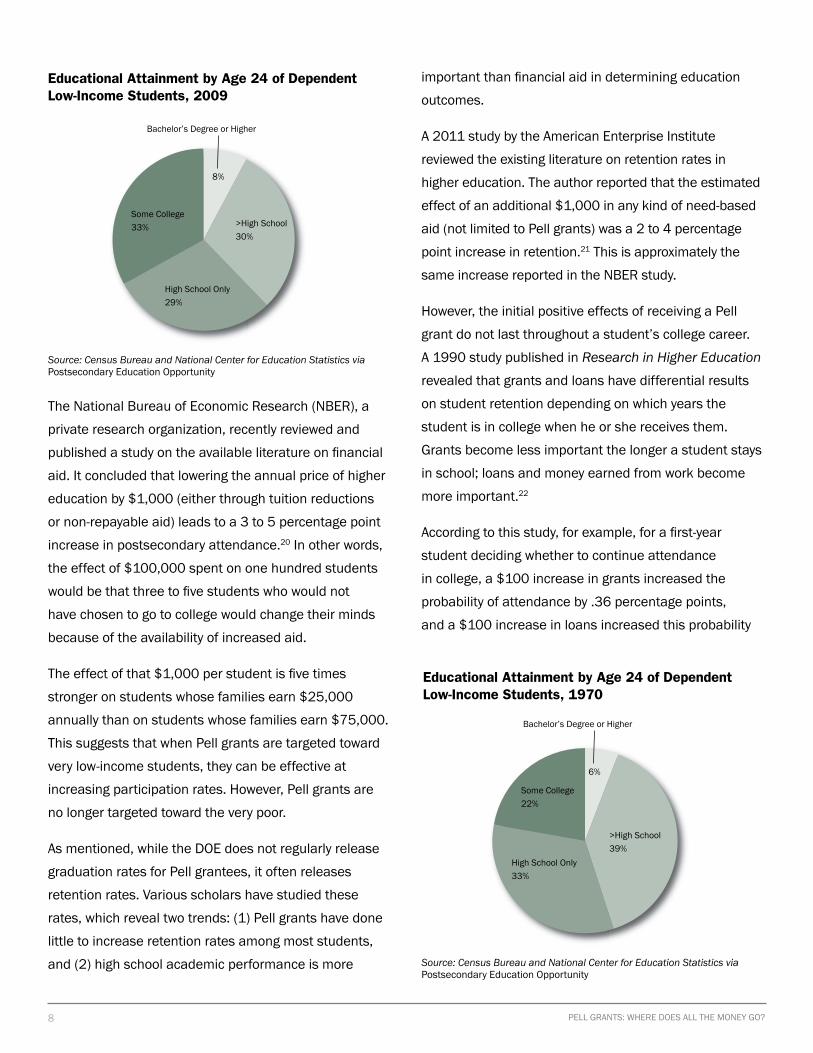
Educational Attainment by Age 24 of Dependent Low-Income Students, 2009
Bachelor’s Degree or Higher
8%
Some College33%
High School Only29%
>High School30%
Educational Attainment by Age 24 of Dependent Low-Income Students, 1970
Bachelor’s Degree or Higher
6%
>High School39%
High School Only33%
Some College22%
Source: Census Bureau and National Center for Education Statistics via Postsecondary Education Opportunity
Source: Census Bureau and National Center for Education Statistics via Postsecondary Education Opportunity
9POPE CENTER SERIES ON HIGHER EDUCATION JUNE 2012
by .20 percentage points. For a third-year student
deciding whether to continue attendance, however, a
$100 increase in grants did not affect the probability
of attendance, and a $100 increase in loans increased
this probability by .23 percentage points. In contrast, a
$100 increase in money earned from work increased the
probability of college attendance for third-year students
by .41 percentage points.
These findings may explain why graduation rates for
Pell recipients remain low. While Pell has a small but
significant influence on most students in their first few
years of school, its apparent effects don’t last until
graduation.
Although few data have been released on Pell recipients’
graduation rates, the NCES study conducted by Radford
et al., does examine graduation rates.23 The authors
found that among all low- and middle-income students
at four-year universities in 2003–2004, Pell grant
recipients graduated at lower rates than non-recipients:
50.4 percent of recipients graduated, while 53.9 percent
of non-recipients graduated.24 While the reasons for this
aren’t entirely clear, perhaps paying for college out-of-
pocket or through loans makes students more reluctant
to “waste” their past spending and drop out—a concern
that does not apply to those receiving “free” grant money.
(This study reported on all students from families earning
$50,000 or less per year.)
Pell did raise graduation rates among one population:
very low-income students. The graduation rate among
very low-income students (AGI ≤ $25,000) was 51 percent
for Pell grants recipients and 44.1 percent for non-
recipients.25 Thus, it appears at first that the original
intent of the program—to help more low-income students
go to college—has, to a limited extent, been achieved.
However, even though Pell grants help low-income
students go to college, the role of high school academic
ability and performance dwarf all financial factors in
predicting retention rates, according the 2002 Wei and
Horn study. The college retention rate of Pell recipients
who took a rigorous curriculum in high school was
87 percent—compared to just 57.6 percent for grantees
who took a basic curriculum or lower in high school.26
Data from the study by Radford et al., strengthen those
findings. Using 2009 NCES data, the authors found that
Pell recipients with SAT scores between 400 and 840
graduated at a rate of 34.2 percent. Those with SAT
scores between 1140 and 1600 graduated at a rate of
73.7 percent.27 Grantees with high school GPAs of 3.5 or
higher graduated at a rate of 72.7 percent. Those with a
GPA of 2.0 to 2.4 graduated at a rate of 29.7 percent.28
WHY SUCH GROWTH IN THE PELL PROGRAM?
Since its inception in 1973, the federal Pell Grant
Program has grown significantly, measured in terms of
participation and expenditures. In the first year of the
program, 176,000 students received Pell grants. In
2010–2011, 9.6 million students received Pell grants—
an astounding increase of nearly 4500 percent.29 Out
of the 16.4 million undergraduate students enrolled in
1974 1978 1982 1986 1990 1994 1998 2002 2006 2010
$6,000
$5,000
$4,000
$3,000
$2,000
$1,000
0
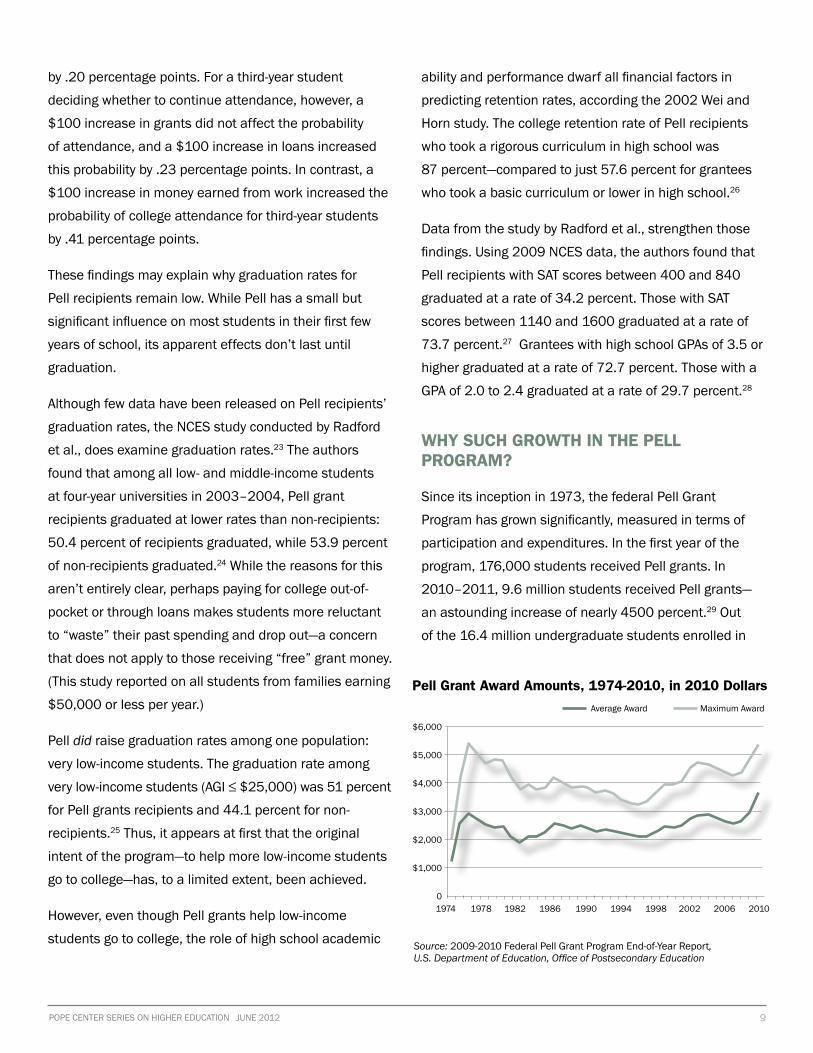
Pell Grant Award Amounts, 1974-2010, in 2010 Dollars
Average Award Maximum Award
Source: 2009-2010 Federal Pell Grant Program End-of-Year Report, U.S. Department of Education, Office of Postsecondary Education
10 PELL GRANTS: WHERE DOES ALL THE MONEY GO?
college in the United States in 2010–2011,30 58 percent
received Pell grants.31
Thus, almost all the growth in Pell Grant Program
expenditures can be traced to the skyrocketing number
of participants. Award amounts have not been increasing;
since 1973, the average and maximum award amounts
for Pell recipients have remained relatively flat in real
terms (see figure 5). During that same time period, tuition
has increased at more than 6 percent per year, perhaps
fueled in part by Pell grants.
Some of the early growth in Pell Grant Program
participation can be attributed to changes in eligibility
requirements. In 1973–1974 only full-time freshmen with
demonstrated financial need were eligible to participate.
In 1974–1975, the program grew to include full-time
sophomores. In 1975–1976, the rules were changed
to include freshmen and sophomores regardless of
enrollment status. And in 1976–1977, the program was
opened to all undergraduate students with demonstrated
financial need. But those early changes in eligibility
contributed to just 17 percent of the growth in the
program’s expenditures. The rest of the growth in Pell
grant expenditures occurred after 1977. Participation
in the Pell program grew 400 percent even after
modifications in eligibility had been instituted.
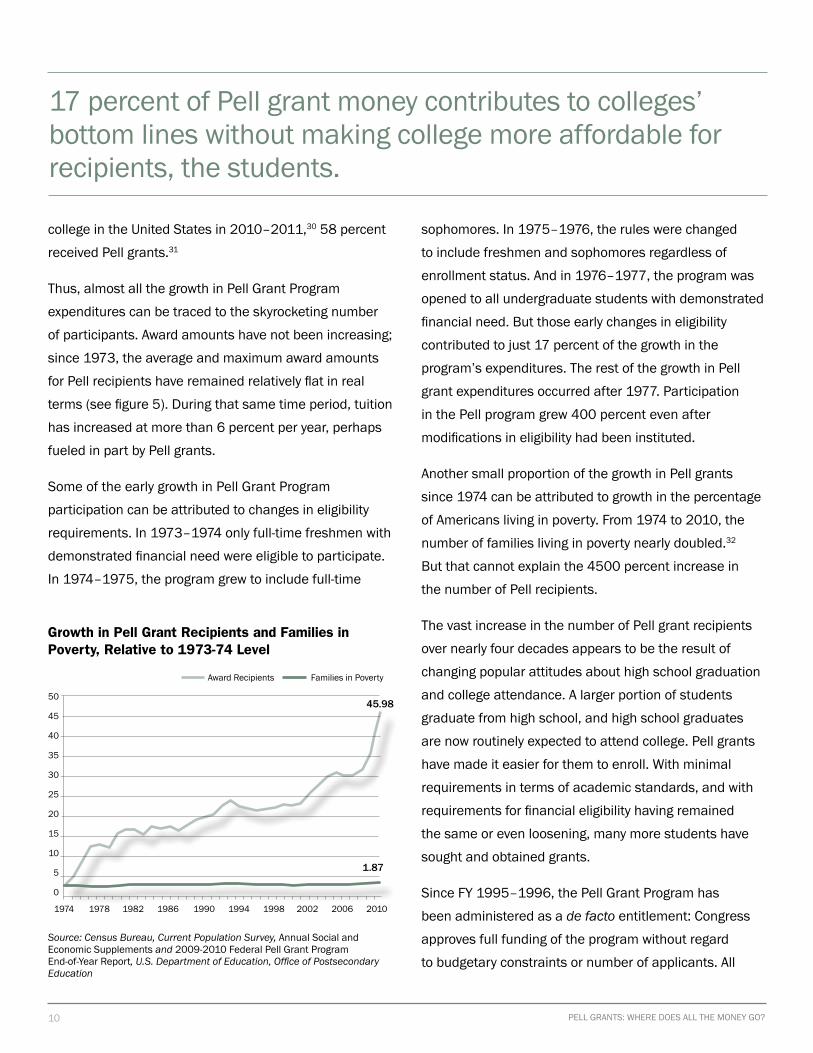
Another small proportion of the growth in Pell grants
since 1974 can be attributed to growth in the percentage
of Americans living in poverty. From 1974 to 2010, the
number of families living in poverty nearly doubled.32
But that cannot explain the 4500 percent increase in
the number of Pell recipients.
The vast increase in the number of Pell grant recipients
over nearly four decades appears to be the result of
changing popular attitudes about high school graduation
and college attendance. A larger portion of students
graduate from high school, and high school graduates
are now routinely expected to attend college. Pell grants
have made it easier for them to enroll. With minimal
requirements in terms of academic standards, and with
requirements for financial eligibility having remained
the same or even loosening, many more students have
sought and obtained grants.
Since FY 1995–1996, the Pell Grant Program has
been administered as a de facto entitlement: Congress
approves full funding of the program without regard
to budgetary constraints or number of applicants. All
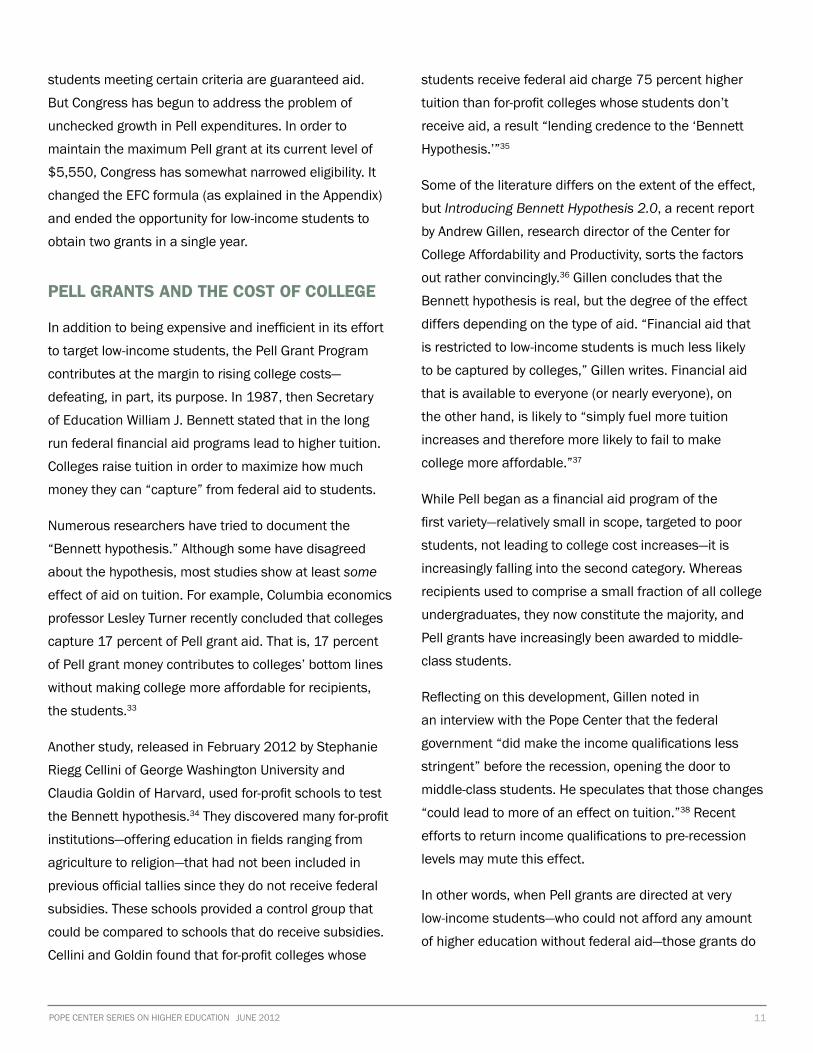
17 percent of Pell grant money contributes to colleges’ bottom lines without making college more affordable for recipients, the students.
Source: Census Bureau, Current Population Survey, Annual Social and Economic Supplements and 2009-2010 Federal Pell Grant Program End-of-Year Report, U.S. Department of Education, Office of Postsecondary Education
45.98
1.87
1974 1978 1982 1986 1990 1994 1998 2002 2006 2010
50
45
40
35
30
25
20
15
10
5
0
Growth in Pell Grant Recipients and Families in Poverty, Relative to 1973-74 Level
Award Recipients Families in Poverty
11POPE CENTER SERIES ON HIGHER EDUCATION JUNE 2012
students meeting certain criteria are guaranteed aid.
But Congress has begun to address the problem of
unchecked growth in Pell expenditures. In order to
maintain the maximum Pell grant at its current level of
$5,550, Congress has somewhat narrowed eligibility. It
changed the EFC formula (as explained in the Appendix)
and ended the opportunity for low-income students to
obtain two grants in a single year.
PELL GRANTS AND THE COST OF COLLEGE
In addition to being expensive and inefficient in its effort
to target low-income students, the Pell Grant Program
contributes at the margin to rising college costs—
defeating, in part, its purpose. In 1987, then Secretary
of Education William J. Bennett stated that in the long
run federal financial aid programs lead to higher tuition.
Colleges raise tuition in order to maximize how much
money they can “capture” from federal aid to students.
Numerous researchers have tried to document the
“Bennett hypothesis.” Although some have disagreed
about the hypothesis, most studies show at least some
effect of aid on tuition. For example, Columbia economics
professor Lesley Turner recently concluded that colleges
capture 17 percent of Pell grant aid. That is, 17 percent
of Pell grant money contributes to colleges’ bottom lines
without making college more affordable for recipients,
the students.33
Another study, released in February 2012 by Stephanie
Riegg Cellini of George Washington University and
Claudia Goldin of Harvard, used for-profit schools to test
the Bennett hypothesis.34 They discovered many for-profit
institutions—offering education in fields ranging from
agriculture to religion—that had not been included in
previous official tallies since they do not receive federal
subsidies. These schools provided a control group that
could be compared to schools that do receive subsidies.
Cellini and Goldin found that for-profit colleges whose
students receive federal aid charge 75 percent higher
tuition than for-profit colleges whose students don’t
receive aid, a result “lending credence to the ‘Bennett
Hypothesis.’”35
Some of the literature differs on the extent of the effect,
but Introducing Bennett Hypothesis 2.0, a recent report
by Andrew Gillen, research director of the Center for
College Affordability and Productivity, sorts the factors
out rather convincingly.36 Gillen concludes that the
Bennett hypothesis is real, but the degree of the effect
differs depending on the type of aid. “Financial aid that
is restricted to low-income students is much less likely
to be captured by colleges,” Gillen writes. Financial aid
that is available to everyone (or nearly everyone), on
the other hand, is likely to “simply fuel more tuition
increases and therefore more likely to fail to make
college more affordable.”37
While Pell began as a financial aid program of the
first variety—relatively small in scope, targeted to poor
students, not leading to college cost increases—it is
increasingly falling into the second category. Whereas
recipients used to comprise a small fraction of all college
undergraduates, they now constitute the majority, and
Pell grants have increasingly been awarded to middle-
class students.
Reflecting on this development, Gillen noted in
an interview with the Pope Center that the federal
government “did make the income qualifications less
stringent” before the recession, opening the door to
middle-class students. He speculates that those changes
“could lead to more of an effect on tuition.”38 Recent
efforts to return income qualifications to pre-recession
levels may mute this effect.
In other words, when Pell grants are directed at very
low-income students—who could not afford any amount
of higher education without federal aid—those grants do
12 PELL GRANTS: WHERE DOES ALL THE MONEY GO?
not contribute to higher tuition.39 But with Pell funding
now available for students whose families earn up to
$60,000 per year (families that may include just one
person—the student), a good deal of Pell funding may
contribute to the rapid rise in college tuition. (And
even when lower-income students choose to attend
affordable schools, Pell grants can contribute to a rise
in tuition if, in the absence of the availability of grant
money, those students would have paid tuition via
work or savings.)
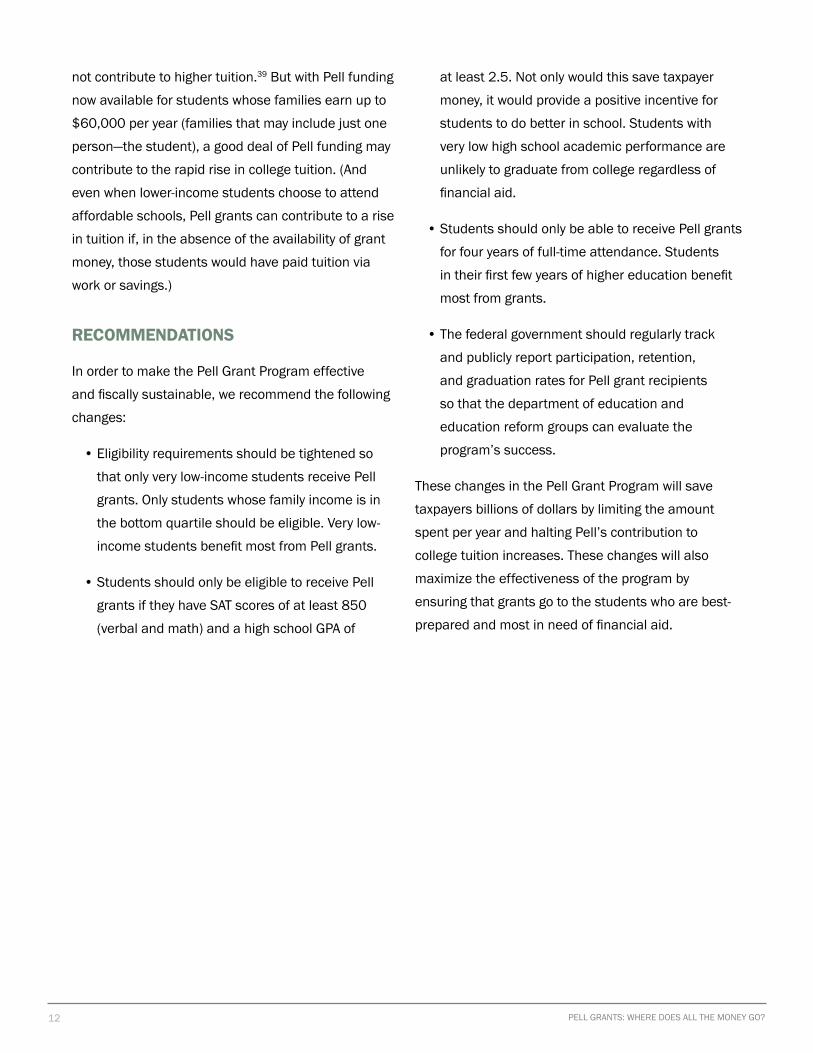
RECOMMENDATIONS
In order to make the Pell Grant Program effective
and fiscally sustainable, we recommend the following
changes:
• Eligibility requirements should be tightened so
that only very low-income students receive Pell
grants. Only students whose family income is in
the bottom quartile should be eligible. Very low-
income students benefit most from Pell grants.
• Students should only be eligible to receive Pell
grants if they have SAT scores of at least 850
(verbal and math) and a high school GPA of
at least 2.5. Not only would this save taxpayer
money, it would provide a positive incentive for
students to do better in school. Students with
very low high school academic performance are
unlikely to graduate from college regardless of
financial aid.
• Students should only be able to receive Pell grants
for four years of full-time attendance. Students
in their first few years of higher education benefit
most from grants.
• The federal government should regularly track
and publicly report participation, retention,
and graduation rates for Pell grant recipients
so that the department of education and
education reform groups can evaluate the
program’s success.
These changes in the Pell Grant Program will save
taxpayers billions of dollars by limiting the amount
spent per year and halting Pell’s contribution to
college tuition increases. These changes will also
maximize the effectiveness of the program by
ensuring that grants go to the students who are best-
prepared and most in need of financial aid.
13POPE CENTER SERIES ON HIGHER EDUCATION JUNE 2012
Resources
1 Office of Federal Student Aid. 2010-2011 Federal Student Aid Handbook. http://ifap.ed.gov/ifap/byAwardYear.jsp?type=fsahandbook&awardyear=2010-2011.
2 Federal Student Aid, Data Center, Title IV Program Volume Reports by School, 2010–2011, http://federalstudentaid.ed.gov/datacenter/programmatic.html.
3 U.S. Census Bureau, 2010 Current Population Survey, table 5, “Type of College and Year Enrolled for College Students 15 Years Old and Over, by Age, Sex, Race, Attendance Status, Control of School, and Enrollment Status: October 2010,” http://www.census.gov/hhes/school/data/cps/2010/tab05_10.xls.
4 Federal Student Aid, Data Center, Title IV Program Volume Reports by School, 2010–2011, http://federalstudentaid.ed.gov/datacenter/programmatic.html.
5 U.S. Department of Education, 2009–2010 Federal Pell Grant Program End-of-Year Report (Washington, DC: Office of Postsecondary Education, 2011), http://www2.ed.gov/finaid/prof/resources/data/pell-2009-10/ pell-eoy-09-10.pdf.
6 U.S. Department of Education, FY 2011 Department of Education Justifications of Appropriation Estimates to the Congress, “Federal Pell Grants: Fiscal Year 2011 Budget Request,” http://www2.ed.gov/about/overview/budget/budget11/justifications/p-pell.pdf.
7 Christina Chang Wei and Laura Horn, A Profile of Successful Pell Grant Recipients: Time to Bachelor’s Degree and Early Graduate School Enrollment, NCES 2009-156 (Washington, DC: National Center for Education Statistics, Institute of Education Sciences, U.S. Department of Education, 2009), http://nces.ed.gov/pubs2009/2009156.pdf.
8 Alexandria Walton Radford, Lutz Berkner, Sara C. Wheeless, and Bryan Shepherd, Persistence and Attainment of 2003–04 Beginning Postsecondary Students: After 6 Years, NCES 2011-151 (Washington, DC: National Center for Education Statistics, Institute of Education Sciences, U.S. Department of Education, 2010), http://nces.ed.gov/pubs2011/2011151.pdf.
9 U.S. Department of Education, 2009–2010 Federal Pell Grant Program End-of-Year Report (Washington, DC: Office of Postsecondary Education, 2011), http://www2.ed.gov/finaid/prof/resources/data/pell-2009-10/ pell-eoy-09-10.pdf.
10 Ibid.
11 Ibid., Table 2-A
12 Carmen DeNavas-Walt, Bernadette D. Proctor, and Jessica C. Smith, U.S. Census Bureau, Current Population Reports, P60-239, Income, Poverty, and Health Insurance Coverage in the United States: 2010 (Washington, DC: GPO, 2011), http://www.census.gov/prod/2011pubs/p60-239.pdf.
13 “Family Income and Educational Attainment 1970 to 2009,” Postsecondary Education Opportunity no. 221 (November 2010): 2–16, http://www.postsecondary.org/last12/221_1110pg1_16.pdf.
14 PELL GRANTS: WHERE DOES ALL THE MONEY GO?
14 U.S. Department of Education, 2009–2010 Federal Pell Grant Program End-of-Year Report (Washington, DC: Office of Postsecondary Education, 2011), http://www2.ed.gov/finaid/prof/resources/data/pell-2009-10/ pell-eoy-09-10.pdf.
115 Ibid.
16 Libby A. Nelson, “No Diploma, No GED, No Aid,” Inside Higher Ed, March 20, 2012, http://www.insidehighered.com/news/2012/03/20/colleges-worry-about-end-federal-aid-based-ability-benefit.
17 Christina Chang Wei and Laura Horn, Persistence and Attainment of Beginning Pell Grant Recipients, NCES 2002–169 (Washington DC: National Center for Education Statistics, Office of Educational Research and Improvement, U.S. Department of Education, 2002), http://nces.ed.gov/pubs2002/2002169.pdf.
18 “Family Income and Educational Attainment 1970 to 2009.”
19 Ibid.
20 Philippe Belley, Marc Frenette, and Lance Lochner, “Post-Secondary Attendance by Parental Income in the U.S. and Canada: What Role for Financial Aid Policy?” (NBER Working Paper No. 17218, National Bureau of Economic Research, Cambridge, MA, 2011).
21 Eric Bettinger, “Financial Aid: A Blunt Instrument for Increasing Degree Attainment,” paper presented at American Enterprise Institute conference, “Degrees of Difficulty: Can American Higher Education Regain Its Edge?” Washington, DC, February 15, 2011.
22 Edward P. St. John, “Price Response in Persistence Decisions: An Analysis of the High School and Beyond Senior Cohort,” Research in Higher Education 31, no. 4 (August 1990): 387–403.
23 Radford et al., Persistence and Attainment of Students.
24 Ibid.
25 Ibid.
26 Wei and Horn, Persistence and Attainment of Beginning Recipients.
27 Radford et al., Persistence and Attainment of Students.
28 Ibid.
28 Ibid.
30 U.S. Census Bureau, 2010 Current Population Survey, table 5.
31 Federal Student Aid, Data Center, Title IV Program Volume Reports by School, 2012, http://federalstudentaid.ed.gov/datacenter/programmatic.html.
32 U.S. Census Bureau, Current Population Survey Annual Social and Economic Supplements, http://www.census.gov/hhes/www/poverty/publications/pubs-cps.html.

15POPE CENTER SERIES ON HIGHER EDUCATION JUNE 2012
33 Lesley J. Turner, “The Incidence of Student Financial Aid: Evidence from the Pell Grant Program” (job market paper, Department of Economics, Columbia University, New York, NY, 2012), http://www.columbia.edu/~ljt2110/LTurner_JMP.pdf.
34 Stephanie Riegg Cellini and Claudia Goldin, “Does Federal Student Aid Raise Tuition? New Evidence on For-Profit Colleges” (NBER Working Paper No. 17827, National Bureau of Economic Research, Cambridge, MA, 2012).
35 Ibid., from the abstract.
36 Andrew Gillen, Introducing Bennett Hypothesis 2.0 (Washington, DC: Center for College Affordability and Productivity, 2012), http://centerforcollegeaffordability.org/uploads/Introducing_Bennett_Hypothesis_2-1.pdf.
37 Ibid., 7.
38 Andrew Gillen, personal email. February 21, 2012.
39 Gillen, Bennett Hypothesis 2.0.
16 PELL GRANTS: WHERE DOES ALL THE MONEY GO?
Appendix
Calculating Pell Grant Eligibility
Pell grant eligibility is based on several criteria, primarily financial, and on whether a student is enrolled full-time
or part-time.
The Expected Family Contribution (EFC) is a measure of a family’s financial strength. It is calculated according
to a formula established by Congress in the Higher Education Amendments of 1965 (as amended). A family’s
taxed and untaxed income, assets (including accumulated savings), and benefits (such as unemployment or
Social Security) are all considered in the formula. Also considered are family size, parents’ age, and the number
of family members who will attend college or career school during the year. A formula using this information
(which students or their families provide on the FAFSA form), determines the EFC.
The EFC formula has changed over the years. Over the past 13 years, it has become easier for students from
low-income families to automatically have an EFC of zero—guaranteeing Pell grant eligibility. From 1998 to
2011, the family maximum income for students to automatically qualify for an EFC of zero rose by 81 percent
after accounting for inflation. However, the Consolidated Appropriations Act of 2012 will decrease the maximum
family income going forward (from $31,000 in 2012 to $23,000 in 2013) for automatic qualification.
Some exceptions to the standard formula exist. For example: the maximum award amount is given for any Pell
Grant-eligible student whose parent or guardian died as a result of military service in Iraq or Afghanistan after
Sept. 11, 2001. There are other limitations on how much money students may receive. Students cannot receive
Pell Grant funding more than once in any one academic year, nor can students receive Pell Grant funding from
more than one school during one academic year.
The Cost of Attendance (COA), also calculated according to a formula established by law, is the estimated full
and reasonable cost of completing a full year as a full-time student. The COA is published by each educational
institution and typically includes tuition and fees payable to the institution, books and supplies, room and board,
personal costs, and transportation. For example, tuition and fees at UNC-Chapel Hill are $7,694 but the total
“cost of attendance” for the 2012-13 school year is $22,340.
Including a Cost of Attendance to calculate the grant means that some students may qualify for Pell grants if
they attend an expensive school, but not one that is more affordable. That “tends to reduce price consciousness
for students and lessens the incentives for colleges to keep tuition low,” writes Andrew Gillen in a report for the
Center for College Accountability and Productivity. He recommended that the Cost of Attendance be replaced
by Median Cost of College (MCoC) in determining eligibility for Pell grants. That would eliminate incentives for
students to attend more expensive schools in order to receive more Pell grant funding.
ABOUT THE POPE CENTER
The John William Pope Center for Higher Education Policy is a nonprofit institute
dedicated to improving higher education in North Carolina and the nation. Located in
Raleigh, North Carolina, it is named for the late John William Pope, who served on the
Board of Trustees of the University of North Carolina at Chapel Hill.
The center aims to increase the diversity of ideas discussed on campus, encourage
respect for freedom, improve student learning, and lower the cost of education to both
students and taxpayers.
To accomplish these goals, we inform parents, students, trustees, alumni, and
administrators about actual learning on campus and how it can be improved. We
inform taxpayers and policymakers about the use and impact of government funds, and
we seek ways to help students become acquainted with ideas that are dismissed or
marginalized on campuses today.
Jane S. Shaw is the president of the Pope Center. She can be reached at
[email protected]. More information about the Pope Center, as well as most of
our studies and articles, can be found on our website at popecenter.org. Donations
to the center, a 501(c)(3) organization, are tax-deductible.
popecenter.org
The federal Pell Grant Program, which provides need-based grants to millions of college students, is the federal government’s largest education expenditure. Does this program use taxpayer money wisely? Are more low-income students able to graduate from college as a result of these grants?
Until now, few such questions have been asked about this program. But they are addressed in this paper, “Pell Grants: Where Does All the Money Go?” Written by Jenna Ashley Robinson and Duke Cheston, this Pope Center research report analyzes what is known about Pell grants.
Jenna Ashley Robinson is outreach coordinator for the John W. Pope Center for Higher Education Policy. Dr. Robinson graduated from North Carolina State University in 2003 and received her Ph.D. in political science from UNC-Chapel Hill in May 2012.
Duke Cheston is a writer and reporter for the center. He is a 2010 graduate of UNC-Chapel Hill, where he studied biology.
The John W. Pope Center for Higher Education is a nonprofit institute dedicated to excellence in higher education, both nationally and in North Carolina. For more information about the Pope Center, see popecenter.org. For additional copies of this report, contact the center at [email protected].
Pell Grants: Where Does All the Money Go?
Jenna Ashley Robinson and Duke Cheston