pelican ei reports and enterprise data warehouse training · pelican ei reports and enterprise data...
TRANSCRIPT
All_Reports and Data Warehouse Training_08-19-2014.pdf Page 1
PELICAN EI Reports and Enterprise Data Warehouse Training
Office of Child Development and Early Learning
Bureau of Early Intervention Services
All_Reports and Data Warehouse Training_08-19-2014.pdf Page 2
Agenda
Report Overview
Cubes and Reports
Additional Resources
Tip Sheet Review
Data Warehouse Self-Paced Practice
All_Reports and Data Warehouse Training_08-19-2014.pdf Page 3
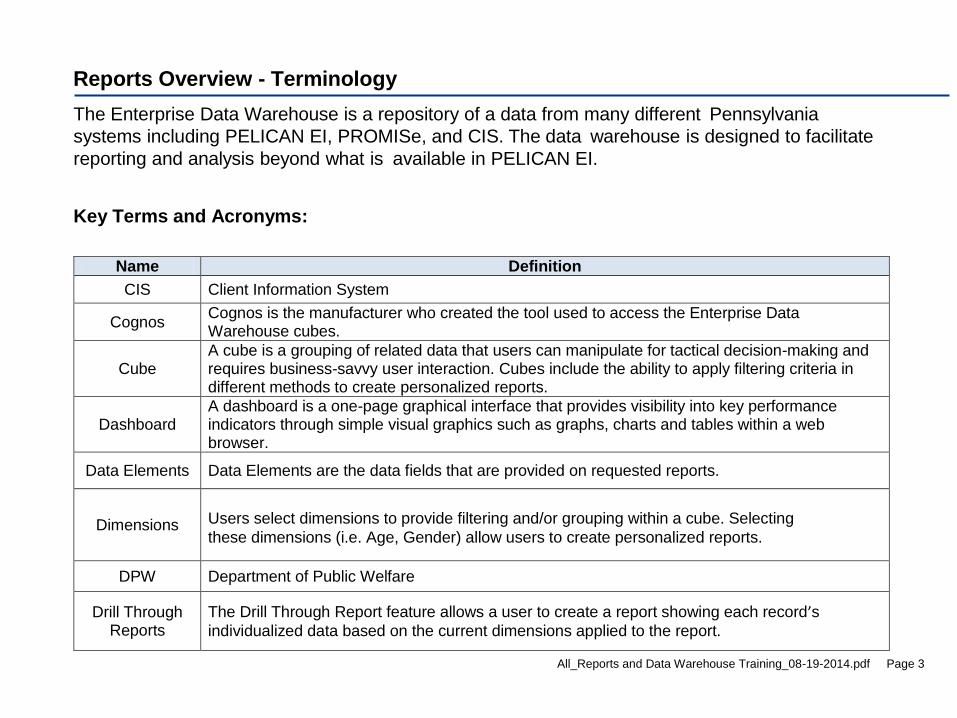
Reports Overview - Terminology
The Enterprise Data Warehouse is a repository of a data from many different Pennsylvania
systems including PELICAN EI, PROMISe, and CIS. The data warehouse is designed to facilitate
reporting and analysis beyond what is available in PELICAN EI.
Key Terms and Acronyms:
Name Definition
CIS Client Information System
Cognos Cognos is the manufacturer who created the tool used to access the Enterprise Data Warehouse cubes.
Cube A cube is a grouping of related data that users can manipulate for tactical decision-making and requires business-savvy user interaction. Cubes include the ability to apply filtering criteria in different methods to create personalized reports.
Dashboard A dashboard is a one-page graphical interface that provides visibility into key performance indicators through simple visual graphics such as graphs, charts and tables within a web browser.
Data Elements Data Elements are the data fields that are provided on requested reports.
Dimensions Users select dimensions to provide filtering and/or grouping within a cube. Selecting
these dimensions (i.e. Age, Gender) allow users to create personalized reports.
DPW Department of Public Welfare
Drill Through Reports
The Drill Through Report feature allows a user to create a report showing each record’s
individualized data based on the current dimensions applied to the report.

All_Reports and Data Warehouse Training_08-19-2014.pdf Page 4
ELN Early Learning Network
Enterprise Data Warehouse
The Enterprise Data Warehouse is a repository of a data from many different
Pennsylvania systems including PELICAN EI, PROMISe, and CIS.
FYTD Fiscal Year to Date
HCSIS Pennsylvania’s Home and Community Services Information System.
Near Real Time Report
A near real time report pertains to timeliness of data that has been delayed by the time required for electronic communication and automatic data processing. For Data Warehouse Dashboards, data is current as of the previous weekday evening.
OCDEL-BEIS Office of Child Development and Early Learning – Bureau of Early Intervention Services
PELICAN EI Pennsylvania’s Enterprise to Link Information for Children Across Networks Early Intervention
system is an information management system used to manage the records of children receiving Early Intervention (EI) services.
PROMISe Provider Reimbursement and Operations Management Information System
Report A report retrieves system data using pre-determined filters and data categories and presents the results in a user friendly format to assist with business decision-making.
SC Entity Any organization that has been approved to provide service coordination services within the Commonwealth of Pennsylvania.

All_Reports and Data Warehouse Training_08-19-2014.pdf Page 5
Reports Overview – Data Warehouse Cube Example
The drill through report includes
the data elements for each child
included in the results
A cube is where users apply
dimensions and review the
summary data
The drill through report is
requested after applying
dimensions to cube
Dimensions are applied to cubes
as needed to help users in the
analyze their data
All_Reports and Data Warehouse Training_08-19-2014.pdf Page 6
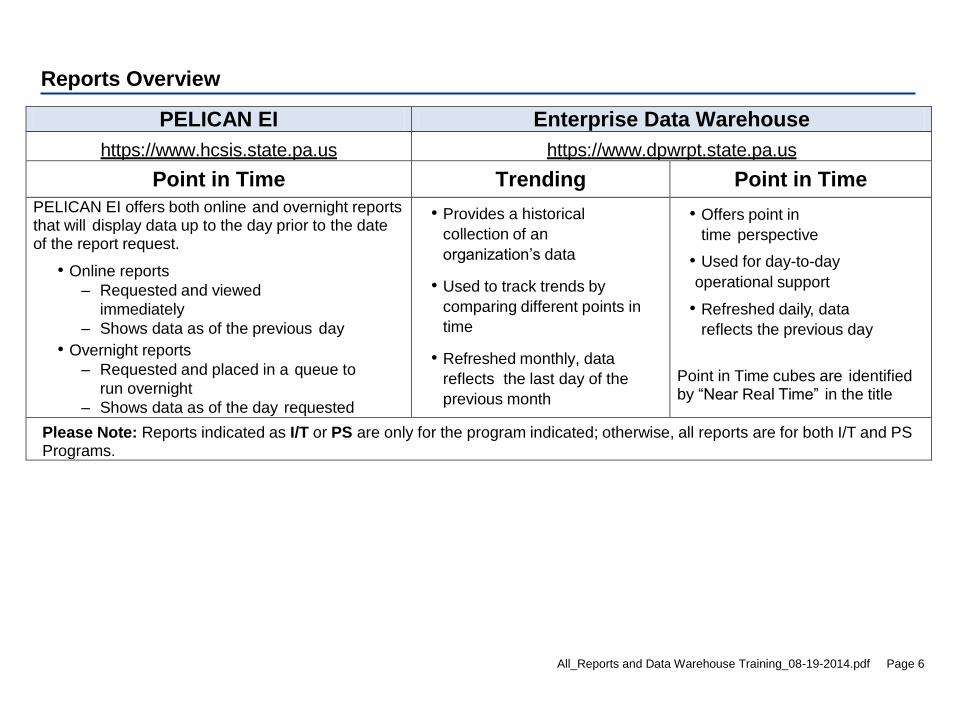
Reports Overview
PELICAN EI Enterprise Data Warehouse
https://www.hcsis.state.pa.us https://www.dpwrpt.state.pa.us
Point in Time Trending Point in Time
PELICAN EI offers both online and overnight reports that will display data up to the day prior to the date of the report request.
• Online reports
– Requested and viewed
immediately
– Shows data as of the previous day
• Overnight reports
– Requested and placed in a queue to
run overnight
– Shows data as of the day requested
• Provides a historical
collection of an
organization’s data
• Used to track trends by
comparing different points in
time
• Refreshed monthly, data
reflects the last day of the
previous month
• Offers point in
time perspective
• Used for day-to-day
operational support
• Refreshed daily, data
reflects the previous day
Point in Time cubes are identified by “Near Real Time” in the title
Please Note: Reports indicated as I/T or PS are only for the program indicated; otherwise, all reports are for both I/T and PS Programs.
All_Reports and Data Warehouse Training_08-19-2014.pdf Page 7
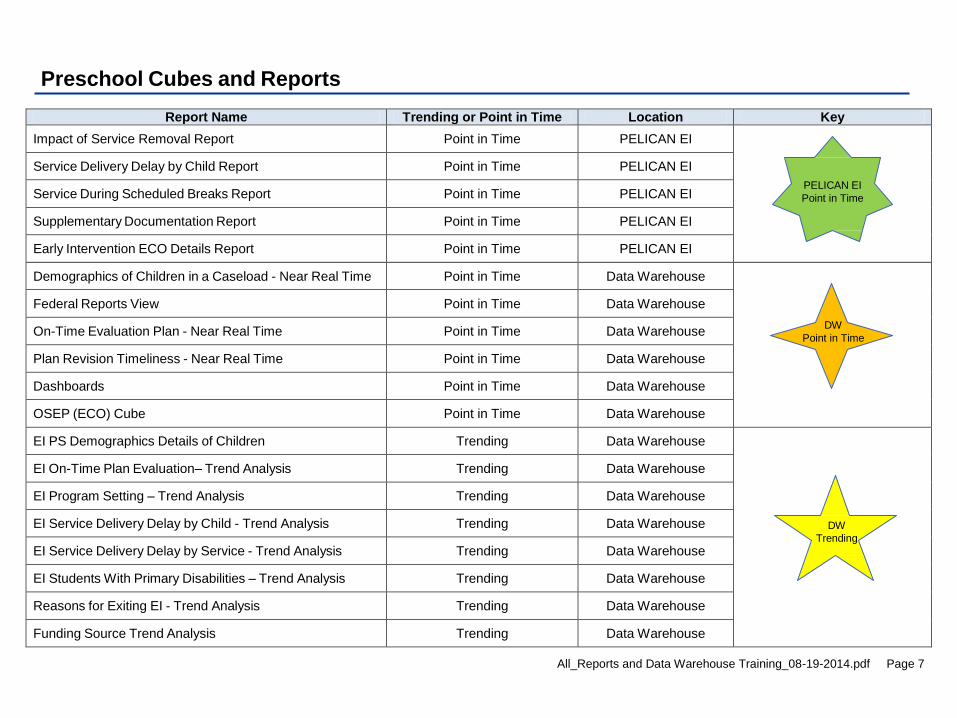
Preschool Cubes and Reports
Report Name Trending or Point in Time Location Key
Impact of Service Removal Report Point in Time PELICAN EI
Service Delivery Delay by Child Report Point in Time PELICAN EI
Service During Scheduled Breaks Report Point in Time PELICAN EI
Supplementary Documentation Report Point in Time PELICAN EI
Early Intervention ECO Details Report Point in Time PELICAN EI
Demographics of Children in a Caseload - Near Real Time Point in Time Data Warehouse
Federal Reports View Point in Time Data Warehouse
On-Time Evaluation Plan - Near Real Time Point in Time Data Warehouse
Plan Revision Timeliness - Near Real Time Point in Time Data Warehouse
Dashboards Point in Time Data Warehouse
OSEP (ECO) Cube Point in Time Data Warehouse
EI PS Demographics Details of Children Trending Data Warehouse
EI On-Time Plan Evaluation– Trend Analysis Trending Data Warehouse
EI Program Setting – Trend Analysis Trending Data Warehouse
EI Service Delivery Delay by Child - Trend Analysis Trending Data Warehouse
EI Service Delivery Delay by Service - Trend Analysis Trending Data Warehouse
EI Students With Primary Disabilities – Trend Analysis Trending Data Warehouse
Reasons for Exiting EI - Trend Analysis Trending Data Warehouse
Funding Source Trend Analysis Trending Data Warehouse
PELICAN EI
Point in Time
DW
Point in Time
DW
Trending
All_Reports and Data Warehouse Training_08-19-2014.pdf Page 8
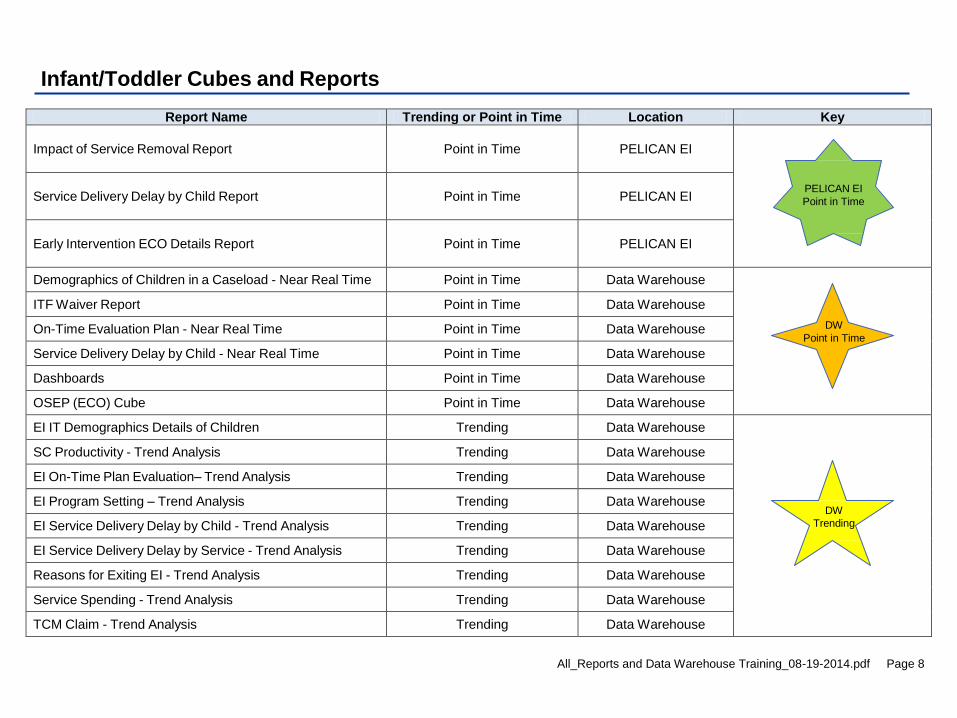
Infant/Toddler Cubes and Reports
Report Name Trending or Point in Time Location Key
Impact of Service Removal Report Point in Time PELICAN EI
Service Delivery Delay by Child Report Point in Time PELICAN EI
Early Intervention ECO Details Report Point in Time PELICAN EI
Demographics of Children in a Caseload - Near Real Time Point in Time Data Warehouse
ITF Waiver Report Point in Time Data Warehouse
On-Time Evaluation Plan - Near Real Time Point in Time Data Warehouse
Service Delivery Delay by Child - Near Real Time Point in Time Data Warehouse
Dashboards Point in Time Data Warehouse
OSEP (ECO) Cube Point in Time Data Warehouse
EI IT Demographics Details of Children Trending Data Warehouse
SC Productivity - Trend Analysis Trending Data Warehouse
EI On-Time Plan Evaluation– Trend Analysis Trending Data Warehouse
EI Program Setting – Trend Analysis Trending Data Warehouse
EI Service Delivery Delay by Child - Trend Analysis Trending Data Warehouse
EI Service Delivery Delay by Service - Trend Analysis Trending Data Warehouse
Reasons for Exiting EI - Trend Analysis Trending Data Warehouse
Service Spending - Trend Analysis Trending Data Warehouse
TCM Claim - Trend Analysis Trending Data Warehouse
PELICAN EI
Point in Time
DW
Point in Time
DW
Trending
All_Reports and Data Warehouse Training_08-19-2014.pdf Page 9
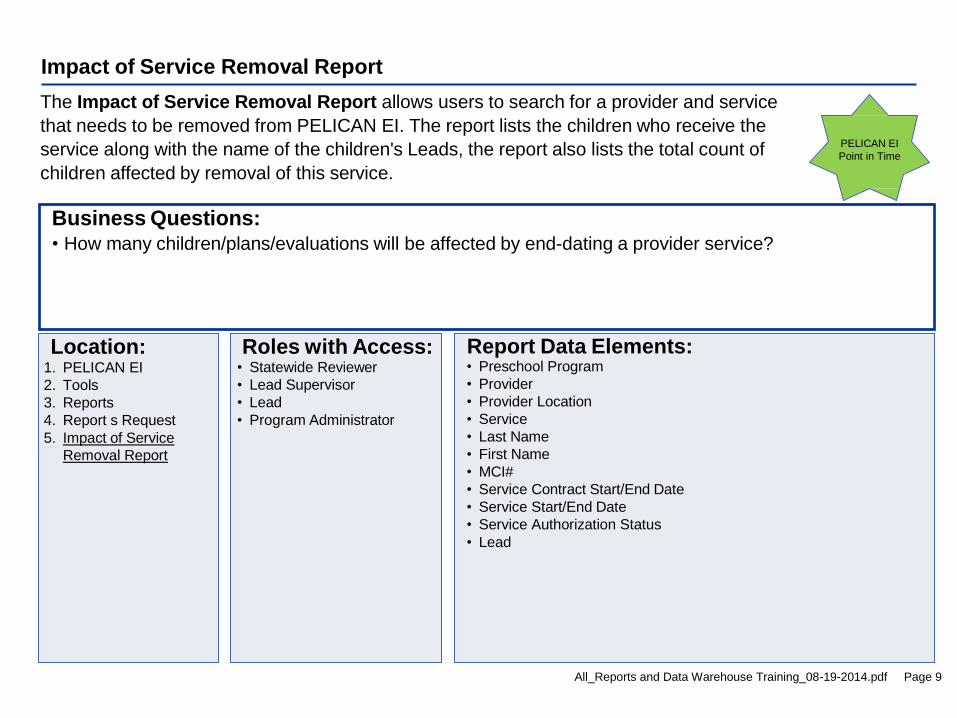
Impact of Service Removal Report
The Impact of Service Removal Report allows users to search for a provider and service
that needs to be removed from PELICAN EI. The report lists the children who receive the
service along with the name of the children's Leads, the report also lists the total count of
children affected by removal of this service.
Report Data Elements: • Preschool Program
• Provider
• Provider Location
• Service
• Last Name
• First Name
• MCI#
• Service Contract Start/End Date
• Service Start/End Date
• Service Authorization Status
• Lead
Roles with Access: • Statewide Reviewer
• Lead Supervisor
• Lead
• Program Administrator
Location: 1. PELICAN EI
2. Tools
3. Reports
4. Report s Request
5. Impact of Service
Removal Report
Business Questions: • How many children/plans/evaluations will be affected by end-dating a provider service?
PELICAN EI
Point in Time
All_Reports and Data Warehouse Training_08-19-2014.pdf Page 10
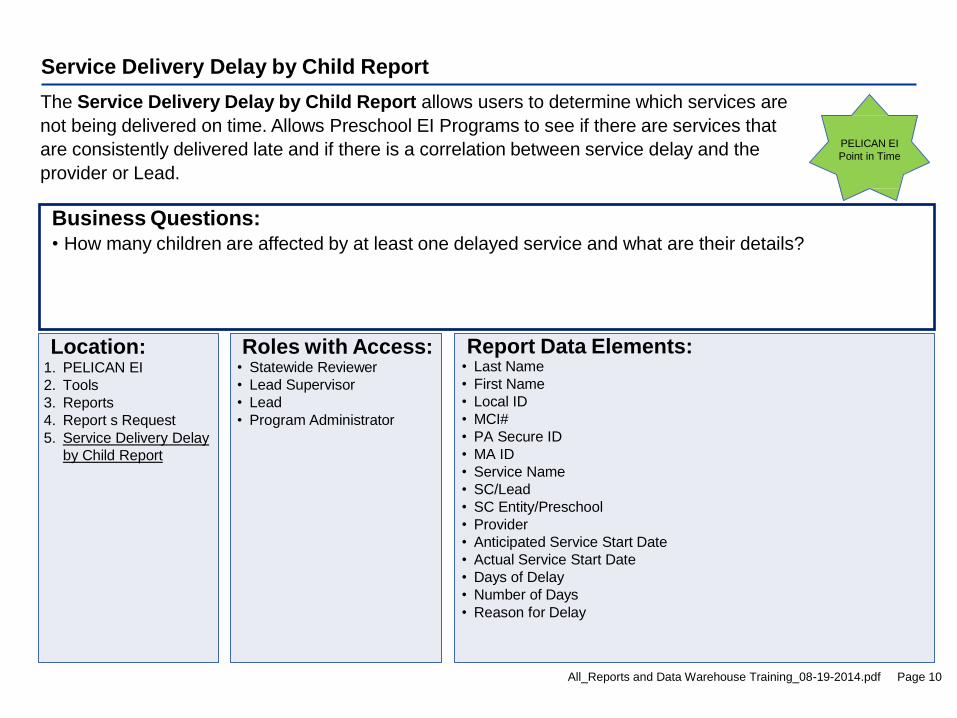
Service Delivery Delay by Child Report
The Service Delivery Delay by Child Report allows users to determine which services are
not being delivered on time. Allows Preschool EI Programs to see if there are services that
are consistently delivered late and if there is a correlation between service delay and the
provider or Lead.
Report Data Elements: • Last Name
• First Name
• Local ID
• MCI#
• PA Secure ID
• MA ID
• Service Name
• SC/Lead
• SC Entity/Preschool
• Provider
• Anticipated Service Start Date
• Actual Service Start Date
• Days of Delay
• Number of Days
• Reason for Delay
Roles with Access: • Statewide Reviewer
• Lead Supervisor
• Lead
• Program Administrator
Location: 1. PELICAN EI
2. Tools
3. Reports
4. Report s Request
5. Service Delivery Delay
by Child Report
Business Questions: • How many children are affected by at least one delayed service and what are their details?
PELICAN EI
Point in Time
All_Reports and Data Warehouse Training_08-19-2014.pdf Page 11
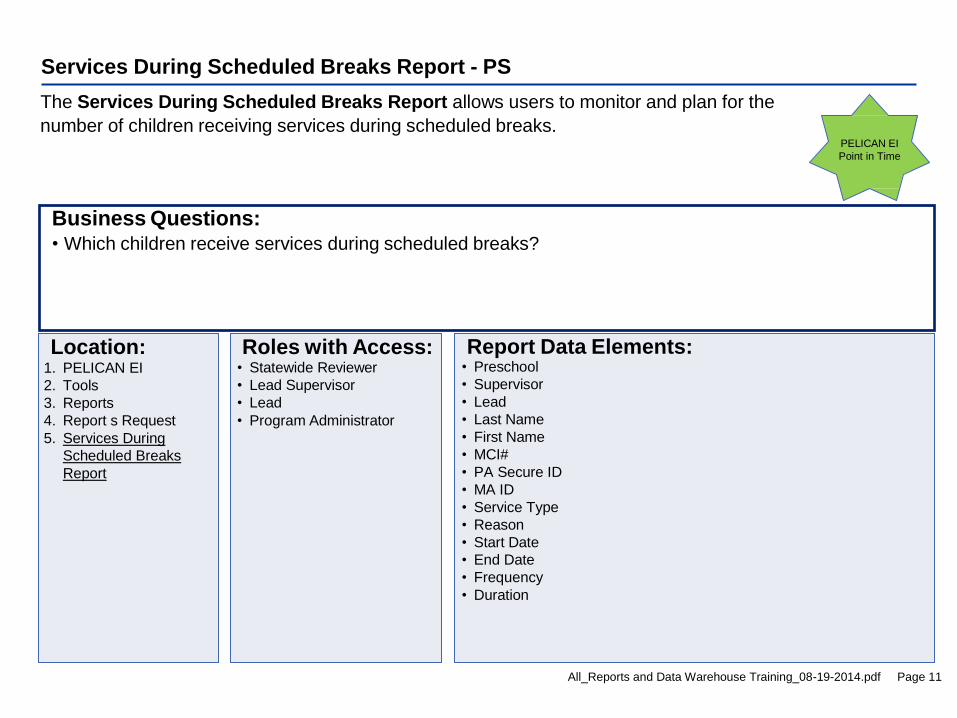
Services During Scheduled Breaks Report - PS
The Services During Scheduled Breaks Report allows users to monitor and plan for the
number of children receiving services during scheduled breaks.
Report Data Elements: • Preschool
• Supervisor
• Lead
• Last Name
• First Name
• MCI#
• PA Secure ID
• MA ID
• Service Type
• Reason
• Start Date
• End Date
• Frequency
• Duration
Roles with Access: • Statewide Reviewer
• Lead Supervisor
• Lead
• Program Administrator
Location: 1. PELICAN EI
2. Tools
3. Reports
4. Report s Request
5. Services During
Scheduled Breaks
Report
Business Questions: • Which children receive services during scheduled breaks?
PELICAN EI
Point in Time
All_Reports and Data Warehouse Training_08-19-2014.pdf Page 12
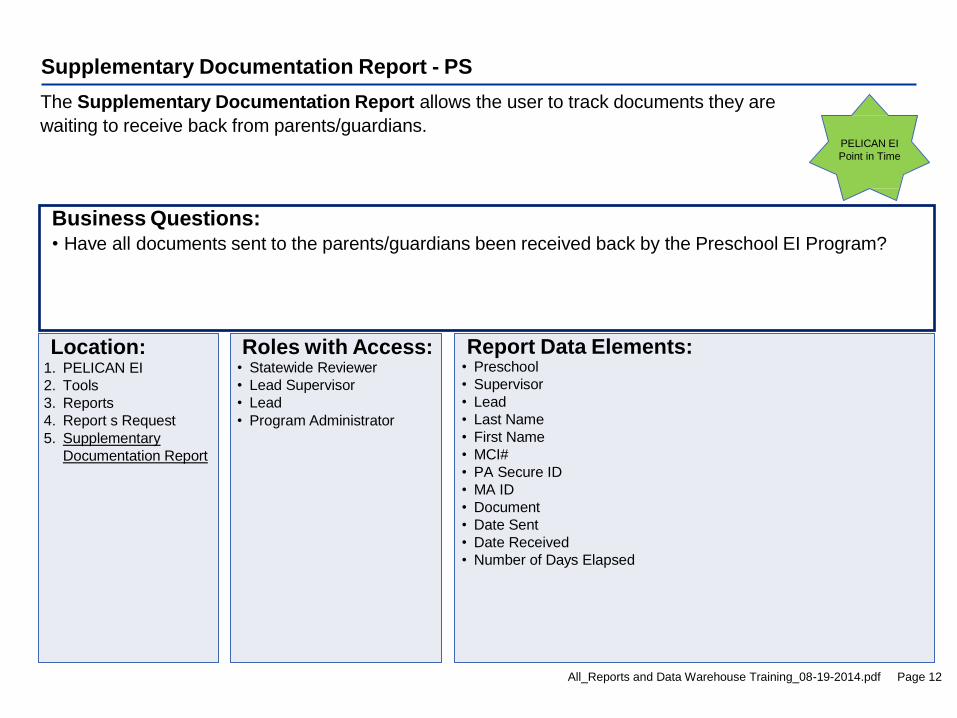
Supplementary Documentation Report - PS
The Supplementary Documentation Report allows the user to track documents they are
waiting to receive back from parents/guardians.
Report Data Elements: • Preschool
• Supervisor
• Lead
• Last Name
• First Name
• MCI#
• PA Secure ID
• MA ID
• Document
• Date Sent
• Date Received
• Number of Days Elapsed
Roles with Access: • Statewide Reviewer
• Lead Supervisor
• Lead
• Program Administrator
Location: 1. PELICAN EI
2. Tools
3. Reports
4. Report s Request
5. Supplementary
Documentation Report
Business Questions: • Have all documents sent to the parents/guardians been received back by the Preschool EI Program?
PELICAN EI
Point in Time
All_Reports and Data Warehouse Training_08-19-2014.pdf Page 13
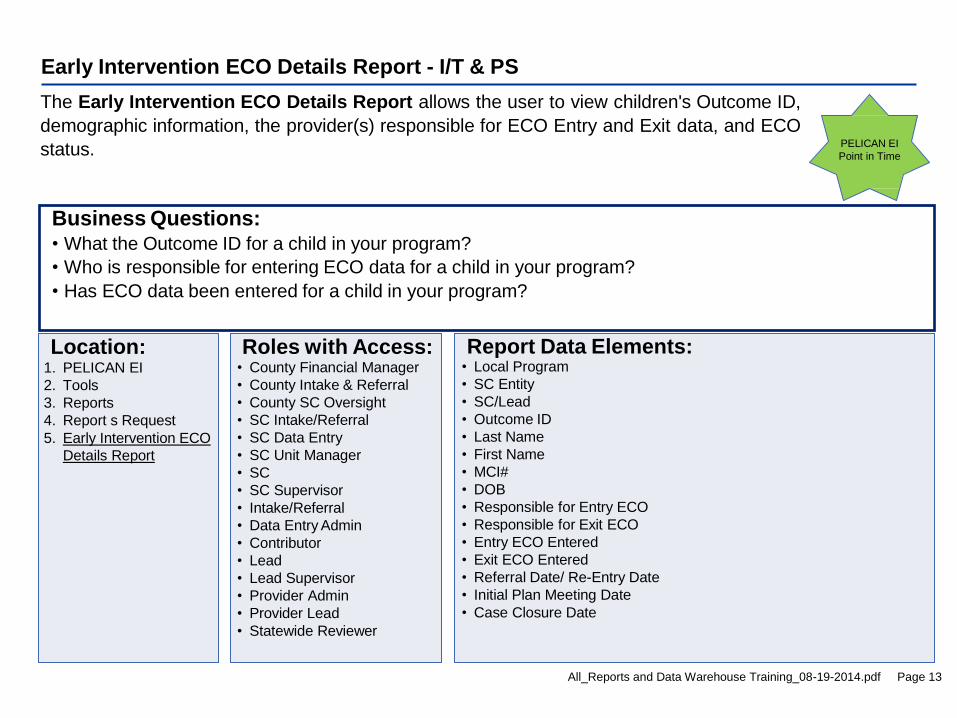
Early Intervention ECO Details Report - I/T & PS
The Early Intervention ECO Details Report allows the user to view children's Outcome ID,
demographic information, the provider(s) responsible for ECO Entry and Exit data, and ECO
status.
Report Data Elements: • Local Program
• SC Entity
• SC/Lead
• Outcome ID
• Last Name
• First Name
• MCI#
• DOB
• Responsible for Entry ECO
• Responsible for Exit ECO
• Entry ECO Entered
• Exit ECO Entered
• Referral Date/ Re-Entry Date
• Initial Plan Meeting Date
• Case Closure Date
Roles with Access: • County Financial Manager
• County Intake & Referral
• County SC Oversight
• SC Intake/Referral
• SC Data Entry
• SC Unit Manager
• SC
• SC Supervisor
• Intake/Referral
• Data Entry Admin
• Contributor
• Lead
• Lead Supervisor
• Provider Admin
• Provider Lead
• Statewide Reviewer
Location: 1. PELICAN EI
2. Tools
3. Reports
4. Report s Request
5. Early Intervention ECO
Details Report
Business Questions: • What the Outcome ID for a child in your program?
• Who is responsible for entering ECO data for a child in your program?
• Has ECO data been entered for a child in your program?
PELICAN EI
Point in Time
All_Reports and Data Warehouse Training_08-19-2014.pdf Page 14
sis
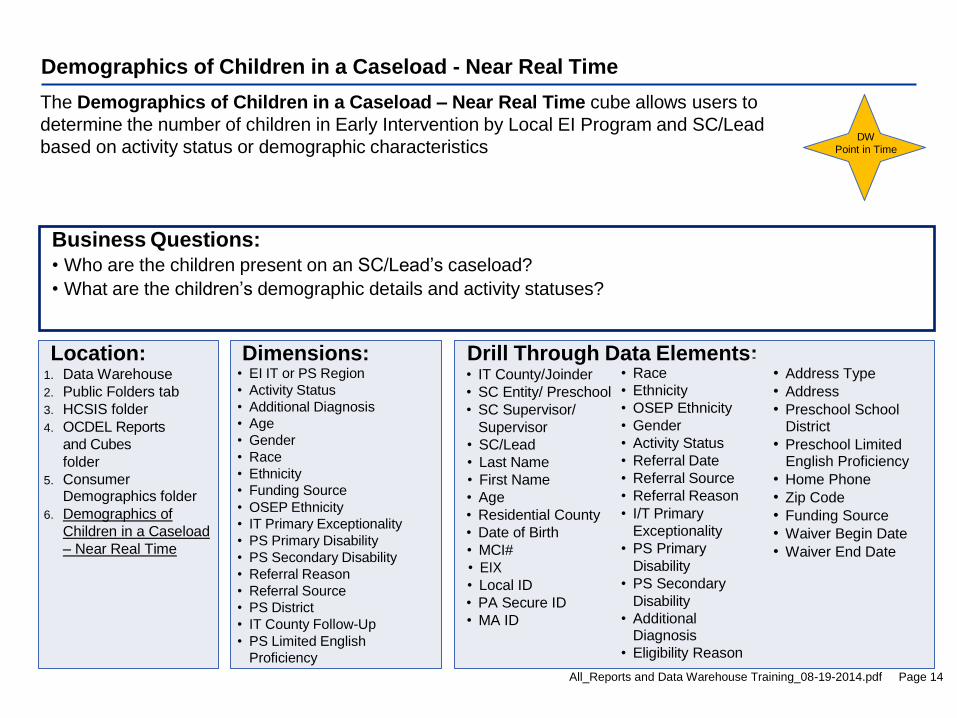
Demographics of Children in a Caseload - Near Real Time
The Demographics of Children in a Caseload – Near Real Time cube allows users to
determine the number of children in Early Intervention by Local EI Program and SC/Lead
based on activity status or demographic characteristics
Drill Through Data Elements: • IT County/Joinder
• SC Entity/ Preschool
• SC Supervisor/
Supervisor
• SC/Lead
• Last Name
• First Name
• Age
• Residential County
• Date of Birth
• MCI#
• EIX
• Local ID
• PA Secure ID
• MA ID
• Race
• Ethnicity
• OSEP Ethnicity
• Gender
• Activity Status
• Referral Date
• Referral Source
• Referral Reason
• I/T Primary
Exceptionality
• PS Primary
Disability
• PS Secondary
Disability
• Additional Diagnosis
• Eligibility Reason
Business Questions: • Who are the children present on an SC/Lead’s caseload?
• What are the children’s demographic details and activity statuses?
Dimensions: • EI IT or PS Region
• Activity Status
• Additional Diagnosis
• Age
• Gender
• Race
• Ethnicity
• Funding Source
• OSEP Ethnicity
• IT Primary Exceptionality
• PS Primary Disability
• PS Secondary Disability
• Referral Reason
• Referral Source
• PS District
• IT County Follow-Up
• PS Limited English
Proficiency
• Zip Code
DW
Point in Time
Location: 1. Data Warehouse
2. Public Folders tab
3. HCSIS folder
4. OCDEL Reports
and Cubes
folder
5. Consumer Demographics folder
6. Demographics of
Children in a Caseload
– Near Real Time
• Address Type
• Address
• Preschool School District
• Preschool Limited English Proficiency
• Home Phone
• Zip Code
• Funding Source
• Waiver Begin Date
• Waiver End Date
All_Reports and Data Warehouse Training_08-19-2014.pdf Page 15
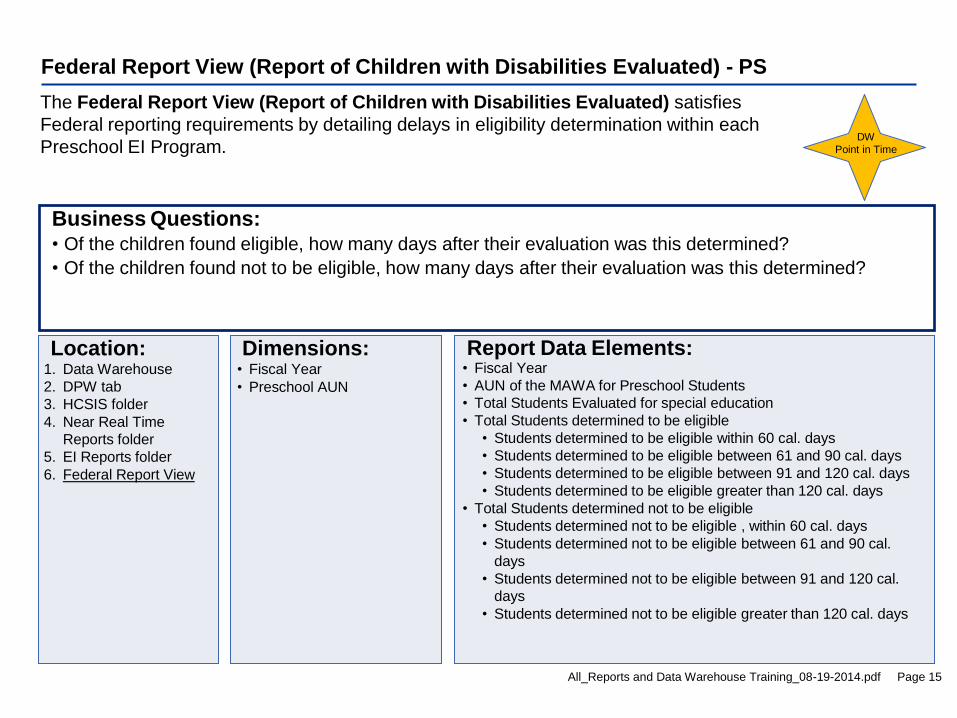
Federal Report View (Report of Children with Disabilities Evaluated) - PS
The Federal Report View (Report of Children with Disabilities Evaluated) satisfies
Federal reporting requirements by detailing delays in eligibility determination within each
Preschool EI Program.
Report Data Elements: • Fiscal Year
• AUN of the MAWA for Preschool Students
• Total Students Evaluated for special education
• Total Students determined to be eligible
• Students determined to be eligible within 60 cal. days
• Students determined to be eligible between 61 and 90 cal. days
• Students determined to be eligible between 91 and 120 cal. days
• Students determined to be eligible greater than 120 cal. days
• Total Students determined not to be eligible
• Students determined not to be eligible , within 60 cal. days
• Students determined not to be eligible between 61 and 90 cal.
days
• Students determined not to be eligible between 91 and 120 cal.
days
• Students determined not to be eligible greater than 120 cal. days
Dimensions: • Fiscal Year
• Preschool AUN
Location: 1. Data Warehouse
2. DPW tab
3. HCSIS folder
4. Near Real Time
Reports folder
5. EI Reports folder
6. Federal Report View
Business Questions: • Of the children found eligible, how many days after their evaluation was this determined?
• Of the children found not to be eligible, how many days after their evaluation was this determined?
DW
Point in Time
All_Reports and Data Warehouse Training_08-19-2014.pdf Page 16
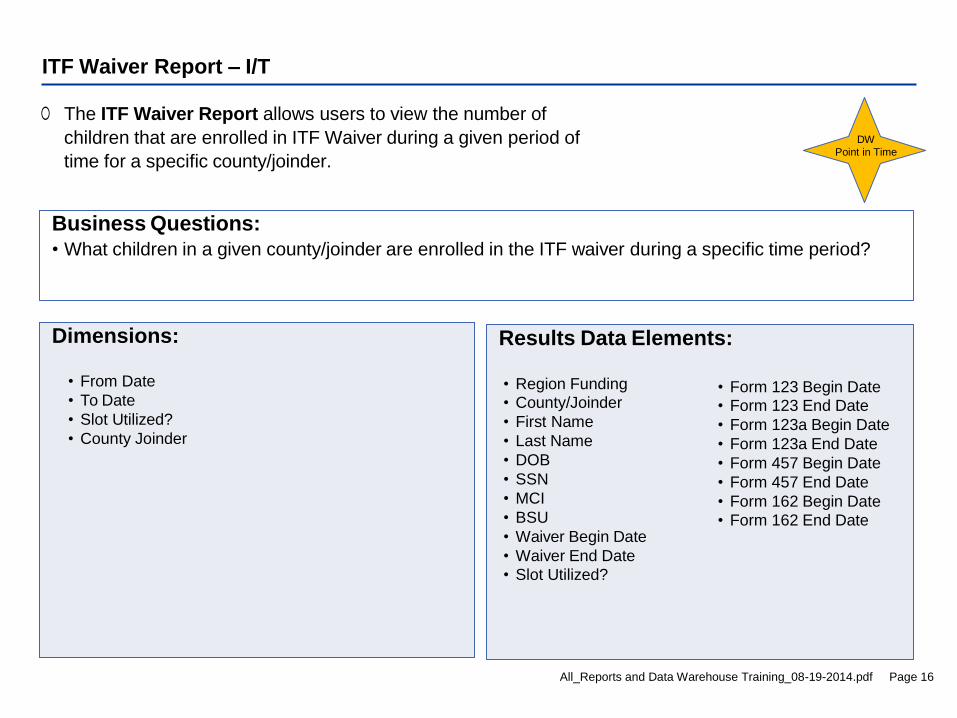
ITF Waiver Report – I/T
The ITF Waiver Report allows users to view the number of
children that are enrolled in ITF Waiver during a given period of
time for a specific county/joinder.
Results Data Elements:
• Region Funding • County/Joinder
• First Name
• Last Name
• DOB
• SSN
• MCI
• BSU
• Waiver Begin Date
• Waiver End Date
• Slot Utilized?
• Form 123 Begin Date • Form 123 End Date
• Form 123a Begin Date
• Form 123a End Date
• Form 457 Begin Date
• Form 457 End Date
• Form 162 Begin Date
• Form 162 End Date
Dimensions:
• From Date
• To Date
• Slot Utilized?
• County Joinder
Business Questions:
• What children in a given county/joinder are enrolled in the ITF waiver during a specific time period?
DW
Point in Time
All_Reports and Data Warehouse Training_08-19-2014.pdf Page 17
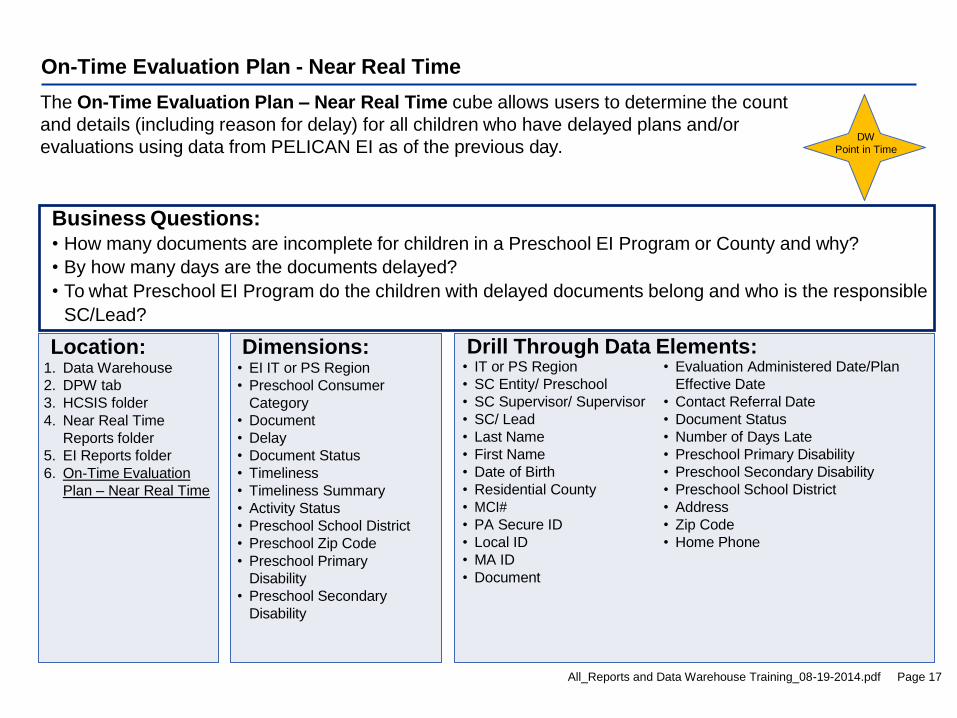
On-Time Evaluation Plan - Near Real Time
The On-Time Evaluation Plan – Near Real Time cube allows users to determine the count
and details (including reason for delay) for all children who have delayed plans and/or
evaluations using data from PELICAN EI as of the previous day.
Drill Through Data Elements: • IT or PS Region • Evaluation Administered Date/Plan
• SC Entity/ Preschool Effective Date
• SC Supervisor/ Supervisor • Contact Referral Date
• SC/ Lead • Document Status
• Last Name • Number of Days Late
• First Name • Preschool Primary Disability
• Date of Birth • Preschool Secondary Disability
• Residential County • Preschool School District
• MCI# • Address
• PA Secure ID • Zip Code
• Local ID • Home Phone
• MA ID
• Document
Dimensions: • EI IT or PS Region
• Preschool Consumer
Category
• Document
• Delay
• Document Status
• Timeliness
• Timeliness Summary
• Activity Status
• Preschool School District
• Preschool Zip Code
• Preschool Primary
Disability
• Preschool Secondary
Disability
Location: 1. Data Warehouse
2. DPW tab
3. HCSIS folder
4. Near Real Time
Reports folder
5. EI Reports folder
6. On-Time Evaluation
Plan – Near Real Time
Business Questions: • How many documents are incomplete for children in a Preschool EI Program or County and why?
• By how many days are the documents delayed?
• To what Preschool EI Program do the children with delayed documents belong and who is the responsible
SC/Lead?
DW
Point in Time
All_Reports and Data Warehouse Training_08-19-2014.pdf Page 18
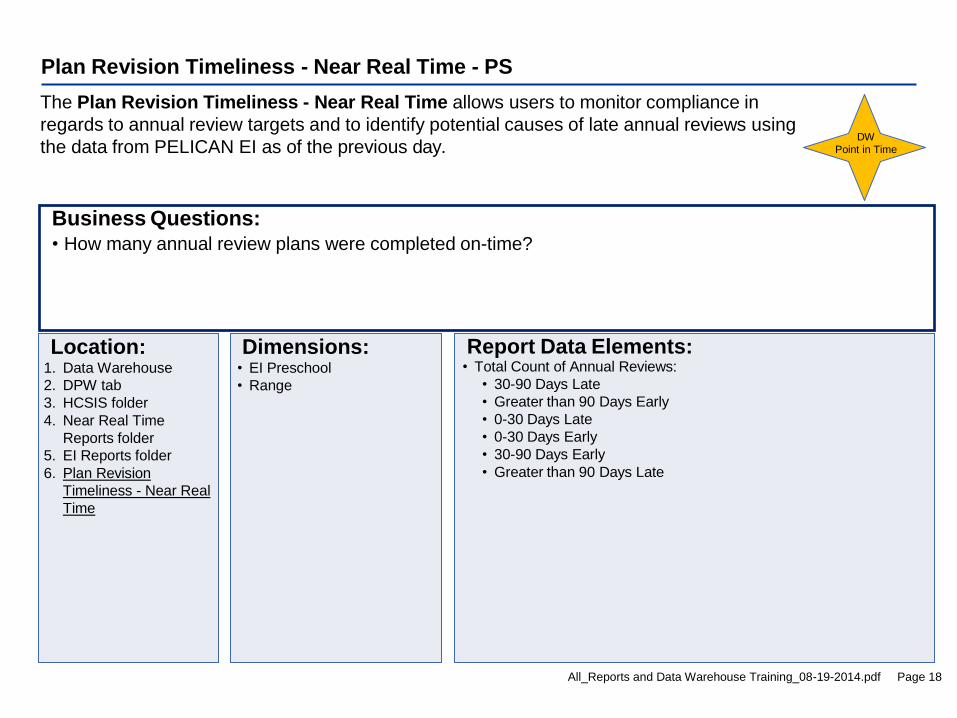
Plan Revision Timeliness - Near Real Time - PS
The Plan Revision Timeliness - Near Real Time allows users to monitor compliance in
regards to annual review targets and to identify potential causes of late annual reviews using
the data from PELICAN EI as of the previous day.
Report Data Elements: • Total Count of Annual Reviews:
• 30-90 Days Late
• Greater than 90 Days Early
• 0-30 Days Late
• 0-30 Days Early
• 30-90 Days Early
• Greater than 90 Days Late
Dimensions: • EI Preschool
• Range
Location: 1. Data Warehouse
2. DPW tab
3. HCSIS folder
4. Near Real Time
Reports folder
5. EI Reports folder
6. Plan Revision
Timeliness - Near Real
Time
Business Questions: • How many annual review plans were completed on-time?
DW
Point in Time
All_Reports and Data Warehouse Training_08-19-2014.pdf Page 19
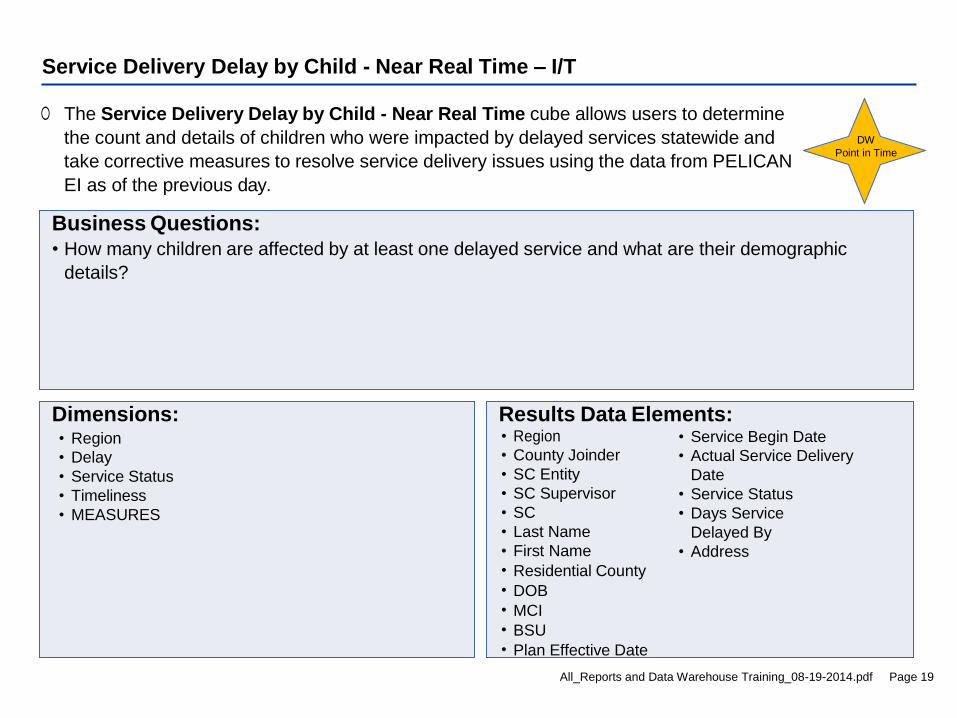
Service Delivery Delay by Child - Near Real Time – I/T
The Service Delivery Delay by Child - Near Real Time cube allows users to determine
the count and details of children who were impacted by delayed services statewide and
take corrective measures to resolve service delivery issues using the data from PELICAN
EI as of the previous day.
Results Data Elements: • Region • Service Begin Date • County Joinder • Actual Service Delivery • SC Entity Date • SC Supervisor • Service Status • SC • Days Service • Last Name Delayed By • First Name • Address • Residential County
• DOB
• MCI
• BSU
• Plan Effective Date
Dimensions: • Region
• Delay
• Service Status
• Timeliness
• MEASURES
Business Questions: • How many children are affected by at least one delayed service and what are their demographic
details?
DW
Point in Time
All_Reports and Data Warehouse Training_08-19-2014.pdf Page 20
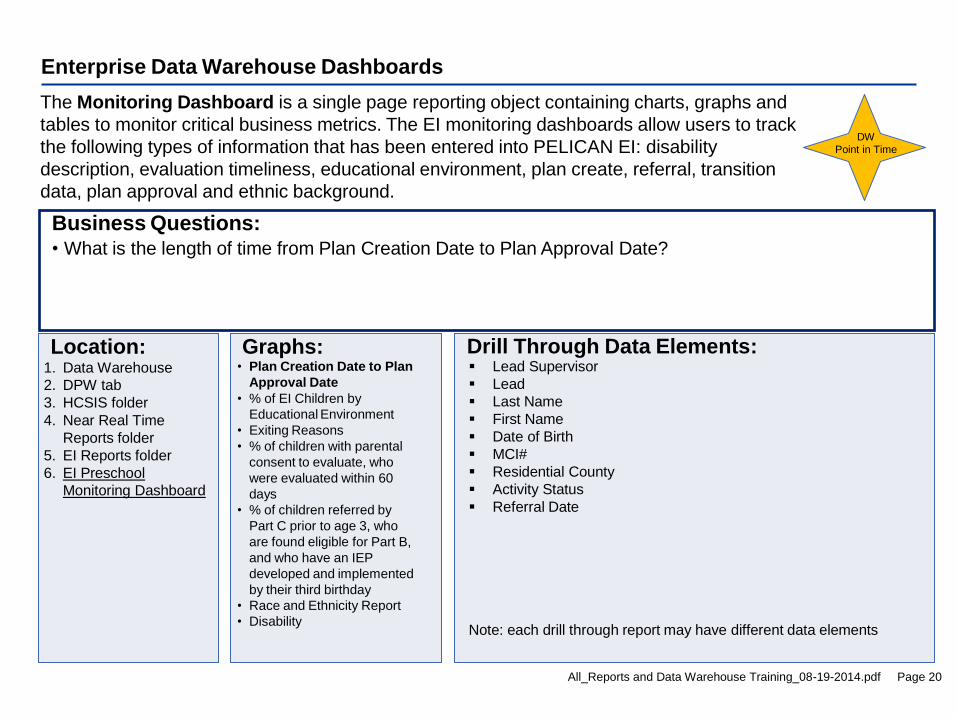
Enterprise Data Warehouse Dashboards
The Monitoring Dashboard is a single page reporting object containing charts, graphs and
tables to monitor critical business metrics. The EI monitoring dashboards allow users to track
the following types of information that has been entered into PELICAN EI: disability
description, evaluation timeliness, educational environment, plan create, referral, transition
data, plan approval and ethnic background.
Drill Through Data Elements: Lead Supervisor
Lead
Last Name
First Name
Date of Birth
MCI#
Residential County
Activity Status
Referral Date
Note: each drill through report may have different data elements
Graphs: • Plan Creation Date to Plan
Approval Date
• % of EI Children by
Educational Environment
• Exiting Reasons
• % of children with parental
consent to evaluate, who
were evaluated within 60
days
• % of children referred by
Part C prior to age 3, who
are found eligible for Part B,
and who have an IEP
developed and implemented
by their third birthday
• Race and Ethnicity Report
• Disability
Location: 1. Data Warehouse
2. DPW tab
3. HCSIS folder
4. Near Real Time
Reports folder
5. EI Reports folder
6. EI Preschool
Monitoring Dashboard
Business Questions: • What is the length of time from Plan Creation Date to Plan Approval Date?
DW
Point in Time
All_Reports and Data Warehouse Training_08-19-2014.pdf Page 21
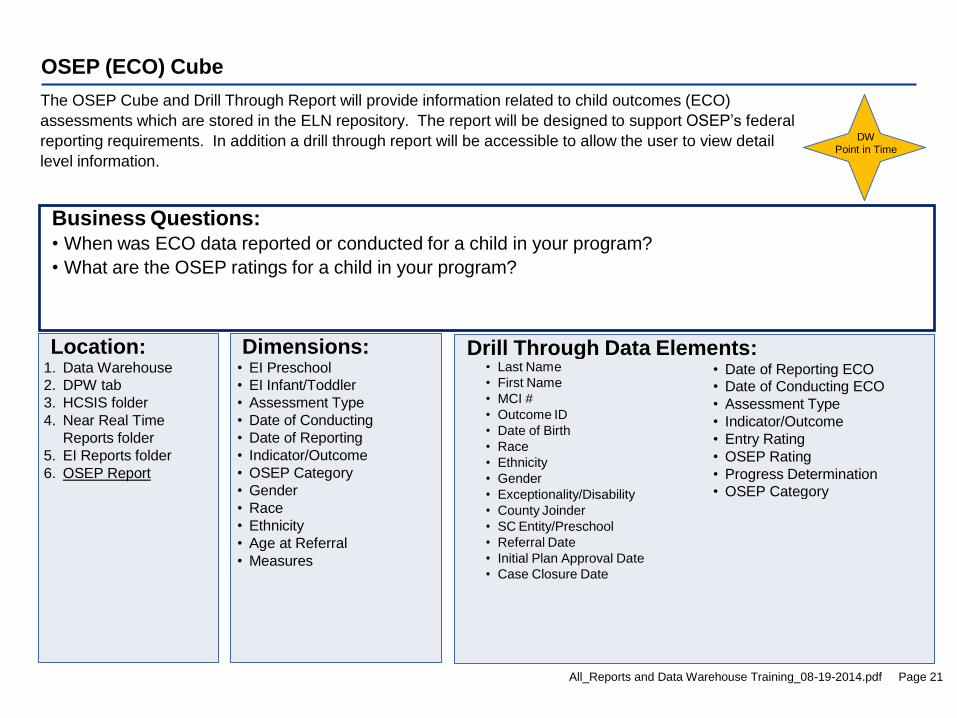
OSEP (ECO) Cube
The OSEP Cube and Drill Through Report will provide information related to child outcomes (ECO)
assessments which are stored in the ELN repository. The report will be designed to support OSEP’s federal
reporting requirements. In addition a drill through report will be accessible to allow the user to view detail
level information.
Drill Through Data Elements: • Last Name
• First Name
• MCI #
• Outcome ID
• Date of Birth
• Race
• Ethnicity
• Gender
• Exceptionality/Disability
• County Joinder
• SC Entity/Preschool
• Referral Date
• Initial Plan Approval Date
• Case Closure Date
• Date of Reporting ECO • Date of Conducting ECO
• Assessment Type
• Indicator/Outcome
• Entry Rating
• OSEP Rating
• Progress Determination
• OSEP Category
Dimensions: • EI Preschool
• EI Infant/Toddler
• Assessment Type
• Date of Conducting
• Date of Reporting
• Indicator/Outcome
• OSEP Category
• Gender
• Race
• Ethnicity
• Age at Referral
• Measures
Location: 1. Data Warehouse
2. DPW tab
3. HCSIS folder
4. Near Real Time
Reports folder
5. EI Reports folder
6. OSEP Report
Business Questions: • When was ECO data reported or conducted for a child in your program?
• What are the OSEP ratings for a child in your program?
DW
Point in Time
All_Reports and Data Warehouse Training_08-19-2014.pdf Page 22
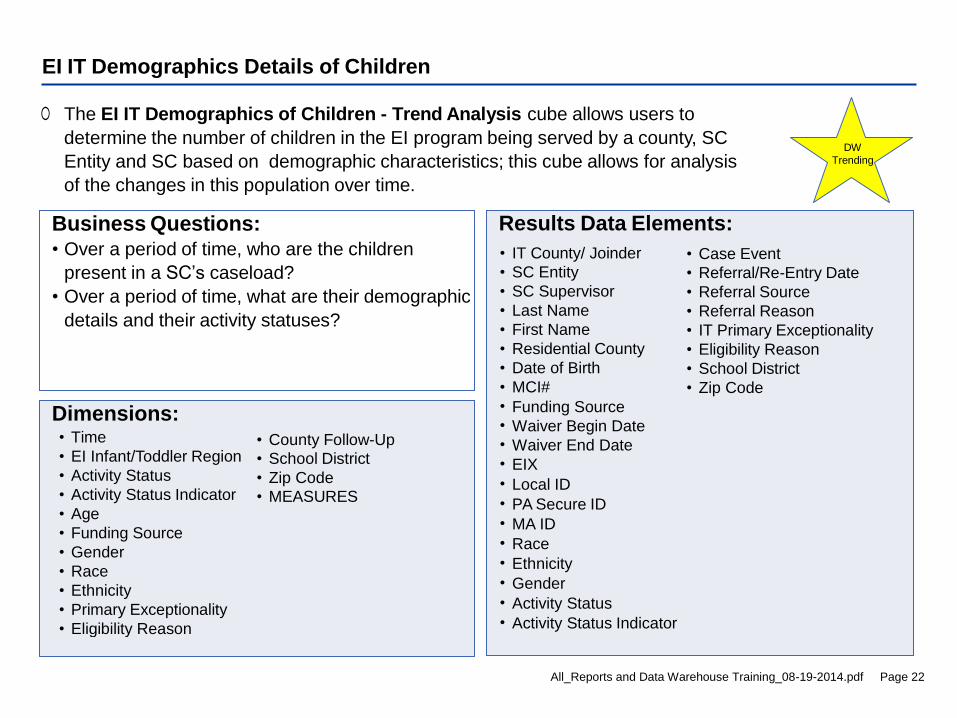
EI IT Demographics Details of Children
The EI IT Demographics of Children - Trend Analysis cube allows users to
determine the number of children in the EI program being served by a county, SC
Entity and SC based on demographic characteristics; this cube allows for analysis
of the changes in this population over time.
Results Data Elements:
• IT County/ Joinder • Case Event • SC Entity • Referral/Re-Entry Date • SC Supervisor • Referral Source • Last Name • Referral Reason • First Name • IT Primary Exceptionality • Residential County • Eligibility Reason • Date of Birth • School District • MCI# • Zip Code • Funding Source • Waiver Begin Date • Waiver End Date • EIX
• Local ID
• PA Secure ID
• MA ID
• Race
• Ethnicity
• Gender
• Activity Status
• Activity Status Indicator
Dimensions: • Time
• EI Infant/Toddler Region
• Activity Status
• Activity Status Indicator
• Age
• Funding Source
• Gender
• Race
• Ethnicity
• Primary Exceptionality
• Eligibility Reason
• Referral Source
• County Follow-Up
• School District
• Zip Code
• MEASURES
DW
Trending
Business Questions: • Over a period of time, who are the children
present in a SC’s caseload?
• Over a period of time, what are their demographic
details and their activity statuses?
All_Reports and Data Warehouse Training_08-19-2014.pdf Page 23
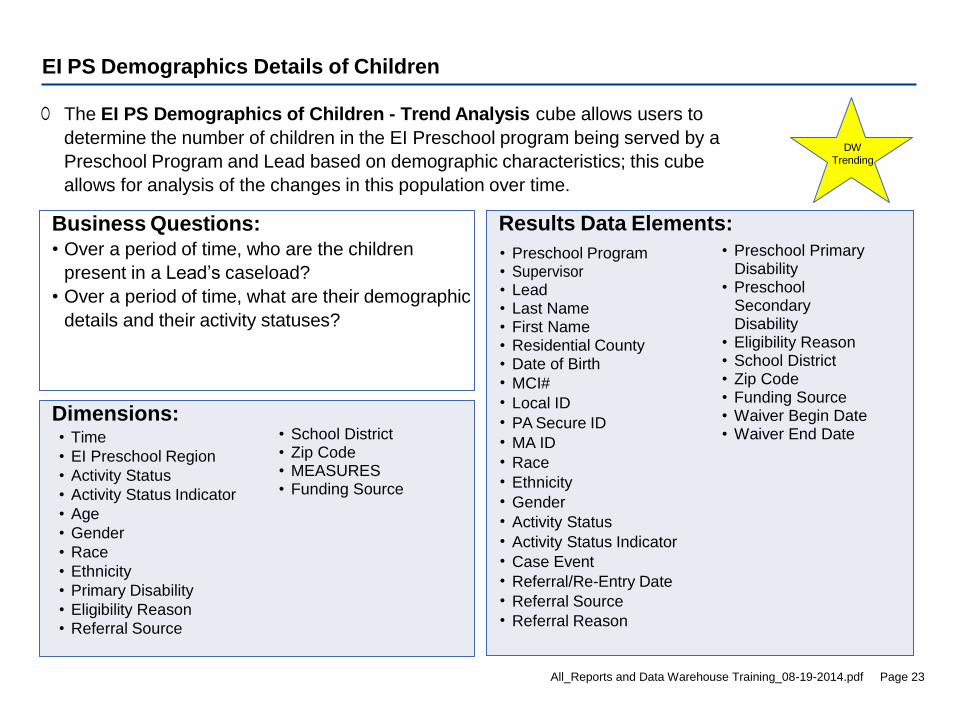
EI PS Demographics Details of Children
The EI PS Demographics of Children - Trend Analysis cube allows users to
determine the number of children in the EI Preschool program being served by a
Preschool Program and Lead based on demographic characteristics; this cube
allows for analysis of the changes in this population over time.
Results Data Elements:
• Preschool Program • Supervisor • Lead • Last Name • First Name • Residential County • Date of Birth • MCI#
• Local ID
• PA Secure ID
• MA ID
• Race
• Ethnicity
• Gender
• Activity Status
• Activity Status Indicator
• Case Event
• Referral/Re-Entry Date
• Referral Source
• Referral Reason
Dimensions: • Time
• EI Preschool Region
• Activity Status
• Activity Status Indicator
• Age
• Gender
• Race
• Ethnicity
• Primary Disability
• Eligibility Reason
• Referral Source
•
DW
Trending
Business Questions: • Over a period of time, who are the children
present in a Lead’s caseload?
• Over a period of time, what are their demographic
details and their activity statuses?
• Preschool Primary Disability
• Preschool Secondary Disability
• Eligibility Reason • School District • Zip Code • Funding Source • Waiver Begin Date • Waiver End Date • School District
• Zip Code • MEASURES • Funding Source
All_Reports and Data Warehouse Training_08-19-2014.pdf Page 24
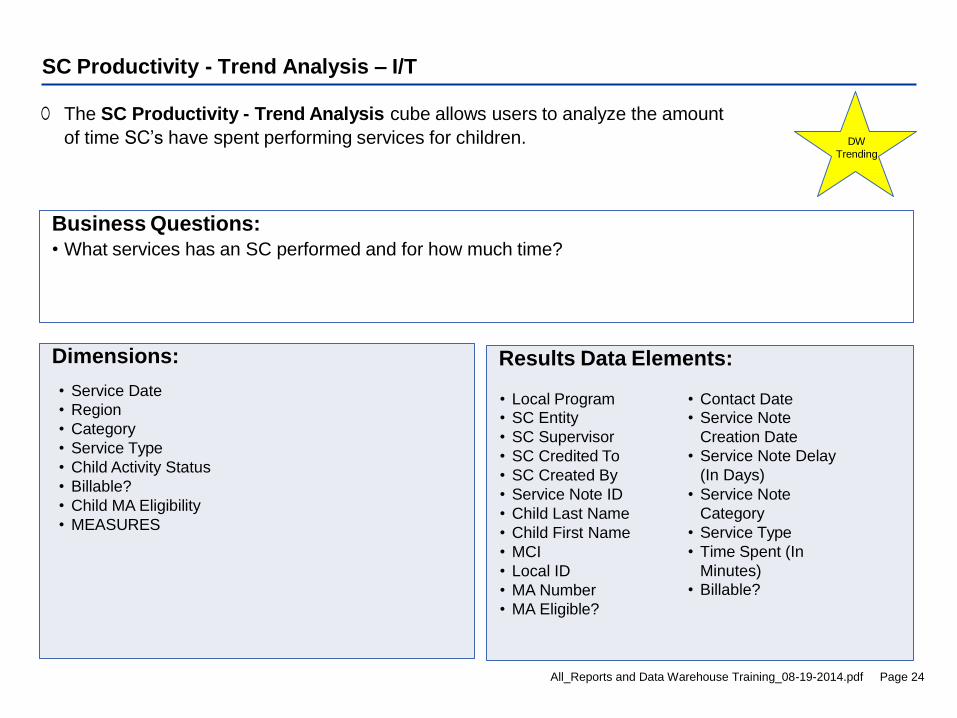
SC Productivity - Trend Analysis – I/T
The SC Productivity - Trend Analysis cube allows users to analyze the amount
of time SC’s have spent performing services for children.
Results Data Elements:
• Local Program • SC Entity
• SC Supervisor
• SC Credited To
• SC Created By
• Service Note ID
• Child Last Name
• Child First Name
• MCI
• Local ID
• MA Number
• MA Eligible?
• Contact Date • Service Note
Creation Date
• Service Note Delay
(In Days)
• Service Note
Category
• Service Type
• Time Spent (In
Minutes)
• Billable?
Dimensions:
• Service Date
• Region
• Category
• Service Type
• Child Activity Status
• Billable?
• Child MA Eligibility
• MEASURES
Business Questions: • What services has an SC performed and for how much time?
DW
Trending
All_Reports and Data Warehouse Training_08-19-2014.pdf Page 25
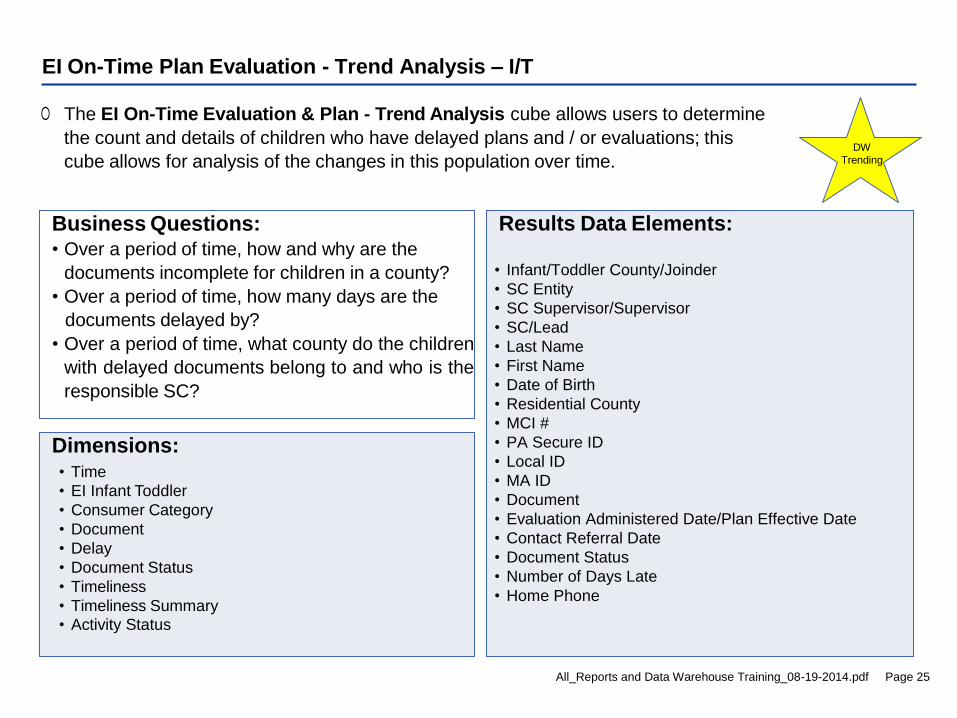
EI On-Time Plan Evaluation - Trend Analysis – I/T
The EI On-Time Evaluation & Plan - Trend Analysis cube allows users to determine
the count and details of children who have delayed plans and / or evaluations; this
cube allows for analysis of the changes in this population over time.
Dimensions: • Time
• EI Infant Toddler
• Consumer Category
• Document
• Delay
• Document Status
• Timeliness
• Timeliness Summary
• Activity Status
DW
Trending
Business Questions: • Over a period of time, how and why are the
documents incomplete for children in a county?
• Over a period of time, how many days are the
documents delayed by?
• Over a period of time, what county do the children
with delayed documents belong to and who is the
responsible SC?
Results Data Elements: • Infant/Toddler County/Joinder
• SC Entity
• SC Supervisor/Supervisor
• SC/Lead
• Last Name
• First Name
• Date of Birth
• Residential County
• MCI #
• PA Secure ID
• Local ID
• MA ID
• Document
• Evaluation Administered Date/Plan Effective Date
• Contact Referral Date
• Document Status
• Number of Days Late
• Home Phone
All_Reports and Data Warehouse Training_08-19-2014.pdf Page 25
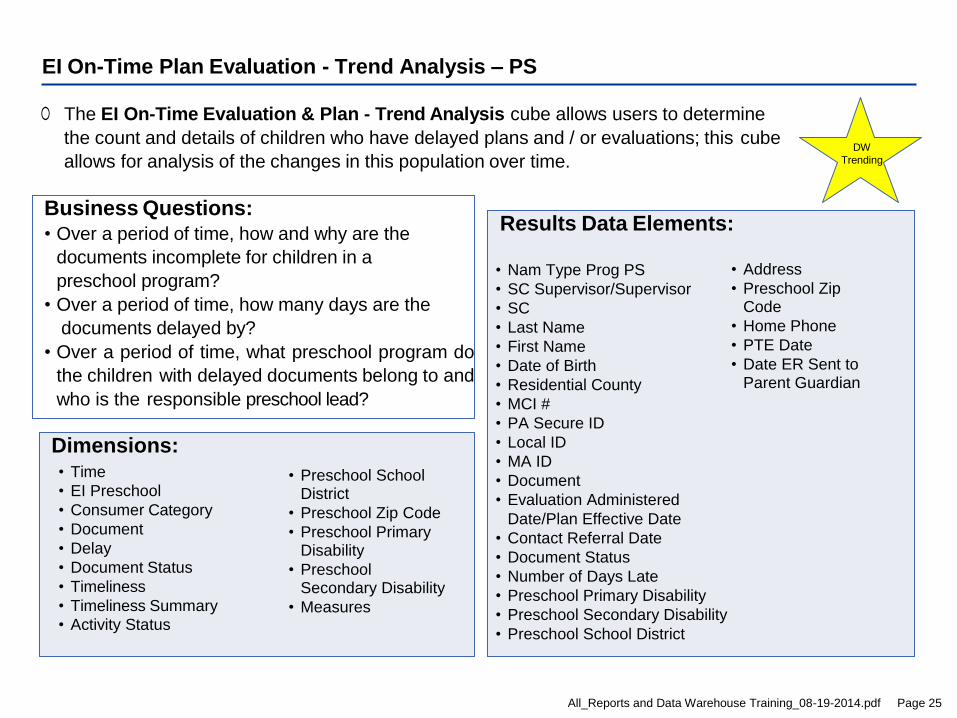
EI On-Time Plan Evaluation - Trend Analysis – PS
The EI On-Time Evaluation & Plan - Trend Analysis cube allows users to determine
the count and details of children who have delayed plans and / or evaluations; this cube
allows for analysis of the changes in this population over time.
Dimensions: • Time
• EI Preschool
• Consumer Category
• Document
• Delay
• Document Status
• Timeliness
• Timeliness Summary
• Activity Status
• Preschool School District
• Preschool Zip Code
• Preschool Primary Disability
• Preschool Secondary Disability
• Measures
DW
Trending
Business Questions: • Over a period of time, how and why are the
documents incomplete for children in a
preschool program?
• Over a period of time, how many days are the
documents delayed by?
• Over a period of time, what preschool program do
the children with delayed documents belong to and
who is the responsible preschool lead?
Results Data Elements: • Nam Type Prog PS
• SC Supervisor/Supervisor
• SC
• Last Name
• First Name
• Date of Birth
• Residential County
• MCI #
• PA Secure ID
• Local ID
• MA ID
• Document
• Evaluation Administered
Date/Plan Effective Date
• Contact Referral Date
• Document Status
• Number of Days Late
• Preschool Primary Disability
• Preschool Secondary Disability
• Preschool School District
• Address
• Preschool Zip Code
• Home Phone
• PTE Date
• Date ER Sent to Parent Guardian
All_Reports and Data Warehouse Training_08-19-2014.pdf Page 26
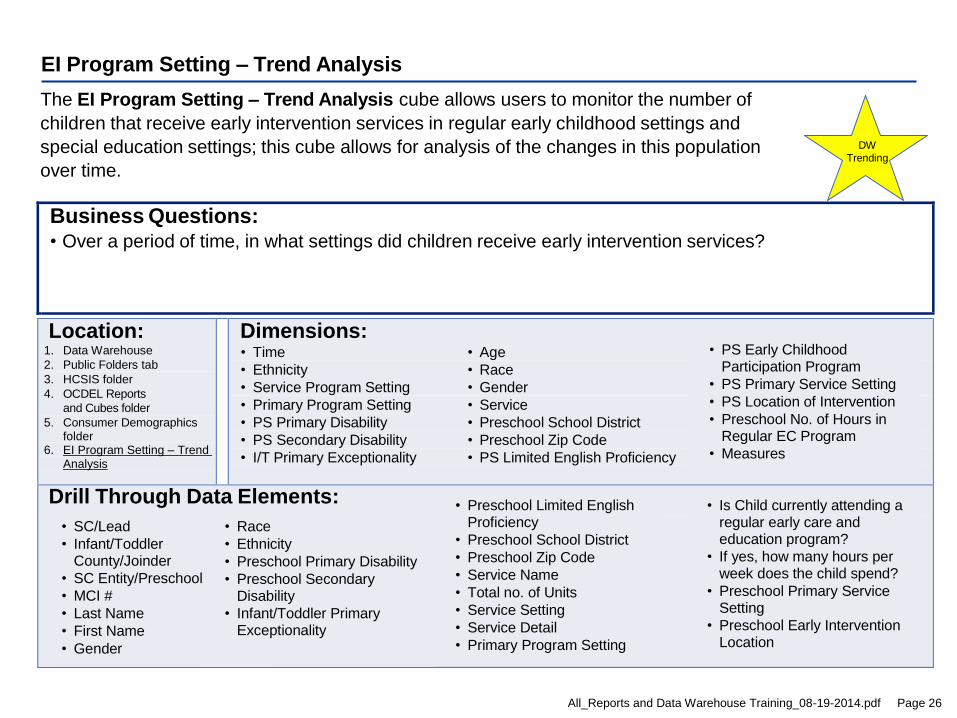
EI Program Setting – Trend Analysis
The EI Program Setting – Trend Analysis cube allows users to monitor the number of
children that receive early intervention services in regular early childhood settings and
special education settings; this cube allows for analysis of the changes in this population
over time.
Business Questions: • Over a period of time, in what settings did children receive early intervention services?
Location: 1. Data Warehouse
2. Public Folders tab
3. HCSIS folder
4. OCDEL Reports
and Cubes folder
5. Consumer Demographics folder
6. EI Program Setting – Trend Analysis
Dimensions: • Time • Age
• Ethnicity • Race
• Service Program Setting • Gender
• Primary Program Setting • Service
• PS Primary Disability • Preschool School District
• PS Secondary Disability • Preschool Zip Code
• I/T Primary Exceptionality • PS Limited English Proficiency
Drill Through Data Elements:
DW
Trending
• PS Early Childhood Participation Program
• PS Primary Service Setting
• PS Location of Intervention
• Preschool No. of Hours in Regular EC Program
• Measures
• SC/Lead
• Infant/Toddler County/Joinder
• SC Entity/Preschool
• MCI #
• Last Name
• First Name
• Gender
• Race
• Ethnicity
• Preschool Primary Disability
• Preschool Secondary Disability
• Infant/Toddler Primary Exceptionality
• Preschool Limited English Proficiency
• Preschool School District
• Preschool Zip Code
• Service Name
• Total no. of Units
• Service Setting
• Service Detail
• Primary Program Setting
• Is Child currently attending a regular early care and education program?
• If yes, how many hours per week does the child spend?
• Preschool Primary Service Setting
• Preschool Early Intervention Location
All_Reports and Data Warehouse Training_08-19-2014.pdf Page 27
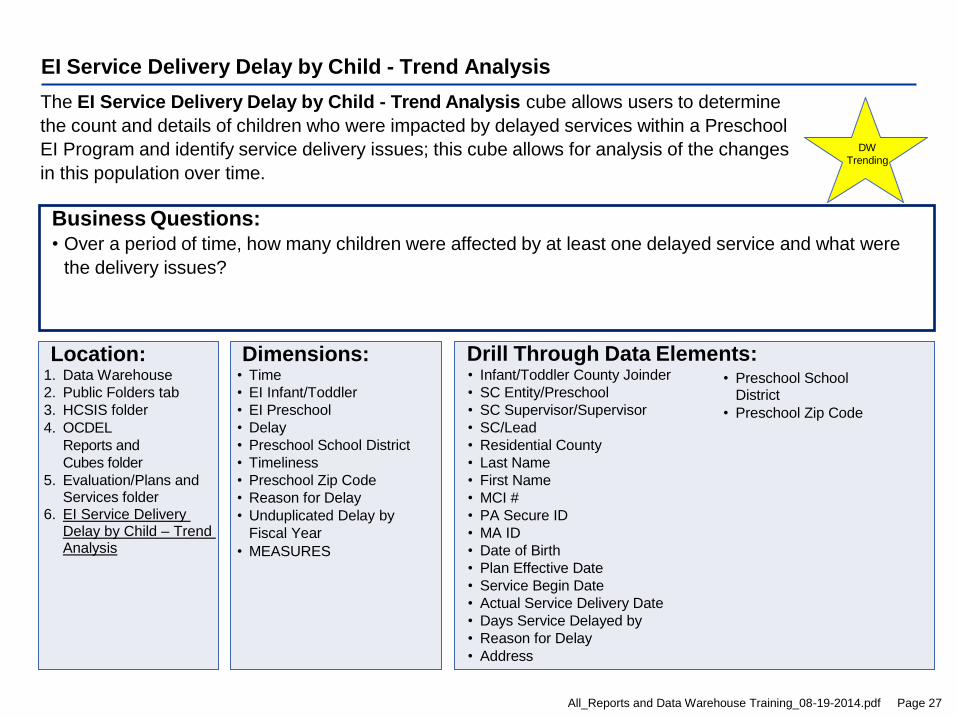
EI Service Delivery Delay by Child - Trend Analysis
The EI Service Delivery Delay by Child - Trend Analysis cube allows users to determine
the count and details of children who were impacted by delayed services within a Preschool
EI Program and identify service delivery issues; this cube allows for analysis of the changes
in this population over time.
Drill Through Data Elements: • Infant/Toddler County Joinder
• SC Entity/Preschool
• SC Supervisor/Supervisor
• SC/Lead
• Residential County
• Last Name
• First Name
• MCI #
• PA Secure ID
• MA ID
• Date of Birth
• Plan Effective Date
• Service Begin Date
• Actual Service Delivery Date
• Days Service Delayed by
• Reason for Delay
• Address
Dimensions: • Time
• EI Infant/Toddler
• EI Preschool
• Delay
• Preschool School District
• Timeliness
• Preschool Zip Code
• Reason for Delay
• Unduplicated Delay by
Fiscal Year
• MEASURES
Location: 1. Data Warehouse
2. Public Folders tab
3. HCSIS folder
4. OCDEL
Reports and
Cubes folder
5. Evaluation/Plans and Services folder
6. EI Service Delivery Delay by Child – Trend Analysis
Business Questions: • Over a period of time, how many children were affected by at least one delayed service and what were
the delivery issues?
DW
Trending
• Preschool School District
• Preschool Zip Code
All_Reports and Data Warehouse Training_08-19-2014.pdf Page 27
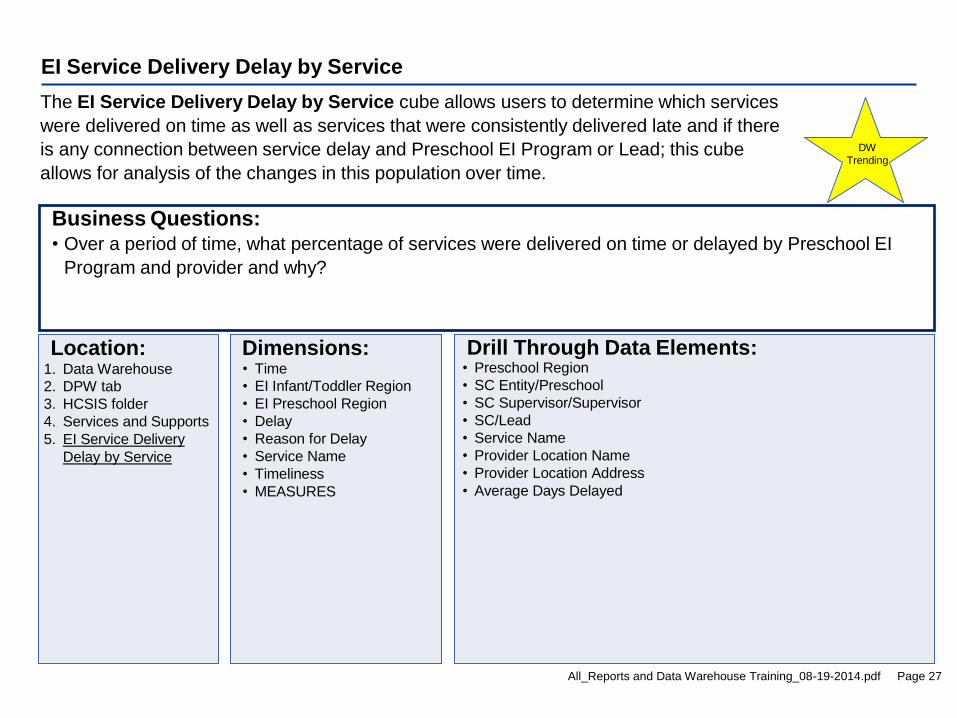
EI Service Delivery Delay by Service
The EI Service Delivery Delay by Service cube allows users to determine which services
were delivered on time as well as services that were consistently delivered late and if there
is any connection between service delay and Preschool EI Program or Lead; this cube
allows for analysis of the changes in this population over time.
Drill Through Data Elements: • Preschool Region
• SC Entity/Preschool
• SC Supervisor/Supervisor
• SC/Lead
• Service Name
• Provider Location Name
• Provider Location Address
• Average Days Delayed
Dimensions: • Time
• EI Infant/Toddler Region
• EI Preschool Region
• Delay
• Reason for Delay
• Service Name
• Timeliness
• MEASURES
Location: 1. Data Warehouse
2. DPW tab
3. HCSIS folder
4. Services and Supports
5. EI Service Delivery
Delay by Service
Business Questions: • Over a period of time, what percentage of services were delivered on time or delayed by Preschool EI
Program and provider and why?
DW
Trending
All_Reports and Data Warehouse Training_08-19-2014.pdf Page 28
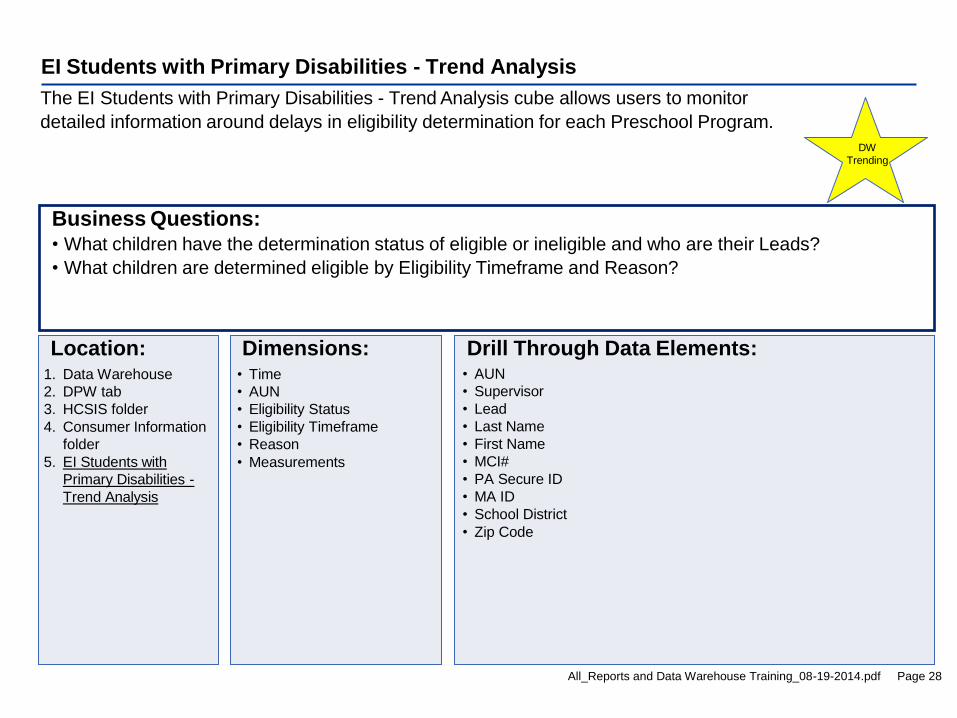
EI Students with Primary Disabilities - Trend Analysis
The EI Students with Primary Disabilities - Trend Analysis cube allows users to monitor
detailed information around delays in eligibility determination for each Preschool Program.
Drill Through Data Elements: • AUN
• Supervisor
• Lead
• Last Name
• First Name
• MCI#
• PA Secure ID
• MA ID
• School District
• Zip Code
Dimensions: • Time
• AUN
• Eligibility Status
• Eligibility Timeframe
• Reason
• Measurements
Location: 1. Data Warehouse
2. DPW tab
3. HCSIS folder
4. Consumer Information
folder
5. EI Students with
Primary Disabilities -
Trend Analysis
Business Questions: • What children have the determination status of eligible or ineligible and who are their Leads?
• What children are determined eligible by Eligibility Timeframe and Reason?
DW
Trending
All_Reports and Data Warehouse Training_08-19-2014.pdf Page 29
der
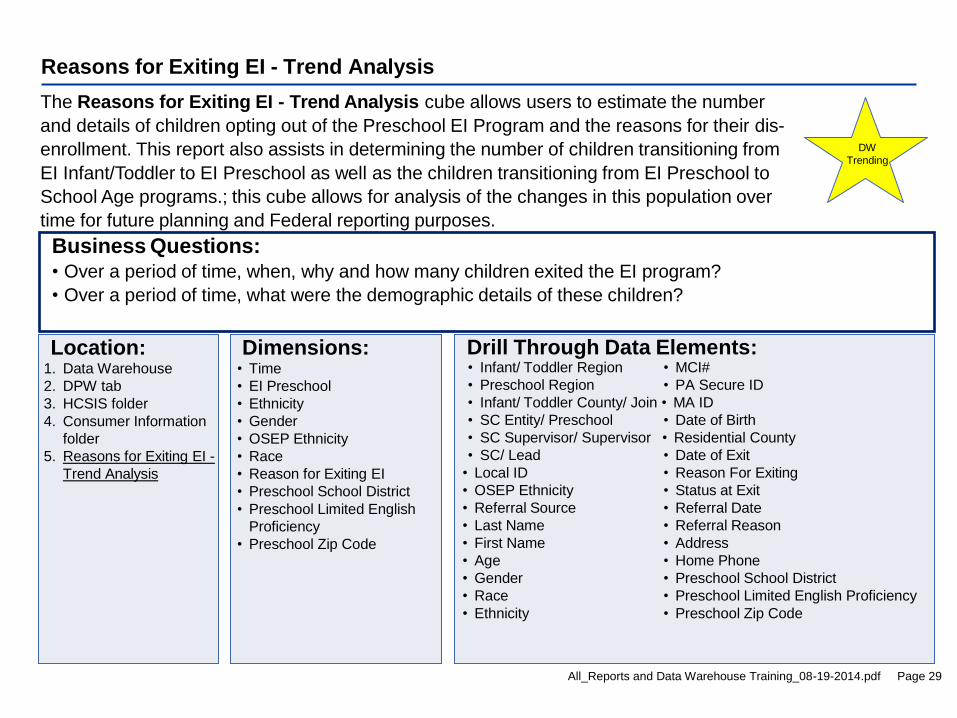
Reasons for Exiting EI - Trend Analysis
The Reasons for Exiting EI - Trend Analysis cube allows users to estimate the number
and details of children opting out of the Preschool EI Program and the reasons for their dis-
enrollment. This report also assists in determining the number of children transitioning from
EI Infant/Toddler to EI Preschool as well as the children transitioning from EI Preschool to
School Age programs.; this cube allows for analysis of the changes in this population over
time for future planning and Federal reporting purposes.
Drill Through Data Elements: • Infant/ Toddler Region • MCI#
• Preschool Region • PA Secure ID
• Infant/ Toddler County/ Join • MA ID
• SC Entity/ Preschool • Date of Birth
• SC Supervisor/ Supervisor • Residential County
• SC/ Lead • Date of Exit
• Local ID • Reason For Exiting
• OSEP Ethnicity • Status at Exit
• Referral Source • Referral Date
• Last Name • Referral Reason
• First Name • Address
• Age • Home Phone
• Gender • Preschool School District
• Race • Preschool Limited English Proficiency
• Ethnicity • Preschool Zip Code
Dimensions: • Time
• EI Preschool
• Ethnicity
• Gender
• OSEP Ethnicity
• Race
• Reason for Exiting EI
• Preschool School District
• Preschool Limited English
Proficiency
• Preschool Zip Code
Location: 1. Data Warehouse
2. DPW tab
3. HCSIS folder
4. Consumer Information
folder
5. Reasons for Exiting EI -
Trend Analysis
Business Questions: • Over a period of time, when, why and how many children exited the EI program?
• Over a period of time, what were the demographic details of these children?
DW
Trending
All_Reports and Data Warehouse Training_08-19-2014.pdf Page 30
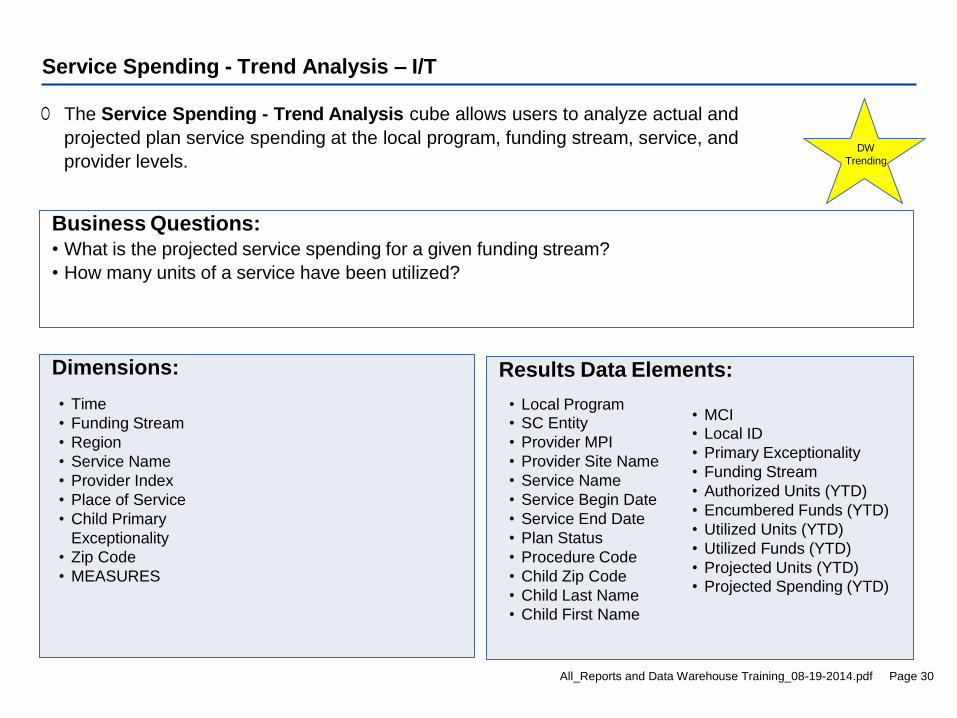
Service Spending - Trend Analysis – I/T
The Service Spending - Trend Analysis cube allows users to analyze actual and
projected plan service spending at the local program, funding stream, service, and
provider levels.
Results Data Elements:
• Local Program • SC Entity
• Provider MPI
• Provider Site Name
• Service Name
• Service Begin Date
• Service End Date
• Plan Status
• Procedure Code
• Child Zip Code
• Child Last Name
• Child First Name
• MCI • Local ID
• Primary Exceptionality
• Funding Stream
• Authorized Units (YTD)
• Encumbered Funds (YTD)
• Utilized Units (YTD)
• Utilized Funds (YTD)
• Projected Units (YTD)
• Projected Spending (YTD)
Dimensions:
• Time
• Funding Stream
• Region
• Service Name
• Provider Index
• Place of Service
• Child Primary
Exceptionality
• Zip Code
• MEASURES
Business Questions: • What is the projected service spending for a given funding stream?
• How many units of a service have been utilized?
DW
Trending
All_Reports and Data Warehouse Training_08-19-2014.pdf Page 31
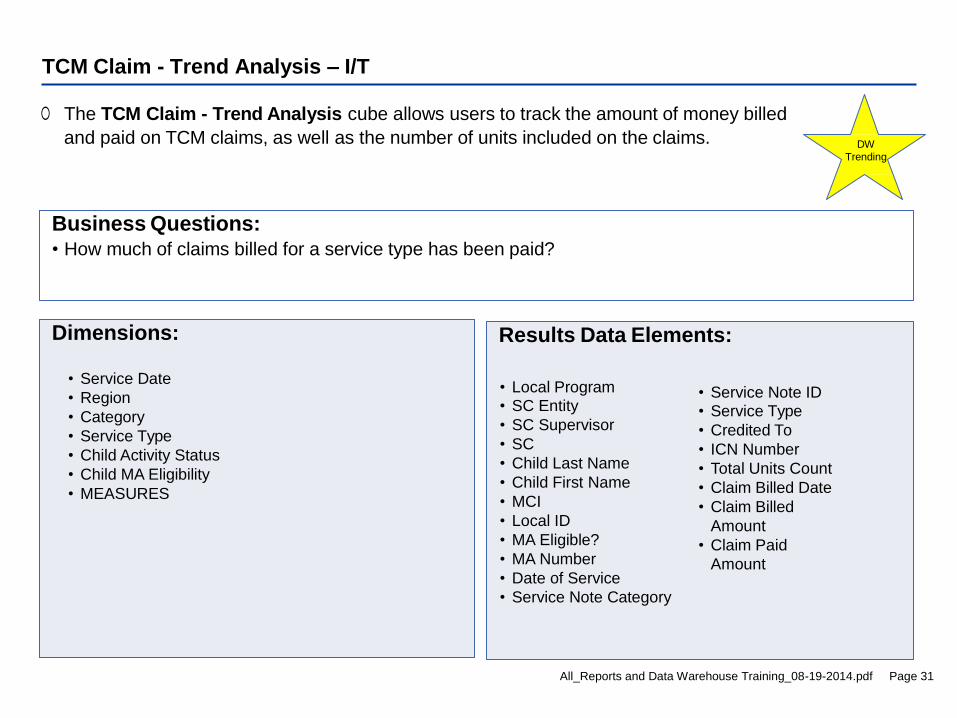
TCM Claim - Trend Analysis – I/T
The TCM Claim - Trend Analysis cube allows users to track the amount of money billed
and paid on TCM claims, as well as the number of units included on the claims.
Results Data Elements:
• Local Program • SC Entity
• SC Supervisor
• SC
• Child Last Name
• Child First Name
• MCI
• Local ID
• MA Eligible?
• MA Number
• Date of Service
• Service Note Category
• Service Note ID • Service Type
• Credited To
• ICN Number
• Total Units Count
• Claim Billed Date
• Claim Billed
Amount
• Claim Paid
Amount
Dimensions:
• Service Date
• Region
• Category
• Service Type
• Child Activity Status
• Child MA Eligibility
• MEASURES
Business Questions: • How much of claims billed for a service type has been paid?
DW
Trending
All_Reports and Data Warehouse Training_08-19-2014.pdf Page 32
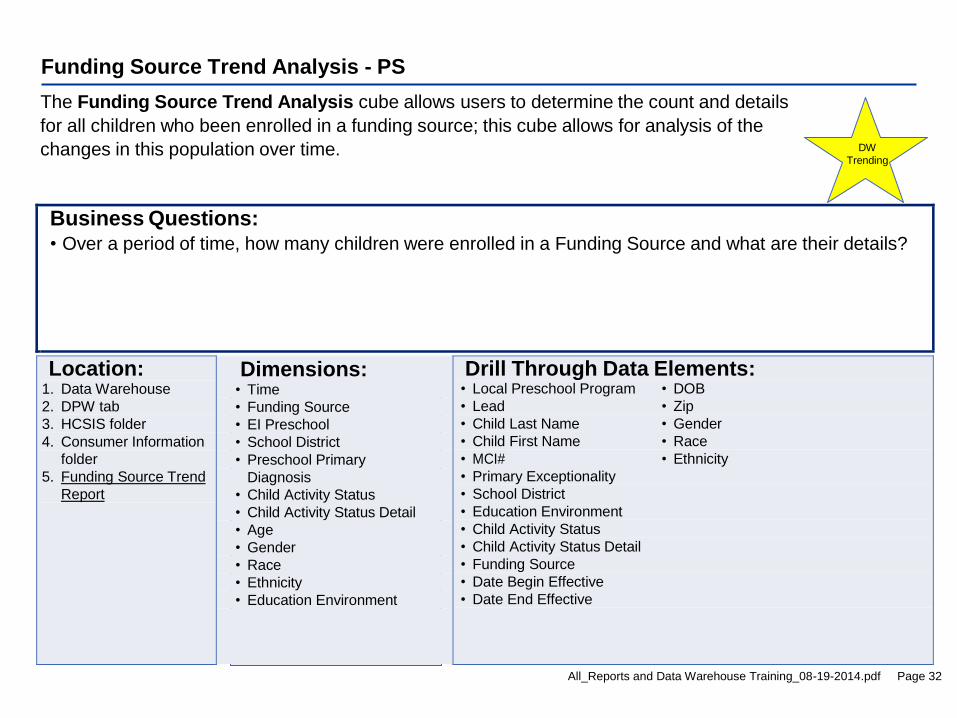
Funding Source Trend Analysis - PS
The Funding Source Trend Analysis cube allows users to determine the count and details
for all children who been enrolled in a funding source; this cube allows for analysis of the
changes in this population over time.
Business Questions: • Over a period of time, how many children were enrolled in a Funding Source and what are their details?
Location: 1. Data Warehouse
2. DPW tab
3. HCSIS folder
4. Consumer Information
folder
5. Funding Source Trend
Report
Dimensions: • Time
• Funding Source
• EI Preschool
• School District
• Preschool Primary
Diagnosis
• Child Activity Status
• Child Activity Status Detail
• Age
• Gender
• Race
• Ethnicity
• Education Environment
Drill Through Data Elements: • Local Preschool Program • DOB
• Lead • Zip
• Child Last Name • Gender
• Child First Name • Race
• MCI# • Ethnicity
• Primary Exceptionality
• School District
• Education Environment
• Child Activity Status
• Child Activity Status Detail
• Funding Source
• Date Begin Effective
• Date End Effective
DW
Trending
All_Reports and Data Warehouse Training_08-19-2014.pdf Page 33
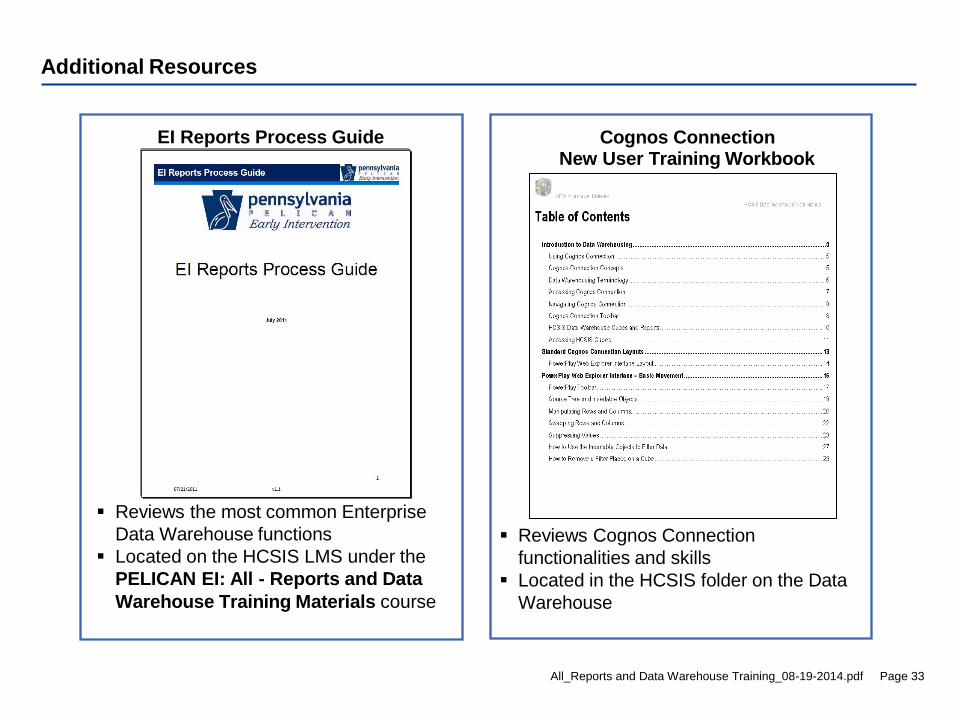
Additional Resources
Cognos Connection New User Training Workbook
Reviews Cognos Connection
functionalities and skills
Located in the HCSIS folder on the Data
Warehouse
EI Reports Process Guide
Reviews the most common Enterprise
Data Warehouse functions
Located on the HCSIS LMS under the
PELICAN EI: All - Reports and Data
Warehouse Training Materials course