pelagia research library - imedpub online a t pelagia research library der chemica sinica, 2014,...
TRANSCRIPT

Available online at www.pelagiaresearchlibrary.com
Pelagia Research Library
Der Chemica Sinica, 2014, 5(4):46-55
ISSN: 0976-8505
CODEN (USA) CSHIA5
46 Pelagia Research Library
Preparation and characterization of activated carbon from Fagopyrum esculentum Moench by HNO3 and H3PO4 chemical activation
Daniel Kibami1,2*, Chubaakum Pongener1, K. S. Rao1 and Dipak Sinha1#
1Department of Chemistry, Nagaland University, Lumami, Nagaland, India 2Department of Chemistry, Fazl Ali College, Mokokchung, Nagaland, India
_____________________________________________________________________________________________
ABSTRACT Activated carbon has been synthesized from bio-waste materials of the plant Fagopyrum esculentum Moench. Chemical activation of the carbon was done by HNO3 and H3PO4. Characterization includes pH, apparent density, point of zero charge (pHpzc), Boehm titration, iodine number, proximate analysis and the surface characterization was done with BET, EDX and SEM. Activated carbon provides a large section of surface area, in order to allow contaminants to be adsorbed on the surface area depending on the functional group and ions present on the surface of the activated carbon, its adsorption quality varies. Langmuir and Freundlich adsorption of Methylene blue dye on the activated carbon were studied. Due to the presence of numerous pores size as well as various functional groups on the activated carbon, methylene blue could be adsorbed effectively and efficiently thus proving that this activated carbon can be considered a good adsorbent for removal of dye from water. Keywords: Activated carbon, Boehm titration, Iodine number, methylene blue _____________________________________________________________________________________________
INTRODUCTION
Activated carbons are unique and versatile adsorbents because of their extended interparticulate large surface area, microporous structure, high adsorption capacity, and high degree of surface reactivity. Depending on the functional group and ions present on the surface of the activated carbon, its adsorption quality varies [1]. Their important applications are the adsorptive removal of colour, odor, and taste, and other undesirable organic and inorganic pollutants from drinking water, in the treatment of industrial waste water; air purification in inhabited spaces such as in restaurants, food processing, and chemical industries; for the purification of many chemical, food, and pharmaceutical products[1-4]. Activated carbon is obtained from a carefully controlled process of dehydration, carbonization and oxidation of organic substances [5]. It can be prepared for research in the laboratory from a large number of materials. However, the most commonly used ones in commercial practice primarily industrial and agricultural byproducts and forest wastes, such as coconut shell [6], sugar beet bagasse [7], rice straw [8], bamboo [9], rattan sawdust [10], molasses [11], rubber wood sawdust [12], oil palm fiber [13], waste apricot [14], and coconut husk [15]. Carbonization is a heat treatment at 400-800°C which converts raw materials to carbon by minimizing the content of volatile matter and increasing the carbon content of the material. This increases the materials strength and creates an initial porous structure which is necessary if the carbon is to be activated. Adjusting the conditions of carbonization can affect the final product significantly. An increased carbonization temperature increases reactivity, but at the
Daniel Kibami et al Der Chemica Sinica, 2014, 5(4):46-55 _____________________________________________________________________________
47 Pelagia Research Library
same time decreases the volume of pores present. This decreased volume of pores is due to an increase in the condensation of the material at higher temperatures of carbonization which yields an increase in mechanical strength. Therefore, it becomes important to choose the correct process temperature based on the desired product of carbonization [1]. After the initial porous structure has been created by carbonization, This pore structure in carbonized char is further developed and enhanced during the activated carbon process, which converts the carbonized raw material into a form that contains the greatest possible number of randomly distributed pores of various sizes and shapes, producing an extended and extremely high surface area of the product [5]. Activation can be carried out as activation by oxidizing gases or a chemical activation. In activation by oxidizing gases, such as steam activation, carbon reacts with the oxidizing agent producing oxides of carbon [1-3]. These oxides diffuse out of the carbon resulting in a partial gasification which opens pores that were previous closed and further develops the carbons internal porous structure. In chemical activation, the carbon is reacted at high temperatures with a dehydrating agent that eliminates the majority of hydrogen and oxygen from the carbon structure [2]. The objective of this study is to produce activated carbon from locally available biowaste with two different acids, characterization of the produced activated carbons and finally examine the changes in the adsorption capacity towards methylene blue dye by the formation of various oxygen and nitrogen surface functionalities by oxidation of activated carbons of similar porosity with nitric acid and phosphoric acid.
MATERIALS AND METHODS 2.1 Preparation of activated carbon Activated carbon in powder form is prepared by the pyrolysis of Fagopyrum esculentum Moench (FEMC). Stem and leaves of FEMC were collected, washed, dried, and crushed before carbonizing in a uniform nitrogen flow in a
horizontal tube furnace electrically heated at 600 oC for 4 hours. Then the activated carbon was cooled to room and
ground to 45 mesh. These powdered carbons were subjected to liquid phase oxidation with 0.1N HNO3 and 0.1 N H3PO4. After that the carbons were washed with double-distilled water to remove the excess acid and dried at 150oC for 12hours. All the activated carbons (FEMC) are chemically activated with 0.1N solution HNO
3 and H3PO4. The
powdered activated carbon obtained after HNO3 and H3PO4 treatment has a particle size in the range of 40-50 µm mesh. Finally the Physico-chemical and surface characterization of prepared carbons are done which is discussed below: 2.2 Determination of pH In order to determine pH of FEMC the standard test method was used [16]. 1.0 g of each activated carbon FEMC was transferred into 100 ml distilled water taken in a beaker and kept in a magnetic stirrer for one hour at 120 rpm. pH was then measured by pH meter. The samples were tested in triplicates. 2.3 Apparent density: In order to determine the apparent density the standard test method was used [17]. A specific gravity bottle of 25 ml capacity was filled with the adsorbent and packed in a rubber stopper. The weight of the adsorbent was determined. The weight (g) divided by the volume (ml) gives the apparent density (g/ml) of the adsorbent. 2.4 Determination of surface area (BET method): BET-N2 adsorption experiments were carried out manometrically using an Autosorb (Quanta Chrome Crop). Prior to gas adsorption measurements, the carbon samples were degassed at 200 ◦C in a vacuum condition for a period of at least 24 h. Nitrogen adsorption isotherms were measured at a series of different pressures at -196 oC. 2.5 Iodine number Iodine number is the mass (mg) of iodine adsorbed from a standard 0.1 N (0.05 M) iodine solutions, when the equilibrium iodine concentration is exactly 0.02 N (0.01 M). According to the procedure defined by ASTM D4607 - 94(2006)[18], for determination of iodine number 0.7- 2 g of activated carbon was added with 10ml of 5% HCl and swirled in a conical flask until the entire activated carbon was wetted. The wetted solution was then boiled for exactly 30 seconds and the solution was cooled to room temperature. Then 100ml of 0.1N iodine solution was added to the contents of the conical flask. This solution was filtered using a Whatman 2V filter paper. Later 50ml of this filtrate was then titrated against 0.10 N sodium thiosulphate until the yellow colour had almost disappeared. 1 ml starch indicator was added and the titration was continued until the blue colour just diappears. The equilibrium concentration is determined by calculation using the amount of sodium thiosulphate used in the titration. If this

Daniel Kibami et al Der Chemica Sinica, 2014, 5(4):46-55 _____________________________________________________________________________
48 Pelagia Research Library
equilibrium concentration was not within the range of 0.008 to 0.334, then the procedure was repeated with a different amount of activated carbon. 2.6 Boehm’s Titration The presence of surface functional groups in the activated carbons was quantified by Boehm titration method [19, 20]. About 1.0 g of activated carbon was mixed with each of 50 ml solution (0.1 M) of NaOH, NaHCO3 and Na2CO3 respectively, for 24 hours with continuous stirring. Then, the solid phase was separated from the aqueous solution by vacuum filtration. 10 ml of each filtrate was used for the excess acid titration by 0.1 M HCl (hydrochloric acid). The phenolic group content on the carbon surface was determined as the amount of 0.1 M NaHCO3 consumed by the sample. Lactonic group content was calculated as the difference between the amounts of 0.1 M Na2CO3 and 0.1 M NaHCO3 consumed by the activated carbon sample. Carboxylic group contained by subtracting the amount of 0.1 M Na2CO3 consumed by the activated carbon from the amount of 0.1 M NaOH consumed. This method was used to calculate the concentration of acid groups on activated carbon surface under the following assumptions. Sodium hydroxide (NaOH) neutralizes carboxylic, phenolic and lactonic groups. Sodium carbonate (Na2CO3) neutralizes only carboxylic and phenolic groups. Sodium bicarbonate (NaHCO3) only neutralizes carboxylic groups. 2.7 Zero point charge (pH ZPC): pHzpc of an adsorbent is important because it indicates the net surface charge of the carbon in solution[21,22]. The pHzpc is the point where the curve of pH (final) vs pH (initial) intersects the line pH (initial) = pH (final). In order to determine the pH of point of zero charge 0.1g of activated carbons is added to 200ml solution of 0.1M NaCl whose initial pH has been measured and adjusted with NaOH or HCl. The containers were sealed and placed on a shaker for 24hrs after which the pH was measured. 2.8 Proximate Analysis : The proximate analysis of activated carbon is used to determine the distribution of products obtained when the carbon sample is heated under specific conditions. 2.8.1 Moisture content: The activated carbon samples were determined using standard test method [23]. The sample was put into a pre-dried crucible with lid, and the weight was taken to the nearest 0.5mg, now the lid was removed, the crucible and the lid are heated in a ventilated drying oven at 150 0C for 3 hours. After heating, the plate is quickly covered, cooled in desiccators and weighed. The loss in weight of the adsorbent represents the moisture content. 2.8.2 Volatile matter content: The activated carbon samples were determined using standard test method [24] for volatile matter content of activated carbon. 1 g of activated carbon is taken in a pre-dried crucible and is covered with the lid and heated in a muffle furnace regulated at 950 0 C for 30 min. After heating, the plate is quickly covered, cooled in desiccators and weighed. 2.8.3 Ash content: The activated carbon samples were determined using standard test method [25] for ash content of activated carbon. The crucible is ignited in the muffle furnace at 6500C for 1 hour. After heating, the crucible is placed in a desiccator and cooled at room temperature.1 g of activated carbon pre-heated at 150 0C for 3 hours is taken in the crucible and heated in the furnace at 6300C for 3 hours. The crucible is kept in the desiccators and cooled at room temperature and the weight taken. 2.8.4 Fixed carbon The fixed carbon content is determined by subtracting the sum of percentage compositions of moisture content, volatile matter content, and ash content form 100. The value obtained is the amount of fixed carbon present in the sample expressed in percentage. The fixed carbon of activated carbon samples were calculated from the following equation. % fixed carbon = 100 – (% ash content + % volatile matter content)

Daniel Kibami et al Der Chemica Sinica, 2014, 5(4):46-55 _____________________________________________________________________________
49 Pelagia Research Library
2.9 Scanning Electron Microscope (SEM) Scanning electron microscope (SEM - JEOL, JSM 6360 LV) was used to know the surface texture and porosity of the sample. A thin layer of platinum was sputter-coated on the samples for charge dissipation during FESEM imaging. The sputter coater (Eiko IB-5 Sputter Coater) was operated in an argon atmosphere using a current of 6mA for 3 min. The coated samples were then transferred to the SEM specimen chamber and observed at an accelerating voltage of 5 kV, eight spot size, four aperture and 15mm working distance. 2.10 Energy Dispersive X-ray Analysis (EDX) Energy Dispersive X-ray Analysis (EDX) technique is used for performing elemental analysis or chemical characterization of a sample in conjunction with Scanning Electron Microscopy (SEM) [26,27]. For determining elemental content, the electron-beam strikes the surface of conducting sample (SEM) .The energy of the beam is typically in the range of 10-20 keV. This causes X-rays to be emitted from the irradiated material. The energy of the X-rays emitted depends on the material under examination. The X-rays are generated in a region about 2 microns in depth. By moving the electron beam across the material a 2-D (two dimensional) image of each element in the sample can be acquired. Due to the low X-ray intensity, images usually take a number of hours to be acquired. Elements of low atomic number are difficult to detect by EDX. 2.11 Adsorption Studies The adsorption studies of FEMC adsorbents were done using batch method. Aqueous solution of methylene blue with various concentrations between 5-45 mg/L was prepared. 1 gm of the adsorbent was added into flasks containing 100 ml of the prepared methylene blue solutions. The flasks were placed in a magnetic stirrer shaken at 150 rpm for about 120 mins. Finally the supernatant solutions were analyzed with UV/VIS spectrophotometer (PerkinElmer, lamda-25) at 668 nm. The percentage removal of the dye and the amount of dye adsorbed were calculated by the following equations.
Percentage removal = 100 (�����)
��
Amount adsorbed (qe) = (�����)�
�
where Ci and Cf are the initial and final equilibrium solution concentrations of the dye (mg/ L), V is the volume of the solution (L) and M is the mass of the activated carbon (g). The data obtained have been analyzed for adsorption isotherms models. Langmuir and Freundlich adsorption isotherm models are employed in this study to describe the experimental adsorption isotherm [ 28,29]. Langmuir adsorption is based on the fact that maximum adsorption corresponds to a saturated monolayer of solute molecules on the adsorbent surface. The linear form of the Langmuir equation can be represented by
qe = ��
� ���
The linear form of the Langmuir equation can be represented by ��
�� =
�
�� +
�
Where qe is the amount of methylene blue adsorbed (mg/g) and Ce is the equilibrium concentration of methylene blue in the bulk solution (mg/L). aL/KL gives the theoretical monolayer saturation capacity, qm (mg/g). and 1/KL is the Langmuir constant related to energy adsorption capacity. The constants aL/kL and 1/KL can be calculated from slope and intercept of the plot Ce/qe vrs Ce. [ 30,31]. Freundlich isotherm is an empirical equation describing the heterogeneous adsorption and assumes that different sites with several adsorption energies are involved. The linear form of the Freundlich equation is shown below.
log qe = log k + �
� log Ce

Daniel Kibami et al Der Chemica Sinica, 2014, 5(4):46-55 _____________________________________________________________________________
50 Pelagia Research Library
the slope 1/n gives adsorption capacity and intercept log K gives adsorption intensity from straight portion of the linear plot obtained by plotting log qe versus log Ce,
RESULTS AND DISCUSSION
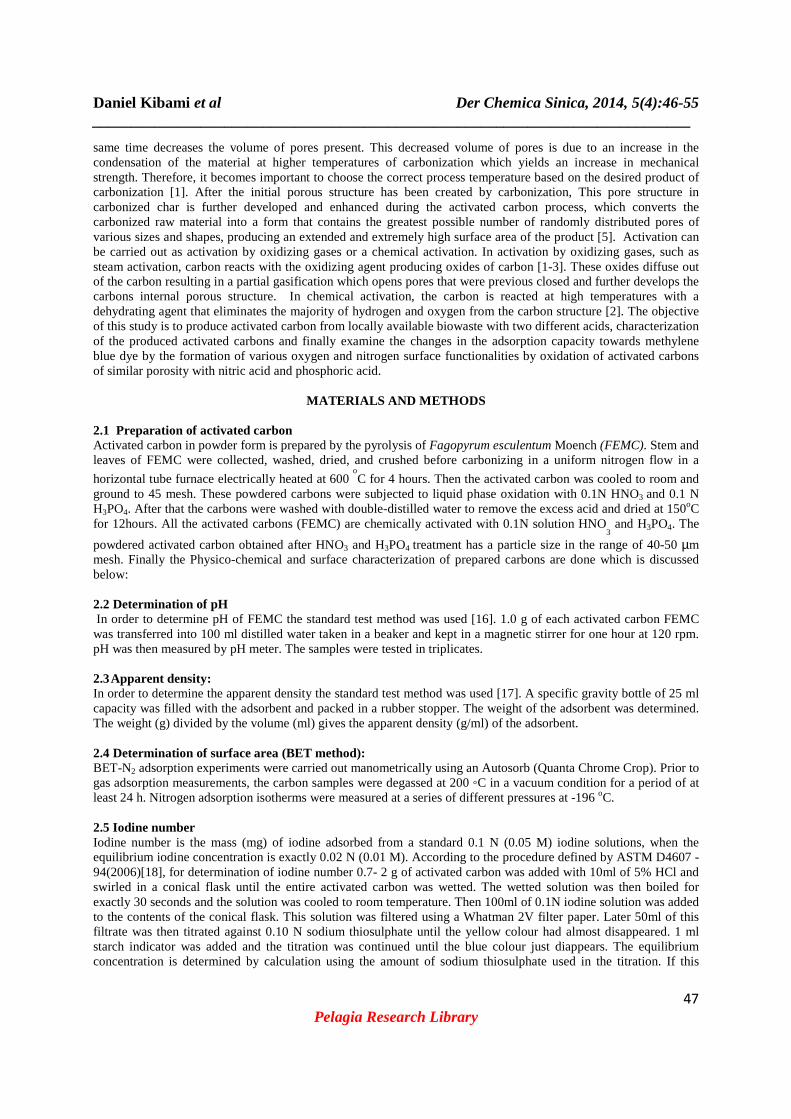
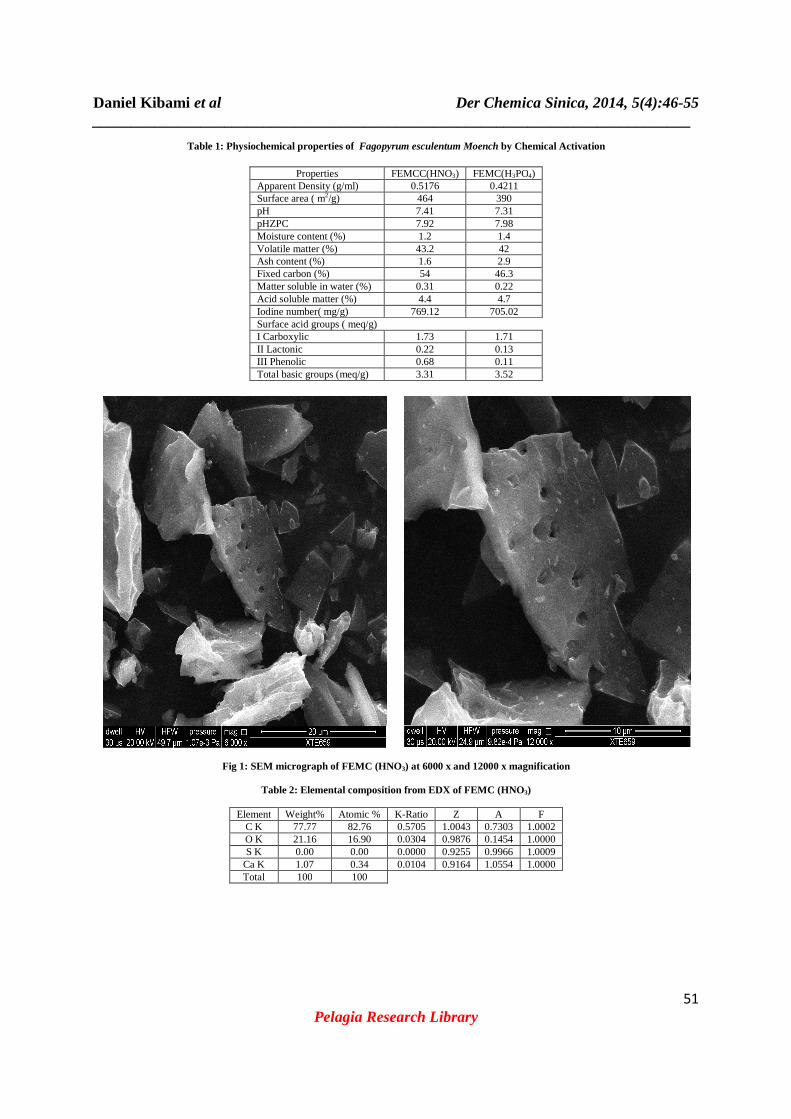
The results of physico- chemical parameters of the prepared activated carbons are presented in Table.1 The pH values for FEMC (HNO3) and FEMC (H3PO4) are 7.41 and 7.31 respectively, which are in optimum neutral medium range. The observed apparent densities of FEMC (HNO3) and FEMC (H3PO4) are 0.5176 and 0.4211 g / ml respectively. If the density of activated carbon is high then it will provide greater volume activity and hence better quality of activated carbon [32, 33]. Among the two samples, the densities of FEMC (HNO3) are higher than FEMC (H3PO4). The results shows both the carbons selected for the study have higher apparent densities. The BET specific surface area of the resulting activated carbons varied in the range 464-390 m2/g. FEMC (HNO3) sample shows high surface area of 464 m2/g , as compared to other activated carbons under study. This is expected since heat treatment eliminates some oxygen containing functional groups that are not stable at high temperature. It can be concluded that the surface area of the resulting activated carbons can be designed by varying the amount of the activation agents. The iodine number is a relative indicator of porosity in an activated carbon [34]. The results for iodine number shows a higher value from HNO3 activation in comparison to H3PO4 activation which may due to higher degree of activation which enables more adsorption of iodine molecule on the surface of the adsorbent [34].Surface functional group determined by Boehm titration method clearly indicates that the total basic groups are slightly greater than the total acid groups. The basicity may be due to oxygen functional group which characterizes the amount of surface basic group’s that are present in the activated carbon [20]. The pH at zero point charge is above 7.0 for both the samples. The results in Table 1 show that pH < pH zpc this indicates the surface is positively charged which arises from the basic sites that combine with protons from the medium. The moisture content in both the samples is less, which indicates that the adsorption of moisture by the samples is also less. Among the carbon samples FEMC (HNO3) has the least moisture content of 1.2%. Because of its extremely high surface area and adsorption capacity, activated carbon is highly amenable to adsorbing various volatile matters that eventually block the matter determination. The volatile matter content results of the samples presented in the table indicates that volatile matter content of FEMC (HNO3) is least which is best suited for industrial purpose. The results also indicate that these carbons contain more volatile materials. While preparing the samples, care must be taken for eliminating the impure materials from the carbons. A good activated carbon must have low ash content [1,3]. A small increase in ash content causes a decrease in adsorptive properties of activated carbon. As carbonization temperature increases ash contents of the samples increase. Ash content can lead to increase hydrophilicity and can have catalytic effects, causing restructuring process during regeneration of used activated carbon[2,5].The results in the Table 1 indicate that ash content in all the samples is less, which suggests that the raw material used can be a good source for activated carbon. The fixed carbon of two different activated carbons activated from HNO3 and H3PO4 presented in the table indicates that the percentage of fixed carbon is higher in the carbon activated from HNO3 i.e. FEMC (HNO3) thus, it may be suggested that activation by HNO3 seems to gives a better activated carbon product. The micrographs from SEM analysis of the activated carbons showed a heterogeneous and irregular texture with an eroded surface. It is evident that there are larger numbers of pores present in the activated carbon produced using Nitric acid (HNO3) activation than the activated carbon obtained from phosphoric acid (H3PO4). This supports the results of iodine number of HNO3 activated carbon being more than the other chemically activated samples. EDX show that the carbon samples primarily consist of carbon and oxygen at varied at proportions. The carbon and oxygen content is higher in FEMC (HNO3) and less in FEMC (H3PO4). The presence of calcium and sulphur was also detected in the samples with a high ca content of 20.69% in FEMC (H3PO4).EDX analysis of the samples practically does not show the presence of Nitrogen; neither does it show Phosphorus which could explain the rather good adsorbent properties observed particularly for this activated carbon.
Daniel Kibami et al Der Chemica Sinica, 2014, 5(4):46-55 _____________________________________________________________________________
51 Pelagia Research Library
Table 1: Physiochemical properties of Fagopyrum esculentum Moench by Chemical Activation
Properties FEMCC(HNO3) FEMC(H3PO4) Apparent Density (g/ml) 0.5176 0.4211 Surface area ( m2/g) 464 390 pH 7.41 7.31 pHZPC 7.92 7.98 Moisture content (%) 1.2 1.4 Volatile matter (%) 43.2 42 Ash content (%) 1.6 2.9 Fixed carbon (%) 54 46.3 Matter soluble in water (%) 0.31 0.22 Acid soluble matter (%) 4.4 4.7 Iodine number( mg/g) 769.12 705.02 Surface acid groups ( meq/g) I Carboxylic 1.73 1.71 II Lactonic 0.22 0.13 III Phenolic 0.68 0.11 Total basic groups (meq/g) 3.31 3.52
Fig 1: SEM micrograph of FEMC (HNO3) at 6000 x and 12000 x magnification
Table 2: Elemental composition from EDX of FEMC (HNO3)
Element Weight% Atomic % K-Ratio Z A F C K 77.77 82.76 0.5705 1.0043 0.7303 1.0002 O K 21.16 16.90 0.0304 0.9876 0.1454 1.0000 S K 0.00 0.00 0.0000 0.9255 0.9966 1.0009
Ca K 1.07 0.34 0.0104 0.9164 1.0554 1.0000 Total 100 100

Daniel Kibami et al Der Chemica Sinica, 2014, 5(4):46-55 _____________________________________________________________________________
52 Pelagia Research Library
Fig 2: SEM micrograph of FEMC (H3PO4) at 3000 x and 12000 x magnification
Fig 3: EDX spectra of FEMC (HNO3)
Table 3: Elemental composition from EDX of FEMC (H3PO4)
Element Weight % Atomic % K-Ratio Z A F
C K 63.16 77.60 0.3811 1.0187 0.5922 1.0002 O K 15.90 14.67 0.0183 1.0017 0.1152 1.0000 S K 0.25 0.11 0.0023 0.9419 0.9623 1.0150 Ca K 20.69 7.62 0.2009 0.9307 1.0430 1.0000 Total 100 100
Daniel Kibami et al Der Chemica Sinica, 2014, 5(4):46-55 _____________________________________________________________________________
53 Pelagia Research Library
Fig 4: EDX spectra of FEMC (H3PO4)
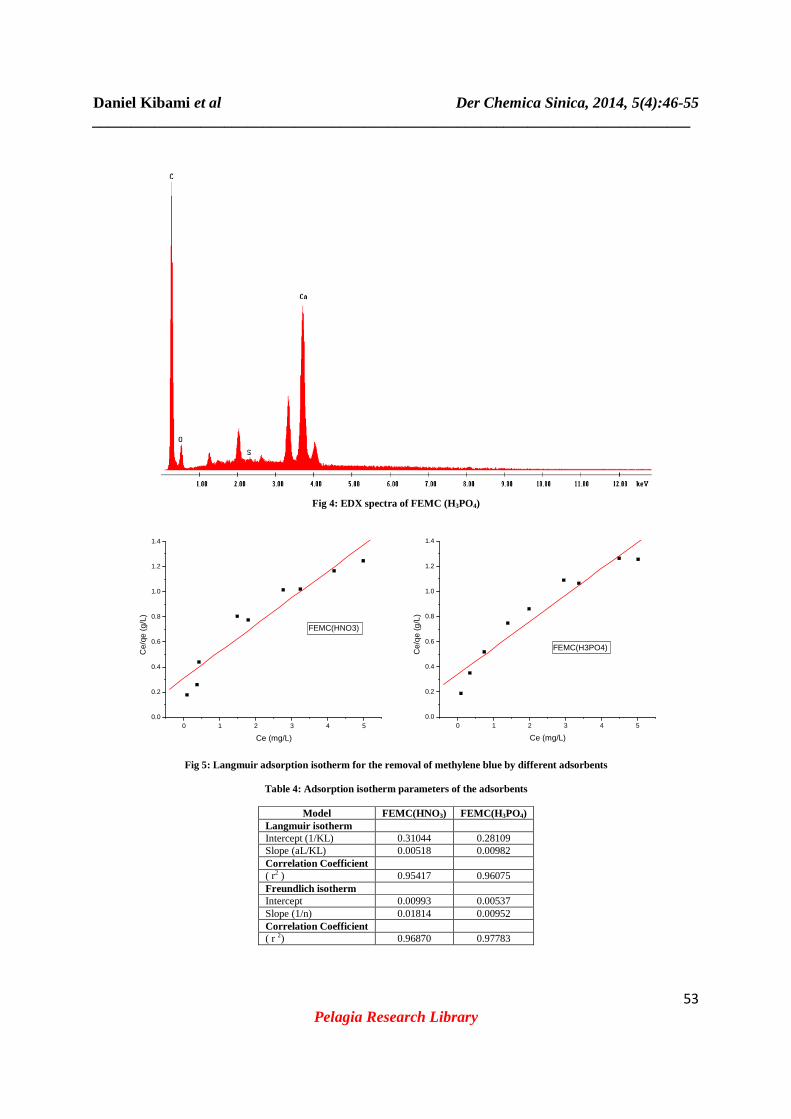
Fig 5: Langmuir adsorption isotherm for the removal of methylene blue by different adsorbents
Table 4: Adsorption isotherm parameters of the adsorbents
Model FEMC(HNO 3) FEMC(H 3PO4)
Langmuir isotherm Intercept (1/KL) 0.31044 0.28109 Slope (aL/KL) 0.00518 0.00982 Correlation Coefficient ( r2 ) 0.95417 0.96075 Freundlich isotherm Intercept 0.00993 0.00537 Slope (1/n) 0.01814 0.00952 Correlation Coefficient ( r 2) 0.96870 0.97783
0 1 2 3 4 50.0
0.2
0.4
0.6
0.8
1.0
1.2
1.4
Ce/
qe (
g/L)
Ce (mg/L)
FEMC(HNO3)
0 1 2 3 4 50.0
0.2
0.4
0.6
0.8
1.0
1.2
1.4
Ce/
qe (
g/L)
Ce (mg/L)
FEMC(H3PO4)

Daniel Kibami et al Der Chemica Sinica, 2014, 5(4):46-55 _____________________________________________________________________________
54 Pelagia Research Library
Fig 6: Frendulich adsorption isotherm for the removal of methylene blue by different adsorbents
CONCLUSION
Activated carbon was prepared from stem and leaves of Fagopyrum esculentum Moench (FEMC) by chemical activation in phosphoric acid and nitric acid at different activating conditions. The quality of the carbon is dependent on the preparation condition. Different parameters like pH,apparent density, iodine number, methylene blue adsorption, proximate analysis, pHpzc, surface functional groups and surface characterization by BET,SEM and EDX have been determined to find the quality of the activated carbon between the two activated carbons understudy. Among the adsorbents, FEMC (HNO3) has the better characters due to its properties like high iodine number, high fixed carbon value which contributes to the increase in the adsorption ability of FEMC (HNO3) adsorbents. The statement is well supported by the SEM/EDX data’s where the SEM micrographs suggests FEMC (HNO3) had greater number of pores than other adsorbents under study. EDX studies further strengthen the fact that FEMC (HNO3) is the better activated carbon produced with the higher carbon content and the less oxygen content. These activated carbons are being used for the removal of organic dyes like methylene blue from aqueous phase as adsorption. Acknowledgements The authors acknowledge the faculty and staff of Nagaland University Lumami, for providing necessary laboratory facilities for analyzing several samples. The authors wish to thank Nungleppam monoranjan department of physics, Manipur University for providing SEM images and EDX datas.
REFERENCES
[1] Bansal R.C. and Goyal M., Activated Carbon Adsorption, Boca Raton, FL CRC Press, USA, 2005, pp 1-11. [2] Harry Marsh., and Franciso Rodriguez Reinoso., Activated Carbon, Elsevier Science & Technology Books, 2006, pp 322-330. [3] Cheremisinoff and Ellerbusch F., Carbon Adsorption Handbook, Michigan, Ann Arbor Science, 1978, pp 5-19. [4] Berl, E., Formation and Properties of Activated Carbon, 1st ed. Royal Society of Chemistry, United State of America, 1938. [5] Bandosz Teresa J., Activated carbon surfaces in environmental remediation, volume-7 interface science and technology (Elsevier), the city college of New York ,USA, 2006, pp 16-34. [6] Radhika M, and Palanivelu K., J. Hazard. Mater, 2006, 138 , 116–124. [7] Onal Y., Akmil-Basar C., Sarıcı-Ozdemir C., and Erdogan S., J. Hazard. Mater, 2007, 142,138–143. [8] Wang S.L., Tzou Y.M., Lu Y.H., and Sheng G., J. Hazard. Mater, 2007,147,313–318. [9] Hameed B.H., Din A.T.M., and Ahmad A.L., J. Hazard. Mater, 2007, 141,819–825. [10] Hameed B.H., Ahmad A.L., and Latiff K.N.A., Dyes Pigments, 2007,75,143–149. [11] Legrouri K., Khouya E., Ezzine M., Hannache H., Denoyel R., Pallier R., and Naslain R., J. Hazard. Mater, 2005, 118 , 259–263. [12] Prakash Kumar B.G., Shivakamy K., Lima Rose Miranda, and Velan M., J. Hazard. Mater. 2006, 136 , 922– 929.
-1.2 -1.0 -0.8 -0.6 -0.4 -0.2 0.0 0.2 0.4 0.6 0.8-0.4
-0.2
0.0
0.2
0.4
0.6
Log
qe (m
g/L)
Log Ce(mg/L)
FEMC(HNO3)
-1.2 -1.0 -0.8 -0.6 -0.4 -0.2 0.0 0.2 0.4 0.6 0.8
0.2
0.4
0.6
0.8
1.0
1.2
Log
qe (
mg/
L)
Log Ce (mg/L)
FEMC (H3PO4)

Daniel Kibami et al Der Chemica Sinica, 2014, 5(4):46-55 _____________________________________________________________________________
55 Pelagia Research Library
[13] Tan I.A.W., Hameed B.H., and Ahmad A.L., Chem. Eng. J, 2007, 127,111–119. [14] Basar C.A., J. Hazard. Mater, 2006,135, 232–241. [15] Tan I.A.W., Hameed B.H., and Ahmad A.L., Chem. Eng. J, 2008, 137: 462–470. [16] Annual Book of ASTM Standard, Standard test for pH of Activated Carbon, ASTM D 3838-05, Philadelphia PA, United State of America, 2011. [17] Annual Book of ASTM Standards, Standard Test Method for Apparent Density of Activated Carbon ,ASTM D 2854-96, Philadelphia PA, United State of America, 1999. [18] Annual Book of ASTM Standards, Standard Test Method for Determination of Iodine Number of Activated Carbon , ASTM D4607 – 94, Philadelphia PA, United State of America 2006. [19] Boehm H.P., Carbon, 1995, 32, 5, 759-769. [20] Boehm H. P., Carbon, 2002, 40, 2,145-149. [21] Kosmulski M., J.Colloid Interface Sci, 2002, 253, 77-87. [22] Kosmulski M., J. Colloid and Interface Sci, 2009, 337, 439–448. [23] Annual Book of ASTM Standards, Standard Test Method for Moisture in Activated Carbon , ASTM D2867-95, 709-711, Philadelphia PA, United State of America, 2004. [24] Annual Book of ASTM Standards, Standard Test Method for Volatile Matter Content of Activated Carbon Samples, ASTM D5832-95, Philadelphia PA. United State of America , 2003. [25] Annual Book of ASTM Standards, Standard Test Method for Total Ash Content of Activated Carbon, ASTM D2866-94, Philadelphia PA, United State of America, 1999. [26] Allwar et al., Journal of Physical Science, 2008, 19(2), 93–104. [27] Gil A., Korili S. A., Cherkashinin G. Y., Journal of Colloid and Interface Science, 2003, 262, 603-607. [28] Ketcha J. M. et al., American Chemical Science Journal, 2012, 2(4), 136-160. [29] Nwabanne J.T. and Igbokwe P.K., Res. J. Chem. Sci, 2011, 1(6), 53-58. [30] Hamidi Abdul Aziz et al., Res. J. Chem. Sci, 2011, 1(6), 1-7. [31] Theivarasu Chinniagounder, Mylsamy Shanker and Sivakumar Nageswaram, Res.J.Chem.Sci, 2011, 1 (7), 38-45. [32] Sing K.S.W., Advances in Colloid and Interface Science, 1998, 76-77, 3-11. [33] Rozada, F., Otero, M. and Garcia, I., J. Hazard. Mater, 2005, 124(1-3), 181-191. [34] Somasekhara Rao K., Prasad N.V.V.S., Ram Babu C., Kishore M., Ravi M., and Krishna Vani K., Chem. Environ. Res, 2005,14 (1&2), 129-135.