pefc global statistics
TRANSCRIPT

www.pefc.org
Data: September 2020Data: September 2020
PEFC Global StatisticsPEFC Global Statistics

Data: September 2020
Members, Endorsed Systems, Distribution of Certificates
North America168 million ha52% TCA415 CoC
Europe117 million ha36% TCA9,895 CoC
Central & South America9.9 million ha3% TCA148 CoC
Africa0.6 million ha25 CoC
Asia14.6 million ha5% TCA1,536 CoC
Oceania11.9 million ha4% TCA225 CoC* ha ‐ hectares
CoC ‐ Chain of Custody certificatesTCA ‐ % of total PEFC certified area

Data: September 2020
International Stakeholder Members
3
• APP Timber• Arauco• Asia Pacific Resources International Holdings Ltd. (APRIL)
• Association Technique Internationale des Bois Tropicaux (ATIBT)
• Bioenergy Europe• Building and Wood Worker's International (BWI)
• Confederation of European Forest Owners (CEPF)
• Confederation of European Paper Industries (CEPI)
• Connecting Natural Values and People (CNVP)• Double A• European Confederation of Agricultural, Rural and Forestry Contractors (CEETTAR)
• European Panel Federation (EPF)• European Pulp Industry Sector Association AISBL (EPIS)
• European Timber Trade Federation (ETTF)• European Tissue Symposium (ETS)• International Council of Forest and Paper Associations (ICFPA)
• International Family Forestry Alliance (IFFA)• International Paper• Metsä Group• Mondi• Olam International• Purinusa Ekapersada (APP)• RECOFTC• Sappi• Smurfit Kappa• Stora Enso• Suzano Pulp and Paper• Union of Silviculturists of Southern Europe (USSE)
• WestRock Company• Weyerhaeuser Company

www.pefc.org
CERTIFIED FOREST AREA

Data: September 2020
Certified forest area by country
5
Country Certified area (ha)
Argentina 301.852
Australia 11.247.741
Austria 3.253.448
Belarus 8.777.949
Belgium 235.845
Brazil 4.586.036
Canada (CSA) 12.948.094
Canada (SFI) 121.305.248
Chile 1.915.479
China 2.033.015
Czech Republic 1.781.428
Denmark 292.956
Estonia 1.296.002
Finland 18.270.234
France 5.673.554
French Guiana 2.425.034
Gabon 596.822
Germany 7.762.235
India 450.408
Indonesia 3.993.187
Ireland 442.951
Italy 865.944
Japan 2.158.197
Korea, Republic of 706.751
Latvia 1.745.162
Luxembourg 36.411
Malaysia 5.244.641
Netherlands 3.239
New Zealand 621.236
Norway 7.380.750
Poland 7.155.637
Portugal 295.514
Russia 30.762.932
Slovak Republic 1.224.530
Slovenia 292.200
Spain 2.334.518
Sweden 15.847.125
Switzerland 214.522
United Kingdom 1.533.412
USA (ATFS) 6.903.597
USA (SFI) 26.607.617
Uruguay 663.604
Total 322.187.056

Data: September 2020
Certified forest area by region
6
Europe Certified area (ha)Austria 3.253.448 Netherlands 3.239 Belarus 8.777.949 Norway 7.380.750 Belgium 235.845 Poland 7.155.637 Czech Republic 1.781.428 Portugal 295.514 Denmark 292.956 Russia 30.762.932 Estonia 1.296.002 Slovak Republic 1.224.530 Finland 18.270.234 Slovenia 292.200 France 5.673.554 Spain 2.334.518 Germany 7.762.235 Sweden 15.847.125 Ireland 442.951 Switzerland 214.522 Italy 865.944 United Kingdom 1.533.412 Latvia 1.745.162 Total 117.478.497 Luxembourg 36.411
Asia Certified area (ha)China 2.033.015 India 450.408 Indonesia 3.993.187 Japan 2.158.197 Korea, Republic of 706.751 Malaysia 5.244.641 Total 14.586.199
Central & South America Certified area (ha)Argentina 301.852 Brazil 4.586.036 Chile 1.915.479 French Guiana 2.425.034 Uruguay 663.604 Total 9.892.005
North America Certified area (ha)Canada (CSA) 12.948.094 Canada (SFI) 121.305.248 USA (ATFS) 6.903.597 USA (SFI) 26.607.617 Total 167.764.556
Oceania Certified area (ha)Australia 11.247.741 New Zealand 621.236 Total 11.868.977
Africa Certified area (ha)Gabon 596.822Total 596.822

Data: September 2020
Certified forest area by region
7
Europe 36%
North America 52%
Central and South America 3% Asia 5%
Oceania 4%

Data: September 2020
Certified area growth
8
0
50
100
150
200
250
300
350
Certified
forest area (m
illion ha)
Year

Data: September 2020
Top ten – certified forest area
9
Country Certified area (ha)
Canada 134.253.342
United States 33.511.214
Russia 30.762.932
Finland 18.270.234
Sweden 15.847.125
Australia 11.247.741
Belarus 8.777.949
Germany 7.762.235
Norway 7.380.750
Poland 7.155.637

www.pefc.org
CHAIN OF CUSTODY

Data: September 2020
Chain of custody certificates by countryCountry
Argentina 15
Australia 199
Austria 535
Bahrain 1
Belarus 118
Belgium 279
Bosnia and Herzegovina 6
Brazil 33
Bulgaria 6
Canada 178
Chile 69
China 425
Colombia 2
Côte d’Ivoire 1
Croatia 12
Cyprus 2
Czech Republic 265
Denmark 105
Ecuador 1
Egypt 3
Country
Estonia 84
Finland 242
France 1971
Gabon 2
Germany 1718
Greece 7
Hungary 22
India 33
Indonesia 28
Ireland 38
Israel 5
Italy 764
Japan 531
Korea, Republic of 26
Latvia 89
Lebanon 1
Liechtenstein 1
Lithuania 12
Luxembourg 21
Malaysia 382
Country
Malta 1
Mauritius 2
Mexico 9
Monaco 1
Morocco 9
Myanmar 1
Netherlands 476
New Zealand 25
North Macedonia 1
Norway 78
Papua New Guinea 1
Peru 21
Philippines 5
Poland 221
Portugal 196
Romania 37
Russia 85
Seychelles 1
Singapore 23
Slovak Republic 123
Country
Slovenia 72
South Africa 6
Spain 1006
Sri Lanka 2
Sultanate of Oman 1
Sweden 208
Switzerland 63
Taiwan 6
Thailand 19
Tunisia 1
Turkey 41
Ukraine 4
United Arab Emirates 34
United Kingdom 985
Uruguay 7
USA (PEFC CoC) 228
Vietnam 13
Total: 12,244
11

Data: September 2020
Chain of custody certificates by region
12
EuropeAustria 535 Luxembourg 21Belarus 118 Malta 1Belgium 279 Monaco 1Bosnia & Herzegovina 6 Netherlands 476Bulgaria 6 North Macedonia 1Croatia 12 Norway 78Cyprus 2 Poland 221Czech Republic 265 Portugal 196Denmark 105 Romania 37Estonia 84 Russia 85Finland 242 Slovak Republic 123France 1971 Slovenia 72Germany 1718 Spain 1006Greece 7 Sweden 208Hungary 22 Switzerland 63Ireland 38 Turkey 41Italy 764 Ukraine 4Latvia 89 United Kingdom 985Liechtenstein 1 Total 9,895
Lithuania 12
AsiaBahrain 1China 425India 33Indonesia 28Israel 5Japan 531Korea, Republic of 26Lebanon 1Malaysia 382Myanmar 1Philippines 5Singapore 23Sri Lanka 2Sultanate of Oman 1Taiwan 6Thailand 19United Arab Emirates 34Vietnam 13Total 1,536
AfricaCôte d’Ivoire 1Egypt 3Gabon 2Mauritius 2Morocco 9Seychelles 1South Africa 6Tunisia 1Total 25
Central & South AmericaArgentina 15
Brazil 33
Chile 69
Colombia 2
Ecuador 1
Peru 21
Uruguay 7
Total 148
OceaniaAustralia 199
New Zealand 25
Papua New Guinea 1
Total 225
North America
Canada 178 USA 228
Mexico 9 Total 415

Data: September 2020
Chain of custody by region
13
Europe81%
North America3%
Central and South America
1%
Asia13%
Oceania2%

Data: September 2020
Chain of custody growth
14
0
2000
4000
6000
8000
10000
12000
14000N
o. o
f Cha
in o
f Cus
tody
cer
tific
ates
Year
Data: September 2020
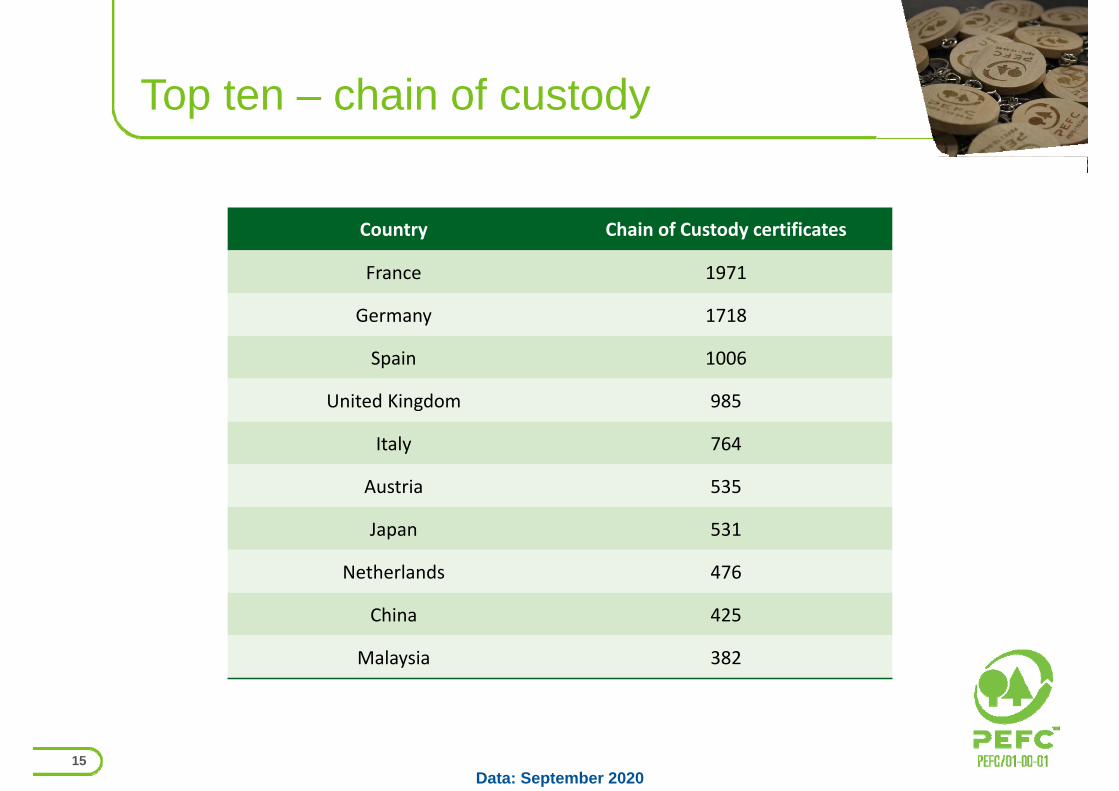
Top ten – chain of custody
15
Country Chain of Custody certificates
France 1971
Germany 1718
Spain 1006
United Kingdom 985
Italy 764
Austria 535
Japan 531
Netherlands 476
China 425
Malaysia 382

www.pefc.org
Need more information?
PEFC InternationalICC Building CRoute de Pré‐Bois 201215 Geneva 15SwitzerlandTel. +41 22 799 [email protected]