pedological characteristics and implication on soil
TRANSCRIPT

Pedological characteristics and implication on soil fertility of selected soils of Mbeya Region, Tanzania
The 3rd RUFORUM Biennial Conference, 24th – 28th September 2012
1Nyambilila Amuri, 1Lydia Mhoro, 1Juvenal A. Munishi, 1Balthazar M. Msanya, 1Ernest Semu and 2Zacharia Malley
1Department of Soil Science, Sokoine University of Agriculture, P.O. Box 3008, Morogoro, Tanzania
2Uyole Agricultural Research Institute, P. O. Box 400, Mbeya, Tanzania
Background Understanding the soil origin and its fertility in a given climatic conditions is important for efficient and sustainable utilization of soils. The composition of parent material determines the mineral nutrient content (Nube and Voortman, 2006), and sorption of nutrients, other chemicals and soil organic matter. A recent study in China demonstrated that available Fe and Zn in Xichang city soils differed depending on the nature of the parent rock (Zhang et al., 2012). Time is also essential in determining the stage of weathering, and hence soil properties. The soils of the surveyed areas are derived from volcanic tephra deposits of which are reported to be from relatively old (Upper Miocene to Lower Pleistocene Kitulo and Ngozi volcanoes) to most recent eruptions (Middle Pleistocene to Holocene Rungwe and Kyejo Volcano) (Fontijn et al., 2010). Information on the differences in chemical and other characteristics of the soils derived from these chronologically variable deposits of the area is limited. Mbeya region is among the four regions of Southern Highlands of Tanzania with high agricultural production, supplying major staple food in the country. However, crop yields are still low despite use of NPK fertilizers, contributing to food insecurity in Tanzania. Copper and Zn deficiencies were reported in this area’s volcanic soils about three decades ago, which was associated with nutrient mining (Kamasho, 1980). Yet, to date there is no follow-up studies on the status of these micronutrients in soils. Therefore, there is a need to determine the properties of soils of Mbeya region in relation to their origin and genesis. Mineral malnutrition is also wide spread and it is estimated that about 66% of world population is Fe deficient, over 30% is Zn deficient, 30% is iodine deficient and 15% is selenium deficient (White and Broadley, 2009). In Tanzania about 65% of children under 5 years of age are iron deficient (Fortifying African’s Future, 2009), 58.2% of pregnant women are anemic and 23% of the population are at risk of Zn deficiency (TFNC, 2009). These nutritional health problems can be attributed to low soil mineral content and/or availability to crops (Welch and Graham, 2002). Adequate levels of essential minerals in food crops to satisfy human health requirement is referred to as crop nutritive quality. One way to curb mineral malnutrition is fortification of some staple food with these essential minerals. However, food fortification cannot be expected to reach all populations deficient in essential micronutrients, especially in developing countries, and have challenge of low bioavailability (Hurrell, 1997; Mehasho, 2006). Therefore, there is a need to investigate, systematically, the relationship between soil nutrient contents (both macro- and micro-nutrients) and crop quality as might be related to the potential for agronomic biofortification to improve human nutrition and health.
This study was therefore conducted as a contribution to efforts by national and international programs and strategies to attain not only high yields but also nutritional health for poverty alleviation. Therefore, the objective of this study was to determine and assess the pedological
2
characteristics of soils and their influence on soil fertility and crop quality in selected physiographic units of Mbeya region. Specifically, i) to determine the morphological and physico-chemical characteristics of the soils ii) to determine the mineralogical composition of the soils iii) to determine the extent of weathering, and iv) to determine the implication of soil characteristics on nutrient availability, agricultural productivity and crop nutritive quality.
Study description
Study Site Description: The study was conducted in three districts of Mbeya region, covering a southward transect from Mbeya town to Lake Nyasa. The study area is located between longitudes 330 38’ and 330 53’ E and between latitudes 80 50’ and 90 33’ S covering Mbeya rural, Rungwe, and Kyela districts which represent different physiographic units in the area. The location of the study sites and their characteristic land form and climate are shown in Table 1. Soil Profile Description Excavated profile (to depth of 2 m or to a lithic or paralithic contact) representing the dominant soils of each sites selected (Table 1) were described based on the FAO guidelines for soil description (FAO, 2006). Soil color was determined by using Munsell Color Chart (Munsell Color Co, 1992). Each site profile was located by international coordinates using Global Positioning System (GPS) (model OREGON 400t). Soil and Grain Sampling and Sample Preparation Soil samples were taken from each horizon of each profile pit for laboratory physical and chemical analysis for pedological characterization. Composite surface soil samples (0 to 20-cm depth) were also taken in each site for soil fertility evaluation. After planting, surface (0 to 15-cm depth) soils from farmers’ fields were sampled around selected and tagged plants in four replicates. Crop grains (maize, groundnuts and rice) samples were collected from the tagged plants at crop maturity. Soil samples were air dried and ground to pass through 2-mm sieve and grain samples were air dried and oven dried at 60 oC and ground using plant sample grinder for chemical analysis.
Routine Soil Analyses Soil physical and chemical analyses were done using standard analytical methods. Particle size analysis was done by the hydrometer method after dispersion with 5% sodium hexametaphosphate while water dispersible silt and clay contents were determined by both pipette and hydrometer methods (NSS, 1990). Soil pH was determined potentiometrically in water and 1 N KCl at 1:2.5 soil:water/KCl ratio (McLean, 1986). Delta pH to characterize charge was obtained by the equation DeltapH = pH (KCl) – pH (H2O). Cation exchange capacity (CEC) and exchangeable bases were determined by neutral 1M NH4OAc (ammonium acetate), and CEC was determined by Kjeldahl distillation of the adsorbed NH4
+. Exchangeable bases displaced by 1M KCl (Chapman, 1965) were determined using atomic absorption spectrophotometer (Ca, Mg) and flame photometer (K and Na). Organic carbon was determined by Walkey and Black wet oxidation method of Nelson and Sommers (1982). Total N was determined using micro-Kjeldahl digestion-distillation method as described by Bremner and Mulvaney (1982). Extractable P was determined by Bray 1 method using 0.03M NH4F and 0.025M HCl extraction solution (Bray and Kurtz, 1945) and molybdenum blue method (Murphy and Riley, 1962). The extractable P was determined by a spectrophotometer at the wavelength of 884 nm. Extractable micronutrients (Zn, Cu, and Fe) were extracted by 0.005 M DTPA (diethylenetriamine pentaacetic acid), 0.01M CaCl2.2H2O and 0.1M TEA (triethanolamine) adjusted to pH 7.3 (Lindsay and Norvel, 1978) and determined by atomic absorption spectrophotometer.

3
Table 1: Salient characteristics of the studied sites
Site/village name
Profile District Coordinates Altitude
m (a. s. l.)
Rainfall mm/year
Physiography SMR
Makwenje MKW Mbeya Rural
E 330 38' 37''
S 080 50' 43''
1514 650-2700 Plateau/plain Ustic
Ifiga IFIG Mbeya Rural
E 330 33' 58''
S 080 55' 44''
1882 650-2700 Foot slope Udic
Mkuyuni MKY Mbeya Rural
E 330 41' 21''
S 080 54' 55''
1839 650-2700 Upper slope of the ridge
Udic
Mwanzazi MWZ Mbeya Rural
E 090 0' 26''
S 330 39' 49''
2357 650-2700 Crest of the ridge
Udic
Ndembela NDE Rungwe E330 36' 54''
S 090 16' 7''
1371 650-2700 Upper slope of the ridge
Udic
Tenende KYE Kyela E 330 53' 13''
S 090 33' 50''
493 1000-2400 Alluvial Plain Aquic
SMR: soil moisture regime The presence and amount of active Al and Fe in each horizon samples were determined using NaF pH in a 1:50 soil:NaF ratio and pH was measured potentiometrically after 2 min (NSS, 1990). Aluminium (for MWZ 04 profile only), Fe, and Mn from amorphous minerals and organic/humic-bound were extracted by 0.2 M ammonium oxalate at pH 3 (Alo, Feo, Mno) (McKeague and Day, 1966) and 1 N Sodium-pyrophosphate pH 10 (Fep, Mnp) (McKeague, 1967), respectively. The crystalline and non-crystalline Fe and Mn were extracted by single extraction using 0.68 M sodium dithionite-citrate (Fed and Mnd) (Soil Conservation Service USDA, 1972). The extracted Al, Fe, and Mn were determined by atomic adsorption spectrophotometer and were converted to percentage oxides by multiplying by a factor of 1.43, 1.58 and 1.89 respectively (Pansu and Gautheyrou, 2006). Phosphate-retention capacity was determined according to the method of Blakemore et al. (1981). Ground plant samples (0.5 g) were digested using H2O2-HClO4
-HF in tubes, and heated in a block digester at 200 oC for 2 hours. The digest were cooled and made up to 50-ml volume plants extract used to determine nutrients contents as for soils. Soil Classification Field and laboratory data were used to classify soils to tier-2 of the FAO World Reference Base (FAO-WRB, 2006).

4
Research Application
Soil Morphology All the studied soils are very deep with profile thickness of at least 200 m, and are well drained, except Tenende plain soil (profile KYE) with water table around 170 cm. Some profiles have buried horizons such as 2BC (IFIG), 2Bwb, and 3Bwb (MWZ). The soils differed significantly in soil color, structure, consistence and bulk densities. The moist soil color of Ap horizons of all soils ranges from very dark brown (7.5YR2.5/6 to 10YR2/3) for MKW, MKY and NDE soils to black (10YR2/1 to 10YR2/2) for IFIG. Topsoil of MWZ 04 is dark brown (10YR3/3) while that of KYE is black (2.5YR2.5/1). Down the profiles, there is decrease in yellow hue (becoming redder) and darkness, but increase in color intensity (chroma) for MKW, IFIG and MKY profiles. The profile NDE also showed similar soil color trend, but the more yellow hue did not change down the profile, and there was a yellowish weathered pumice layer (5cm thick at 78-cm depth). Profile MWZ and KYE Ap horizons were darker than all the C horizons, which also had high color intensity (more yellow). In KYE 01 the C3 horizon becomes gray where there is water table, due to reduced Fe and Mn. The decrease in darkness and increase in color intensity down the profile indicate the decrease in SOM and stable goethite (darkness agent) and increase in coloring agents (free iron oxides and hydroxides). The topsoil structures of all the soils range from weak, moderate, to strong structure with friable moist consistence. Moderate to strong structure and weak development of fine or granular structure are common morphological features of volcanic soils (Ugolini and Zasoski, 1979; Gama-Castro et al., 2000).
The presence of buried horizons and pumice layers in some of the profiles is an indication of different layers of volcanic ashes and pumiceous materials, a unique morphological characteristic reflecting cyclic deposition of volcanic ejecta. Unlike other volcanic soils, profiles MKW, MKY and NDE have considerably marked B horizon, with some extent of illuviation indicating that these soils are more developed (more weathered) than IFIG and MWZ. Profile MWZ shows less weathered volcanic materials mainly pumice, probably due to age (younger) at which the eruption of the materials was deposited and high silica, low aluminum and iron contents. Lack of clear B horizon in KYE is due to alluvial deposits and paddling of the Ap horizon. The studied soils have low bulk densities of 0.7 g/cm3 for MWZ, 0.91 g/cm3 for KYE, and 0.91 g/cm3 NDE, 1.13 g/cm3 IFIG, 1.16 g/cm3 for MKY and 1.26 g/cm3 MKW (Munishi, 2012). Thus, the soils of MWZ, KYE and NDE have bulk densities common for most soils derived from tephra (i.e 0.1 to 0.9 g/cm3) (Ugolini and Zasoski, 1979; Gama-Castro et al., 2000). Chemical Properties The top soil pH (water) ranges from 4.0 to 6.6 (Table 2). The soil pH in water slightly increases with soil depth for all profiles except NDE, which showed a decrease in soil pH. The soil pH( KCl) values are lower than the soil pH (water) in all horizons of the studied profiles with delta pH range of -0.5 to -1.7, and the change becomes greater (i.e more negative) with increasing soil depth, expect in NDE 01 profile. All studied soils had delta pH of -0.5 or greater indicating the dominance of negatively charged exchange complex (Van Wambeke, 1991; Nanzyo et al., 1993; Fiantis et al., 2011). These results differ from those of Fiantis et al. (2011) who observed small delta pH of -0.09 on weathered volcanic ash of Mt Talang, Indonesia which was attributed to simultaneous increase in negative (≡SiO-) and positive (=AlOH2
+ and/or FeOH2+) charges of noncrystalline minerals in 1M KCl.
Active Al and Fe Presence of active Al-OH and Fe-OH groups in soil particles can be deduced using pH in NaF test, where the exchange of OH- by F- reaction tends to increase pH values (Fiantis et al., 2011). The NaF pH of >9.4 indicates presence of significant amounts of active Al and Fe (Fiantis et al., 2011), and

5
helps to predict the tendency of soil to retain P (Gama-Castro et al., 2000). The NaF pH of the soils studied ranges from 9.7 to 11.0 in the surface horizons and from 9.8 to 11.6 in the subsurface horizons (Table 2). These results indicate that all soils have considerable amount of active Al and Fe. Generally, the soil NaF pH slightly increase with increase in soil depth in all soil profiles except NDE 01 profile (Table 2), suggesting that these soils developed from old volcanic materials. This is because soils developed from volcanic ash are characterized by in situ accumulation of active Al and Fe, which increase as they weather (Nanzyo et al., 2002). Therefore, increase in NaF pH down the profile indicates that the volcanic ash from which these soils formed are weathered because it is estimated that the parent materials of these soils are of Mid Pleistocene (0.6 Ma) to late Miocene (8.6 to 5.4 Ma) eras (Fontijn et al., 2010). These results differed from those of Gama-Castro et al. (2000) who reported NaF pH > 9.5 in the Ap horizons but < or = 9.5 in the subsurface horizons (C) in two young volcanic soils developed on Holocene (0 to 0.0117 Ma) volcanogenic pumiceous alluvia of West Nayarit, Mexico. Therefore, all horizons of these soils contain active Al and Fe, of which active Al can be in the form of allophones, imogolites, Al-humus, while active Fe is mainly Ferrihydrite (Nanzyo et al., 2009). Amorphous Materials The ammonium oxalate extracts poorly crystalline Fe and Mn from their oxides (Feo and Mno) in soils (Schwertmann, 1973). The Feo of the studied soils ranges from 0.28% in KYE to 3.91% in MKY in the surface horizons, and from 0.31 in KYE to 4.36 in NDE (Table 2). On average, the Feo increases with depth in all the profiles except MKY (Table 3). Fiantis et al. (2011) reported an increase in Feo and Alo at the initial weathering stage of the volcanic ash from Mt. Talang volcanic ash of West Sumatra, suggesting that Fe and Al are relatively immobile, hence accumulates as the soil weathers. Therefore, the amorphous materials in the subsoil horizons are mainly Ferrihydrite, while in the topsoil is mostly Fe/Al-humus. The ammonium oxalate extractable Al and Fe were determined only for profile MWZ. This is because the profile showed typical and unique layers of volcanic ashes and pumiceous materials, a morphology reflecting the cyclic deposition of volcanic ejecta (Msanya et al., 2007). Profile MWZ had Alo contents of 2.24 and 3.64% in topsoil and subsoil respectively and have Alo + 0.5 Feo values of 2.61% and 4.19% in topsoil and subsoil respectively. The values (Alo + 0.5 Feo) for MWZ are > 2.0, which according to Soil Survey Staff (1999) indicate the presence of andic properties. The sodium pyrophosphate extractable Fe (Fep), Mn (Mnp) and Al (Alp) represent the organically bound Fe, Mn and Al of soils (McKeague, 1967). The Fep and Mnp values of the studied soils range from 0.09 to 0.52% and 0.01 to 0.06%, respectively, where all C horizons had low Fep and Mnp (Table 3). The trend corresponds with the distribution of soil organic matter. The values of Feo and Mno are greater than Fep and Mnp, suggesting that there are more mineral amorphous Fe and Mn than organic/humus Fe and Mn, which increase with soil depth. Dithionite-citrate extracts both crystalline and non-crystalline iron oxide minerals (McKeague et al., 1971), but partly dissolves allophane, goethite and hematite in a single extraction. The Fed ranges from 0.11 (KYE) to 0.51% (MWZ), while Mnd ranges from 0.14 (KYE) to 0.43 (MKW) (Table 3). The Fed and Mnd generally increase with soil depth except for the profiles KYE and MWZ for Fed and KYE for Mnd (Table 2). The Fed and Mnd values are lower than Feo and Mno values, suggesting dominance of amorphous than crystalline Fe and Mn minerals in all the studied soils.
6
Indices of Weathering
Iron oxide crystallinity index
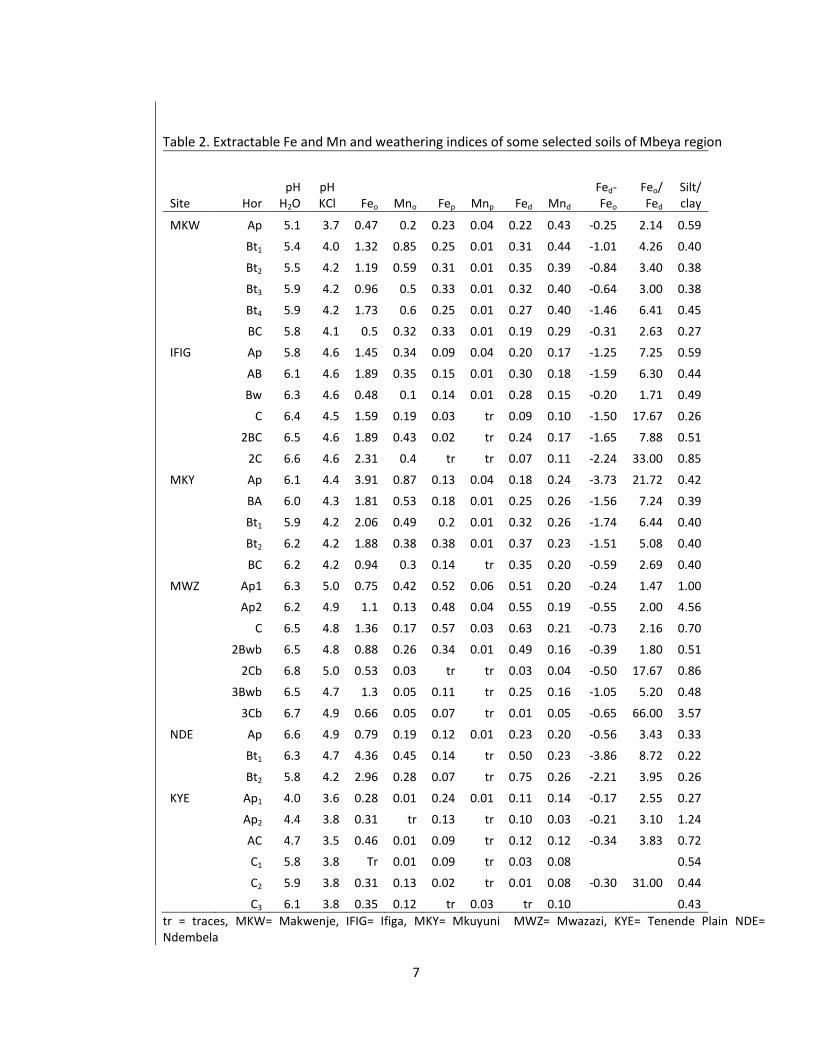
Sodium dithionite extractable iron (Fed) is used to determine the proportion of crystalline iron oxides while acidified ammonium oxalate extractable iron (Feo) is used to determine the proportion of non crystalline (amorphous) iron oxides (Sheldrick, 1984). Difference in amounts of dithionite extractable iron (Fed) and oxalate extractable iron (Feo) indicates the distribution of amorphous and crystalline forms of iron in the soils. In all the studied soils, the values of Fed-Feo are negative (Table 2), indicating that Feo was higher than Fed. This indicates that amorphous iron oxides dominate in the studied soils. Since high amount of crystalline Fe is an indication of high degree of soil weathering (Jackson, 1965; Schulze, 1989), then none of the studied soils can be categorized as highly weathered.
Degree of Fe oxide crystallinity
Degree of crystallinity is also used to determine the proportion of crystalline iron oxides (Fed) compared to non-crystalline oxides of iron (Feo). The Feo/Fed ratios become smaller with advanced crystallinity which reflects an advanced level of weathering or maturity of crystallinity of free iron oxides in a soil material (Blume and Schwertmann, 1969). Values of Feo/Fed of less than 0.1 indicate that crystalline iron oxides (commonly goethite and hematite) are dominant in the soil (Fitzpatrick and Schwertmann, 1982). In this study all the soils have large Feo/Fed ratios ranging between 1.71 and 5.08 (Table 2), indicating that the soils have less crystalline iron and therefore moderately to slightly weathered.
Silt/clay ratio
Silt/clay ratios in the topsoils range from 0.27 to 1.36 and in subsoils from 0.22 to 4.56, and the ratios decrease with depth in all profiles except profile MWZ (Table 2). According to van Wambeke (1962) and Barshad (1965) soils having silt/clay ratio of less than 0.2 are considered to be highly weathered. So the soils in the study areas are moderately to slightly weathered. Higher silt/clay ratio in the topsoil than subsoil can be explained by lessivage of clay down the profile resulting to lower proportion of clay in topsoils compared to the subsoils. The translocation of clay is also a good index of soil development (Zonn, 1986). The general trend of silt/clay ratios of the studied soil is as follows: MWZ 04> KYE 01> IFIG 02> MKW 01> MKY 03> NDE 01.
Soil Classification of the Studied Soil Profiles The TIER-1 category of the soils in the study areas are Haplic Cutanic Alisols (Profondic, Clayic) in Makwenje (MKW), Vitric Fluvic Cambisols (Humic, Eutric) in Ifiga (IFIG), Umbric Cutanic Alisols (Hyperdystric, Clayic) in Mkuyuni (MKY), Melanic Silandic Andosols (Dystric, Siltic) in Mwazazi (MWZ), Vitric Cutanic Alisols (Profondic, Clayic) in Ndembela (NDE) and Vitric Endogleyic Umbrisols (Humic, Clayic) in Tenende plain Kyela (KYE).
7
Table 2. Extractable Fe and Mn and weathering indices of some selected soils of Mbeya region
Site Hor pH
H2O pH KCl Feo Mno Fep Mnp Fed Mnd
Fed-Feo
Feo/ Fed
Silt/ clay
MKW Ap 5.1 3.7 0.47 0.2 0.23 0.04 0.22 0.43 -0.25 2.14 0.59
Bt1 5.4 4.0 1.32 0.85 0.25 0.01 0.31 0.44 -1.01 4.26 0.40
Bt2 5.5 4.2 1.19 0.59 0.31 0.01 0.35 0.39 -0.84 3.40 0.38
Bt3 5.9 4.2 0.96 0.5 0.33 0.01 0.32 0.40 -0.64 3.00 0.38
Bt4 5.9 4.2 1.73 0.6 0.25 0.01 0.27 0.40 -1.46 6.41 0.45
BC 5.8 4.1 0.5 0.32 0.33 0.01 0.19 0.29 -0.31 2.63 0.27
IFIG Ap 5.8 4.6 1.45 0.34 0.09 0.04 0.20 0.17 -1.25 7.25 0.59
AB 6.1 4.6 1.89 0.35 0.15 0.01 0.30 0.18 -1.59 6.30 0.44
Bw 6.3 4.6 0.48 0.1 0.14 0.01 0.28 0.15 -0.20 1.71 0.49
C 6.4 4.5 1.59 0.19 0.03 tr 0.09 0.10 -1.50 17.67 0.26
2BC 6.5 4.6 1.89 0.43 0.02 tr 0.24 0.17 -1.65 7.88 0.51
2C 6.6 4.6 2.31 0.4 tr tr 0.07 0.11 -2.24 33.00 0.85
MKY Ap 6.1 4.4 3.91 0.87 0.13 0.04 0.18 0.24 -3.73 21.72 0.42
BA 6.0 4.3 1.81 0.53 0.18 0.01 0.25 0.26 -1.56 7.24 0.39
Bt1 5.9 4.2 2.06 0.49 0.2 0.01 0.32 0.26 -1.74 6.44 0.40
Bt2 6.2 4.2 1.88 0.38 0.38 0.01 0.37 0.23 -1.51 5.08 0.40
BC 6.2 4.2 0.94 0.3 0.14 tr 0.35 0.20 -0.59 2.69 0.40
MWZ Ap1 6.3 5.0 0.75 0.42 0.52 0.06 0.51 0.20 -0.24 1.47 1.00
Ap2 6.2 4.9 1.1 0.13 0.48 0.04 0.55 0.19 -0.55 2.00 4.56
C 6.5 4.8 1.36 0.17 0.57 0.03 0.63 0.21 -0.73 2.16 0.70
2Bwb 6.5 4.8 0.88 0.26 0.34 0.01 0.49 0.16 -0.39 1.80 0.51
2Cb 6.8 5.0 0.53 0.03 tr tr 0.03 0.04 -0.50 17.67 0.86
3Bwb 6.5 4.7 1.3 0.05 0.11 tr 0.25 0.16 -1.05 5.20 0.48
3Cb 6.7 4.9 0.66 0.05 0.07 tr 0.01 0.05 -0.65 66.00 3.57
NDE Ap 6.6 4.9 0.79 0.19 0.12 0.01 0.23 0.20 -0.56 3.43 0.33
Bt1 6.3 4.7 4.36 0.45 0.14 tr 0.50 0.23 -3.86 8.72 0.22
Bt2 5.8 4.2 2.96 0.28 0.07 tr 0.75 0.26 -2.21 3.95 0.26
KYE Ap1 4.0 3.6 0.28 0.01 0.24 0.01 0.11 0.14 -0.17 2.55 0.27
Ap2 4.4 3.8 0.31 tr 0.13 tr 0.10 0.03 -0.21 3.10 1.24
AC 4.7 3.5 0.46 0.01 0.09 tr 0.12 0.12 -0.34 3.83 0.72
C1 5.8 3.8 Tr 0.01 0.09 tr 0.03 0.08
0.54
C2 5.9 3.8 0.31 0.13 0.02 tr 0.01 0.08 -0.30 31.00 0.44
C3 6.1 3.8 0.35 0.12 tr 0.03 tr 0.10
0.43
tr = traces, MKW= Makwenje, IFIG= Ifiga, MKY= Mkuyuni MWZ= Mwazazi, KYE= Tenende Plain NDE= Ndembela

8
Influence of Pedological Properties on Soil Fertility and Crop Quality Soil fertility status The physical and chemical properties of soils determine the content and availability of essential plant nutrients. The soil physical properties determined (soil texture and bulk density) are adequate for agricultural crop production. The soil pH in water of all studied soils is acidic ranging from 4.9 to 5.9 (Table 3), of which soils from KYE, MKW, MKY, and IFIG are categorized as strongly acidic (pH < 5.5) while those of MWZ and NDE are medium acidic (Landon, 1991). Lowest soil pH of KYE soil is due to exchangeable Al3+ > 1.0 cmolc/kg (Munishi, 2012). All soils that are strongly acidic require liming to improve crop growth and yield as well as response to fertilizers to minimize risks of low profit crop production. Soil organic C in these soils ranges from 0.1 to 4.4% (Table 3), rated as low (<1.25%) in MKW and KYE soil, medium (1.26 to 2.50) in IFIG and NDE soils, and very high (> 3.5) in MKY and MWZ soils (Landon, 1991). The CEC values of the soils range from 20.2 to 38.5 cmolc/kg (Table 3), and are rated as medium in MKW, but high (> 25 cmolc/kg) in all other studied soils. The medium to high CEC further shows that although these soils are dominated by noncrystalline minerals, the negative charges are dominant in the exchange complex. The CEC of these soils may be due to both dominance of negatively charged amorphous ≡SiO- and highly negatively charged humic materials. Therefore, both physical and most of the chemical properties of the soils studied are adequate for crop production, except for the strongly acidic soil, that needs liming to optimize crop production.
Table 3. Soil chemical properties and some nutrient contents of soils of study areas in Mbeya region
Site pH OC TN P Exchangeable cations and CEC
(cmol (+)/kg Extractable micronutrients (mg/kg)
H2O % % mg/kg K Ca Mg Na CEC Fe Cu Zn
MKW 5.1 1.2L 0.1L 10.2L 0.6H 1.0L 0.4M 0.1L 20.2M 35.22H 0.34L 1.17H
IFIG 5.5 2.5M 0.2M 8.5VL 1.2H 6.5H 0.9H 0.2L 29.4H 38.65H 0.44L 4.17H
MKY 5.1 4.4VH 0.2M 6.6VL 1.1H 3.4M 1.1H 0.1L 27.8H 25.91H 0.29L 1.41H
MWZ 5.7 3.4VH 0.3H 6.7VL 0.7H 4.3H 0.8H 0.2L 37.2H 27.53H 0.29L 2.97H
NDE 5.9 1.5M 0.2M 4.3VL 1.7H 2.3M 0.9H 0.1L 31.1H 18.32H 0.31L 0.93L
KYE 4.9 0.1L 0.2M 6.0VL 0.6H 0.9L 0.2L 0.3L 26.6H 33.22H 0.29L 0.74L
Note: TN = OC = organic carbon, total nitrogen, CEC = cation exchange capacity, the rating of the soil parameters were according to Landon (1991) and Tandon (1995). Where VL = very low, L = low, M = medium, H = high and VH = very high
Levels of Some Essential Nutrients in Soils
The level of essential plant nutrients in soils determines their availability and crop yields if physical and chemical properties affecting availability are not limiting. The total nitrogen (TN) of the studied soils ranges from 0.1 to 0.3% (Table 3), where all soils have medium TN level, except MWZ soil which had high and MKW which had low TN values (Landon, 1991). Total N estimates N in both organic and inorganic form, and since plants absorb N in form of NH4
+ or NO3- (inorganic) (Harvlin et al., 2005), all
low and medium TN soils will require additional N to ensure adequate growth and yield of crops. The available P values in the soil range from 4.3 to 10.2 mg/kg (Table 3), and are all rated as low (<15 mg/kg) (Landon, 1991). Low available P can be explained by the inherently low P containing minerals in these soils, as demonstrated by low <0.1% total P2O5 in these soils (Table 3). The P retention of the soils studied ranges from 35 to 85%, and increases with increase in NaF pH (Fig 1). Thus, presence of

9
active Al/Fe/Mn in all soils and exchangeable Al in KYE might have contributed to low available P observed. Therefore, P fertilization is inevitable for sustainable and profitable crop productivity in the study area. Exchangeable K levels range from 0.6 to 1.2 cmolc/kg (Table 4), which are adequate (> 0.4 cmolc/kg) for most crop. (Landon, 1991). High exchangeable K can also be explained by the K-rich volcanic ash from which these soils developed (Funtijn et al., 2010). However, the preliminary results showed that the K content in leaves of wheat, beans and rice grown in MKY, MKW, NDE and KYE, were below the critical limit (<1.5 to 3.0%) for these crops (Mhoro, 2012), indicating that most of the soil K is not available for plant uptake. Thus, K application to improve availability and replenish K removal will help to sustain high yields for long time. Exchangeable Ca and Mg range from 0.9 to 6.5 and 0.2 to 0.9 cmolc/kg, respectively. Soils of MKW and KYE had low Ca (<2.0 cmolc/kg), while only KYE soil had low Mg (< 0.2 cmolc/kg) (Landon, 1991). The rest of the soils had medium to high Ca and Mg levels. Low exchangeable Ca and Mg may be due to excessive leaching of these cations especially in the low pH soils of MKW and KYE. Therefore, all the soils are deficient in N and P, and have low K availability, hence require fertilization to supply and improve availability of these essential macronutrients. Although required in very small quantities, micronutrients are equally essential for adequate growth and yield of agricultural crops. This study revealed that available Fe is sufficient (> 10 mg/kg) according to Motsara and Roy (2008), while available Cu is deficient (>0.5 mg/kg) according to Tandon (1995) for crop production in all soils studied (Table 3). Available Zn is sufficient (> 1.0) in all soils, except in NDE and KYE soils (Table 3). These results show that all soils in the study area require Cu fertilization and soils in KYE and NDE require Zn fertilization, in addition to NPK for optimum crop production.
Figure 1. Relationship between NaF pH and P retention of some volcanic soils of Mbeya region

10
Soil Fertility and Crop Nutritive Quality The mineral nutritional quality of the crop depends on the nutrient content of the soil if the edible part is leaves and both soil nutrient content and partitioning of the element for other edible parts of the plants. The Zn and Cu contents of all soils in the present study were marginal for crop production, and Zn contents were below human and livestock dietary requirements of 56.0 mg/kg for Zn (Welch and Bouis, 2009) and Cu contents were below 10 mg/kg for Cu in all grain samples (Table 4).
Table 4. Micronutrient contents and correlation coefficients of the soils and crops grains from farmers’ fields in some areas of Mbeya region
Site Crop Zn (mg/kg) Cu (mg/kg)
Soil Grains r Soil Grains r
MKW Maize 2.54±0.32M 17.46±1.61L -0.976* 0.70±0.04M 9.93±0.19L 0.680ns
MKY Maize 2.82±0.15M 13.89±1.42L -0.435ns 0.13±0.04L 5.06±0.25L 0.252ns
NDE Groundnuts 2.86±0.5M 13.34±2.92L 0.063ns 0.24±0.06L 4.56±0.33L 0.852ns
KYE Rice 1.56±0.41M 12.35±2.23L -0.989* 0.02±0.003VL 5.43±0.77L 0.183ns
Note: r = correlation coefficient, * = Significant (P= 0.05), the rating of the soil parameters i.e. VL = very low, L = low and M =medium, were according to Motsara et al. (2008) and Havlin et al. (2005) for plant parameters, ns = not significant (P = 0.05)
Simple correlations analysis revealed that the soil DTPA-extractable Zn and grain Zn contents were significantly (P = 0.05) negatively correlated (r = -0.976*) and (r = -0.989*) for MKW and KYE, respectively (Table 4). The correlations of soil and plant Zn for NDE and Cu for all soils soil were not significant (Table 4). These results suggest the other factors such as the concentration of Zn in solution, ion speciation and the interaction of Zn with other macronutrient and/or micronutrient elements control the availability in the soil, and/or uptake, and/or partitioning of Zn to seeds (Cox and Kamprath, 1972). Copper contents of the soils in all locations are positively correlated with copper contents of the plants, though not significantly (P = 0.05) (Table 4). Therefore, Zn and Cu fertilization and improvement of their availability to plant, and ensuring nutrients balance is essential for improvement of mineral nutritive quality and yields of crops.
Conclusions The studied soils of Mbeya region are slightly to moderately weathered, and derived from basaltic and basaltic-andesitic volcanic materials rich in K and Na feldspars with adequate physical conditions for crop production. The exchange complex of these soils are dominated by amorphous, variable charged minerals with active Fe or Al and Mn, contributing to high CEC and high P retention. The soils are acidic with deficiencies of N, P, K, Cu and Zn in some locations. The crops produced in the area have Zn and Cu levels below the dietary requirements of human and livestock health. Therefore, soil fertility management to improve availability of all deficient nutrients are necessary for sustainable high yields and good crop mineral nutritive quality. In the light of the results obtained in this study, all the studied sites were rated as moderately suitable for maize, beans, wheat and potatoes except Tenende plain (KYE 01). Tenende plain (KYE 01) on the other hand was rated as moderately suitable for paddy rice and marginally suitable for the other crops.

11
Acknowledgements This work was funded by the Regional University Forum for Capacity Building in Agriculture
(RUFORUM) through Competitive Grant Award 2009-2011. Field technical assistance by Mr. J. Meliyo is acknowledged.
References Blakemore, L. C., Searle, P. L. and Daly, B. K. (1981). Methods for Chemical Analysis of Soils, New Zealand Soil Bureau Scientific Report 10A. Department of Scientific and Industrial Research, New Zealand
Blume, H. P. and Schwertmann, U. (1969). Genetic evaluation of profile distribution of Al, Fe and Mn oxides. Soil Sci. Soc. Am. Proc. 33: 438-444
Bray, R. H. and Kurtz, L. T. (1945). Determination of total, organic and available forms of phosphorus in soils. Soil Sci. 58: 39-45.
Bremner, J. M. and Mulvaney, C. S. (1982). Total nitrogen. In: Methods of Soil Analysis, Part 2, 2nd Edition, Agronomy Monograph no. 9. (Page, L. A., Miller, R. H. and Keeney, D. R. Eds.) American Society of Agronomy, Madison, Wisconsin. pp. 595-624.
Cox, F.R. and Kamprath, E.J. (1972). Micronutrient soil tests. In: Micronutrients in agriculture (Mortvedt J.J. Ed). Madison (WI). Soil Science Society of America. 289-317pp.
Fontijn, K. Delvaux, D., Ernst, G.G.J., Kervyn, M., Mbede, E., Jacobs, P. (2010). Tectonic control over active volcanism at a range of scales: Case of the Rungwe Volcanic Province, SW Tanzania; and hazard implications. Journal of African Earth Sciences 58: 764–777.
Fitzpatrick, R. W. and Schwertmann, U. (1982). Al substituted goethite - an indicator of pedogenic and other weathering environments in South Africa. Geoderma 27: 335-347
Fortifying Africa’s Future (2009). Available at: [http://www.fortaf.org/the_african_context.htm]. site visited on 12/1/2010.Gama-Castro et al., 2000
Havlin J.L., Beaton, J.D., Tisdale S.L. and Nelson, W.L. (2005). Soil Fertility and Fertilizers (7th Ed) Upper Saddle River, New Jersey. 515pp
Hurrel, R.F. (1997). Preventing iron deficiency through food fortification. Nutrition Review 55: 210-222.
Jackson, M. L. (1964). Chemical composition of soils. In: Chemistry of the soils 2nd edition. (Edited by Bear, F. E.). American Chemistry Society Monograph. Reinhold Publishing Corporation. New York, pp. 74-141.
Kamasho, J.A. (1980). Copper and zinc status of some volcanic ash soil in the Mbeya district. MSc Thesis, University of Dar Es Salaam, Tanzania.
Landon, J.L. (1991). Booker Tropical Soil Manual. A handbook for soil survey and agricultural land evaluation in the tropics and subtropics. Longman Group FE limited, Booker Tate Limited, CLondon, England. 474p.
Lindsay W.L. and Norvel, W.A. (1978). Development of a DTPA soil test for zinc, iron, manganese and
12
copper. Soil Science Society of America Journal 42:421-428.
Mashalla, S. (1988). The human impact on natural environment of Mbeya Highlands in Tanzania. Mountain Research and Development 8:283-288.
McLean, E. O. (1986). Soil pH and lime requirement. In: (Page, A. L., Miller, R. H. and Keeny, D. R. eds.) Methods of Soil Analysis, part 2, Chemical and Mineralogical Properties, 2nd Edition. American Society of Agronomy & Soil Science Society of America, Madison, Wisconsin. Agronomy Monograph 9: 199-223.
McKeague, J. A. (1967). An evaluation of 0.1 M pyrophosphate and pyrophosphate-dithionite in comparison with oxalate as extractants of the accumulation products in Podzols and some other soils. Ca. J. Soil Sci. 47: 95-99.
McKeague, J. A. and Day, J. H. (1966). Dithionite and oxalate- extractable Fe and Al as aids in differentiating various classes of soils. Can. J. Soil sci. 46:13-22.
Mckeague, J. A., Brydon, J. E. and Miles, N. M. (1971). Forms of extractable Iron and Aluminium in soils. Proceedings of Soil Science Society of America, 35 : 33-38.
Mehasho, H. (2006). Iron fortification technology development. New approach. Journal of Nutrition 136:1059-1063.
Mhoro, L. (2012). Levels of micronutrients in soils and crops from mbeya, tanzania, as reflection of nutritive value of the crops. Msc Dissertation. Sokoine University of Agriculture, Morogoro, Tanzania. 125 pp.
Motsara, M.R. and Roy, R.N. (2008). Guide to laboratory establishment for plant analysis. Food and Agriculture Organization of the United Nations, Rome. 204pp.
Msanya, B. M., Otsuka, H., Araki. S. and Fujitake. N. (2007). Characterization of volcanic ash soils in southwestern Tanzania: Morphology, physicochemical properties, and classification. African Study Monographs, Suppl.34: 39 -55.
Munishi, J.A. (2011). Pedological characterization and fertility assessment in soils from selected site of Mbeya Region. MSc. Thesis, Sokoine University of Agriculture, Tanzania. 182pp
Murphy, J. and Riley, J. P. (1962). A modified single solution method for the determination of phosphate in natural waters. Analytica Chimica Acta 27:31-36.
Nanzyo, M., Dahlgre, R.A. and Shoji, S. (1993) Chemical characteristics of volcanic ash soils. In: Volcanic Ash Soils. Genesis, Properties and Utilization (Shoji, S., Nanzyo, M. and Dahlgren, R. Eds.). Development in Soil Science Vol. 21. Elsevier, Amsterdam, 145-188.
Nanzyo, M. (2003). Unique properties of volcanic ash soils. Global Environmental Research 6:69-81.
Nelson, D.W and Sommers, L.E. (1982). Total carbon, organic carbon and organic. In Methods of Soil Analysis, Part 2. Chemical and Microbiological Properties (A.L. Page, Miller, R.H. and Keeney, D.R. eds). American Society of Agronomy. Madison. 539-579pp.
National Soil Service (NSS) (1990). Laboratory procedures for routine analysis, 3rd edition. Agricultural

13
Research Institute, Mlingano Tanga, Tanzania. pp. 212.
Nubẻ, M. and. Voortman, R.L. (2006). Simultaneously addressing micronutrient deficiencies in soils, crop, animal and human nutrition: Opportunities for high yields and better health. Centre for World Food Studies. Staff Working Paper WP-06-02.
Pansu, M. and Gautheyrou, J. (2006). Handbook of soil analysis: Mineralogical Organic and Inorganic Methods. Springer-Verlag Berlin Heidelberg Netherlands. pp. 993.
Schulze, D. G. (1989). An introduction to soil mineralogy. In: Minerals in soil environment. (Edited by Dixon, J. B. and Weed, S. B.) Soil Science Society of America. Madison, Wisconsin, pp. 551-624.
Sheldrick, B. H. (editor), (1984). Analytical methods manual. Minister of supply and services. Ottawa. Canada.
Soil Survey Staff (1999). Soil Taxonomy 2nd Edition. A Basic System of Soil Classification for Making and Interpreting Soil Surveys, Agricultural Handbook No.436. United States Department of Agriculture, Natural Resources conservation Service, Washington DC.
Tandon, H.L.S. (1995). Micronutrients in soils, crops and fertilizer: A source book-cum-directory. Fertilizer Development and Consultation Organic. New Delhi, India
Tanzanian Food and Nutrition Center (TFNC) (2009). Food fortification. Available at: [http://www,tfnc.or.tz/eng/focus/fortification.htm]. Accessed January 2010.
Ugolini and Zasoski, R.J. (1979) Soil derived from tephra. In: Volcanic activity and Human Ecology. Academic Press Inc.
van Wambeke, A. R. (1991). Soils of the tropical, properties and appraisal. McGraw-Hill, Inc.
Welch, R.W. and Bouis, H.E. (2009). Biofortification – a sustainable agricultural strategy for reducing micronutrient malnutrition in the global South. Available at: [htt://www.scienceforum2009.nl/Prtals/11/2WelchBouisBiofortification.pdf]. Site visited on August 2011.
Welch, R.W. and Graham, R.D. (2004). Breeding for micronutrients in staple food crops from a human nutrition perspective. Journal of Experimental Botany 55:353-364.
White,P.J. and. Brown, P.H. (2010). Overview: Plant nutrition for sustainable development and global health. Oxford University Press. Annals of Botany: 1-8.