pediatric sports-related traumatic brain injury in united
TRANSCRIPT

neurosurgical
focus Neurosurg Focus 40 (4):E3, 2016
SportS-related traumatic brain injury (TBI) is an im-portant public health concern that is increasingly in the spotlight of both the lay press and the general
public. Recent estimates suggest that 300,000 to 3.8 mil-lion sports-related TBIs occur in the United States annual-
ly,11,17,32,40,49 resulting in more than 500,000 emergency de-partment (ED) visits and over 60,000 hospitalizations.31,44 In children older than 1 year, TBI is the leading cause of death and disability,27 and roughly 60%–80% of sports-related TBI ED visits are by pediatric patients—predomi-
AbbreviAtioNs CCI = Charlson Comorbidity Index; ED = emergency department; FIC = fall or interpersonal contact; GCS = Glasgow Coma Scale; ICD-9 = International Classification of Diseases, Ninth Revision; ICU = intensive care unit; ISS = Injury Severity Score; LOS = length of stay; NSP = National Sample Program; NTDB = National Trauma Data Bank; TBI = traumatic brain injury.sUbMitteD December 1, 2015. ACCePteD January 27, 2016.iNClUDe wheN CitiNg DOI: 10.3171/2016.1.FOCUS15612.
Pediatric sports-related traumatic brain injury in United States trauma centersJohn K. Yue, bA,1,2 ethan A. winkler, MD, PhD,1,2 John F. burke, MD, PhD,1,2 Andrew K. Chan, MD,1,2 sanjay s. Dhall, MD,1,2 Mitchel s. berger, MD,1 geoffrey t. Manley, MD, PhD,1,2 and Phiroz e. tarapore, MD1,2
1Department of Neurological Surgery, University of California, San Francisco; and 2Brain and Spinal Injury Center, San Francisco General Hospital, San Francisco, California
obJeCtive Traumatic brain injury (TBI) in children is a significant public health concern estimated to result in over 500,000 emergency department (ED) visits and more than 60,000 hospitalizations in the United States annually. Sports activities are one important mechanism leading to pediatric TBI. In this study, the authors characterize the demograph-ics of sports-related TBI in the pediatric population and identify predictors of prolonged hospitalization and of increased morbidity and mortality rates.MethoDs Utilizing the National Sample Program of the National Trauma Data Bank (NTDB), the authors retrospec-tively analyzed sports-related TBI data from children (age 0–17 years) across 5 sports categories: fall or interpersonal contact (FIC), roller sports, skiing/snowboarding, equestrian sports, and aquatic sports. Multivariable regression analysis was used to identify predictors of prolonged length of stay (LOS) in the hospital or intensive care unit (ICU), medical complications, inpatient mortality rates, and hospital discharge disposition. Statistical significance was assessed at a < 0.05, and the Bonferroni correction (set at significance threshold p = 0.01) for multiple comparisons was applied in each outcome analysis.resUlts From 2003 to 2012, in total 3046 pediatric sports-related TBIs were recorded in the NTDB, and these injuries represented 11,614 incidents nationally after sample weighting. Fall or interpersonal contact events were the greatest contributors to sports-related TBI (47.4%). Mild TBI represented 87.1% of the injuries overall. Mean (± SEM) LOSs in the hospital and ICU were 2.68 ± 0.07 days and 2.73 ± 0.12 days, respectively. The overall mortality rate was 0.8%, and the prevalence of medical complications was 2.1% across all patients. Severities of head and extracranial injuries were significant predictors of prolonged hospital and ICU LOSs, medical complications, failure to discharge to home, and death. Hypotension on admission to the ED was a significant predictor of failure to discharge to home (OR 0.05, 95% CI 0.03–0.07, p < 0.001). Traumatic brain injury incurred during roller sports was independently associated with prolonged hospital LOS compared with FIC events (mean increase 0.54 ± 0.15 days, p < 0.001).CoNClUsioNs In pediatric sports-related TBI, the severities of head and extracranial traumas are important predic-tors of patients developing acute medical complications, prolonged hospital and ICU LOSs, in-hospital mortality rates, and failure to discharge to home. Acute hypotension after a TBI event decreases the probability of successful discharge to home. Increasing TBI awareness and use of head-protective gear, particularly in high-velocity sports in older age groups, is necessary to prevent pediatric sports-related TBI or to improve outcomes after a TBI.http://thejns.org/doi/abs/10.3171/2016.1.FOCUS15612KeY worDs concussion; mortality; pediatric; sports; outcome; traumatic brain injury
©AANS, 2016 Neurosurg Focus Volume 40 • April 2016 1
Unauthenticated | Downloaded 01/29/22 09:33 PM UTC

J. K. Yue et al.
Neurosurg Focus Volume 40 • April 20162
nantly adolescents.27,30,31 Of great concern are the evolu-tions of postconcussion symptoms that persist for weeks to months after the injury event. These symptoms include prodromal symptoms such as headaches (65%–93%), fatigue (55%–82%), and dizziness (32%–75%), as well as specific neurocognitive and neuropsychiatric deficits such as difficulty concentrating (30%–57%), forgetful-ness (34%–42%), and depression (17%–24%).13,21,40 The persistence of these symptoms raises the risk not only for extended time away from play, but also for second-impact syndrome38,54 and possibly for chronic traumatic encepha-lopathy.13,36,38 Thus, persistent postconcussion symptoms have long-term implications for disability and mortality rates.43
Most athletic endeavors involve some risk for TBI. The highest-risk sports are those that involve interpersonal contact and collisions such as football, hockey, rugby, wrestling, and boxing.29,41 Although there have been sev-eral investigations into TBI among collegiate and profes-sional athletes,9,36,53 a much smaller number of studies has characterized the morbidity and mortality rate profiles of sports-related TBI in younger athletes.12,47 Furthermore, few studies have focused on TBIs incurred outside of or-ganized athletics, for example, during equestrian events, skiing, or even normal playground activities.15,18,24–26,48
Therefore, the field of pediatric sports-related TBI requires more focused study. Extrapolating from the lit-erature on TBI in adults to that in children is insufficient not just because the injury mechanisms are different be-tween these 2 age groups, but also because age-dependent changes in biomechanical properties, intracranial water content, intracranial blood volume, and overall myelina-tion within the CNS put the pediatric patient at greater risk for posttraumatic brain edema.3,4,16,19,42,51 Efforts are there-fore needed to characterize the mechanisms and morbid-ity and mortality rates of pediatric sports-related TBI in US trauma centers.
Here, we use the National Sample Program (NSP) of the National Trauma Data Bank (NTDB), a prospective regis-try established with the purpose of informing trauma care and outcome analyses in the United States (https://www.facs.org/quality-programs/trauma/ntdb). We retrospectively analyzed data from 3046 pediatric sports-related head inju-ries collected from 2003 to 2012 to characterize the demo-graphics, mortality rates, length of stays (LOSs) in the hos-pital and intensive care unit (ICU), inpatient complications, and discharge disposition of children with sports-related TBI. The analysis was grouped by the type of sports inci-dent leading to the injury; these incidents included fall or in-terpersonal contact (FIC) and equestrian and related sports, roller sports, skiing/snowboarding, and aquatic sports inju-ries. Our aim was to analyze and report the demograph-ics of sports-related TBI in the pediatric population and to identify characteristics among patients and sports that influ-ence overall morbidity and mortality rates in this age group.
MethodsThe methods we used in this study are very similar to
those used in the study by Winkler et al., which also ap-pears in this issue of Neurosurgical Focus.56 To aid read-ers, we provide detailed descriptions in both papers.
In this study, we used data in the NSP of the NTDB from pediatric patients (age 0–17 years) treated in the ED for sports-related TBI during a 10-year period (from 2003 to 2012). The NSP for each year consists of a stratified sample of 100 NTDB-participating hospitals, based on US census region, trauma care designation, and NTDB reporting sta-tus. The NTDB drew hospitals from the sampling universe of 453 Level I or II trauma centers using the probability-proportional-to-size-sampling-without-replacement meth-od of Levy and Lemeshow. A previous review determined that the sample size of 100 hospitals can be extrapolated to represent the national patient distribution.56 Detailed data qualification, selection, cleaning, and standardization algo-rithms have been previously reported.45 Because the NSP of the NTDB is a fully deidentified data set without the 18 federal Health Insurance Portability and Accountability Act identifiers, the current study was classified as being ex-empt from institutional review board review.
Of 1,490,076 incidents contained in the overall NSP sample, data from 3711 pediatric individuals who sus-tained a TBI were extracted as defined by the Interna-tional Classification of Diseases, Ninth Revision (ICD-9) codes 800–801.99, 803–804.99, and 850–854.19 as pre-viously described (Fig. 1).5,6,34 The subgroup with sports-related mechanisms of injury was included in the present analysis on the basis of ICD-9 E-codes and stratified into the following 5 categories: FIC, roller skate/skateboard (roller sports), skiing/snowboarding, equestrian and re-lated sports, and aquatic sports (Table 1). The ICD-9 E-codes in the NTDB do not identify individual sports, and the relative contributions of individual sports to each cat-egory are therefore unknown. The data from patients with known sex (variable name “gender”), ED Glasgow Coma Scale (GCS) score (variable name “edgcstotal”), and hos-pital discharge disposition (variable name “dischdisp” in NTDB 2003–2006 and “hospdisp” in NTDB 2007–2012) were extracted (n = 3049). Patients who were noted to have died before hospital admission (variable name “eddisp” = “died” or “died in ED,” n = 2), had penetrating TBI (vari-able name “injurytype” = “penetrating,” n = 1), or both were excluded, yielding a final sample of 3046 cases.
Demographic and clinical variables of interest were extracted to include age, sex, race, health insurance status, medical history, mechanism of injury, scalar and strati-fied Injury Severity Score (ISS), ED discharge disposition, medical complications, hospital mortality rate, hospital discharge status, hospital and ICU LOSs, and number of days on ventilator. Medical comorbidities and complica-tions were coded as present/absent, and the Charlson Co-morbidity Index (CCI) was calculated with the standard comorbidity weights, as previously described.8,55
In considering age-dependent differences in TBI pathophysiology, developmental milestones, and recov-ery profiles,3,4,16,19,42,51 we grouped patients by age into 3 categories: 0–6 years, 7–13 years, and 14–17 years. These age brackets were determined by further considering rep-resentations of typical stages in the educational system (preschool, primary and middle school, and secondary or high school) and the increasing incidence of TBI with age.27,30,31 Participation in sports activities is often dictated by their availability at school; therefore, those in second-
Unauthenticated | Downloaded 01/29/22 09:33 PM UTC

sports-related tbi in children
Neurosurg Focus Volume 40 • April 2016 3
ary or high school were separated from primary or middle school students to maximize homogeneity within each age group. Demographic and clinical variables that were miss-ing from the NSP or marked as not known or not recorded were coded as “unknown.”
Analysis of mortality rates included all patients with a known hospital discharge status (n = 3046). An analysis of hospital discharge to home included all patients with a known hospital discharge status, excluding death (n = 3023); these patients were dichotomized to “home, with or without services” versus “skilled nursing facility, rehabili-tation, or other form of higher level care.” Hospital LOS analysis included all patients who were alive at discharge (n = 3023), excluding 1 outlier LOS of 356 days (final n = 3022). An ICU LOS analysis included all patients who were alive at discharge (n = 3023), were admitted to the ICU or operating room (n = 1227), and had known or re-corded ICU LOS (n = 1129), excluding 2 outlier ICU LOSs
of 59 and 81 days (final n = 1127). Analysis of the length of time on mechanical ventilation included all patients who were alive at discharge (n = 3023) and were admitted to the ICU or operating room (n = 1227), and whose length of time on mechanical ventilation was known or recorded (n = 425), excluding 4 outlier values of 59, 66, 175, and 216 days on ventilation (final n = 421).
statistical AnalysisDescriptive variables are presented as mean and SEM
unless specified otherwise for continuous variables and as proportions for categorical variables. Group differences were assessed for statistical significance with ANOVA for continuous variables and with Pearson’s chi-square test for categorical variables. For analyses with individual cell counts < 5, Fisher’s exact test was used in place of the chi-square test. Categorical outcome variables (presence of any inpatient medical complication, mortality rate, and
Fig. 1. Flow chart depicting the extraction of the study data set from the NSP of the NTDB.
Unauthenticated | Downloaded 01/29/22 09:33 PM UTC

J. K. Yue et al.
Neurosurg Focus Volume 40 • April 20164
hospital discharge to home) were assessed with binary logistic regression. Continuous outcome variables (hospi-tal and ICU LOSs and days on ventilator) were assessed with linear regression. All multivariable analyses were conducted with multivariable regression adjusted for the category of injury (FIC, roller sports, skiing/snowboard-ing, equestrian and related sports, and aquatic sports), demographic and clinical variables (age, sex, race, health insurance, ED GCS score, stratified ISS, and CCI score).
Odds ratios with 95% CIs are reported for all logistic regression models, and mean increase or decrease values with 95% CI are reported for all linear regression models. Statistical significance was assessed at a = 0.05. The Bon-ferroni correction for multiple comparisons was applied in the 5 outcome analyses (presence of any medical compli-cation, mortality rate, discharge to home, and hospital and ICU LOSs; a = 0.05 divided by 5), yielding a statistical significance threshold of p = 0.01. All analyses were per-formed with SPSS version 22 (IBM Corporation).
resultsPatient Demographics and injury Characteristics
During the 10-year period chosen for this study (2003–2012), 54,713 incidents resulting in TBI in children were recorded in the NSP. Of these, 3046 patient events were the
result of sports-related mechanisms of injury, and these events were included in this study. After adjustment for sample weighting, these data represented 11,614 incidents nationally, and sports-related TBIs accounted for 5.6% of pediatric TBI in US trauma centers. The mean age (± SD) of the cohort was 13.3 ± 3.5 years (Table 2). Most of the patients were boys (76.1%), and white was the most repre-sented racial group (72.7%).
The most prevalent injury category was FIC (47.4%) followed by roller sports (26.5%), equestrian and related sports (14%), skiing/snowboarding (10.4%), and aquatic sports (1.7%) (Table 2). The mean ISS was 10.0 ± 7.1, and the median GCS score was 15 (interquartile range 14–15). Mild TBI (GCS score of 13–15) accounted for 87.1% of all head injuries, and 4.5% and 8.4% of TBIs were moderate (GCS score of 9–12) and severe (GCS score of 3–8), respec-tively. Injuries led to hospital admission in nearly 84% of ED visits—with patients being admitted to a general ward most frequently (38.5%), followed by ICU (36.2%), operat-ing room (4.8%), and telemetry-monitored units (4.4%).
The number of sports-related TBI events increased with age in this pediatric cohort; adolescents (14–17 years) contributed to approximately 60% of all events (Fig. 2). When we analyzed sports-related mechanism as a func-tion of age, several trends emerged. Injuries from FIC represented the largest proportion of sports-related TBI
tAble 1. summary of extracted sports-related iCD-9 e-codes
Type of Sports Injury & Code ICD-9 E-Code Description
No. of Incidents
FIC 1444 886.0 Fall on same level from collision, pushing, or shoving, by or w/ other person in sports 196 917.0 Striking against or struck accidentally by objects or persons in sports 566 917.5 Striking against or struck accidentally by object in sports w/ subsequent fall 682Roller skate/skateboard 806 885.1 Fall from roller skates 46 885.2 Fall from skateboard 760Ski/snowboard 318 885.3 Fall from skis 124 885.4 Fall from snowboard 194Equestrian/related sports 427 828.2 Accident involving animal being ridden injuring rider of animal 424 828.9 Accident involving animal being ridden injuring unspecified person 3Aquatic sports 51 831.4 Accident to watercraft causing other injury to water skier 7 831.5 Accident to watercraft causing other injury to swimmer 0 832.4 Other accidental submersion or drowning in water transport accident injuring water skier 3 832.5 Other accidental submersion or drowning in water transport accident injuring swimmer 1 833.4 Fall on stairs/ladders in water transport injuring water skier 0 833.5 Fall on stairs/ladders in water transport injuring swimmer 0 883.0 Accident from diving or jumping into water (swimming pool) 24 910.0 Accidental drowning & submersion while water-skiing 0
910.1Accidental drowning & submersion while engaged in other sport or recreational activity
w/ diving equipment 2
910.2Accidental drowning & submersion while engaged in other sport or recreational activity
w/o diving equipment 14
Unauthenticated | Downloaded 01/29/22 09:33 PM UTC
sports-related tbi in children
Neurosurg Focus Volume 40 • April 2016 5
in all age groups, and the proportion of TBIs due to FIC increased with age. Traumatic brain injuries due to roller sports showed an age-dependent increase from children 0–6 years old to those of older age. In contrast, equestrian and related sports showed an age-dependent decrease in contribution to TBI. Traumatic brain injury due to aquatic sports was the smallest contributor in all age groups, and TBI due to aquatic sports or skiing/snowboarding showed no significant age-specific trends (Fig. 2).
hospital los and Medical ComplicationsAcross sports-related injury mechanisms, the mean
hospital LOS was 2.68 ± 0.07 days; patients admitted to the ICU or operating room spent on average 2.73 ± 0.12 days and 1.96 ± 0.19 days in the ICU and on mechanical ventilation, respectively. Multivariable linear regression identified several statistically significant predictors for prolonged hospital LOS in sports-related TBI, including moderate or severe TBI; an ISS of 9–15, 16–24, 25–75, or unknown; and roller sports–related TBIs (Table 3). Com-paring the sports mechanism of injury, we found that roller sports were associated with statistically significantly pro-longed hospital LOS compared with FIC (mean increase 0.54 days, 95% CI 0.25–0.83 days, p < 0.001). Aquatic sports TBI showed a statistically nonsignificant trend to-ward prolonged hospital LOS compared with FIC (mean increase 1.12 days, 95% CI 0.2–2.03 days, p = 0.017) after multiple comparisons correction (significance threshold p = 0.01). Additional multivariable analyses indicated that moderate or severe TBI and an ISS of 16–24, 25–75, or unknown also were significant predictors of increased ICU LOS (p < 0.001) (Table 4). No statistically significant association was observed between injury mechanism and the duration of ICU stay.
In total, 65 patients (2.1% overall) had a medical com-plication during their hospital stay: 38 had pneumonia, 25 acute respiratory distress syndrome, 8 decubitus ulcers, 7 coagulopathy, 4 cerebrovascular accidents, and 1 each had cardiac arrest, deep venous thrombosis, and urinary tract infection; no cases of acute kidney injury, renal fail-ure, myocardial infarction, or pulmonary embolism were observed. The rates of any medical complication for the sports categories were as follows: FIC 1.1%, roller skating/skateboarding 2.6%, skiing/snowboarding 2.2%, eques-trian and related sports 4.4%, and aquatic sports 3.9%.
Univariate analysis confirmed statistically significantly higher rates of medical complications in TBIs resulting from equestrian and related sports and significantly lower rates of medical complications from FIC events (p < 0.05). Multivariable logistic regression analysis indicated that moderate or severe TBI and an ISS of 25–75 or unknown were statistically significant predictors of medical compli-cations (Table 5). This analysis also showed that no sports-specific mechanism of injury was significantly associated with increased rates of medical complications.
Mortality rates and Discharge DispositionThere were 23 deaths in the cohort, corresponding to
a mortality rate of 0.8% (Table 6). All deaths occurred in patients with severe TBI as evidenced by an ED GCS
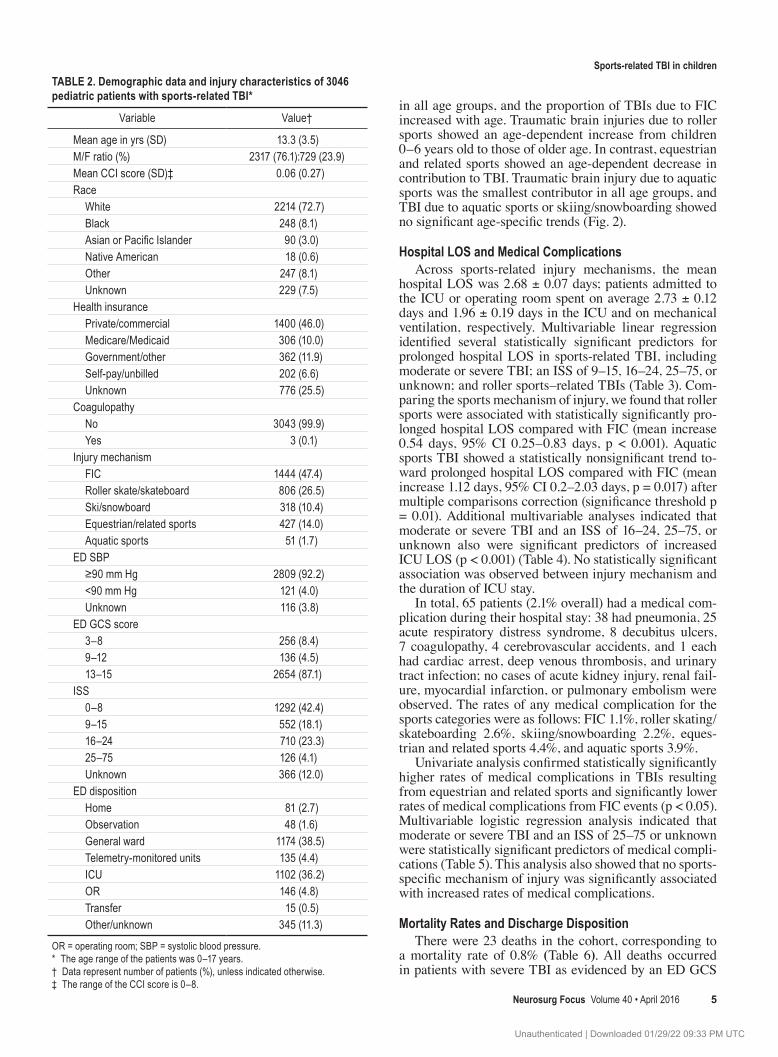
tAble 2. Demographic data and injury characteristics of 3046 pediatric patients with sports-related tbi*
Variable Value†
Mean age in yrs (SD) 13.3 (3.5)M/F ratio (%) 2317 (76.1):729 (23.9)Mean CCI score (SD)‡ 0.06 (0.27)Race White 2214 (72.7) Black 248 (8.1) Asian or Pacific Islander 90 (3.0) Native American 18 (0.6) Other 247 (8.1) Unknown 229 (7.5)Health insurance Private/commercial 1400 (46.0) Medicare/Medicaid 306 (10.0) Government/other 362 (11.9) Self-pay/unbilled 202 (6.6) Unknown 776 (25.5)Coagulopathy No 3043 (99.9) Yes 3 (0.1)Injury mechanism FIC 1444 (47.4) Roller skate/skateboard 806 (26.5) Ski/snowboard 318 (10.4) Equestrian/related sports 427 (14.0) Aquatic sports 51 (1.7)ED SBP ≥90 mm Hg 2809 (92.2) <90 mm Hg 121 (4.0) Unknown 116 (3.8)ED GCS score 3–8 256 (8.4) 9–12 136 (4.5) 13–15 2654 (87.1)ISS 0–8 1292 (42.4) 9–15 552 (18.1) 16–24 710 (23.3) 25–75 126 (4.1) Unknown 366 (12.0)ED disposition Home 81 (2.7) Observation 48 (1.6) General ward 1174 (38.5) Telemetry-monitored units 135 (4.4) ICU 1102 (36.2) OR 146 (4.8) Transfer 15 (0.5) Other/unknown 345 (11.3)
OR = operating room; SBP = systolic blood pressure.* The age range of the patients was 0–17 years.† Data represent number of patients (%), unless indicated otherwise.‡ The range of the CCI score is 0–8.
Unauthenticated | Downloaded 01/29/22 09:33 PM UTC

J. K. Yue et al.
Neurosurg Focus Volume 40 • April 20166
score of 3–8. Similarly, 19 of the 23 deaths occurred in those with an ISS of 25–75, suggesting severe extracranial injury. Univariate analysis indicated a statistically non-significant trend of dissimilar mortality rates across the sports categories (p = 0.041); however, a post hoc analysis indicated a higher mortality rate in TBI from equestrian and related sports. The small number of deaths and con-centration of all events in more severe injury categories precluded a multivariable analysis.
We next shifted our analysis focus to survivors. Over-all, 89.4% of the pediatric patients ultimately returned home, and 10.6% of the patients were discharged to reha-bilitation or skilled nursing facilities. Broken down by the sports categories causing the TBI, rates of return to home were as follows: FIC 90.8%, roller sports 90.0%, skiing/snowboarding 84.2%, equestrian and related sports 88.3%, and aquatic sports 80.0%. Univariate analyses indicated a significantly lower rate of return to home in both skiing/snowboarding and aquatic sports groups (p < 0.05), where-as patients with FIC injuries returned home at a signifi-cantly higher rate. Multivariable regression analysis iden-tified several predictors of decreased odds of returning to home, including ED hypotension, moderate or severe TBI, and an ISS of 16–24 or 25–75 (Table 7). With regard to sports category, only skiing/snowboarding injuries were associated with a trend toward lower odds of returning home (p = 0.011), which was nonsignificant after correc-tion for multiple comparisons (at a significance threshold of p = 0.01).
DiscussionSports-related TBI in the pediatric population is pres-
ently one of the most widely discussed neurosurgical top-ics in the public discourse. With the intense public and media scrutiny of TBI in professional sports, parents are increasingly concerned about encouraging their children to participate in both contact and noncontact sports. Un-fortunately, the large, population-based observational studies that are necessary to inform this conversation are scarce in the scientific literature. Previous studies have described the incidence of sports-related TBI in adult ED populations.10,23,46 Similarly, a large study in the Pediatric
Emergency Care Applied Research Network, conducted between 2004 and 2006, recently reported that the overall incidence of sports-related TBI was 1%, with significant variation by type of sports.20 However, the characteristics of inpatient hospital LOS, complications, discharge, and mortality rates in a large, nationally representative cohort have yet to be described.
One obstacle to such an analysis is the paucity of nation-wide epidemiological statistics on inpatient complications and acute outcomes after sports-related TBI in children. The NTDB, although not set up specifically for tracking sports-related TBIs, is well suited for this analysis because of its large overall sample. From 2003 to 2012, we identi-fied more than 3000 cases that fit our inclusion criteria, and we subsequently could characterize the demographic profiles, hospital and ICU LOSs, medical complications, mortality rates, and discharge dispositions across various categories of injury mechanism in pediatric sports-related TBI. To our knowledge, this study is the first in the English literature to characterize predictors of acute outcomes in pediatric sports-related TBI across sports disciplines and pediatric age groups.
Age and sports-related tbiOverall, our data showed that sports-related TBI events
dramatically increased with older age, a finding consistent with previous epidemiological studies.27,31,50 We found that that the rate of TBI due to roller sports significantly in-creased at age 7, and comprised over a quarter of TBIs in ages 7–17 years. This relationship between injury and age likely reflects how mobility and balance, both key com-ponents of roller sports, reach a threshold at this point in development that allows children to pursue this sport. This trend is present across many sports categories; indeed, sports activities become more systematic in the communi-ty starting in middle childhood.28 Interestingly, TBI from equestrian and related sports bucked this trend; it showed a marked decrease in contribution to overall TBI with in-creasing age. Although we do not have a definite explana-tion for this finding, we hypothesize that this decrease may reflect the changing interests of children as they mature. Additionally, although we refer to this category as “eques-
Fig. 2. Demographics of sports-related TBI by age and sports mechanism of injury. left: Graph depicting the number of sports-related TBI events in each of the 3 pediatric age groups. right: Graph depicting the proportions of sports-related TBI attributed to FIC, roller skating/skateboarding, skiing/snowboarding, equestrian and related sports, and aquatic sports in the 3 pediatric age groups.
Unauthenticated | Downloaded 01/29/22 09:33 PM UTC

sports-related tbi in children
Neurosurg Focus Volume 40 • April 2016 7
trian and related,” within the ICD-9 coding, this category is called “rider of animal.” As such, these injuries may also result from encounters between small children and pets. Thus, it is unsurprising that the incidence of these injuries declines with increasing age.
In our study, we observed a significant increase in FIC in the high school age group compared with their younger counterparts. It is likely that high school athletics contrib-uted to this difference. More than 7 million US high school students play sports, and a nationwide representative study in 2008 estimated that 2.5 per 10,000 injury exposures of high school athletes result in concussion.35 Sports injuries
show a substantial increase at age 13 and range from 20 to 33 per 100,000 exposures in those 13–16 years old.2 Protective devices such as helmets are known to decrease rates of TBI;7 however, the rate of helmet use is lower among older teens than among younger children.52 Thus, the combination of increased exposure and decreased use of protective wear drive the overall increase in TBI among older children.
inpatient ComplicationsThe overall rate of medical complications was 2.1% in
our study, with GCS scores and ISSs being independent
tAble 3. Multivariable linear regression of predictors of los in the hospital after pediatric sports-related tbi
Parameter B SEM 95% CI p Value*
Injury mechanism FIC Reference NA NA NA Roller skate/skateboard 0.5 0.2 0.2 to 0.8 <0.001 Ski/snowboard 0.2 0.2 −0.2 to 0.6 0.221 Equestrian/related sports 0.2 0.2 −0.2 to 0.6 0.250 Aquatic sports 1.1 0.47 0.20 to 2.0 0.017Age in yrs 0–6 Reference NA NA NA 7–13 −0.1 0.3 −0.6 to 0.5 0.817 14–17 0.3 0.3 −0.2 to 0.8 0.303Sex Male Reference NA NA Female 0.0 0.2 −0.3 to 0.3 0.905Race White Reference NA NA NA Not white 0.14 0.1 −0.1 to 0.4 0.315Health insurance Private/commercial Reference NA NA NA Medicare/Medicaid 0.2 0.3 −0.2 to 0.6 0.400 Government/other −0.4 0.2 −0.8 to −0.0 0.044 Self-pay/unbilled −0.2 0.2 −0.6 to 0.3 0.537 Unknown −0.1 0.2 −0.3 to 0.2 0.737ED SBP ≥90 mm Hg Reference NA NA NA <90 mm Hg 0.0 0.3 −0.8 to 0.4 0.475 Unknown −0.2 0.3 −0.6 to 0.6 0.938ED GCS score 13–15 Reference NA NA NA 9–12 1.4 0.3 0.9–2.0 <0.001 3–8 5.0 0.2 4.5–5.4 <0.001ISS 0–8 Reference NA NA NA 9–15 0.8 0.2 0.5–1.1 <0.001 16–24 1.5 0.2 1.2–1.8 <0.001 25–75 6.3 0.3 5.6–6.9 <0.001 Unknown 1.6 0.2 1.2–2.0 <0.001CCI score (per-unit increase) 0.5 0.2 0.1–0.9 0.018
NA = not applicable.* The statistical significance threshold was set at p = 0.01 because we investigated 5 outcomes in the primary analysis.
Unauthenticated | Downloaded 01/29/22 09:33 PM UTC

J. K. Yue et al.
Neurosurg Focus Volume 40 • April 20168
predictors of increased complication rates. This observed rate among children is relatively low compared with that of adults, a finding we attribute to the better overall health of and fewer preinjury comorbidities among the pediat-ric trauma patients.27 With the exception of respiratory disease (4.6% prevalence)—likely attributable to child-hood asthma—the rates of all other comorbidities ranged from 0.0%–0.3% in our pediatric cohort. Although sports injury mechanism was not an independent predictor of complication rates in the multivariable analysis, we note that the highest rate of complications was observed after equestrian-related TBI, and the lowest was observed af-
ter FIC-associated TBI. The likelihood of higher veloci-ties and forces involved in causing animal-riding injuries compared with those in ground-level interpersonal contact may contribute to this higher complication rate.
los and Discharge DispositionSimilar to complication rates, hospital and ICU LOSs
were both strongly predicted by GCS scores and ISSs in the ED. The sports injury mechanism was an independent predictor of hospital LOS, driven by the prolonged hos-pital LOS observed in roller sports compared with FIC. A statistically nonsignificant trend of prolonged hospital
tAble 4. Multivariable linear regression of predictors of los in the iCU after pediatric sports-related tbi
Parameter B SEM 95% CI p Value*
Injury mechanism FIC Reference NA NA NA Roller skate/skateboard 0.3 0.2 −0.2 to 0.8 0.213 Ski/snowboard −0.2 0.4 −0.9 to 0.6 0.695 Equestrian/related sports 0.5 0.4 −0.2 to 1.2 0.132 Aquatic sports 1.0 0.7 −0.4 to 2.4 0.150Age in yrs 0–6 Reference NA NA NA 7–13 −0.4 0.5 −1.4 to 0.6 0.444 14–17 −0.1 0.5 −0.9 to 1.0 0.899Sex Male Reference NA NA NA Female −0.1 0.3 −0.7 to 0.4 0.624Race White Reference NA NA NA Not white −0.1 0.2 −0.5 to 0.4 0.818Health insurance Private/commercial Reference NA NA NA Medicare/Medicaid −0.3 0.3 −1.0 to 0.3 0.326 Government/other −0.8 0.3 −1.5 to −0.2 0.016 Self-pay/unbilled −0.8 0.4 −1.7 to 0.0 0.059 Unknown −0.4 0.3 −0.9 to 0.2 0.182ED SBP ≥90 mm Hg Reference NA NA NA <90 mm Hg 0.8 0.8 −0.8 to 2.4 0.332 Unknown −1.1 0.7 −2.5 to 0.2 0.098ED GCS score 13–15 Reference NA NA NA 9–12 1.5 0.4 0.7 to 2.3 <0.001 3–8 3.2 0.3 2.6 to 3.7 <0.001ISS 0–8 Reference NA NA NA 9–15 0.7 0.3 0.0 to 1.3 0.040 16–24 1.1 0.3 0.5 to 1.6 <0.001 25–75 5.6 0.4 4.8 to 6.5 <0.001 Unknown 1.7 0.3 1.0 to 2.4 <0.001CCI score (per-unit increase) 0.2 0.3 −0.5 to 0.8 0.573
* The statistical significance threshold was set at p = 0.01 because we investigated 5 outcomes in the primary analysis.
Unauthenticated | Downloaded 01/29/22 09:33 PM UTC

sports-related tbi in children
Neurosurg Focus Volume 40 • April 2016 9
LOS was observed in aquatic sports compared with FIC. No significant differences were observed in ICU LOS across the sports mechanisms of TBI; we surmise that this lack of a difference resulted from an overall low rate of medical comorbidities or complications in this age group and also from small sample sizes.
Similarly, neither age group nor category of injury pre-dicted the likelihood of discharge to home. However, in a subgroup analysis, we did find that compared with FIC, skiing/snowboarding injuries approached statistical sig-
nificance for decreased odds of discharge to home (OR 0.58, 95% CI 0.38–0.88). Again, we highlight the need for improved compliance with helmet use for sports in general and high-velocity sports in particular.22,33 Patients with no known or unrecorded health insurance status had higher odds of being discharged to home than those with private or commercial insurance. Although it is possible that this disparity reflected a lack of available rehabilitation re-sources for the uninsured, it may also be due to the speedy discharge of patients with minor injuries before health in-surance information was fully collected.
Mortality rates and sports-related tbiThe overall mortality rate in children due to TBI of
any cause has been estimated to be at 2.5%; previously identified predictors of poor recovery in children include age younger than 4 years, cardiopulmonary resuscitation, multisystem trauma, hypotension and hypoxia, hyperven-tilation and hyperglycemia, and intracranial pressure.27 In our study, 0.8% of the patients died, and in all the TBI had been classified as severe (with a GCS score of 3–8). Twenty (87%) of the 23 deaths were graded as severe or critical systemic trauma by the ISS, and the 3 remaining deaths had an unknown ISS. Although the mortality rate observed in our study was lower than the average for over-all pediatric TBI, it is yet unknown whether this trend is typical of sports-related pediatric TBI. Not surprisingly, in our study, mortality rate was driven by the severity of TBI
tAble 5. Multivariable logistic regression of predictors of complications after pediatric sports-related tbi
Parameter Odds Ratio (95% CI) p Value*
Injury mechanism 0.457 FIC Reference NA Roller skate/skateboard 1.0 (0.4–2.1) 0.918 Ski/snowboard 1.4 (0.5–4.1) 0.492 Equestrian/related sports 2.2 (0.8–5.5) 0.112 Aquatic sports 0.8 (0.1–4.5) 0.798Age (yrs) 0.132 0–6 Reference NA 7–13 0.5 (0.2–1.8) 0.322 14–17 1.1 (0.3–3.5) 0.880Sex 0.207 Male Reference Female 0.6 (0.3–1.3)Race 0.875 White Reference NA Not white 1.1 (0.5–2.1)Health insurance 0.814 Private/commercial Reference NA Medicare/Medicaid 1.0 (0.4–2.5) 0.959 Government/other 0.6 (0.2–1.7) 0.322 Self-pay/unbilled 0.6 (0.2–2.0) 0.418 Unknown 0.9 (0.4–1.9) 0.762ED SBP 0.419 ≥90 mm Hg Reference NA <90 mm Hg 2.2 (0.6–7.5) 0.224 Unknown 0.7 (0.1–3.5) 0.645ED GCS score <0.001 13–15 Reference NA 9–12 13.0 (4.0–42.8) <0.001 3–8 53.7 (22.9–126.0) <0.001ISS <0.001 0–8 Reference NA 9–15 2.1 (0.6–8.0) 0.259 16–24 3.3 (1.1–9.8) 0.028 25–75 8.8 (3.1–25.5) <0.001 Unknown 5.8 (1.9–17.8) 0.002CCI score (per-unit increase) 0.9 (0.3–2.9) 0.880
* The statistical significance threshold was set at p = 0.01 because we investi-gated 5 outcomes in the primary analysis.
tAble 6. hospital mortality distribution after pediatric sports-related tbi*
Variable Alive Dead p Value
Injury mechanism 0.041 FIC 1438 (99.6) 6 (0.4) Roller skate/skateboard 798 (99.0) 8 (1.0) Ski/snowboard 317 (99.7) 1 (0.3) Equestrian/related sports 420 (98.4) 7 (1.6) Aquatic sports 50 (98.0) 1 (2.0)Age (yrs) 0.342 0–6 171 (98.8) 2 (1.2) 7–13 1042 (99.0) 10 (1.0) 14–17 1810 (99.4) 11 (0.6)ED GCS score <0.001 3–8 233 (91.0) 23 (9.0) 9–12 136 (100.0) 0 (0.0) 13–15 2654 (100.0) 0 (0.0)ISS <0.001 0–8 1292 (100.0) 0 (0.0) 9–15 552 (100.0) 0 (0.0) 16–24 709 (99.9) 1 (0.1) 25–75 107 (84.9) 19 (15.1) Unknown 363 (99.2) 3 (0.8)All 3023 (99.2) 23 (0.8)
* The data represent number of patients (%); row percentages are shown. The statistical significance threshold was set at p = 0.01 because we investigated 5 outcomes in the primary analysis.
Unauthenticated | Downloaded 01/29/22 09:33 PM UTC

J. K. Yue et al.
Neurosurg Focus Volume 40 • April 201610
as graded by presenting GCS score and the overall trauma severity as graded by the ISS.
Of note, for mortality rates, the sports injury mecha-nism varied across the 3 age groups: animal riding led to both of the deaths recorded for the youngest age group, whereas FIC and roller sports caused most of the deaths in the 2 older age groups. This variation likely reflects the aforementioned overall age-dependent shift away from equestrian sports and toward organized athletics and roller sports.
limitationsDespite the large size of our cohort, one limitation was
the relatively low number of deaths in this sample. As a result, a multivariable analysis of predictors of mortality rates was not feasible. Future works in larger sample pop-ulations with greater heterogeneity of cause of death are needed to create such a model.
It is possible that the mortality rates due to certain sports mechanism are underreported in the NTDB overall because this database includes only patients triaged to a Level I or Level II trauma center. Deaths that occur in the field, in rural areas, or at community hospitals are there-fore not included in the NTDB. Most likely, this limita-tion would cause an underestimation of the mortality rate, particularly after equestrian sports–related injuries, which are more likely to take place outside of major metropolitan centers. Furthermore, the NTDB fails to capture the count-less mild TBIs that are never reported because either they are too minor to require medical attention or they are man-aged in community hospitals and do not require referral to a Level I or Level II trauma center. Last, our analysis did not include those injuries incurred through mechanisms that fall outside the coding parameters of the NTDB. We therefore expect that our analysis of sport-related TBI did not estimate its true prevalence, which is likely several times that of our reported number of injuries.
ConclusionsIn pediatric sports-related TBI, the severity of extra-
cranial injury and low admission GCS scores were the strongest predictors of acute medical complications, pro-longed hospital and ICU LOSs, in-hospital mortality rate, and failure to discharge to home. Acute hypotension in the ED was found to be detrimental to successful discharge to home. The injury mechanism of roller sports was an inde-pendent predictor of prolonged hospital LOS after TBI in the pediatric population. Use of protective headgear, par-ticularly during high-velocity sports in older age groups, is necessary to improve outcomes after pediatric sports-related TBI. Understanding the characteristics of sports-related TBI in terms of complication, morbidity, and mor-tality rates could help focus public awareness efforts on preventing these debilitating injuries.
AcknowledgmentsWe acknowledge the use of the NSP in this study as follows:
Committee on Trauma, American College of Surgeons, NTDB NSP 2003–2012, Chicago, IL. The content reproduced from the NTDB NSP remains the full and exclusive copyrighted property of the American College of Surgeons. The American College of Surgeons is not responsible for any claims arising from works based on the original data, text, tables, or figures.
references 1. American College of Surgeons: National Trauma Data
Bank (NTDB) National Sample Program, Arrival Year 2012 (January, 2013). Instructional Manual. (https://www.facs.org/~/media/files/quality%20programs/trauma/ntdb/ntdbmanual2012.ashx) [Accessed March 4, 2016]
2. Agran PF, Winn D, Anderson C, Trent R, Walton-Haynes L: Rates of pediatric and adolescent injuries by year of age. Pe-diatrics 108:E45, 2001
tAble 7. Multivariable logistic regression of predictors of hospital discharge disposition to home after pediatric sports-related tbi
Parameter Odds Ratio p Value*
Injury mechanism 0.051 FIC Reference NA Roller skate/skateboard 1.1 (0.8–1.5) 0.665 Ski/snowboard 0.6 (0.4–0.9) 0.011 Equestrian/related sports 0.9 (0.6–1.4) 0.580 Aquatic sports 0.5 (0.2–1.3) 0.171Age (yrs) 0.157 0–6 Reference NA 7–13 0.7 (0.4–1.4) 0.363 14–17 0.6 (0.3–1.1) 0.117Sex 0.602 Male Reference Female 1.1 (0.8–1.6)Race 0.033 White Reference NA Not white 0.7 (0.5–1.0)Health insurance <0.001 Private/commercial Reference NA Medicare/Medicaid 1.3 (0.8–2.1) 0.274 Government/other 0.8 (0.5–1.1) 0.165 Self-pay/unbilled 0.7 (0.4–1.1) 0.115 Unknown 1.9 (1.3–2.8) 0.001ED SBP <0.001 ≥90 mm Hg Reference NA <90 mm Hg 0.05 (0.03–0.07) <0.001 Unknown 1.6 (0.6–3.8) 0.314ED GCS score <0.001 13–15 Reference NA 9–12 0.3 (0.2–0.5) <0.001 3–8 0.2 (0.1–0.2) <0.001ISS <0.001 0–8 Reference NA 9–15 0.6 (0.4–0.9) 0.020 16–24 0.5 (0.4–0.8) <0.001 25–75 0.2 (0.1–0.2) <0.001 Unknown 0.9 (0.6–1.5) 0.684CCI score (per-unit increase) 0.8 (0.5–1.2) 0.315
* The statistical significance threshold was set at p = 0.01 because we investi-gated 5 outcomes in the primary analysis.
Unauthenticated | Downloaded 01/29/22 09:33 PM UTC

sports-related tbi in children
Neurosurg Focus Volume 40 • April 2016 11
3. Aldrich EF, Eisenberg HM, Saydjari C, Foulkes MA, Jane JA, Marshall LF, et al: Predictors of mortality in severely head-injured patients with civilian gunshot wounds: a report from the NIH Traumatic Coma Data Bank. Surg Neurol 38:418–423, 1992
4. Bauer R, Fritz H, Harald F: Pathophysiology of traumatic injury in the developing brain: an introduction and short up-date. Exp Toxicol Pathol 56:65–73, 2004
5. Bekelis K, Missios S, Mackenzie TA: Prehospital helicopter transport and survival of patients with traumatic brain injury. Ann Surg 261:579–585, 2015
6. Bowman SM, Martin DP, Sharar SR, Zimmerman FJ: Racial disparities in outcomes of persons with moderate to severe traumatic brain injury. Med Care 45:686–690, 2007
7. Buller DB, Andersen PA, Walkosz BJ, Scott MD, Cutter GR, Dignan MB, et al: The prevalence and predictors of helmet use by skiers and snowboarders at ski areas in western North America in 2001. J Trauma 55:939–945, 2003
8. Charlson ME, Pompei P, Ales KL, MacKenzie CR: A new method of classifying prognostic comorbidity in longitudinal studies: development and validation. J Chronic Dis 40:373–383, 1987
9. Collins MW, Grindel SH, Lovell MR, Dede DE, Moser DJ, Phalin BR, et al: Relationship between concussion and neuropsychological performance in college football players. JAMA 282:964–970, 1999
10. Coronado VG, Haileyesus T, Cheng TA, Bell JM, Haarbauer-Krupa J, Lionbarger MR, et al: Trends in sports- and recre-ation-related traumatic brain injuries treated in US emergen-cy departments: the National Electronic Injury Surveillance System-All Injury Program (NEISS-AIP) 2001–2012. J Head Trauma Rehabil 30:185–197, 2015
11. Daneshvar DH, Nowinski CJ, McKee AC, Cantu RC: The epidemiology of sport-related concussion. Clin Sports Med 30:1–17, vii, 2011
12. Echlin PS, Tator CH, Cusimano MD, Cantu RC, Taunton JE, Upshur REG, et al: Return to play after an initial or recur-rent concussion in a prospective study of physician-observed junior ice hockey concussions: implications for return to play after a concussion. Neurosurg Focus 29(5):E5, 2010
13. Eisenberg MA, Meehan WP III, Mannix R: Duration and course of post-concussive symptoms. Pediatrics 133:999–1006, 2014
14. Gardner A, Iverson GL, McCrory P: Chronic traumatic en-cephalopathy in sport: a systematic review. Br J Sports Med 48:84–90, 2014
15. Gassner R, Tuli T, Hächl O, Moreira R, Ulmer H: Cranio-maxillofacial trauma in children: a review of 3,385 cases with 6,060 injuries in 10 years. J Oral Maxillofac Surg 62:399–407, 2004
16. Gefen A, Gefen N, Zhu Q, Raghupathi R, Margulies SS: Age-dependent changes in material properties of the brain and braincase of the rat. J Neurotrauma 20:1163–1177, 2003
17. Gessel LM, Fields SK, Collins CL, Dick RW, Comstock RD: Concussions among United States high school and collegiate athletes. J Athl Train 42:495–503, 2007
18. Gilliam JM, Jones PJ, Field WE, Kraybill DB, Scott SE: Farm-related injuries among Old Order Anabaptist children: developing a baseline from which to formulate and assess future prevention strategies. J Agromed 12:11–23, 2007
19. Giza CC, Mink RB, Madikians A: Pediatric traumatic brain injury: not just little adults. Curr Opin Crit Care 13:143–152, 2007
20. Glass T, Ruddy RM, Alpern ER, Gorelick M, Callahan J, Lee L, et al: Traumatic brain injuries and computed tomog-raphy use in pediatric sports participants. Am J Emerg Med 33:1458–1464, 2015
21. Grubenhoff JA, Kirkwood MW, Deakyne S, Wathen J: De-tailed concussion symptom analysis in a paediatric ED popu-lation. Brain Inj 25:943–949, 2011
22. Hagel BE, Pless IB, Goulet C, Platt RW, Robitaille Y: Effec-tiveness of helmets in skiers and snowboarders: case-control and case crossover study. BMJ 330:281, 2005
23. Haring RS, Canner JK, Asemota AO, George BP, Selvara-jah S, Haider AH, et al: Trends in incidence and severity of sports-related traumatic brain injury (TBI) in the emergency department, 2006–2011. Brain Inj 29:989–992, 2015
24. Hendricks KJ, Adekoya N: Non-fatal animal related injuries to youth occurring on farms in the United States, 1998. Inj Prev 7:307–311, 2001
25. Hendricks KJ, Myers JR, Layne LA, Goldcamp EM: House-hold youth on minority operated farms in the United States, 2000: exposures to and injuries from work, horses, ATVs and tractors. J Safety Res 36:149–157, 2005
26. Hubler CL, Hupcey JE: Incidence and nature of farm-related injuries among Pennsylvania Amish children: implications for education. J Emerg Nurs 28:284–288, 2002
27. Kannan N, Ramaiah R, Vavilala MS: Pediatric neurotrauma. Int J Crit Illn Inj Sci 4:131–137, 2014
28. Keenan HT, Bratton SL: Epidemiology and outcomes of pediatric traumatic brain injury. Dev Neurosci 28:256–263, 2006
29. Koh JO, Cassidy JD, Watkinson EJ: Incidence of concussion in contact sports: a systematic review of the evidence. Brain Inj 17:901–917, 2003
30. Lam WH, MacKersie A: Paediatric head injury: incidence, aetiology and management. Paediatr Anaesth 9:377–385, 1999
31. Langlois JA, Rutland-Brown W, Thomas KE: The incidence of traumatic brain injury among children in the United States: differences by race. J Head Trauma Rehabil 20:229–238, 2005
32. Langlois JA, Rutland-Brown W, Wald MM: The epidemiol-ogy and impact of traumatic brain injury: a brief overview. J Head Trauma Rehabil 21:375–378, 2006
33. Macpherson AK, To TM, Macarthur C, Chipman ML, Wright JG, Parkin PC: Impact of mandatory helmet legisla-tion on bicycle-related head injuries in children: a popula-tion-based study. Pediatrics 110:e60, 2002
34. Majidi S, Siddiq F, Qureshi AI: Prehospital neurologic de-terioration is independent predictor of outcome in traumatic brain injury: analysis from National Trauma Data Bank. Am J Emerg Med 31:1215–1219, 2013
35. Marar M, McIlvain NM, Fields SK, Comstock RD: Epide-miology of concussions among United States high school athletes in 20 sports. Am J Sports Med 40:747–755, 2012
36. McCrea M, Guskiewicz KM, Marshall SW, Barr W, Ran-dolph C, Cantu RC, et al: Acute effects and recovery time fol-lowing concussion in collegiate football players: the NCAA Concussion Study. JAMA 290:2556–2563, 2003
37. McCrory P, Meeuwisse WH, Kutcher JS, Jordan BD, Gard-ner A: What is the evidence for chronic concussion-related changes in retired athletes: behavioural, pathological and clinical outcomes? Br J Sports Med 47:327–330, 2013
38. McCrory PR, Berkovic SF: Second impact syndrome. Neu-rology 50:677–683, 1998
39. McKee AC, Cantu RC, Nowinski CJ, Hedley-Whyte ET, Ga-vett BE, Budson AE, et al: Chronic traumatic encephalopathy in athletes: progressive tauopathy after repetitive head injury. J Neuropathol Exp Neurol 68:709–735, 2009
40. Meehan WP III, d’Hemecourt P, Comstock RD: High school concussions in the 2008–2009 academic year: mechanism, symptoms, and management. Am J Sports Med 38:2405–2409, 2010
41. Powell JW, Barber-Foss KD: Traumatic brain injury in high school athletes. JAMA 282:958–963, 1999
42. Prins ML, Hovda DA: Developing experimental models to address traumatic brain injury in children. J Neurotrauma 20:123–137, 2003
Unauthenticated | Downloaded 01/29/22 09:33 PM UTC

J. K. Yue et al.
Neurosurg Focus Volume 40 • April 201612
43. Rose SC, Weber KD, Collen JB, Heyer GL: The diagnosis and management of concussion in children and adolescents. Pediatr Neurol 53:108–118, 2015
44. Schneier AJ, Shields BJ, Hostetler SG, Xiang H, Smith GA: Incidence of pediatric traumatic brain injury and associated hospital resource utilization in the United States. Pediatrics 118:483–492, 2006
45. Schoenfeld AJ, Belmont PJ Jr, See AA, Bader JO, Bono CM: Patient demographics, insurance status, race, and ethnicity as predictors of morbidity and mortality after spine trauma: a study using the National Trauma Data Bank. Spine J 13:1766–1773, 2013
46. Selassie AW, Wilson DA, Pickelsimer EE, Voronca DC, Wil-liams NR, Edwards JC: Incidence of sport-related traumatic brain injury and risk factors of severity: a population-based epidemiologic study. Ann Epidemiol 23:750–756, 2013
47. Sim A, Terryberry-Spohr L, Wilson KR: Prolonged recovery of memory functioning after mild traumatic brain injury in adolescent athletes. J Neurosurg 108:511–516, 2008
48. Smith GA, Scherzer DJ, Buckley JW, Haley KJ, Shields BJ: Pediatric farm-related injuries: a series of 96 hospitalized patients. Clin Pediatr (Phila) 43:335–342, 2004
49. Sosin DM, Sniezek JE, Thurman DJ: Incidence of mild and moderate brain injury in the United States, 1991. Brain Inj 10:47–54, 1996
50. Stocchetti N, Conte V, Ghisoni L, Canavesi K, Zanaboni C: Traumatic brain injury in pediatric patients. Minerva Anes-tesiol 76:1052–1059, 2010
51. Thibault KL, Margulies SS: Age-dependent material proper-ties of the porcine cerebrum: effect on pediatric inertial head injury criteria. J Biomech 31:1119–1126, 1998
52. U.S. Consumer Product Safety Commission: National Bike Helmet Use Survey. (http://www.cpsc.gov/en/Media/Documents/Research--Statistics/Technical-Reports/Sports--Recreation/Other-Sport-Injury-/National-Bike-Helmet-Use-Survey/?utm_source=rss&utm_medium=rss&utm_campaign=Other+Sports+Technical+Reports+) [Accessed February 17, 2016]
53. Warden DL, Bleiberg J, Cameron KL, Ecklund J, Walter J, Sparling MB, et al: Persistent prolongation of simple reaction time in sports concussion. Neurology 57:524–526, 2001
54. Wetjen NM, Pichelmann MA, Atkinson JLD: Second impact syndrome: concussion and second injury brain complications. J Am Coll Surg 211:553–557, 2010
55. Winkler EA, Yue JK, Birk H, Robinson CK, Manley GT, Dhall SS, et al: Perioperative morbidity and mortality after lumbar trauma in the elderly. Neurosurg Focus 39(4):E2, 2015
56. Winkler EA, Yue JK, Burke JF, Chan AK, Dhall SS, Berger MS, et al: Adult sports-related traumatic brain injury in Unit-ed States trauma centers. Neurosurg Focus 40(4):E4, 2016
DisclosuresThe authors report no conflict of interest concerning the materi-als or methods used in this study or the findings specified in this paper.
Author ContributionsConception and design: Tarapore, Yue, Winkler, Dhall, Berger, Manley. Acquisition of data: Tarapore, Yue, Winkler, Dhall, Berger, Manley. Analysis and interpretation of data: all authors. Drafting the article: all authors. Critically revising the article: Tarapore, Yue, Winkler, Dhall, Berger, Manley. Reviewed sub-mitted version of manuscript: Tarapore, Yue, Winkler, Dhall, Berger, Manley. Statistical analysis: Tarapore, Yue, Winkler. Administrative/technical/material support: Tarapore, Yue, Win-kler, Burke, Chan. Study supervision: Tarapore, Yue, Winkler, Berger, Manley.
CorrespondencePhiroz E. Tarapore, San Francisco General Hospital, 1001 Potrero Ave., Bldg. 1, Rm. 101, San Francisco, CA 94110. email: [email protected].
Unauthenticated | Downloaded 01/29/22 09:33 PM UTC