pedestrian flow characteristics under heterogeneous...
TRANSCRIPT

American Journal of Civil Engineering 2017; 5(5): 282-292
http://www.sciencepublishinggroup.com/j/ajce
doi: 10.11648/j.ajce.20170505.13
ISSN: 2330-8729 (Print); ISSN: 2330-8737 (Online)
Pedestrian Flow Characteristics Under Heterogeneous Traffic Conditions
A. M. Tahsin Emtenan*, Showkat Ibne Shahid
Department of Civil Engineering, Bangladesh University of Engineering and Technology, Dhaka, Bangladesh
Email address:
[email protected] (A. M. T. Emtenan), [email protected] (S. I. Shahid) *Corresponding author
To cite this article: A. M. Tahsin Emtenan, Showkat Ibne Shahid. Pedestrian Flow Characteristics Under Heterogeneous Traffic Conditions. American Journal of
Civil Engineering. Vol. 5, No. 5, 2017, pp. 282-292. doi: 10.11648/j.ajce.20170505.13
Received: July 3, 2017; Accepted: August 16, 2017; Published: August 28, 2017
Abstract: Pedestrians are an important element of the traffic stream especially in a country like Bangladesh. Dhaka is the
biggest metropolitan city of Bangladesh and thus people from different parts of the country are relocating to Dhaka. This has
rendered Dhaka one of the most densely populated cities in the World. With the resource restraint and crumbling infrastructure,
the transportation facilities can’t cope up with the ever growing population. A major proportion of the population are the urban
slum dwellers and low income people who are left with the only option of walking. Pedestrians are the most vulnerable
roadway users. Ironically they are not given due consideration in the design of roadway features. However, the alarming
growths of pedestrians, inadequate sidewalks and their haphazard movement have forced them to share the carriageway with
the vehicles. This has led to a shocking number of accidents in the past as well as contributed to further increasing the
congestion on the carriageway. This study has attempted to present flow characteristics of pedestrians on exclusive sidewalks
in three important urban areas of Dhaka namely Farmgate, Shahbag and Shukrabad. Pedestrian flow, density and walking
speed are considered as the three primary parameters on which the flow characteristics depend. These are essential tools for
determining the sidewalk capacity which will help in sidewalk design improvements required. The relationships between the
three parameters were expressed in terms of three equations which makes it easy to comprehend the situations in these three
locations. The level of service (LOS) has been determined at each location also. On the basis of flow rate, Farmgate has a LOS
C and Shukrabad and Shahbag both have a LOS B. The average free-flow speed from three locations is about 1.18 m/s. This
might help create an idea about the rate at which pedestrians might clear out from facilities.
Keywords: Speed, Flow, Density, Pedestrian Trap, Level of Service
1. Introduction
Bangladesh, a country in South Asia is very densely
populated with about 150 million inhabitants living in an area
of 147570 sq. km. Despite rising incomes and GDP, the
distribution of wealth remains skewed in this country. Dhaka
itself is dominated by people living under the poverty line.
For this portion of the population, walking is the primary
choice for making trips. Yet pedestrians have received far
less attention than vehicular traffic. Pedestrians are the most
vulnerable and neglected road users in Bangladesh. Every
person is a pedestrian at some point in a day as all journeys
necessarily start or end as a walking trip. Walking is directly
involved with using other modes. The importance of
pedestrian movements is understood globally and cannot be
overemphasized. However, the roads of Dhaka Metropolitan
City are threatening to pedestrians. Hence, they require
preferential treatment and exclusive facilities for their
movement [1].
At present nearly 60 percent of urban trips involved
walking alone in Dhaka city and it is particularly prevalent
for short trips (DITS) [5]. In terms of road usage, at some
locations, pedestrians accounted for the highest number,
representing nearly 62 percent of the total user groups in
Dhaka, the capital of Bangladesh. Low motorization levels,
unplanned haphazard land use, road side industry, inadequate
pedestrian facility and the severe lack of priority and
attention given to pedestrians in the traditional transport
planning and traffic management cause serious hazardous
283 Tahsin Emtenan and Showkat Ibne Shahid: Pedestrian Flow Characteristics Under Heterogeneous Traffic Conditions
situations. Since walking is a major contributor to a
sustainable transport strategy, it requires special attention.
Yet pedestrian can still claim to be the most forgotten and
neglected user group. Pedestrian do not need a license to use
the roads, they are a mobile group and are generally able to
go almost anywhere. Pedestrians are dispersed across the
road network and can be seen all time, day and night, in all
weathers, and on all types of roads [6]. Therefore, they are
very important and need special consideration during design
of roadway features. If exclusive facilities are not provided
for the pedestrians, then the friction would increase with the
development of sides, provision of on-street parking, and
movement of the vehicles. At times, shoulders are provided
on both the sides of road, which can also be used by the
pedestrians [7]. But many times these shoulders are used by
the vehicles for parking or are encroached by venders or
hawkers and shopkeepers. In such cases, even with the
provision of side shoulders, the pedestrians have no option
but to walk on the carriageway along the vehicular traffic. It
increases the conflict between the pedestrians and the
vehicles. Such conditions are very common on urban roads of
medium-sized cities in Bangladesh and many other
developing nations. It is therefore important to study the
characteristics of the pedestrian under mixed traffic condition
and to compare them with those reported from other
countries. Overall there are wide differences between
developed and developing countries in the behavior,
knowledge and attitudes of the pedestrians and the
preferential treatment they deserve. Their logic and
technology may be adjusted to match with the condition of
our country. In Bangladesh, little attention has been devoted
to study pedestrian behavior and pedestrian flow
characteristics [2].
This paper aims at establishing relationships among
primary flow parameters namely flow, density and speed of
the pedestrians in three major urban areas of Dhaka
Metropolitan City. The study was conducted and data were
collected in such a way that flow conditions were not
affected by the procedure itself. The specific objectives of the
study are:
1. To obtain flow fluctuation patterns during peak and off-
peak hours in three major areas of Dhaka Metropolitan City.
2. To establish the primary mathematical relationships
between speed-density, speed-flow and flow-density.
3. To estimate the free flow speed obtained from the
equations derived.
4. To determine the maximum pedestrian flow in each site.
5. To determine the level of service (LOS) for three sites
based on free flow speed as well as maximum flow rate.
6. To compare the flow characteristics parameters as well
as LOS within different sites.
2. Pedestrian Flow Characteristics
General relationships used to relate the parameters of
pedestrian flow characteristics are asfollows:
Pedestrian walking speed (µ) and density (k)
µ = a − b * k (1)
Pedestrian flow (q) and density (k)
q= a * k – b * k2 (2)
Pedestrian walking speed (µ) and flow (q)
Q= µ * k = µ *(���)
� (3)
Here ‘a’ and ‘b’, denote the model parameters which vary
from location to location. In this study, single regime
approach will be used for establishing relationships between
the three basic parameters of pedestrian flow. That means the
model parameters found from speed density relation would
be used to determine flow-density and flow-speed relations
(Rastogi et. al. 2008). The values of pedestrian flow, density
and walking speeds were inserted in Excel sheets with
corresponding time. The speed density columns were used to
draw a speed vs. density best fit linear graph. This was done
for each location. The actual data points around the best fit
line shows the distribution of the data around the line. The
values of model parameters‘a’ and ‘b’were used to formulate
the flow-density and speed-flow equations [3].
3. Methodology
3.1. Preliminary Survey and Site Selection
Before the onset of the study preliminary surveys were
conducted in different major areas of Dhaka Metropolitan
City to identify the study areas. The study is based on the
pedestrian movement characteristics, hence the surveys
focused on the pedestrians only [4]. The criterions considered
for selecting study areas include:
1. Exclusive sidewalk for the pedestrians.
2. Distinctive flow fluctuation throughout the day. That is
some period of the day must have low pedestrian flow and
density, while other hours of the day might have heavy
congestion of pedestrians.
3. Friction caused by street hawkers/vendors or
construction works should be minimum.
4. A suitable elevated space must be present for collection
of data, suitable an elevated pedestrian overpass.
The preliminary surveys were conducted in Dhanmondi,
Motijheel, Farmgate, Shahbaag areas. Based on the
requirements of the study 3 locations were chosen; Farmgate,
Shahbaag and Shukrabad of Dhanmondi area. Test videos
were taken and data reduction feasibilities were checked.
Pedestrian traps were chosen so that pedestrians are unaware
of the trap while walking and hence, ensuring uninterrupted
flow.
3.2. Data Collection Schedule and Collection Period
Data collection using video recording was done during
typical weekends. 20 minutes of video were recorded,
representing each hour of the day. For example, the data for
7:00-8:00 AM hour block were collected from 7:21 AM to

American Journal of Civil Engineering 2017; 5(5): 282-292 284
7:40 AM which provides a fair representation of the entire
hour of pedestrian movement. In this way for each site, ten
sets of videos were recorded representing 10 hour blocks
starting from 7:00 AM to 5:00 PM. Video recording was
done in this way in order to capture the flow fluctuations
occurring from 7:00 AM to 5:00 PM. Evening peak usually
occur after 5:30 PM. But due to light insufficiency only the
fluctuations during the day time was recorded. The video
recorder can only capture up to 80 minutes of high quality
footage at once. Hence the observations at each site were
divided into 3 blocks of time period and data were collected
on consecutive 3 weekdays assuming that flow conditions
remain similar throughout the 3 days and the data collected
was assigned for a single day.
3.3. Data Reduction Procedures
The video recorded pedestrian traffic data are now played
to extract the required information. All the desired variables
are obtained from playing back the videos. In this thesis we
required 3 parameters of pedestrian traffic flow, namely flow,
speed and density. Playing back the video yielded 200 sets of
data for each location. The data were procured form the
videos in the following method.
Flow Measurement: An imaginary line was considered
along the mid-section of the pedestrian trap. The number of
pedestrians who crossed this line in each minute from both
directions was calculated. Since the flow of people in
Farmgate was extremely high the number of people crossing
the line from one direction was calculated at first. Then the
video was played back to obtain the number of pedestrians
from the other direction. The total pedestrian number was
divided by the effective width of the sideway and then by the
time period of observation to obtain pedestrian flow rate in
the unit ped/m/min [10].
Density Measurement: The density for each minute was
measured by pausing the video 3 times within that minute
and counting the number of people on the pedestrian trap.
The video was paused at 1st, 30th and 59th second of each
minute. The average of these three densities provided a fair
idea about pedestrian density. Then this average was divided
by pedestrian trap are to obtain pedestrian density in the unit
ped/m2. In case of total absence of pedestrians at those
particular seconds, data were collected for three different
instances in each minute [11]. For example: If no pedestrians
are present while the video was paused at 1st second then
pedestrian number within the first one third period of that
minute was taken. Similarly, if no pedestrians were present at
30th second, pedestrian count was taken within 21st to 40th
second of that minute.
Speed Measurement: The only effective method for
pedestrian walking speed in this method was to use space
mean speed. At every minute 3 to 4 pedestrians are
identified. The time taken for each pedestrian to cross the
study trap was calculated. This was done by noting the time
when the pedestrian entered the study trap and the time when
the pedestrian left the study trap. The difference was then
regarded as time taken for that pedestrian to cross the trap.
The time taken by 3/4 pedestrians are averaged to obtain the
average time period required to traverse the trap. The trap
length was then divided by that average period to obtain
pedestrian walking speed. The average period was expressed
to two digits after the decimal point. In the cases of Farmgate
and Shahbaag the time taken by each pedestrian was
calculated in integers. While the videos of Shukrabad area
were played back by a video player which shows time in
milliseconds.
3.4. Pedestrian Flow Characteristics
Before finding the mathematical equations the flow
fluctuations at each location are shown with the help of
graphs. The graphs are plotted for flow vs. time parameters in
figures 1, 2 and 3. In order to plot the graphs, the average of
20 minutes of flow data for each hour block was taken. This
was then expressed in the unit Ped/hour/m and bar charts
were drawn to represent flow fluctuations. For Farmgate
pedestrian trap the increase in flow occurs at 7:00 AM to
8:00 AM, 11:00 AM to 12:00 AM, 12:00 PM to 1:00 PM and
2:00 PM to 3:00 PM. Shahbag experiences spike in
pedestrian flow from 8:00 AM to 9:00 AM and 11:00 AM to
2:00 PM. Shukrabad also experiences a spike in flow from
2:00 PM to 4:00 PM. The probable causes are evaluated at
the ‘Discussion of Results’ portion of the paper.
Figure 1. Flow fluctuation at Farmgate.

285 Tahsin Emtenan and Showkat Ibne Shahid: Pedestrian Flow Characteristics Under Heterogeneous Traffic Conditions
Figure 2. Flow fluctuation at Shahbag.
Figure 3. Flow fluctuation at Shukrabad.
3.4.1. Speed-Density Relationship
Linear regression of speed-density data is done for each location. The findings are discussed in this subsection.
Figure 3. Pedestrian Speed-density curve at Farmgate.

American Journal of Civil Engineering 2017; 5(5): 282-292 286
The least square linear regression between speed and
density provides model parameters a=69.49 and b= 30.77.
Therefore, fundamental equations of pedestrian flow
provides the relations,
µ=73.16-19.96k (4)
q = 73.16k – 19.96 k2 (5)
q= �(��.���)
. � (6)
R2= 0.74 (7)
Figure 4. Pedestrian Speed-density curve at Shahbag.
The least square linear regression between speed and
density provides model parameters a=69.49 and b= 30.77.
Therefore, fundamental equations of pedestrian flow
provides the relations,
µ= 69.49-30.77k (8)
q = 69.49k – 30.77 k2 (9)
q= �(� .����)
��.�� (10)
R2= 0.57 (11)
Figure 5. Pedestrian Speed-density curve at Shukrabad.
287 Tahsin Emtenan and Showkat Ibne Shahid: Pedestrian Flow Characteristics Under Heterogeneous Traffic Conditions
The least square linear regression between speed and
density provides model parameters a=69.49 and b= 30.77.
Therefore, fundamental equations of pedestrian flow
provides the relations,
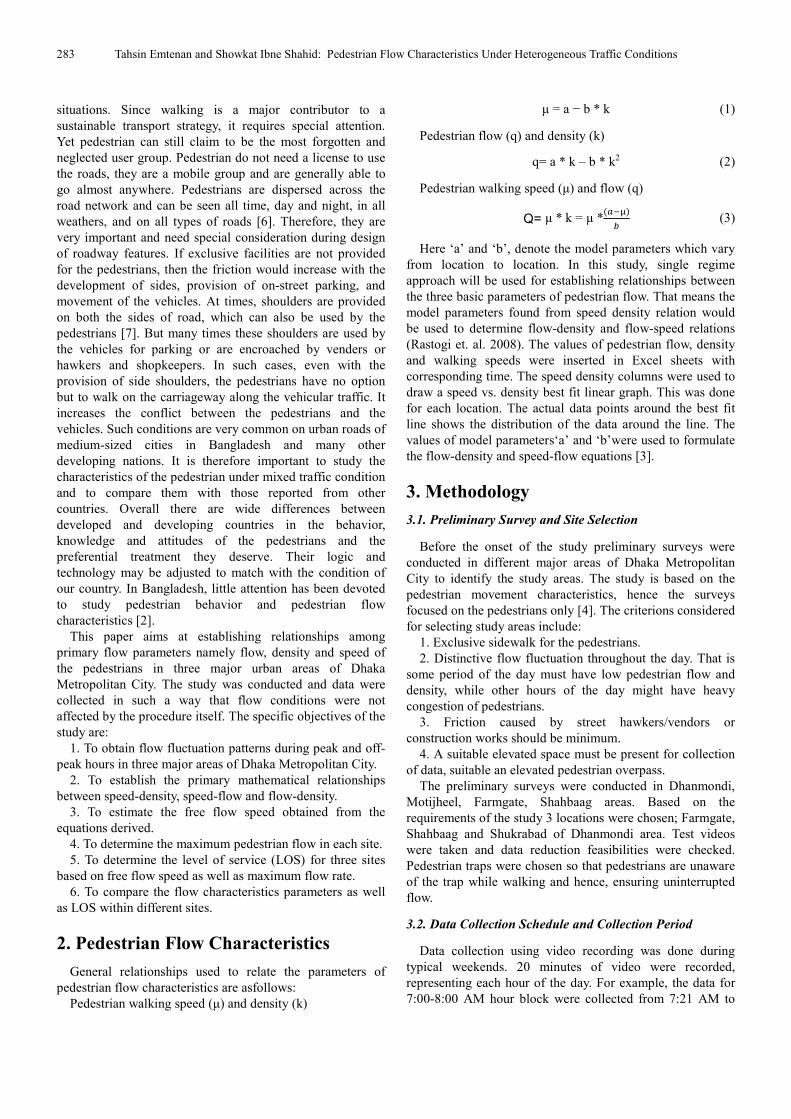
µ= 69.73-35.78k (12)
q = 69.73k – 35.78 k2 (13)
q= �(� .����)
��.�� (14)
R2= 0.69 (15)
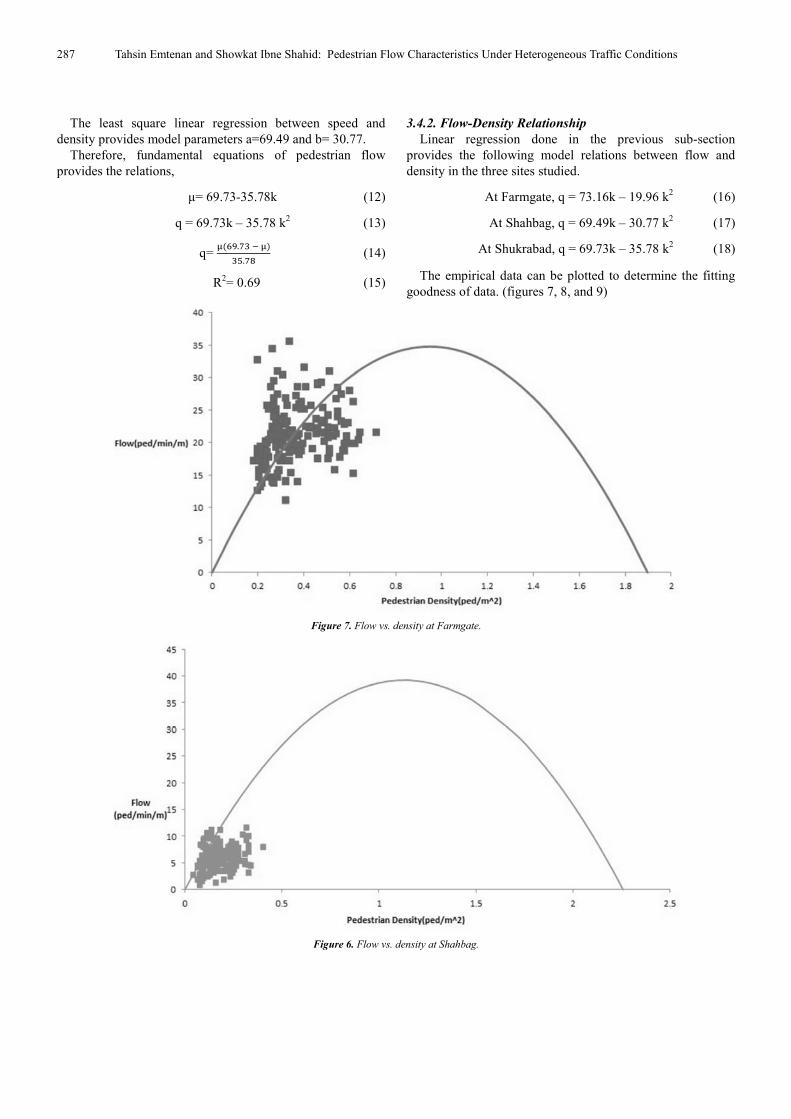
3.4.2. Flow-Density Relationship
Linear regression done in the previous sub-section
provides the following model relations between flow and
density in the three sites studied.
At Farmgate, q = 73.16k – 19.96 k2 (16)
At Shahbag, q = 69.49k – 30.77 k2 (17)
At Shukrabad, q = 69.73k – 35.78 k2 (18)
The empirical data can be plotted to determine the fitting
goodness of data. (figures 7, 8, and 9)
Figure 7. Flow vs. density at Farmgate.
Figure 6. Flow vs. density at Shahbag.
American Journal of Civil Engineering 2017; 5(5): 282-292 288
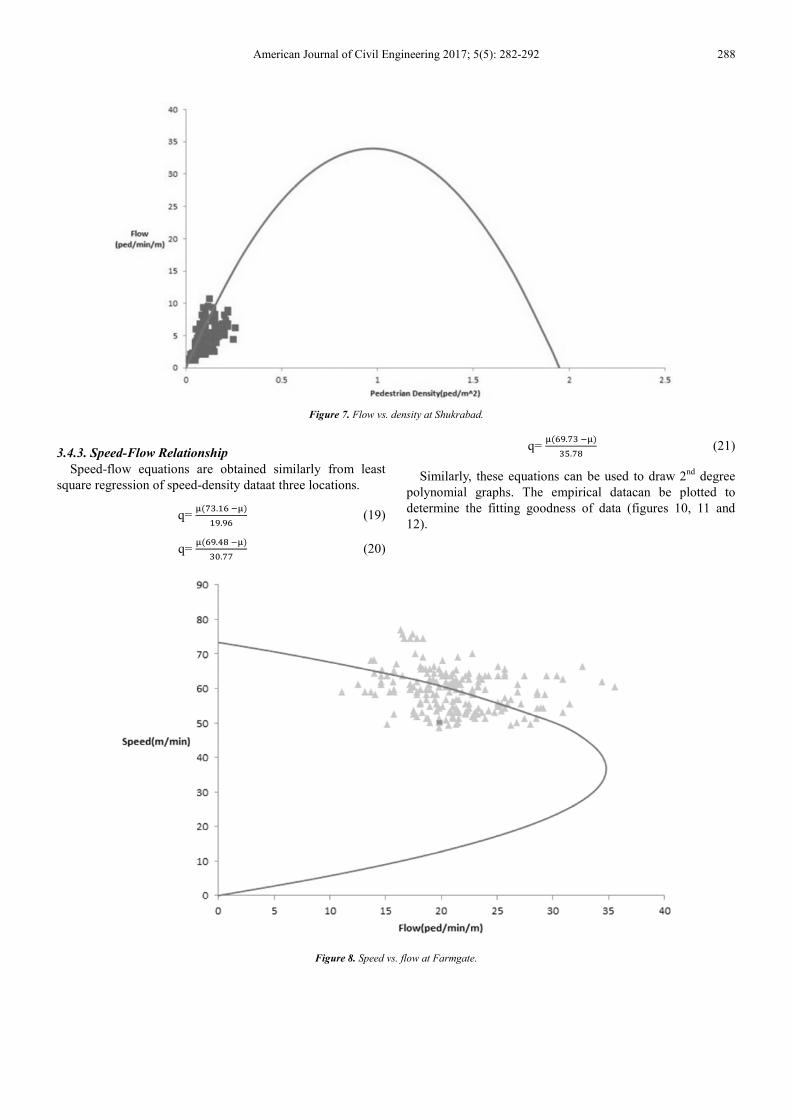
Figure 7. Flow vs. density at Shukrabad.
3.4.3. Speed-Flow Relationship
Speed-flow equations are obtained similarly from least
square regression of speed-density dataat three locations.
q= �(��.���)
. � (19)
q= �(� .����)
��.�� (20)
q= �(� .����)
��.�� (21)
Similarly, these equations can be used to draw 2nd
degree
polynomial graphs. The empirical datacan be plotted to
determine the fitting goodness of data (figures 10, 11 and
12).
Figure 8. Speed vs. flow at Farmgate.

289 Tahsin Emtenan and Showkat Ibne Shahid: Pedestrian Flow Characteristics Under Heterogeneous Traffic Conditions
Figure 9. Speed vs Flow at Shahbag.
Figure 10. Speed vs Flow at Shukrabad.
3.5. Pedestrian Flow Relationships
Tables 1 to 6 summarize the findings of the analysis in tabular form.
Table 1. Pedestrian Density Comparison.
Location Type of Area Maximum observed pedestrian Density(ped/m2) Minimum observed pedestrian Density(ped/m2)
Farmgate Mixed Traffic 0.78 0.18
Shahbag Mixed Traffic 0.40 0.04
Shukrabad Mixed Traffic 0.26 0.02

American Journal of Civil Engineering 2017; 5(5): 282-292 290
Table 2. Pedestrian Flow Rate Comparison.
Location Type of Area Maximum flow
rate(ped/m/min)
Minimum flow
rate(ped/m/min)
Farmgate Mixed Traffic 35.58 11.08
Shahbag Mixed Traffic 11.61 0.97
Shukrabad Mixed Traffic 10.68 1.14
Table 3. Pedestrian Walking Speed Comparison.
Location Type of Area
Maximum
observed walking
speed(m/min)
Minimum
observed walking
speed(m/min)
Farmgate Mixed Traffic 72.32 57.52
Shahbag Mixed Traffic 68.00 53.22
Shukrabad Mixed Traffic 69.98 58.25
Table 4. Relationships between pedestrian flow characteristics parameters.
Location Relationships
Speed-Densityµ=f(k) Flow-Densityq = f(k) Speed-Flowq = f (µ)
Farmgate µ= 73.16-19.96k q = 73.16k – 19.96 k2 q =�(��.���)
. �
Shahbag µ= 69.49-30.77k q = 69.49k – 30.77 k2 q =�(� .����)
��.��
Shukrabad µ= 69.73-35.78k q = 69.73k – 35.78 k2 q =�(� .����)
��.��
Table 5. Pedestrian Flow Characteristic Parameters at different locations.
Location Type of Area Free flow speed µf(m/min) Traffic jam Density
kj(ped/m2) Ratio ψ(ped.min/m3)
Maximumflow rate
qm(ped/m/min)
Farmgate Mixed Traffic 73.16 3.66 19.96 35.58
Shahbag Mixed Traffic 69.49 2.26 30.77 11.61
Shukrabad Mixed Traffic 69.73 1.95 35.78 10.68
Table 6. Pedestrian Level of Service(LOS) at three different locations.
Location Type of Area Free flow speed
µf(m/min) LOS based on speed
Maximumflow rate
qm(ped/m/min)
LOS based on flow
rate
Farmgate Mixed Traffic 73.16 C 35.58 C
Shahbag Mixed Traffic 69.49 D 11.61 B
Shukrabad Mixed Traffic 69.73 D 10.68 B
4. Discussion on Results Found
1. The speed-density data scattering suggests a negative
linear relationship between the two parameters (figure 4,
figure 5, figure 6)
2. The flow-density and speed-flow graphs are drawn from
parameters found in speed-density relationships. The
relationships show a 2nd order polynomial relation. Single
regime models calibrated by least square method can’t
effectively fit the empirical data. However, the models
provide ‘fair’ to ‘good’ fitting to the empirical data.
3. The traffic jam density at Farmgate was highest (3.6648
ped/m2) and lowest at Shukrabad (1.9487 ped/m
2). This
occurred due to the nature of the areas. Farmgate is a very
attractive commercial place for shoppers while Shukrabad
sidewalk which was under consideration was only used by
residents of nearby areas and students.
4. For Farmgate pedestrian trap the increase in flow occurs
at 7:00 AM to 8:00 AM, 11:00 AM to 12:00 AM, 12:00 PM
to 1:00 PM and 2:00 PM to 3:00 PM. Shahbag experiences
spike in pedestrian flow from 8:00 AM to 9:00 AM and
11:00 AM to 2:00 PM. Shukrabad experiences a spike in
flow from 2:00 PM to 4:00 PM. The probable cause for this
lies in the nature of the study traps themselves. Farmgate is a
communication hub especially at the early portion of the day.
Hence the spike in pedestrian flow at 11:00 AM to 1:00 PM
rise in flow rate can be attributed to people coming in
Farmgate for shopping. While, students coming out of the
schools after their break contributes heavily towards the 2:00
to 3:00 PM peak. However, the peak in flow in Farmgate is
sporadic because the area itself is always visited by people
around the day. Shahbag experiences morning spike due to
early commuters as the pedestrian trips in Shahbag are
dominated by commuters. Another group of pedestrians that
dominate the Shahbag study trap is medical attention seeking
people. The late morning to mid-day spike can be attributed
to this group of people. As it is more logical that, people will
not go to hospitals very early in the day or very late in the
day. The morning and noon-afternoon spike in flow rates in
Shukrabad can be attributed to school/varsity going and
school/varsity leaving students respectively.
5. The maximum flow rate occurs at Farmgate (35.5789
ped/m/min) while the minimum flow occurs at Shahbag
(0.9677 ped/m/min). The maximum value occurs at Farmgate
due to its’ high attraction for shoppers while the lowest value
occurs at Shahbag during the late part of the noon where
there are very few commuters as well as medical attention
seeking people.
6. The maximum free flow walking speed instance
occurred in Farmgate (73.161 m/min) while minimum free
flow walking speed instance was observed also in Shahbag

291 Tahsin Emtenan and Showkat Ibne Shahid: Pedestrian Flow Characteristics Under Heterogeneous Traffic Conditions
(69.488 m/min). This expresses a certain aspect of human
psychology. People face the most friction in Farmgate study
trap. Hence they try to cover this length as fast as possible.
Unless, people are actually stopped by overwhelming number
of other pedestrians, they will try to walk past the sidewalk
with highest friction as fast as possible.
7. The speed-density curves in each location shows fairly
good distribution. However, this is expected since the best fit
line was drawn with the help of Microsoft Excel.
8. The free flow speed ranges from 69-74 m/min which is
much less than that of USA, Germany but similar to that of
China, Saudi Arabia, India, Kuwait, Philippines, Thailand
and Japan. This is expected since for differences in cultural
values people in the western countries tend to walk faster.
9. Traffic jam density in each of these three locations were
much less than that of China, Thailand and Singapore and
similar to that of India and Saudi Arabia
10. The US Highway Capacity Manual standard produced
a table showing the relationships between spaces, average
speed and flow rates at different levels of service. This table
considers both walking speed and flow rates as basis for LOS
classification. However, for the type of pedestrian traps used
in this study a more realistic approach more denoting LOS
will be on the basis of flow rate. On this basis Farmgate has a
LOS C and Shukrabad and Shahbag both have a LOS B.
According to HCM at LOS C found at Farmgate space is
sufficient for normal walking speeds, and for bypassing other
pedestrians in primarily unidirectional streams. Reverse-
direction or crossing movements can cause minor conflicts,
and speeds are somewhat lower [8] [9]. Similarly, at Shahbag
and Shukrabad (at LOS B) there is sufficient area for
pedestrians to select walking speeds freely to bypass other
pedestrians, and to avoid crossing conflicts. At this level,
pedestrians begin to be aware of other pedestrians, and to
response to their presence when electing a walking path.
5. Conclusions
In Bangladesh, with a low level of motorization and
greater urban poverty, the role of walking is quite significant.
However, pedestrians are highly vulnerable as well. The
walking speed, flow and density of pedestrians are of prime
importance in a study for design and provision of pedestrian
facilities. Large proportions of sidewalk users’ need the
provision of walk facilities such as exclusive walkways or
footpaths on the road for their safe movement. Pedestrians
walk differently on different types of walking facilities [12]
[14].
Pedestrian characteristics are mainly represented in this
study through three parameters, speed, density and flow rate.
The speed-density has linear relationship with negative slope.
Therefore, as the density increases the speed of the pedestrian
decreases. However, this might not always be applicable to
pedestrian movements. The relationships among the variables
are expressed through mathematical equations. These
equations can be used for macroscopic modeling purposes. It
indicates the maximum capacity of the sidewalk as well as
provides current level of service for pedestrian movements.
The study has shed some light on the walking speeds of
pedestrians in Dhaka City compared to that of other countries
and cities. The average free-flow speed from three locations
is about 1.18 m/s. This might help create an idea about the
rate at which pedestrians might clear out from facilities.
Contrary to popular belief increase in density might not
always indicate slowing down of pedestrians. The pedestrians
will try to escape side frictions as fast as they can upon
recognizing it. Only after being obstructed by high density,
people will be forced to slow down their walking speed.
People usually walk much slower in groups and people of
female sex tend to walk slower than their male counterpart.
The sidewalk on Farmgate to a large extent was encroached
by street hawkers or vendors increasing roadside friction.
While the sidewalk on Shukrabaad was free from
obstructions allowing pedestrians to move freely. Roadside
developments and constructions encourage people to move
faster to escape the obstructions while street hawkers attract
the pedestrians causing them to move slower or come to a
halt altogether. Width of the sidewalks, pedestrian density,
side frictions, presence of walking partners, age and gender
all these factors together contribute towards determining the
walking speed of pedestrians. Each of these factors have an
effect on the pedestrian flow characteristics and their overall
effects need to be considered before reaching specific
conclusions for designing pedestrian facilities.
References
[1] Al-Masaeid, H. R., Al-Suleiman, T. I. and Nelson, D. C (1993) “Pedestrian Speed Flow Relationship for Central Business Areas in Developing Countries”, Transportation Research Record 1396, National Research Council, Washington, 69-74.
[2] BBS (Bangladesh Bureau of Statistics).: Bangladesh Population Sensus-2001: Planning Division, Ministry of Planning, Government of the People’s Republic of Bangladesh, 2007.
[3] WHO Report, (2001) “Statistical annex Geneva world health organization, 2001”, http://www.who.int/whr/2001/annex/en/index.html.
[4] Fruin, John J (1971) “Pedestrian planning and design”, Elevator World Inc., Ala.
[5] Fruin, J. J (1971a): Pedestrian and Planning Design, Metropolitan Association of Urban Designers and Environmental Planners Inc., New York.
[6] Fruin, JJ., (1970) “Designing for pedestrians: A level of service concept” Ph.D. Thesis, Polytechnic Institute of Brooklyn, pp: 151.
[7] Gerilla, G. P. (1995) “Proposed Level of Service Standards for Walkways in Metro Manila,” Journal of the Eastern Asia Society for Transportation Studies, 1(3), Autumn 1995.
[8] Hoogendoorn, S. P, and Daamen, W., (2005a) “Pedestrian Behavior at Bottlenecks,” Transportation Science, Informs, 39(2), 147-159.

American Journal of Civil Engineering 2017; 5(5): 282-292 292
[9] Hoque M. M. & Mahmud S. M. S. (2010), “Promoting vulnerable road users’ safety towards safe and equitable communities in Bangladesh”, InjPrev 2010; 16: A152 doi: 10.1136/ip.2010. 029215.545. British Medical Journal (BMJ Journals).
[10] Hughes, R. L. (2002) “A Continuum Theory for the Flow of Pedestrians.” Transportation Research Part-B, 36(6), 507–535.
[11] Lam, W. H. K. and Cheung, C., (2000) “Pedestrian Speed/Flow Relationships for Walking Facilities in Hong Kong, Journal of Transportation Engineering, ASCE, 126 (4), 343–349.
[12] Lam, W. H. K., Morrall, J. F., and Ho, H., (1995), “Pedestrian Flow Characteristics in Hong Kong’, Transportation Research Record 1487, TRB, National Research Council, 56-62.
[13] Laxman, K. Rastogi, R., and Chandra, S. (2010) “Pedestrian Flow Characteristics in Mixed Traffic Conditions." J. Urban Plann. Dev., 10.1061/(ASCE)0733-9488(2010)136: 1(23), 23-33. 72.
[14] Navin, F. P. D., and Wheeler R. J. (1969), “Pedestrian flow characteristics”, Traffic Engineering and Control, 39(9), 30-36.
Biography
A. M. Tahsin Emtenan is working as a
Lecturer of Civil Engineering Department in
Port City International University. He
graduated from Bangladesh University of
Engineering and Technology with a B. Sc.
degree in Civil Engineering in 2016. His
research interest focuses on Transportation
Engineering.
Showkat Ibne Shahid is working as an
Assistant Engineer in Bangladesh Water
Development Board. He graduated from
Bangladesh University of Engineering and
Technology with a B. Sc. degree in Civil
Engineering in 2016. His research interest
focuses on Transportation Engineering.