pearson’s x 2 correlation vs. x² (which, when & why) qualitative/categorical and quantitative...
TRANSCRIPT

Pearson’s X2
• Correlation vs. X² (which, when & why)
• Qualitative/Categorical and Quantitative Variables
• Contingency Tables for 2 Categorical Variables
• Research and Null Hypotheses for X2
• Causal Interpretation for X2 Results
• Computational stuff for hand calculations

Pearson’s r Vs. X2
Pearson’s Correlation (r)– 2 quantitative variables– LINEAR relationship– range = -1 to +1
Pearson’s Chi Square (X2)– 2 qualitative variables– PATTERN of relationship– range = 0 to + infinity
19
5
1
15
Turtle TypePainted
SnapperFood Preference
crickets
“duck weed”
Hours of Study Time
Tes
t Per
form
ance
(%
)

Practice -- would you use r or X2 for each of the following bivariate analyses?
Hint: Start by determining if each variable is qual or quant !
GPA & GRE
Age & Shoe Size
Preferred Pet Type & Preferred Toy Type
Leg Length & Hair Length
Age and Preferred Type of Pet
Gender & Preferred Type of Car
Grade (%) & Hrs. Study
r
X²
r
r
r
X²
ANOVA -- psyche!

With two qualitative variables we can display the bivariate
relationship using a “contingency table”
Puppy Type (col) Play (row) Sam
Ding
Ralf
Pit
Seff
…
Toby
work
hunt
hunt
work
hunt
..
hunt
tug
chase
tug
tug
chase
..
chase
Type of Dog Hunting Working
Fav
orit
e P
lay
S
ock-
Tug
Bal
l-C
hase

When examining a contingency table, we look for two things...
• whether or not there is a pattern
• if so, which row tends to “go with” which column?
Columns A B
R
ows
1
2
25 24
26 25
no pattern
Columns A B
R
ows
1
2
35 14
16 35
Pattern: A&2 B&1
Columns A B
R
ows
1
2
15 34
36 15
Pattern: A&1 B&2

Describe each of the following ...Boys Girls
Chi
ps
Cra
cker
s12 44
30 16
boys prefer chips & girls prefer crackers
Boys Girls
Chi
ps
Cra
cker
s
17 14
13 16
no pattern
Boys Girls
Chi
ps
Cra
cker
s
42 14
10 36
boys prefer crackers & girls prefer chips
Boys Girls
Chi
ps
Cra
cker
s
32 44
30 16
girls prefer crackers & boys have no preference

The Pearson’s Chi-square ( X² ) summarizes the relationship shown in the contingency table X² has a range from 0 to (infinity)
• 0.00 absolutely no pattern of relationship• “smaller” X² -- weaker pattern of relationship• “larger” X² - stronger pattern of relationship
However...– The relationship between the size of X² and strength
of the relationship is more complex than for r (with linear relationships)
• you will seldom see X² used to express the strength of the bivariate relationship

Stating Hypotheses with X2 ... Every RH must specify ...
– the variables– the specific pattern of the expected relationship– the population of interest– Generic form ... There is a pattern of relationship between X & Y, such that . . .
. . . . in the population represented by the sample.
Every H0: must specify ...– the variables– that no pattern of relationship is expected– the population of interest– Generic form ... There is a no pattern of relationship between X and Y in the
population represented by the sample.

Kittens Cats
Thr
ead
Fea
ther
s
For each of the following use <, > & = to portray the RH:
Kittens prefer feathers, whereas cats prefer thread
< >
Owners Workers
Dem
oc.
Rep
ub.
Owners tend to be Republican, while Workers show no preferencev =
Snakes Turtles
Liv
e
Dea
d
vSnakes prefer live crickets and turtles prefer dead crickets v

Dep Soc Anx
Gro
up
In
divi
d
For each of the following use <, > & = to portray the RH:
Depressed patients prefer group Tx while those with social anxiety prefer individual Tx
< >
Majors non-majors
Gra
de
pas
s/no
-pas
s
Majors tend to take the course for a a grade, while non-majors tend to take it pass/no-pass
v
UGrad Grad
Ess
ay
Mul
t cho
ice
vUndergraduate students prefer multiple choice tests, while graduate students don’t care
=
v

What “retaining H0:” and “Rejecting H0:” means ...
When you retain H0: you’re concluding…– The pattern of the relationship between these variables in
the sample is notis not strong enough to allow me to conclude there is a relationship between them in the population represented by the sample.
When you reject H0: you’re concluding…– The pattern of the relationship between these variables in
the sample isis strong enough to allow me to conclude there is a relationship between them in the population represented by the sample.

Deciding whether to retain or reject H0: when using X2 When computing statistics by hand
– compute an “obtained” or “computed” X2 value
– look up a “critical X2 value”
– compare the two• if X2 -obtained < X2 -critical Retain H0:• if X2 -obtained > X2 -critical Reject H0:
When using the computer– compute an “obtained” or “computed” X2 value
– compute the associated p-value (“sig”) – examine the p-value to make the decision
• if p > .05 Retain H0:• if p < .05 Reject H0:

Statistical decisions & errors with X2 ...
In the Population
that specific no any other
pattern pattern patternStatistical Decision
that specific
pattern (p < .05)
no pattern (p > .05)
any other pattern (p < .05)
Correct Decision
Correct Decision
Correct Decision
Type II “Miss”
Type II “Miss”
Type I
“False Alarm”
Type I
“False Alarm”
Type III“Mis-specification”
Type III“Mis-specification”
Remember that “in the population” is “in the majority of the literature” in practice!!

Testing X2 RH: -- different “kinds” of RH: & it matters!!!
“Pattern” type RH:
RH: More of those who do the “on web” exam preparation assignment will pass the exam, whereas more of those who do the “on paper” version fill fail the exam.
“Proportion” type RH:
RH: A greater proportion of those who do the “on web” exam preparation than of those who do the “on paper” version will pass the exam.
“Implied Proportion” Type of RH:
RH: Those who do the “on web” exam preparation will do better than those who do the “on paper” version.

Testing X2 RH: -- different “kinds” of RH: & it matters!!!
“Pattern” type RH:RH: More girls will prefer crackers and more boys will prefer chips.
“Proportion” type RH:RH: A greater proportion of girls than of boys will prefer crackers.
Boys Girls
Ch
ips
C
rack
ers
12 44
30 16
Both RH:s supported !!
Girls 44/60 = .73
Boys 12/42 = .29
Girls 44 > 16 & Boys 12 < 3
Boys Girls
Ch
ips
C
rack
ers
32 44
30 16
Only “Proportion” RH supported !!
Girls 44/60 = .73
Boys 32/62 = .52
Girls 44 > 16 But.. Boys 32 = 30
X2=19.93, p<.001X2=6.12, p=.013

Testing X2 RH: -- one to watch out for…
You’ll get… This is not a good way to express a X2 RH: !!!!
RH: More of those who do the “on web” exam preparation assignment will perform better on the exam than those who do the “on paper” version.
Sometime, instead of …
RH: A greater proportion of those do the “on web” exam preparation than of those who do the “on paper” version will pass the exam.
You have to be careful about these kinds of “frequency” RH:!!!
X2 works in terms of proportions, not frequencies! And, because you might have more of one group than another, this can cause confusion and problems…

Testing X2 RH: -- one to watch out for…
You’ll get… This is not a good way to express a X2 RH: !!!!
RH: More girls than boys will prefer crackers.
Boys Girls
Ch
ips
C
rack
ers
20 20
40 10
Instead of …RH: A greater proportion of girls than of boys will prefer crackers.
X2=9.00, p=.003
The number of boys & girls is same 20 = 20 …
But X2 tests for differential proportion of that category not for differential number of that category…
Girls 20/30 = .66 > .33 = 20/40 Boys
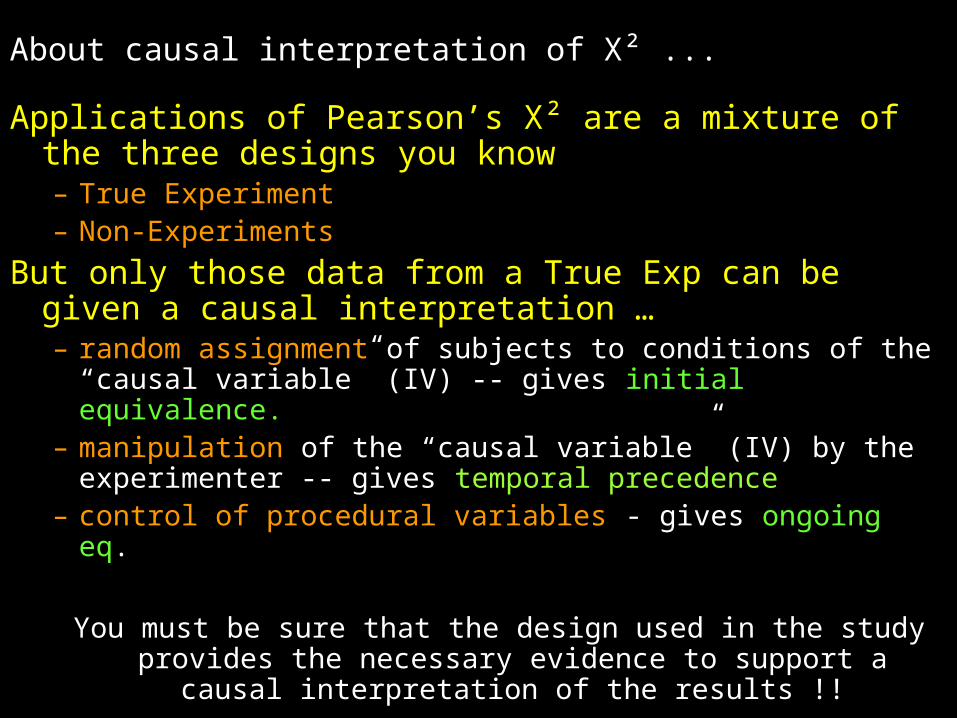
About causal interpretation of X² ...
Applications of Pearson’s X² are a mixture of the three designs you know– True Experiment– Non-Experiments
But only those data from a True Exp can be given a causal interpretation …– random assignment of subjects to conditions of the “causal
variable” (IV) -- gives initial equivalence.– manipulation of the “causal variable” (IV) by the
experimenter -- gives temporal precedence– control of procedural variables - gives ongoing eq.
You must be sure that the design used in the study provides the necessary evidence to support a causal interpretation of
the results !!

RH: Those who do the “on web” exam preparation assignment will perform better on the exam than those who do the “on paper” version.
Practice with Statistical and Causal Interpretation of X² Results
Paper Web
Fai
l
Pas
s
28
1122
39
X2 obtained = 5.47, critical X² = 3.84
Retain or Reject H0: ???
Support for RH: ???
Reject!
Yep ! 39/50 > 28/50
Design: Before taking the test, students were asked whether they had chosen to complete the “on Web” or the “on paper” version of the exam prep. The test was graded pass/fail. Type of Design ???
Causal Interpretation?
Natural Groups Design
Nope!
What CANCAN we say from these data ???
There’s an association between type of prep and test performance.

RH: More of those who do the “on web” exam preparation assignment will pass the exam and more of those who do the “on paper” version will fail.
Paper Web
Fai
l
Pas
s
21
2423
27
X2 obtained = .26, p = .612
Retain or Reject H0: ???
Support for RH: ???
Retain!
Nope !
Design: Students in the morning laboratory section were randomly assigned to complete the “on Web” version of the exam prep, while those in the afternoon section completed the “on paper” version. Student’s were “monitored” to assure the completed the correct version. The test was graded pass/fail.
Type of Design ???
Causal Interpretation?
Quasi Experiment
Nope!
What CANCAN we say from these data ???
There’s no association between type of prep and test performance.

RH: More of those who do the “on web” exam preparation assignment will pass the exam and more of those who do the “on paper” version will fail.
Paper Web
Fai
l
Pas
s
21
1423
37
X2 obtained = 6.12, p = .013
Retain or Reject H0: ???
Support for RH: ???
Reject!
Partial: 37 > 14, but 23 = 21
Design: One-half of the students in the T-Th AM lecture section were randomly assigned to complete the “on Web” version of the exam prep, while the other half of that section completed the “on paper” version. Students were “monitored” to assure the completed the correct version. The test was graded pass/fail. Only data from students in the T-TH AM class were included in the analysis.
Type of Design ???
Causal Interpretation?
True Experiment
Yep!
What CANCAN we say from these data ???
That type of prep influences test performance.

About calculations for hand computations…
Many find the X2 hand computations to be easier than the others !!!
This may be do to the near absence of ∑ notation !
Just be sure that you get the same “total” when calculated as the sum or row totals and the sum of column totals !!!
Paper Web Total
Tot
al
Fai
l
Pas
s
21
2423
27 48
47
44 51 95
95 = 48 + 47 = 44 + 51