pearson 2017 interim results€¦ · opm • 100% digital ... centre to optimise product...
TRANSCRIPT
Forward-looking statements
Except for the historical information contained herein, the matters discussed in this statement
include forward-looking statements. In particular, all statements that express forecasts, expectations
and projections with respect to future matters, including trends in results of operations, margins,
growth rates, overall market trends, the impact of interest or exchange rates, the availability of
financing, anticipated costs savings and synergies and the execution of Pearson's strategy, are
forward-looking statements. By their nature, forward-looking statements involve risks and
uncertainties because they relate to events and depend on circumstances that will occur in future.
They are based on numerous assumptions regarding Pearson's present and future business
strategies and the environment in which it will operate in the future.
There are a number of factors which could cause actual results and developments to differ materially
from those expressed or implied by these forward-looking statements, including a number of factors
outside Pearson's control. These include international, national and local conditions, as well as
competition. They also include other risks detailed from time to time in Pearson's publicly-filed
documents and you are advised to read, in particular, the risk factors set out in Pearson's latest
annual report and accounts, which can be found on its website (www.pearson.com/investors).
Any forward-looking statements speak only as of the date they are made, and Pearson gives no
undertaking to update forward-looking statements to reflect any changes in its expectations with
regard thereto or any changes to events, conditions or circumstances on which any such statement is
based. Readers are cautioned not to place undue reliance on such forward-looking statements.
1

2017
Half Year Results
Presentation
4th August 2017
Image by Christof van der Walt

Agenda
• Half year financials
• Transformation and strategic priorities
• Q&A
3
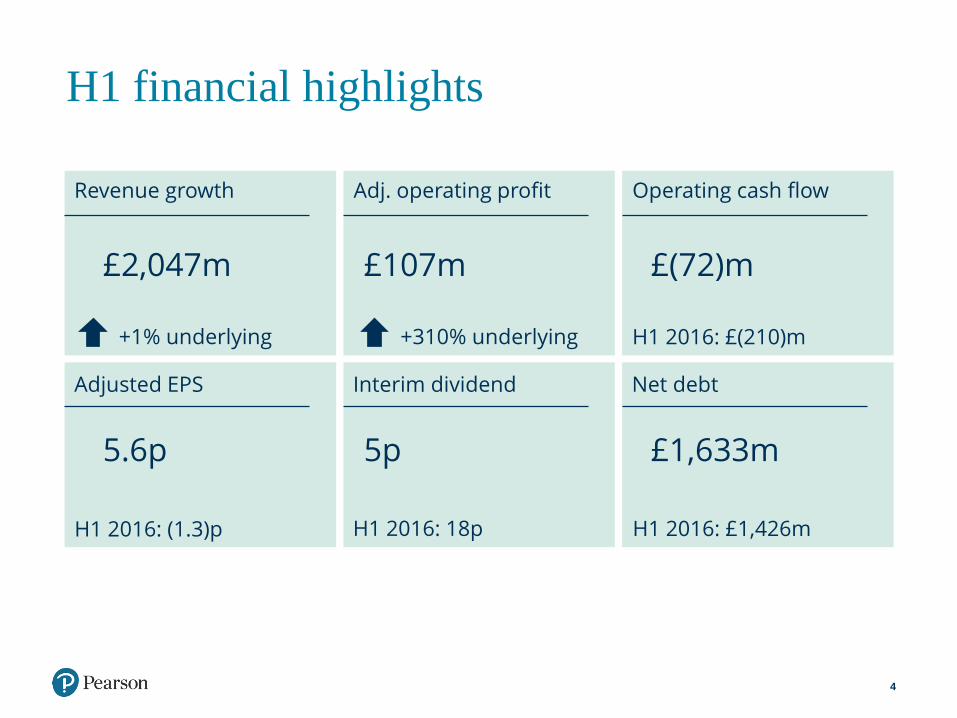
H1 financial highlights
4
Re
Revenue growth Adj. operating profit Operating cash flow
Adjusted EPS Interim dividend Net debt
+1% underlying
£2,047m £107m
+310% underlying H1 2016: £(210)m
£(72)m
H1 2016: (1.3)p H1 2016: 18p
5.6p 5p £1,633m
H1 2016: £1,426m
Our priorities
• Simplify the portfolio
• Maximise the value of text
• Next phase of transformation
5

Our strategy
The demand for accessible and effective education is greater than ever before. Our
customers are struggling to address these issues.
We are accelerating our shift to digital to meet these challenges
6
Powered by services and technology
Content AssessmentMore effective teaching and personalized
learning at scale

Shift to digital
7
Simplification
• Reduced number of applications and systems
• Standardisation of processes
• Enhancing user experience
• Digital customer leadership
• Faster digital product development
• Simplifying the business and focusing on our biggest opportunities
• Streamline HR and Finance through shared service centres
• Leaner organisation and agile decision making
• Centralisation of procurement
• Reduction of office locations
Our actions
Talent

Our opportunity
8
Courseware Assessment Services
US School Assessments
• Over 50% of volume from digital testing
• TestNav 8 industry leading digital platform
OPM
• 100% digital
• Global leader with 40 global partners and over 250 programs
US Higher Ed
• Leader with c.50% of revenues from digital
• c.11m digital subscribers
• C.100 DDA deals signed in H1 +34% YoYM
ark
et
Po
siti
on
• Multi-year contract based
• Improved margins in digital
• Multi-year contract based
• Bigger share of value chain
• 3rd party channel moving to direct to student and institution
• Close the gap between usage and value
Bu
sin
ess
Mo
de
l

H1 Financial Review
H1 financial review - agenda
• Sales performance – underlying +1%
• Profit performance – showing benefit of 2016 restructuring
• Guidance unchanged – H1 performance in line with expectations
• Capital allocation - balance sheet, Penguin Random House, dividend
• Cost actions – £300m of 2020 cost savings
10

Sales
11
£m H1 2017 H1 2016CER
growthUnderlying
growth
North America 1,285 1,164 (1)% 0%
Core 384 370 (1)% 1%
Growth 378 332 2% 1%
Total sales 2,047 1,866 0% 1%

Operating profit
12
£m H1 2017 H1 2016CER
growthUnderlying
growth
North America 43 2 n/a n/a
Core 10 (7) n/a n/a
Growth 8 (12) n/a n/a
Penguin Random House 46 32 28% 28%
Total 107 15 447% 310%

Profit movements £m
13
2015 Trading and
timing
Column1 FX Net
Headwinds
and Inflation
Restructuring
cost savings
2017H1 2016adjusted operating
profit
Trading ex Penguin Random House
FX Inflation and other
operational factors
2016restructuring cost saving
H1 2017 adjusted operating
profit
15
23
25 (50)
85 107
Penguin Random House
9

Guidance unchanged
2017
• Operating profit £546m-£606m* and adjusted earnings per share of 45.5p to
52.5p*
• Adjusted for the expected dilution of £24m and 3p of the Penguin Random
House transaction
• £300m buyback - limited impact on 2017
• As usual, our large H2 remains critical
• Exchange rate sensitivity: A 5c movement in the US Dollar has a c.2p impact
on EPS
14
* Based on 31st December 2016 exchange rates

Operating and free cash flow
15
£m H1 2017 H1 2016 var
Operating profit 107 15 92
Working capital (excl. restructuring) (174) (169) (5)
- of which pre-publication expenditure (8) (36) 28
- of which other working capital (166) (133) (33)
Net capital expenditure (111) (113) 2
Depreciation 79 67 12
Share of operating results of associates (58) (40) (18)
Dividends from associates and JVs 60 24 36
Exchange (6) 2 (8)
Other movements 31 4 27
Operating cash flow (72) (210) 138
Tax paid (33) (53) 20
Finance charges (39) (18) (21)
Restructuring expenditure (24) (55) 31
Special pension contribution net of tax (174) (72) (102)
Free cash flow (342) (408) 66

Balance sheet
16
£m H1 2017 H1 2016
Goodwill & intangible assets 3,266 5,616
Tangible fixed assets 315 339
Investment in Joint Ventures and Associates 1,214 1,192
Operating working capital 872 890
Other net liabilities (120) (84)
Net assets 5,547 7,953
Shareholders’ funds 3,957 6,457
Pensions (181) (302)
Other provisions 94 103
Non-controlling interest 5 3
Deferred tax 39 266
Net debt 1,633 1,426
Capital employed 5,547 7,953
Total business before transfer to held for sale

Capital Allocation

• Declaring 5p interim• £300m share buy back announced from
disposal proceeds
• <1.5x net debt/EBITDA
• c.£700m-£750m investment
Capital allocation priorities
• Continue to invest in the business to drive sustainable growth
Shareholder returns• Sustainable and progressive dividend
policy• Surplus capital returned via buyback or
special dividend
18
• Maintain a strong balance sheet and solid investment grade credit ratings
Priority Approach

Our balance sheet
• Strong funding position
• Committed bank facility $1,750m to 2021
• Gross debt c.$2,600 m in 5 bonds 2018-2025
• $550m 2018 bond acquired Q1 2017
• Calling $300m bond due 2018
• Launching market tender for $500m 2022 and $500m 2023 bonds
• Well funded pension scheme - worldwide accounting surplus £181m at 30th June
2017
19

Interim dividend
Dividend policy
A sustainable dividend comfortably covered by the earnings of our business
excluding Penguin Random House…
…that can grow progressively in line with the cash generation of the business.
The Board will set a 5p Interim dividend for 2017
Our final dividend will be set in February 2018 with reference to both our dividend
policy and performance of the business in the second half of 2017
Dividend dates
Ex Dividend 17th August 2017
Record 18th August 2017
Payment 15th September 2017
20

2017 – 2019
Restructure Plan

Shift to digital
Making Pearson a simpler and more agile
business
22
Simplification
• Reduction in application stack and decommission legacy applications
• Creation of offshore Content Services Centre to optimise product development
• Move from fragmented and manual processes to standardised processes
• Build on shared service centres for Finance, HR and Technology and further outsourcing of transactional activities
• Further centralise procurement and consolidate key suppliers
• Significant reduction in office locations and greater use of serviced offices
• Reduce headcount by c. 3,000 FTEs* with a focus on managerial positions
* Full time equivalent
c.£300m of annualised savings exiting 2019

Phasing of savings
Restructuring costs:
c.£70m c.£90m c.£140m
23
2018 2019 2020
Annual cumulative savings
2017
c.£70m
c.£200m
c.£300m

H1 financial highlights
24
Re
Revenue growth Adj. operating profit Operating cash flow
Adjusted EPS Interim dividend Net debt
+1% underlying
£2,047m £107m
+310% underlying H1 2016: £(210)m
£(72)m
H1 2016: (1.3)p H1 2016: 18p
5.6p 5p £1,633m
H1 2016: £1,426m

Q&A

Appendices
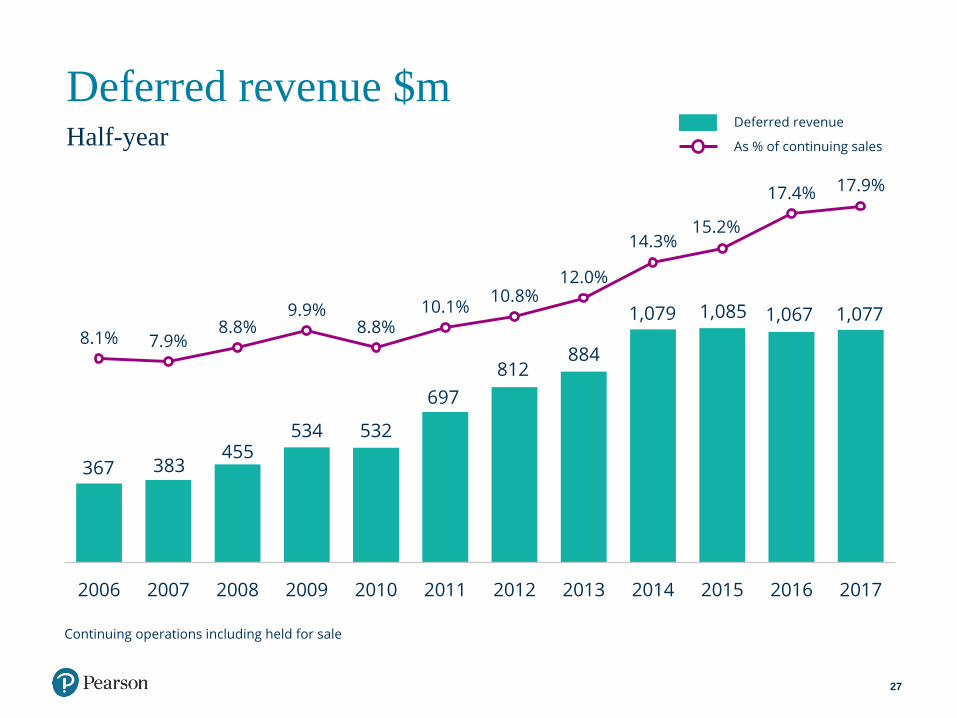
Deferred revenue $mHalf-year
27
8.1% 7.9%8.8%
9.9%8.8%
10.1%10.8%
12.0%
14.3%15.2%
17.4% 17.9%
-0.05
0
0.05
0.1
0.15
0.2
0
200
400
600
800
1000
1200
1400
1600
1800
2006 2007 2008 2009 2010 2011 2012 2013 2014 2015 2016 2017
367 383455
534 532
697
812884
1,079 1,085
Continuing operations including held for sale
1,067
As % of continuing sales
Deferred revenue
1,077

Adjusted EPS
28
£m H1 2017 H1 2016Headline
growth
Operating profit 107 15 92
Interest (47) (27) (20)
Taxation (13) 2 (15)
Tax rate 21% 19%
Profit after tax 47 (10) 57
Minorities (1) (1) -
Adjusted earnings 46 (11) 57
Shares in issue (millions) 815.0 815.0
Adjusted EPS 5.6p (1.3)p 6.9p

There’s so much
more to learn
Find out more about us at
pearson.com