pearls manual - ilcu foundationilcufoundation.ie/wp-content/uploads/2017/02/pearls-manual.pdf ·...
TRANSCRIPT

PEARLS Manual
Isabelle Kidney December 2016

PEARLS Manual
1
Contents
Acknowledgements ................................................................................................................................. 2
Acronyms ................................................................................................................................................ 3
Preface .................................................................................................................................................... 4
1. Introduction .................................................................................................................................... 4
2. PEARLS Ratios .................................................................................................................................. 5
What is as ratio and how does it help us? .......................................................................................... 5
Protection ........................................................................................................................................... 6
Effective Financial Structure ............................................................................................................. 11
Asset Quality ..................................................................................................................................... 16
Rates of Return and Costs ................................................................................................................. 20
Liquidity ............................................................................................................................................. 25
Signs of Growth ................................................................................................................................. 27
3. Using PEARLS ................................................................................................................................. 31
Application of PEARLS ....................................................................................................................... 31
Routine Reporting ............................................................................................................................. 32
PEARLS and Regulation ..................................................................................................................... 35
Limitations of PEARLS ....................................................................................................................... 36
4. Conclusion ..................................................................................................................................... 37
Bibliography .......................................................................................................................................... 38
List of Tables
Table 1. PEARLS Report Format ............................................................................................................ 32
Table 2. Sample Format for Analysing PEARLS Performance ............................................................... 33
Table 3. Sample Format for Analysis and Assessment of PEARLS Ration Change ................................ 34
List of Figures
Figure 1. Example of SACCO's Institutional Capital Ratio, 2013-2016 .................................................. 34

PEARLS Manual
2
Version Version 1.0
Audience Internal / partners / trainers
Written by Isabelle Kidney based on resources developed by Liam Morrissey, Dave Hewson, Ted O’Sullivan as well as WOCCU resources
Approved by Irina Ignatieva
Date/Last Updated 06.12.2016
Acknowledgements
The Irish League of Credit Unions Foundation would like to acknowledge the World Council of Credit Unions (WOCCU) in formulating the PEARLS evaluation programme on which this resource is based.

PEARLS Manual
3
Acronyms
CAMEL Acronym developed by the NCUA, the letters stand for Capital Ade-quacy, Asset Quality, Management, Earning, Liquidity and Asset Liability management and Sensitivity to market
CU Credit Union
ILCUF Irish League of Credit Unions Foundation
NCUNA National Credit Union Association (USA)
PEARLS Acronym developed by the World Council of SACCOs for their set of fi-nancial ratios. P = Protection, E = Effective Financial Structure, A = Asset Quality, R = Rates of Return and Cost, L = Liquidity, S = Signs of Growth.
SACCO Savings and Credit Cooperative Organisation
WOCCU World Council of SACCOs

PEARLS Manual
4
Preface
This document provides an introduction to PEARLS ratios with additional explanations and examples for officers who are new to or are becoming familiar with their use. It provides suggestions for report-ing formats and outlines the different ways in which PEARLS ratios can be used by different stakehold-ers. It addresses the need for providing expanded practical explanations which can be used by trainers and officers. Some of the PEARLS ratios set out below have been amended in terms of their configu-ration and targets to suit emerging movements or developing country scenarios (these are highlighted as such).
1. Introduction
Unlike other businesses, financial institutions are a distinct in that they hold peoples’ money in trust. Thus, ensuring that the institution is financially safe, sound and sustainable is paramount. The state understandably takes an interest in the stability of financial institutions and their ability to guard against the particular risks that apply to them. At a micro level, risks include jeopardizing peoples’ savings while at a macro level financial institution collapse or threatened collapse can potentially create a shock for the wider economic system. A study on corporate financial crises found common failures that led to their downfall included that management paid no attention to ratios, they had cash flow and liquidity issues and were not comparing themselves with their peers.1 Utilising ratios can help to reduce risks and ultimately improve the market share of SACCO movements.
Beyond measures of profitability, the World Council of Credit Unions (WOCCU) developed a set finan-cial ratios, known as ‘PEARLS’ ratios, which have been consolidated into an evaluation program.2 The objective of PEARLS ratios is to quantitatively assess key risk areas and to measure and monitor the financial health of Savings and Credit Cooperatives (SACCOs). By using these ratios on a regular basis, SACCOs can make business decisions which will help them move towards an ideal financial statement structured to produce ‘healthy ratios’ and withstand shocks. Primary uses of PEARLS include the fol-lowing:
a) Timely warning system b) Compliance check c) Financial planning d) Peer SACCO comparison
While ratios provide an objective appraisal, they are not a guarantee of financial stability. Key reasons why this might be the case include, firstly, that there may be practices in the SACCO which hide im-portant financial weaknesses, for example, there may be understating of weak loans by continuous rescheduling and making them look like they are performing better than they actually are; and sec-ondly, that even strongly performing SACCOs with good financial ratios can be subjected to shocks such as a sudden collapse in the value of the investments, buildings, an economic crisis or fraud. Thus, while ratios can provide a good indication of the financial health of a SACCO, it is important not to rely exclusively on ratio analysis. Other aspects of assessment include such as on-site examination covering the key elements of loan book appraisal, internal controls and governance.
This document aims to assist activists, practitioners and volunteers in SACCO movements to under-stand the purpose and operation of this statistical measurement system commonly referred to as PEARLS. This manual will help to increase understanding of the PEARLS ratio framework, and develop
1 Cahill, E., (1997), Why Companies Fail: Corporate Financial Crises in Ireland (Gill & McMillan, Dublin) 2 2009, WOCCU, Richardson, D. C., PEARLS Monitoring System from file:///C:/Users/User/Downloads/pearls_mono-
graph.pdf

PEARLS Manual
5
skills to conduct ratio analysis and appraisal.
2. PEARLS Ratios
PEARLS is a monitoring system comprised of 46 quantitative financial indicators (‘ratios’) that facili-tate an analysis and interpretation of the financial condition of any SACCO.3 The suite of ratios have been expanded and altered over the years to cover new developments. Each ratio has an associated goal which is the recommended prudential standard. The target goal, or ‘standard of excellence’ for each ratio put forth by WOCCU based on its field experience with successful SACCOs.4 The ratios come under the following headings:
P – Protection
E – Effective Financial Structure
A – Asset Quality
R – Rates of Return & Costs
L – Liquidity
S – Signs of Growth
Each letter, signifying a specific theme, has a number of ratios designed to provide analysis of perfor-mance in relation to that particular area. Note, different SACCO movements may use some but not all of the ratios, and indeed may alter the targets or ratio composition itself to suit their environment and stage of development.
What is as ratio and how does it help us?
Financial strengths and weaknesses of a SACCO might not be immediately evident all those expected to appraise a financial statement. But with the help of ratios, performance can be easily more as-sessed. To start, it is necessary to understand the idea behind a ratio. A ratio is simply the relationship between two numbers of the same kind. For example if there are four oxen in a field, one coloured white and three brown. Then it is correct to say that one in four of the oxen is white. This can be expressed in a number of ways.
The ratio of white oxen to total oxen is 1:4 (stated as ‘a ratio of one to four’)
It can be expressed as a fraction i.e. ‘a ¼ (or a quarter)’ of oxen are white
It can be shown as a decimal. In this case: 0.25 - this is calculated by dividing the first number by the second one in the relationship.
It can be shown as a percentage. This is calculated by dividing the first number by the second and multiplying it by 100. In this example 25% of oxen are white. This is the equivalent saying ‘twenty five in every hundred.’
All these methods are valid and useful. When calculating PEARLS ratios, the percentage method is used, although the ‘%’ sign is normally dropped, so if a ratio works out a ‘5%’ it is shown typically as ‘5’. This is to make it easy to read and follow.
In general, in order to calculate useful ratios there are three steps involved, (1) identify the user, 3 2007, Grace, D., Analysis of the SACCO Balance Sheet & PEARLS, (presentation), slide 11 4 WOCCU, http://www.woccu.org/financialinclusion/pearls/aboutpearls paragraph 3, accessed on 19.10.2016

PEARLS Manual
6
their information needs and the relevant ratios, (2) calculate the appropriate ratios, and (3) interpret and evaluate the results. This last step will involve examining the ratio in conjunction with an appro-priate benchmark, peer performance, trend or other basis for comparison and incorporating any other information that may be relevant to form a judgment. This might include for example compar-ing the ratio to the same period last year, comparing it to the budget or target as set by the SACCO’s strategic plan for the year or indeed comparing it to other SACCOs of the same type and size. Steps one and two are relatively straightforward; it is step three that requires the most skill and is usually gained through practice and experience. The PEARLS system provides benchmarks which help to assess whether SACCO is under / over performing. The following section explains the PEARLS ratios and provides examples of calculating key ratios.
Protection
Protection is about ensuring members have a safe place for their money. The statistics generated by the ‘P’ ratios aim to measure several aspects of the effectiveness of the management of the SACCO. The P ratios consist of 6 main ratios measuring the quality of the loan portfolio, financial investments management and adequacy of provisions. They cover areas such as loan delinquency, loan provisions, loan write offs and loan recoveries. The following table sets out the ratios relating to ‘P’ as developed by WOCCU.
P - Protection5 Goals (Excellence)
P1. Loan Losses Allowances / Delinquency >12 Months 100%
P2. Net Loan Loss Allowances / WOCCU Allowance Required for Delin-quency 1-12 Months6
35%
P3. Complete Loan Charge-off of Delinquency > 12 Months Yes
P4. Annual Loan Charge-offs / Average Loan Portfolio Minimized
P5. Accumulated. Charge-offs Recovered / Accumulated. Charge-offs > 75%
P6. Solvency (Net Value of Assets/Total Shares & Deposits)7 ≥ 111%
Adequate protection of assets is a basic tenet of the SACCO. Protection against loan losses is deemed adequate if a SACCO has sufficient provisions to cover 100% of all loans delinquent for more than 12 months, and 35% of all loans delinquent for 1-12 months. Inadequate loan loss protection produces two undesirable results: inflated asset values and fictitious earnings. However, many SACCOs are not eager to recognize loan losses, and much less, to charge them off against earnings. That unwilling-ness leads to widespread abuse of the principles of safety and soundness. Reported net income is overstated, asset values are inflated, provisions for loan losses are inadequate, and member savings are not adequately protected.
5 2016, WOCCU, Protection Ratios http://www.woccu.org/financialinclusion/pearls/aboutpearls accessed on 19.10.2016 6 Why Make Provision for Doubtful Debts? The following are some of the reasons for making a provision for doubtful debts, (1) The integrity of the balance sheet: to present a true and fair reflection of the company, (2) prudence: to act in a way that is cautious and sensible about accounts and about the disclosure of information, (3) solvency: to give a more accurate picture of solvency, (4) to measure risk: accurately the A1 ratio is reduced and so the financial risk is more accurately revealed. 7 Full formula is [(Total Assets + Total Allowances) - (100% of Loans Delinquent > 12 Months + 35% of Loans Delinquent from 1–12 Months + Total Liabilities + Problem Assets) - Deposits] / Total Shares and Total Deposits

PEARLS Manual
7
It is important to have specific loan loss reserves in place to off-set losses that are caused by arrears and under- performing loans. These reserves are separate, and additional to, capital reserves. Many SACCOs are not concerned about the inadequacy of their allowances for loan losses since they view their capital reserves as the primary source of protection against loan losses. This erroneous idea is changing as management becomes convinced that it is much easier and less painful to use the allow-ances for loan losses as the primary source of protection, rather than (as in some instances) having to get approval from the membership to diminish capital reserves because of losses. WOCCU promotes the principle that the allowance for loan losses is the first line of defense against non-performing loans. The following section outlines some calculations of the P ratios.
P1 and P2: Loan loss reserve as % of arrears (KEY RATIOS)
The loan book is the main area of risk for SACCOs and SACCOs, so it is vital that a provision is set aside to cover loan losses. It is best practice for SACCOs to maintain a specific reserve to cover loan losses. This loan loss reserve should be based on the level of loan arrears in the SACCO, that is, the higher the level of loan arrears, the larger is the loan loss reserve. When arrears are reduced, less of a loan loss reserve is required.
The recommended practice is that 35% of loans in arrears for 3 to 12 months are set aside in loan provision reserve. For longer term arrears, where loans are in arrears for more than 12 months, the recommended best practice is that 100% of these longer term loan arrears are set aside in loan provi-sion reserve. Effectively, loans that have had no repayments for over a year, for accounting purposes, are classified as ‘non-performing’ (however, even if they are written off, the SACCO must, where fea-sible and appropriate, still pursue these loans. This is to guard against contagion (so that borrowers do not think that writing off a loan is the same thing as cancelling a loan obligation or providing loan forgiveness); and also because written-off loans that are subsequently repaid can be an important source of income).
Purpose: To ensure that the SACCO is meeting bad debt provisioning requirements with respect to non-performing loans.
Calculation of ratio: a: Loan Loss Reserve (from balance sheet) b: 100% of loans in arrears 12 months or more Formula: _ a__ x 100 b Example: a: Loan Loss Reserve (from balance sheet) = 400,000 b: 100% of loans in arrears 12 months or more = 200,000 Example P1 Ratio ___ 400,000____ x 100 = 50 200,000 Goal: Minimum P1 ratio: 100%. The loan loss reserve should additionally consist of an amount for delinquent loans of under 1 year.
In this example, the loan loss reserve is too low and measures should be taken to raise the loan loss reserve. The loan recovery process needs immediate attention as well.

PEARLS Manual
8
For a full appraisal of whether or not the loan loss reserve is sufficient, delinquent loans that have fallen into arrears of between 3 and 12 months need to be added into the equation.
The minimum loan loss reserve level = 35% of loans in arrears 3 to 12 months + 100 % of loans in arrears 12 months or more
Purpose: To ensure that the SACCO is meeting bad debt provisioning requirements.
Calculation of ratio: a: Loan Loss Reserve (from balance sheet) b: 35% of loans in arrears 3 to 12 months. C: 100% of loans in arrears 12 months or more Formula: _ a__ x 100 (b+c) Example: a: Loan Loss Reserve (from balance sheet) = 400,000 b: 35% of loans in arrears 3 to 12 months = 300,000 c: 100% of loans in arrears 12 months or more = 200,000 Example P1 Ratio ___ 400,000____ x 100 = 80 (300,000+200,000) Goal: Minimum P1 ratio: 100%
It is recommended that a SACCO maintain this ratio at 100 as a minimum. A P1+ P2 score below 100 means that the SACCO, as in this example, is not meeting the minimum recommended loan provision levels.
A P1 +P2 score of above 100 means that a SACCO has surplus loan loss reserves in place. It is prudent to maintain surplus loan loss reserves in order to cover unforeseen loan losses.
When considering how to provide for doubtful debts/loans it is well to remember that there are a number of ways to calculate a suitable provision. To undertake a basic standard provision calculation in line with WOCCU guidelines, carry out the following steps:
1. Go through the loan book one loan at a time. Is it over 3 – 12 months in arrears? Mark ‘X’ for ‘non-performing’ loans with any outstanding late payments 3 – 12 months, and mark ‘XX’
for loans that have not been performing for 12 months or more, and tick ‘✓’ for ‘performing’ loans or loans that do not have arrears of over 3 months.
2. If a loan has been ticked ‘X’ - add the total outstanding amount of that loan to a ‘3 – 12 non-performing loans list’, and if a loan has been ticked ‘XX’ - add the total outstanding amount of that loan to a ‘12 non- performing loans list’.
3. When this has been done for all the loans, add up the amount outstanding from all the loans that are not performing perfectly.
4. Multiply the ‘X’ list total by 0.35, and the ‘XX’ list total by 1.00 to get an estimation of the SACCO’s doubtful debts.

PEARLS Manual
9
This WOCCU Basic Standard Provision calculation of 35% will do until a full aging of arrears calcula-tion can be done.
An Alternative System: Aging of Arrears
The WOCCU basic standard calculation is satisfactory where more sophisticated calculations cannot be produced. Where the skills and experience are sufficient, an alternative method of calculating loan loss reserves, known as ‘aging of arrears’ is recommended. It is generally accepted that the longer the loan is past due, the higher the provision made against it is (because of the associated higher risk of default). Provisions for loans in arrears using the ‘aging of arears’ method starts with categorising outstanding loan balances according to how long repayments have been outstanding. Provisions are then calculated by reference to the net loan balance in respect of each time-period category e.g. as follows:
Category Provision 0-9 weeks: 0% of net loan balances 10-18 weeks: 10% of net loan balances 19-26 weeks: 20% of net loan balances 27-39 weeks: 40% of net loan balances 40-52 weeks: 60% of net loan balances >= 53 weeks: 100% of net loan balances
The provision percentage is set based on the experience of the likelihood of an overdue loan turning into a defaulted loan.
EXAMPLE
A 12,000 shilling loan has to be paid back in equal instalments of 1,000 shillings on a monthly basis over a year. At the end of six months, half the principal, 6,000 shillings should be repaid. However, three instalments have been missed and 9,000 shillings rather than the scheduled 6,000 shillings is outstanding. It is also fourteen weeks in arrears. This means that we must make a provision for delin-quency in regard to the loan.
In this case using aging of arears (see table above) we provide 10% of the outstanding balance, 900 shillings, as a delinquent debt to be set aside for loan loss provision. (Using the WOCCU basic standard calculation of 35%, a considerably higher figure – 3,150 shillings – would need to be set aside).
The following table is an example of an aging schedule for a portfolio of 40 million shillings.
Number of Weeks Outstanding
Shillings Million
Provision to Be Set Aside %
Bad Debt Provi-sion: Total
0 – 9 WEEKS 40.00* 0 0
10-18 WEEKS 2.00 10% 0.2
19-26 WEEKS 1.00 20% 0.2
26-39 WEEKS 1.00 40% 0.4
40-52 WEEKS 1.00 60% 0.6
OVER 1 YEAR 0.00 100% 0
TOTAL PORTFOLIO 45.00 1.4

PEARLS Manual
10
* Most of the repayments are at zero weeks in arrears - this category includes those that are being paid on time or are under 9 weeks late not ‘overdue’ from the provisioning perspective. From a delinquency management perspective, loans that are one day late are important to follow up on immediately.
The result of this calculation is that 1.4 million shillings should be set aside as Bad Debt Provision in the aging of arears case shown above. Note, this loan loss reserve equates to 31% of the loans outstanding between 3 – 12 months. If the SACCO had used the simpler WOCCU calculation, the loan loss provision would automatically be set at 35% and thus could have cost the SACCO more. Thus it is often financially beneficial to work from an ‘aging of arrears’ basis, rather than the WOCCU basic standard calculation. However, the provisioning requirements may be set by the regulator.
If the more complex ‘aging arrears’ system is not in place, it is recommended that that you use the WOCCU basic standard provision and multiply the outstanding loans in arrears 3 – 12 months by 0.35. This infers that just over a third of loans that are not up-to-date on their repayments will even-tually default and will never be repaid. Add to this, loans overdue by 12 months or more and multi-ply by 1.00 as outlined above.
P6 Solvency (Net value of assets / Total savings)
Solvency refers to a situation where an enterprise or individual has sufficient value in assets to pay its creditors and other financial obligations. In the event that SACCO closes, it is very important that it has enough financial resources to pay off all its debtors (staff, members’ savings and shares etc.).
Purpose: This ratio measures the degree of protection that the SACCO has for member savings in the event of liquidation of the SACCO’s assets and liabilities (which would happen if the SACCO closed). In other words, if a SACCO collapsed or had to be shut down, would the net value of the SACCO’s assets cover the SACCO’s member savings and other liabilities? Would all members be repaid? The ratio highlights if the SACCO has assets in excess of its liabilities, i.e. whether it is solvent.
This should be a widely used ratio as it provides comfort and confidence for SACCO members.
Calculation of ratio: a: Total Assets b: Loan loss reserve c: 35% of loans in arrears 3 to 12 months d: 100% of loans in arrears 12 months or more e: Borrowings f: Other liabilities g: Total Savings Formula: [(a+b)-(c+d+e+f)] x 100 (g) Example: a. Total Assets = 6,600,000 b. Loan loss reserve = 400,000 c. 35% of loans 3-12 months in arrears = 300,000 d. 100% of loans 12 months + in arears = 200,000 e. Borrowings = 1,500,000 f. Other liabilities = 200,000 g. Total Savings 4,300,000 Example P3 Ratio [(6,600,000+400,000)-(300,000+200,000+1,500,000+200,000)] x 100 = 111.6 4,300,000 Goal: WOCCU best practice suggests that this ratio should be maintained at a minimum level of 111% (100% to cover savings & other money owed plus 11% to cover the costs incurred in the process of closure).

PEARLS Manual
11
In this example, the SACCO has the ability to pay all of its debts if required. The reason why this ratio needs to be over 100 is because of the additional and sometimes quite considerable costs involved in closing down a SACCO and meeting all its legal obligations. The additional 11% is deemed sufficient to cover such costs, but this additional percentage required can vary from jurisdiction to jurisdiction.
Effective Financial Structure
The financial structure of the SACCO is the single most important factor in determining growth po-tential, earning capacity, and overall financial strength. The ‘E’ ratios measure assets, liabilities and capital; and recommends an ‘ideal’ financial structure for SACCOs. Assets are anything owned by the business or owed to the SACCO e.g. members’ loan portfolio, bank deposits or investments, prepayments and non-earning but important assets such as buildings and equipment. Liabilities are anything owed by the SACCO e.g. a bank overdraft, creditors, deposits with the SACCO, member shares in the SACCO (because these can be claimed by the member), accruals, etc. Capital is the retained earnings built up over time by the SACCO itself set aside for absorbing loss, making invest-ments in non-productive assets and also for funding productive assets (such as the loan portfolio) – although normally a minimum amount of capital must be legally set aside and this must be kept separately. As a SACCO grows and generates surpluses the amount of surplus retained in the SACCO called ‘reserves’ will be added to the capital. On the balance sheet, capital is the total value of the assets less liabilities.
In relation to assets, it is recommended that productive assets are composed mostly of loans (70-80%), with some liquid investments (e.g. cash in short term deposits or financial instruments) set aside comprising around 10-20% of assets, and around 5% of asset value in unproductive assets composed of primarily fixed assets (land, buildings, equipment etc.). Clearly, this will not be possible at all stages of the development of the SACCO as some points will require substantial investments for example when it is purchasing its building. However the principle idea is that the composition of assets should be focused on generating a return. In other words, SACCOs are encouraged to max-imize productive assets as the means to achieve sufficient earnings. Since the loan portfolio is the most profitable asset of the SACCO, WOCCU recommends that most assets fall into this category. Excess liquidity is discouraged because the profit margins on liquid investments (e.g., savings ac-counts) are significantly lower than those earned on the loan portfolio. Non-earning assets, while necessary, should not make up a disproportionately high proportion of assets.
On the liabilities side, the main component should be member deposit savings. A healthy percent-age of deposit savings (e.g. 70-80%) indicates that the SACCO has developed effective marketing or ways of attracting savings and is on its way to achieving financial independence. It can indicate that members are no longer ‘saving’ just in order to borrow money, but are instead saving because of the competitive rates offered.
Capital has three purposes, (1) to finance non-earning assets: Since the institutional capital has no interest cost, its primary function is to finance all non-income generating assets of the SACCO (i.e., land, buildings and equipment), (2) improve earnings - institutional capital also has a powerful effect on the SACCO's capacity to generate net income and hence, additional capital. With no explicit in-terest cost, capital that is lent out at market interest rates provides a significant return to the SACCO. The use of this institutional capital to finance productive assets (e.g., loans) is thus very profitable for the SACCO. Institutional capital can be generated much faster than by relying only on the slim margins from deposit savings. (3) absorb losses - as a last resort, institutional capital is used to absorb losses from loan delinquency and/or operational deficits. In some countries, the law re-quires that any reduction in institutional capital from losses must be approved by the General As-sembly. This can be a painful and oftentimes, fatal experience for SACCO management. Conse-quently, it makes much more sense to create adequate loan loss provisions in order to deal with

PEARLS Manual
12
non-performing loans. The PEARLS measurement of institutional capital is a key ratio that is linked to a number of other operational areas. If deficient, it can quickly signal where potential weaknesses might exist in other areas of the operation.
This ratio heading measures the balance that a SACCO has achieved in raising funds and how it has invested these funds. There are nine ratios measuring these most important accounts on the bal-ance sheet relating to assets, liabilities, and capital accounts. These include for example the loan portfolio (E1), the external debt (E4) and internally generated resources available to the SACCO (E 5). As growth occurs, keeping these ratios in line helps to prevent structural imbalances.8 The most effective way to maintain the ideal balance between productive and unproductive assets is by in-creasing the volume of productive assets. The following table sets out the ratios relating to ‘E’ (E1, E2, E3, E7, E8, E9 are the standard WOCCU ratios and E4, E5 and E6 are adjusted and shown here slightly differently in a way that is more appropriate in the context of emerging movements or de-veloping country scenarios).
E - Effective Financial Structure9 Goals (Excellence)
E1. Net Loans / Total Assets 70-80%
E2. Liquid Investments / Total Assets < 10%
E3. Financial Investments / Total Assets ≤ 2%
E4. Borrowed Funds / Total Assets < 5%
E5. Savings Deposits / Total Assets 70-80%
E6. External Credit / Total Assets 0-5%
E7. Member Share Capital / Total Assets ≤ 20%
E8. Institutional Capital / Total Assets ≥ 10%
E9. Net Institutional Capital / Total Assets ≥ 10%
E10. Donated Funds / Total Assets Low: compare with peers
For illustrative purposes examples of E1, E2, E4, E5, E8 and E9 are shown below. These deal with the issue of sources of funds and the sufficiency of reserves and available resources.
E1 Net Loans / Total Assets (KEY RATIO)
Purpose: To measure the percentage of total assets that are invested in the loan portfolio, or to as-certain what percentage of assets that are in the form of members loans. SACCOs earn more on their loans than on investments so this ratio should be maximised. Best practice suggests that this ratio should be at 70% or more in order for SACCOs to generate sufficient income over time and to ensure viability.
Calculation of ratio: a. Net Loans (Total Gross Loans – Loan Loss Reserve) b. Total Assets Formula: _(a)_ x 100
(b)
8 2007, Grace, D., Analysis of the SACCO Balance Sheet & PEARLS, (presentation), slide 26 9 2016, WOCCU, Protection Ratios http://www.woccu.org/financialinclusion/pearls/aboutpearls accessed on 19.10.2016

PEARLS Manual
13
Example: a. Net Loans (Gross Loans – Loan Loss Reserve) 9,600,000 b. Total Assets 12,000,000 Example E1 Ratio (9,600,000) x 100 = 80 (12,000,000) Goal: 70% or more
In this instance, the size of the loan portfolio is in line with best practice.
E2 Liquid Investments / Total Assets
Purpose: To measure the percentage of total assets which are held in short term investments. The norm is for liquid investments to be defined as investments of a duration of less than 3 months (in some places the duration varies). This includes cash accounts.
Calculation of ratio: a. Total Liquid Investments (investments of a duration of less than 3 months) b. Total Assets Formula: _(a)_ x 100
(b) Example: a. Total Liquid Investments 790,000 b. Total Assets 12,000,000 Example E2 Ratio __790,000__ x 100 = 7 12,000,000 Goal: less than 10%
In this instance, the goal of holding less than 10% in liquid assets has been met.
E4 Borrowed funds / Total assets
Purpose: To measure the percentage of total assets that are financed by external borrowings (i.e. borrowings that the SACCO contracts with another financial institution, including other SACCOs, or other sources). Best practice suggests that this ratio is maintained below 5% as the cost of borrowings becomes more of an issue the higher the ratio. However a different level for this ratio may be more appropriate in certain development contexts given a higher level of borrowing when the movement is just starting or growing rapidly.
Calculation of ratio: a. Total borrowings b. Total assets Formula: _(a)_ x 100
(b) Example:

PEARLS Manual
14
a. Total borrowings 4,100,000 b. Total assets 12,000,000 Example E4 Ratio __4,100,000__ x 100 = 34 12,000,000 Goal: WOCCU best practice suggests that this ratio should be maintained below <5%.
This scenario suggests that the savings generated internally are significantly less than the portfolio outstanding. The borrowings may have come from a commercial source such as a bank or an apex central financing facility or a donor lending instrument.
E5 Savings & Time Deposits / Total Assets
Purpose: To measure the percentage of total assets which are financed by savings and time deposits (also known as ‘term deposits’). This ratio is a measure of the financial independence of the SACCO. Best practice suggests that a ratio of between 70% and 80% is optimal.
Calculation of ratio: a. Total savings + deposits b. Total Assets Formula: _(a)_ x 100
(b) Example: a. Total savings + deposits 4,300,000 b. Total Assets 12,000,000 Example E3 Ratio __4,300,000___ x 100 = 36 12,000,000 Goal: WOCCU best practice suggests that this ratio should be maintained between 70-80%.
In certain circumstances, where SACCOs have higher levels of borrowings and donations than is typi-cal, the level of member savings tends to make up a smaller portion of the balance sheet.
E8: Institutional Capital / Total assets
Purpose: To measure the percentage of total assets financed by capital. Note that according to good accounting practice, member shares should not be included in capital as these specific shares are owed to the member and the member is able to claim them at any time.
In simple terms, capital is the difference between a SACCOs’ asset and liabilities. If a SACCO has excess assets over liabilities, it has capital i.e. wealth.
Calculation of ratio: a. Total capital (Reserves + Grants + Retained Earnings + Current Surplus) b. Total Assets Formula: _(a)_ x 100
(b)

PEARLS Manual
15
Example: a. Total capital 2,700,000 b. Total Assets 12,000,000 Example E6 Ratio __2,700,000__ x 100 = 23 12,000,000 Goal: WOCCU best practice suggests that this ratio should be maintained at 10% or above.
In some environments, rather than immediately setting a goal of 10%, it may be more suitable to collate data over time, calculate the regional and national average for this ratio and then set this av-erage as a target or goal.
E9: Net Capital (Institutional Capital) / Total assets (KEY RATIO)
Purpose: To measure the percentage of total assets financed by ‘Institutional Capital’ (or ‘net Capital’). Institutional capital is defined as all legal and non-distributable reserves, retained earnings, and cur-rent year surplus.
This E9 net capital ratio is a key ratio as it measures the ability of the SACCO to absorb losses. Adequate institutional capital is the foundation on which the financial stability of a SACCO rests. Adequate cap-ital supports a SACCO’s operations, provides a base for future growth and protects against the risk of unforeseen losses. SACCOs need to maintain sufficient capital to ensure continuity and to protect members’ savings.
Adequate capital maintains savers’ confidence. A strong overall capital position enables SACCOs to deal with future uncertainties and to act flexibly in adverse economic conditions. Lack of adequate capital may threaten the financial soundness, stability and future of a SACCO.
If an institution has an excess of liabilities over assets, it has no capital and therefore is insolvent and unable to meet its obligations. Institutional capital is a dominant measure in determining the financial strength of a SACCO is the level of capital (or retained earnings) a SACCO has, relative to its assets.
Net institutional capital is Institutional Capital minus allowances for risk assets (i.e. minus the loan loss provision and other problem assets that will be liquidated).
Calculation of ratio: a. Net Institutional Capital (Retained Earnings + Current Surplus)-(allowances for risk) b. Total Assets Formula: _(a)_ x 100
(b) Example: a. Total Net Capital 970,000 b. Total Assets 12,000,000 Example E7 Ratio __970,000__ x 100 = 8 12,000,000 Goal: WOCCU best practice suggests that this ratio should be maintained at 10% or above. However this 10% level is regarded as a high level of Institutional Capital by some observers.

PEARLS Manual
16
It may be suitable to set different Institutional Capital ratios for different categories of SACCOs. SAC-COs can be split between “complex” SACCOs and other SACCOs. Complex SACCOs are those with asset sizes above a certain level (for example, in excess of US$25m).
Example Net Capital requirements for “complex” and other SACCOs:
Complex SACCOs Minimum Net Capital 7%
Other SACCOs Minimum Net Capital 5%
An example of a table of capital requirements in use in the USA is shown below. As a SACCO’s capital ratio declines, the actions required of the SACCO to restore its capital to an acceptable level become progressively more stringent.
Example of table of capital requirements in use in US SACCOs.
Well Capitalised 7%+
Adequately Capitalised 6% to 6.99%
Undercapitalised 4% to 5.99%
Significantly Under capitalised 2% to 3.99%
Critically Undercapitalised Under 2%
Any SACCO that is significantly undercapitalised, or critically undercapitalised should be required to set out a plan in order to restore its capital position.
E10 Donated funds / Total Assets
Purpose: To measure the level of donations as a percentage of total assets. Where there has been significant external / donor intervention, this ratio is will be higher than in elsewhere.
Calculation of ratio: a. Total donations b. Total assets Formula: _(a)_ x 100
(b) Example: a. Total donations 10,000 b. Total assets 7,400,000 Example E5 Ratio __10,000__ x 100 0.1 7,400,000 Goal: There is no set goal for this ratio, but it is important to compare to the regional average and/or national average for guidance.
Asset Quality The ratios under ‘Asset Quality’ measure the relationship between ‘earning’ and ‘non-earning’ as-sets. Areas of concern relating to this heading include loan delinquency, asset management and (excessive) non-earning assets.

PEARLS Manual
17
The key asset of a SACCO should be its loan portfolio. The portfolio is almost always a SACCO’s main source of earnings and under-performance or large losses here can be extremely serious. The meas-urement of delinquency and thus the quality of its loan book is vital to its good financial health.
The motivation for assessing asset quality is to steer management and others to follow up on delin-quent members and also to ensure that the SACCO has affordable buildings & other fixed assets.10 The maintenance of the loan portfolio’s performance and integrity is a vital part of management’s task. Serious losses here can be catastrophic. That is why the exposure to loan losses must always be kept under constant and up to date review.
The following table sets out the ratios relating to ‘A’ as developed by WOCCU, with A1a added in.
A - Asset Quality11 Goals (Excellence)
A1. Total Loan Delinquency / Gross Loan Portfolio A1a Loans in arrears over 12 months / Gross Loan Portfolio
≤ 5% 0%
A2. Non-earning Assets / Total Assets ≤ 5%
A3. Net Zero Cost Funds / Non-earning Assets ≥ 200%
A non-productive or non-earning asset is one that does not generate income. An excess of non-earning assets affects SACCO earnings in a negative way.
A1: GROSS LOANS IN ARREARS (over 10 weeks) (KEY RATIO)
A very important asset is loans to members and therefore the most important ratio in this section is A1, which measures loan delinquency.
Purpose: The purpose of this ratio is to measure arrears of payment in line with the standard definition of arrears. Of all the PEARLS ratios, the delinquency ratio is the most important measurement of insti-tutional weakness. If delinquency is high, it usually affects all other key areas of SACCO operations. By using the PEARLS formula to accurately measure delinquency, SACCOs are properly informed of the severity of the situation before a crisis develops. The ideal goal is to maintain the delinquency rate below 5% of total loans outstanding.
This proposed standard nominates all loans over e.g. ten weeks in arrears (i.e. where scheduled repay-ments have not been made) as being ‘loan arrears’. The supervisor usually stipulates that once a loan is non-performing over a certain period (e.g. 10 or 12 weeks) that provisions need to be set aside to cover the risk that this loan might result in a default and need to be written off.
Calculation of the ratio (a) gross loans over ten weeks in arrears (b) total loans Formula: _(a)_ x 100
(b)
10 2007, Grace, D., Analysis of the SACCO Balance Sheet & PEARLS, (presentation), slide 27 11 2016, WOCCU, Protection Ratios http://www.woccu.org/financialinclusion/pearls/aboutpearls accessed on 19.10.2016

PEARLS Manual
18
Example: a. Gross loans in arrears over 10 weeks = 5,000,000 b. Total loans = 42,000,000 Example A1 Ratio __5,000,000__ x 100 = 11.9 42,000,000 Goal: WOCCU best practice suggests that an ideal target is to have this at a value less than 5.
In this instance, the loans in arrears is considered high and the management should be quickly in-formed to ensure remedial action is carried out swiftly.
To carry out this vital of exercise of arrears assessment, it is necessary to know the figure for loans in arrears for over e.g. ten weeks as well as total gross loans at the same date.
A1 will tell if a SACCO has a big problem with arrears. This is a key ratio to monitor because the performance (i.e. repayment rate) of the loan book is the most important income generating asset for the SACCO. For delinquency control purposes, SACCOs should know loans that are one day over-due and should have a clear set of steps for responding very quickly where any arrears manifest.
A1a Loans in arrears > 12 months / Total Loans
Purpose: To measure longer term arrears in the loan portfolio. Best practice dictates that these loans are fully provided for (that is, a loan provision reserve is set aside for the full value of these loans).
In some jurisdictions best practice dictates that these loans are written off and should not form part of the balance sheet.
Calculation of ratio: a. Loans in arrears > 12 months b. Total Loans Formula: _(a)_ x 100
(b) Example: a. Loans in arrears > 12 months 450,000 b. Total Loans 10,000,000 Example A1a Ratio 4.5% Goal: There is no set goal for these longer term arrears but these should be kept to a minimum. The ideal target for A1a is 0%.
As with other ratios, it is important to collate data on longer term arrears over time, and to calculate accurate regional and national averages for longer term arrears.
A2 Proportion of Fixed Assets (Non-Earning) Assets / Assets
Purpose: To measure fixed assets that are not earning any income as a percentage of total assets. Fixed assets include office buildings, equipment, land, furniture, computers and vehicles etc. This ratio should be checked against the regional average and national average if these are available.

PEARLS Manual
19
Any high score in this ratio may mean a SACCO will have difficulty generating sufficient earnings. SAC-COs earn the majority of their income from loan income and investment income. In general no earn-ings are generated from fixed assets (although in some cases, SACCOs can earn rental income from renting out some of their premises to third parties). There is a balance to be struck between investing in premises to improve confidence and attract new members and not having too much of the balance sheet in non-earning assets. Examples of a ‘non-earning asset’ are as follows:
Cash on-hand and floats: One issue in relation to cash on-hand and floats in calculating this ratio is that over the whole year there will be considerable variability in cash levels. Cash on- hand is there to meet cash flow needs. If you take just the end of the year, it does not take the seasonal variations into account (and the seasonal issue is likely to be similar at the same time every year). To deal with this issue take an average figure for cash balances in the ex-ercise.
Non-interest bearing current accounts
Debtors. Money that is owed to you (not in loan form), e.g. if a staff member takes a salary in advance.
Pre-paid expenses. Stock, stationery etc. this can be an issue especially if you buy more than you need.
Fixed assets, for example, the office building if it has been bought by the SACCO for its own use.
It is important to bear in mind that when a SACCO buys its first building, it is not likely to have a good ratio on this score as the value of the fixed asset (the building) will be very high in relation to the total assets as a general rule.
The importance of non-earning assets is that if they are too high in the SACCOs overall composition of assets, then they may be holding the SACCO back to some extent. If they are proportionately too high, the implication is that the income generation potential of the organisation is not being fully realised.
Calculation of ratio: a. Fixed Assets (conservative value of buildings, equipment, land, furniture, computers etc.) b. Total Assets Formula: _(a)_ x 100
(b) Example: a. Fixed Assets (Buildings, Equipment, Computers etc.) 950,000 b. Total Assets 12,000,000 Example A2 ratio __950,000__ x 100 = 7.9 12,000,000 Goal: WOCCU best practice suggests that an ideal target is to have this at a value less than 5.
In this instance, the non-performing assets are somewhat high in comparison to the proportion of performing assets. This may be due to a purchase of a building or an over concentration of resources into non income earning assets.
A particular risk is with large buildings, is that the SACCO may make a significant loss if property values fall. For example, if a SACCO’s building makes up 25% of the SACCO’s total assets, and property values

PEARLS Manual
20
crashed, the SACCO would have to post a significant loss if they had to mark the property value down to market values.
Rates of Return and Costs
The ‘R’ ratios refer to the money earned or the return on the assets held by the SACCO. The related ratios indicate whether the SACCO is being run on a cost effective basis and whether the return on its assets are adequate. Fourteen ratios measure the yields of the most important assets and liabili-ties, and also analyse operating expenses, provisions, and impact of return net of assets.
Return can be generated from interest charged on member loans, rent earned from owned buildings, and interest earned on investments or bank deposits. A key consideration is the cost of the funds which are used to finance the income generating assets.
A principle idea behind analyzing the R ratios are to ascertain the real rates of return on savings & shares, to ensure that operational costs such as salaries for employees are competitive but not ex-cessive, and that loan rates recover all costs, but are not geared towards profit maximization for its own sake.12
This facilitates considerations around which types of assets earn the highest returns and on the lia-bility side, what are the least and most expensive sources of funds. The following table sets out the ratios relating to ‘R’ as developed by WOCCU with R3 amended and two additional ratios (R5a and R5b) added which may be relevant to some emerging movements or developing country contexts.
R - Rates of Return and Costs13 Goals (Excellence)
R1. Net Loan Income / Average Net Loan Portfolio Entrepreneurial Rate
R2. Investment Income / Average Liquid Investments Market Rates
R3. Total Income / Total Assets Market Rates
R4. Non-financial Investment Income / Average Non-financial In-vestments
≥ R1
R5. Financial Costs: Interest Costs on Savings Deposits / Average Savings Deposits
Market Rates > Inflation
R5a. Staff Costs / Total Income 15%
R5b Expenses / Income * < 70%
R6. Financial Costs on External Credit / Average External Credit Market Rates
R7. Financial Costs: Member Share Dividend / Average Member Shares
Market Rates, ≥ R5
R8. Gross Income Margin / Average Total Assets ˆE9=10%
R9. Total Operating Expenses / Average Total Assets ≤ 5%
R10. Loan Loss Provision Expense / Average Total Assets ˆP1=100%, ˆP2=35%
R11. Other Income or Expense / Average Total Assets Minimized
R12. Net Income / Average Assets (ROA) ˆE9=10% or greater than infla-tion*
12 2007, Grace, D., Analysis of the SACCO Balance Sheet & PEARLS, (presentation), slide 35 13 2016, WOCCU, Protection Ratios http://www.woccu.org/financialinclusion/pearls/aboutpearls accessed on 19.10.2016

PEARLS Manual
21
By comparing financial structure with yields, it is possible to determine how effectively the SACCO is able to place its productive resources into investments that produce the highest yield. Yield infor-mation is computed on four main areas of investment:
a. Loan Portfolio - All interest income, delinquent interest penalties and commissions from lending operations are divided by the total amount invested in the loan portfolio.
b. Liquid Investments - All income from bank savings accounts and liquidity reserves deposited in ei-ther the National Association or a regulatory body is divided by the amounts invested in those areas.
c. Financial Investments - Many SACCOs invest liquidity into financial investments (e.g. government securities) that pay higher yields than bank savings accounts. This investment income is also divided by the outstanding capital invested in those instruments.
d. Other Non-financial Investments - Any investment that does not fit into the previous categories is classified as "other" non-financial investments. For some SACCOs, this includes investments in shops or residential development projects.
All income from these different sources is likewise divided by the original capital investments. Oper-ational costs are also important. They are broken down into three main areas:
e. Financial Intermediation Costs - This area evaluates the financial costs paid on deposit savings, member shares, and external loans. Unlike commercial banks that try to minimize financial costs, SAC-COs should try to pay as high a rate as possible without jeopardizing the stability of the institution. In many instances, a poor growth rate for deposit savings is linked to noncompetitive interest rates. Like-wise, dividends on member share capital are closely monitored to ensure that SACCOs are not taking advantage of their members by paying substandard dividend yields on their share capital.
f. Administrative Costs - Another critical area requiring close analysis is administrative costs. Many SACCOs are highly competitive with commercial banks on interest rates for deposits and loans, but their administrative costs can be higher on a per unit basis. Costs are higher because of the smaller loan size. Fixed administrative expenses could not be spread over a larger loan amount. For example, the fixed costs to make a US$100 loan are almost identical to those of a US$1,000 loan. The "ideal" target recommended by the PEARLS system is to maintain administrative costs between 3-10% of av-erage total assets.
g. Provisions for Loan Losses The final cost area evaluated by PEARLS separates the costs of creating provisions for loan losses from other administrative costs. The creation of adequate provisions repre-sents a type of expense. By isolating this expense from the other administrative costs, it is possible to get a much clearer picture of (weak) credit administration practices in the SACCO.
A selection of the R ratios - R1, R3, R5 and R6 - are illustrated below.
R1 Net loan income / Average net loan portfolio
Purpose: To measure the return on the loan portfolio.
For the R1 ratio, both the Balance Sheet and Income and Expenditure Statement are required. The specific accounts information needed is loan interest receivable and the average of the gross loan balances at current and previous year-end. When comparing year on year changes, it is necessary to have financial reports from two years to work out this ratio. The balance sheet from the base year, Year 1, is needed to find out what the loans outstanding are; and the income statement from the following year, Year 2, is needed to find out the interest income from Year 2.
PEARLS Manual
22
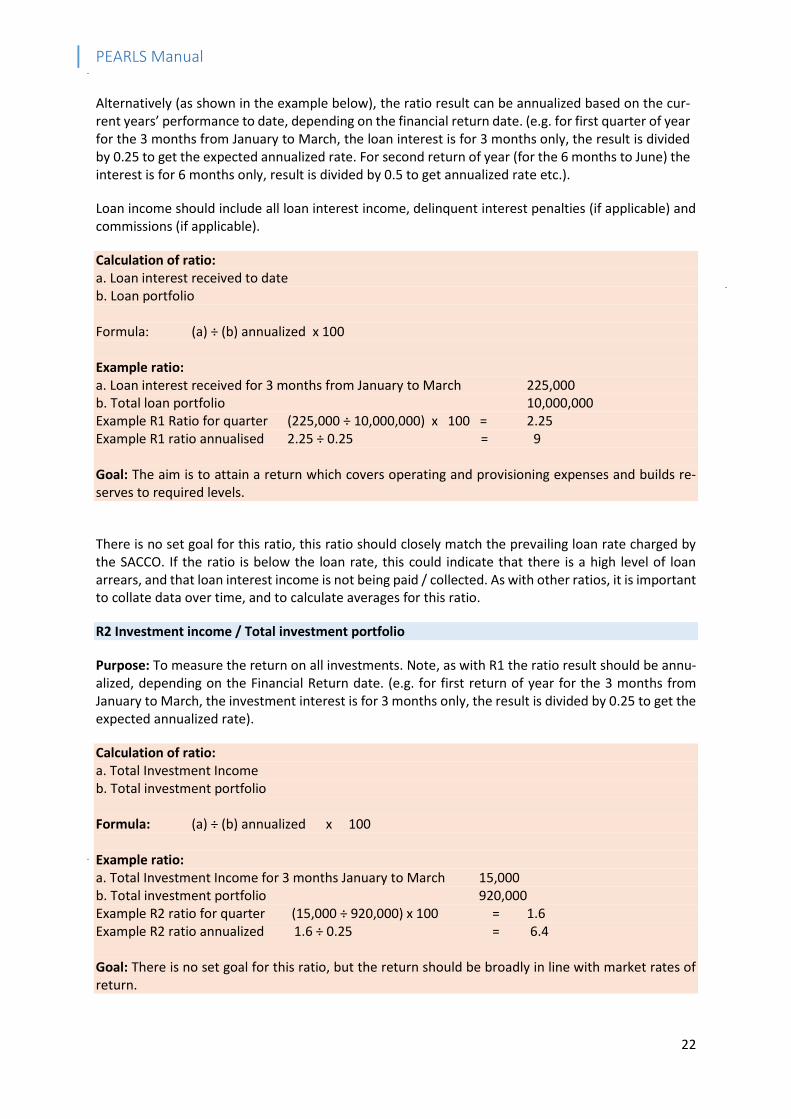
Alternatively (as shown in the example below), the ratio result can be annualized based on the cur-rent years’ performance to date, depending on the financial return date. (e.g. for first quarter of year for the 3 months from January to March, the loan interest is for 3 months only, the result is divided by 0.25 to get the expected annualized rate. For second return of year (for the 6 months to June) the interest is for 6 months only, result is divided by 0.5 to get annualized rate etc.).
Loan income should include all loan interest income, delinquent interest penalties (if applicable) and commissions (if applicable).
Calculation of ratio: a. Loan interest received to date b. Loan portfolio Formula: (a) ÷ (b) annualized x 100 Example ratio: a. Loan interest received for 3 months from January to March 225,000 b. Total loan portfolio 10,000,000 Example R1 Ratio for quarter (225,000 ÷ 10,000,000) x 100 = 2.25 Example R1 ratio annualised 2.25 ÷ 0.25 = 9 Goal: The aim is to attain a return which covers operating and provisioning expenses and builds re-serves to required levels.
There is no set goal for this ratio, this ratio should closely match the prevailing loan rate charged by the SACCO. If the ratio is below the loan rate, this could indicate that there is a high level of loan arrears, and that loan interest income is not being paid / collected. As with other ratios, it is important to collate data over time, and to calculate averages for this ratio.
R2 Investment income / Total investment portfolio
Purpose: To measure the return on all investments. Note, as with R1 the ratio result should be annu-alized, depending on the Financial Return date. (e.g. for first return of year for the 3 months from January to March, the investment interest is for 3 months only, the result is divided by 0.25 to get the expected annualized rate).
Calculation of ratio: a. Total Investment Income b. Total investment portfolio Formula: (a) ÷ (b) annualized x 100 Example ratio: a. Total Investment Income for 3 months January to March 15,000 b. Total investment portfolio 920,000 Example R2 ratio for quarter (15,000 ÷ 920,000) x 100 = 1.6 Example R2 ratio annualized 1.6 ÷ 0.25 = 6.4 Goal: There is no set goal for this ratio, but the return should be broadly in line with market rates of return.

PEARLS Manual
23
As with other ratios, it is important to collate data over time, and to calculate the local and national average for this ratio. If a SACCO has an R2 investment ratio well below the average this could indicate that (a) the SACCO is making poor investment decisions or (b) the SACCO is keeping too much of their investments in short term investments which earn lower returns.
R3 Total Income / Total Assets
Purpose: To measure the adequacy of earnings. Note, as above the ratio result should be annualized, depending on the Financial Return date.
Calculation of ratio: a. Total Income b. Total assets Formula: (a) ÷ (b) annualized x 100 Example ratio: a. Total Income for 3 months January to March 410,000 b. Total Assets 12,000,000 Example R2 ratio for quarter (410,000 ÷ 12,000,000) x 100 = 3.4 Example R2 ratio annualized 3.4 ÷ 0.25 = 13.7 Goal: Enough to cover operating expenses, provisioning expenses, a reasonable dividend and a surplus to build reserves.
R5a Staff Costs / Total Income
Purpose: To measure salary and related expenses as a percentage of total income. Salaries and related expenses should include pension costs, per diems, and any other costs such as travel expenses relating to staff. This is an important ratio to monitor. While often SACCOs are competitive with other institu-tions on interest rates on savings and loans, their administration costs can in some instances be higher (limiting their ability to be competitive). Costs per loan can actually be higher as the loan sizes are usually smaller in SACCOs; the administration costs are the same for a 1,000 shilling loan as for a 10,000 shilling loan.
Calculation of ratio: a. Staff costs (includes salaries, pensions, per diems etc.) b. Total Income Formula: _(a)_ x 100
(b) Example ratio: a. Staff costs (includes salaries, pensions, per diems etc.) 101,500 b. Total Income 954,000 Example R5a ratio (101,000 ÷ 954,000) x 100 = 10.6 Goal: Ideally, SACCOs should aim to have this ratio at 15 or less.

PEARLS Manual
24
This is an efficiency measure. Although staff growth is needed as a SACCO grows, it can usually grow at a somewhat slower pace than that of the SACCO.
PEARLS RATIO R5b: EXPENSES / INCOME
R5b measures expenses as a percentage of income. The accounts information require is the Income and Expenditure accounts.
Calculation of ratio: a. Expenses including interest expenses b. Income (including ‘other income’) Formula: (a ÷ b) x 100 Example ratio: a. Expenses 870,000 b. Income 1,725,000 Example R5b ratio 50.43 Goal: Expenses must be less than income (i.e. lower than 100%) or the SACCO is in imminent danger. To meet other requirements (e.g. dividends, provisioning), this ratio should ideally be lower than e.g. 70%.
R9 Total Operating Expenses / Average Total Assets
Purpose: To measures costs of running the SACCO against the total assets.
Calculation of ratio: a. Total operating expenses b. Average total Assets Formula: (a ÷ b) x 100 Calculation of ratio: a. Total operating expenses 560,000 b. Average total Assets 12,000,000 Example R9 Ratio 4.7 Goal: WOCCU best practice states that this should be maintained below 5.
R12 Return On Assets (Net income) / Average assets (KEY RATIO)
Purpose: The Return On Assets (or ROA) is an indicator of ‘profitability’ and is intended to measure a SACCO’s efficiency in using its assets. A strong ROA ensures that a SACCO can (a) provide a dividend to members (b) replenish reserves and increase capital levels (c) reinvest in new products and services (d) engage in marketing, promotion and member outreach. Poorly performing loans and investments and operational inefficiencies adversely impact on ROA. ROA is also a key indicator related to solvency.

PEARLS Manual
25
Calculation of ratio: a. Net income (or surplus) b. Average assets Formula: (a) ÷ (b) annualized x 100 Example ratio: a. Net income (or surplus) for 3 months January to March 125,000 b. Average assets 12,000,000 Example R12 ratio for quarter 1 (125,000 ÷ 12,000,000) x 100 = 1.04 Example R12 ratio annualized 1.04 ÷ 0.25 = 4.2 Goal: Enough to cover operating expenses, provisioning expenses, a reasonable dividend and a surplus to build reserves.
Liquidity Access to cash is an essential component of administering a savings and loan institution. Liquidity in this context refers to the availability of liquid assets (cash or near cash) in a SACCO. These ratios indi-cate the percentage of assets available at short notice as opposed to resources tied up for long term. It is of vital importance that a SACCO has cash or access to it when it is needed for member loans or to pay bills when due. Monitoring liquidity will help to ensure that members can deposit and withdraw their savings when they need it, that the SACCO can provide members with immediate cash and on the other hand can help to minimize excess cash being held. 14
The following table sets out the ratios relating to ‘L’ as developed by WOCCU.
L - Liquidity15 Goals (Excellence)
1. Liquid Assets – Short Term investments + Liquid Assets + Short Term Payables / Total Deposits
15-20%
2. Liquidity Reserves / Savings Deposits 10%
3. Non-earning Liquid Assets / Total Assets < 1%
Effective liquidity management becomes a much more important skill as the SACCO shifts its financial structure from member shares to more volatile deposit savings. In many movements following the traditional model, member shares are very illiquid and most external loans have a long payback pe-riod, therefore there is little incentive to maintain liquidity reserves. Liquidity is traditionally viewed in terms of cash available to lend - a variable exclusively controlled by the SACCO. With the introduc-tion of withdrawable savings deposits, the concept of liquidity is radically changed. Liquidity then re-fers to the cash needed for withdrawals - a variable the SACCO can no longer control. The PEARLS system analyses liquidity from two perspectives:
a. Total Liquidity Reserves - This indicator measures the percentage of savings deposits in-vested as liquid assets in either a National Association or a commercial bank. The "ideal" target is to maintain a minimum of 15% after paying all short-term obligations (30 days and under).
b. Idle Liquid Funds - Liquidity reserves are important but they also imply a lost opportunity
14 2007, Grace, D., Analysis of the SACCO Balance Sheet & PEARLS, (presentation), slide 38 15 2016, WOCCU, Protection Ratios http://www.woccu.org/financialinclusion/pearls/aboutpearls accessed on 19.10.2016

PEARLS Manual
26
cost. Funds in simple savings accounts earn negligible returns, in comparison with other investment alternatives. Consequently, it is important to keep idle liquidity reserves to a minimum. The ‘ideal’ target of this PEARLS ratio is to reduce the percentage of idle liquid-ity to as close to zero as possible.
Liquidity is of great importance as it measures a SACCO’s ability to meet possible cash withdrawals. It aims to identify level of liquid funds available to cover withdrawals and meet unforeseen or ‘day to day’ (routine) requirements. At the same time, it serves to help management try to minimise the amount of idle funds that earn no return.
L1 Liquid investments / Total savings (KEY RATIO)
Purpose: To identify the level of liquid investments available to cover withdrawals and to meet un-foreseen or day to day requirements. The maintenance of adequate liquidity reserves is essential to sound financial management, and enhances confidence.
The accounting information that is required and the formula for calculation is: (a/b) where ‘a’ repre-sents liquid funds, this means liquid investments - that can be turned into cash in 3 months or under, plus current account balances (as per balance sheet); and ‘b’ represents ‘unattached’ savings, i.e. sav-ings that are not being used as collateral for a loan or as a guarantee for another members loan.
Steps in the process of L1 calculation
1. It will be necessary to identify the value of the short term funds and current accounts.
2. It will be necessary to identify shares and savings that are not pledged against a loan. In a properly programmed accounts system this can be easily done.
Where a SACCO has not advanced to the stage where it can provide an appropriate Information Technology system, it will be necessary to look through all member accounts and identify the amount of savings that are not tied up. These ‘encumbrances’ (funds that are tied up) can be pledges or guarantees given as security for a loan in the form of a member’s shares or savings. These pledges need not be for the member’s own loans. They could be pledges as security for a relative or a group.
Calculation of ratio: a. Liquid investments (of duration of less than 1 year) b. Total savings Formula: (a ÷ b) x 100 Example: a. Liquid investments (of duration of less than 1 year) 790,000 b. Total savings 5,700,000 Example L1 Ratio (790,000 ÷ 5,700,000) x 100 = 13.9 Goal: Best practice recommends that this is maintained at a minimum level of 15 - 20

PEARLS Manual
27
This higher 20% goal is deemed to be sufficient to meet a relatively high level of demand from mem-bers for their savings.
There have been numerous incidents where SACCOs that seem healthy being seriously jeopardised by liquidity problems. See case study below.
Liquidity Crisis
A good example of this phenomenon occurred in Mitchelstown SACCO in Ireland during the height of the international financial crisis. It had satisfactory reserves. However, these were mainly in medium term investments and not cash.
Mitchelstown was a successful SACCO. Unfortunately, a journalist wrote a negative article about cash availability there. It was a time of great uncertainty in Ireland and the article caused great concern among the members.
Queues of people formed outside the offices seeking to withdraw their savings. The SACCO quickly ran out of cash. It was very solvent, but it had a liquidity problem. It could not turn its investments into cash instantly.
To meet the ‘run’ on their resources they approached the bank for a short term loan. The bank was willing to help, but only at an exorbitant rate. They wanted to charge 25% interest.
Fortunately the Irish League of Credit Unions (the Irish SACCO apex organisation) had accumulated a special fund for exactly this type of occurrence - the Stabilisation Fund - a scheme which provides technical and financial aid to SACCOs which encounter this kind of difficulty. Mitchelstown SACCO decided to avail of this fund.
The Irish League of SACCOs immediately issued a press release announcing that they were transferring €5 million in cash to the SACCO and were placing up to an extra €50 million at its disposal. The queues disappeared. In the event the transfer of funds was not required.
As you can see, liquidity is indeed very important.
Signs of Growth The only successful way to maintain asset values is through strong, accelerated growth of assets, ac-companied by sustained profitability. Signs of growth ratios measure growth of the most important assets, liabilities and capital of a SACCO as well as the expansion of membership. These can indicate member satisfaction, the appropriateness of product offerings and financial strength.16 Growth, in and of itself, is insufficient. The advantage of the PEARLS system is that it links growth to profitability, as well as to the other key areas by evaluating the strength of the system as a whole. Growth can occur in a number of areas including loans, savings, investments, membership numbers, assets, shares, in-stitutional capital etc. Key areas of growth are the following:17
a. Total Assets
16 2013, WOCCU website, page http://www.woccu.org/financialinclusion/bestpractices/pearls/aboutpearls#e paragraph 28, accessed on 14/08/2013. 17 WOCCU, 2009, Richardson, D. C., PEARLS Monitoring System sourced from file: http://www.woccu.org/financialinclu-sion/pearls/pearlsmonograph on 8.11.2016

PEARLS Manual
28
Growth in total assets is one of the most important ratios. Many of the formulas used in the PEARLS ratios include total assets as the key denominator. Thus, strong, consistent growth in total assets im-proves many of the PEARLS ratios. By comparing the growth in total assets to other key areas, it is possible to detect changes in the balance sheet structure that could have a positive or negative impact on earnings. The ideal goal for all SACCOs is to achieve real positive growth (i.e., net growth after subtracting for inflation) each year.
b. Loans
The loan portfolio is the most important and profitable SACCO asset. If growth in total loans keeps pace with growth in total assets, there is a good likelihood that profitability will be maintained. Con-versely, if loan growth rates drop, this suggests that other, less profitable areas are growing more quickly.
c. Savings Deposits
Savings deposits are the cornerstones of growth. The growth of total assets is dependent on the growth of savings. The rationale for maintaining proactive marketing programs is that they stimulate growth in new savings deposits that in turn, affect the growth of other key areas.
d. Shares
Some SACCOs maintain a dependence on shares for growth. If growth rates in this area are excessive, it usually signals an inability of the SACCO to adapt to the new system of promoting deposits over shares.
e. Institutional Capital
Institutional capital growth is the best indicator of profitability within a SACCO. Static or declining growth trends in institutional capital usually indicate a problem with earnings. If earnings are low, the SACCO will have great difficulty in adding to institutional capital reserves. One of the indisputable signs of success of a robust SACCO is a sustained growth of institutional capital, usually greater than the growth of total assets.
This set of ratios measures the real rate of growth and for monetary elements, whether they are keep-ing ahead of inflation. These ratios can be used to orientate the SACCO towards encouraging people to join, encouraging savings and to encourage borrowing (by members who meet the required stand-ards).18
The following table sets out the ratios relating to Signs of Growth ratios - ‘S’- as developed by WOCCU.
S - Signs of Growth (Annualized Rates)19 Goals (Excellence)
1. Growth in Loans to Members Dependent on E1=70-80%
2. Growth in Liquid Investments Dependent on E2 ≤ 16%
1. Growth in Financial Investments Dependent on E3 ≤ 2%
2. Growth in Non-financial Investments Dependent on E4=0%
5. Growth in Savings Deposits Dependent on E5=70-80%
6. Growth in External Credit Dependent on E6=0-5%
18 2007, Grace, D., Analysis of the SACCO Balance Sheet & PEARLS, (presentation), slide 41 19 2016, WOCCU, Protection Ratios http://www.woccu.org/financialinclusion/pearls/aboutpearls accessed on 19.10.2016

PEARLS Manual
29
7. Growth in Member Shares Dependent on E7 ≤ 20%
8. Growth in Institutional Capital Dependent on E8 ≥ 10%
9. Growth in Net Institutional Capital Dependent on E9 ≥ 10%
10. Growth in Membership ≥ 15%
11. Growth in Total Assets > Inflation + 10%
Strong growth of assets is accompanied by sustained profitability is highly desirable. Growth in itself is insufficient unless accompanied by growth in income so that reserves can be maintained.
S1 Growth in Loans to Members
Purpose: The purpose of S1 is to measure the % growth of the loan portfolio, which is the most im-portant income generating asset of the SACCO. It is important that growth in total assets is matched by growth in loans, that way profitability can be maintained. Loan income is the largest component of income so a falling loan book will have a significant negative effect.
Calculation of ratio: a. Loan Portfolio at current date b. Loan Portfolio as of last year-end Formula: (a-b) b Example: a = 6,949,000 b = 6,093,000 Example S1 Ratio [(6,949,000-6,093,000) ÷ 6,093,000] x 100 = 14.46 Goal: There is no set goal for this ratio, but it is important that the growth in loans is growth of good loans, supported by proper loan appraisal and monitoring procedures. For supervisory purposes, out-liers should be investigated. That is, SACCOs with very high growth and very low growth should be investigated.
S5 Growth in Savings
Purpose: To measure the % growth of savings since year end. It is important that savings growth is matched by loan growth.
Calculation of ratio: a. Total savings at current date b. Total savings as of the last year-end Formula: [(a – b) ÷ b] x 100 a = 14,065,000

PEARLS Manual
30
b = 11,841,000 S5 = [(14,065,000 – 11,841,000) ÷ 11,841,000] x 100 = 18.78 Goal: There is no set goal for this ratio, but it is important to compare each SACCO’s growth to the regional average and/or national average for guidance. For supervisory purposes, as above - outliers should be investigated.
The ideal goal would be as large a growth as possible. However, if the SACCO cannot make good loans or other investments that give a greater return than the cost of such savings to it, then such growth is of no value. In fact it will cost it money. The ideal rate of growth is dependent on a variety of factors such as the interest rate offered compared with the inflation rate, competition with tra-ditional ways of saving (e.g. livestock), perception regarding the security of savings and the local culture relating to savings practices. Shocks in the economy will affect savings levels.
S9 Growth in Institutional Capital
Purpose: To measure the % growth of capital since last year end. Declining capital usually indicates a problem with earnings.
Calculation of ratio: a. Total capital at current date b. Total capital as of the Last year-end Formula: [(a – b) ÷ b] x 100 Example: a = 515,000 b = 450,000 S9 = [(515,000 - 450,000) ÷ 450,000] x 100 = 14.44 Goal: Growth in capital needs to match growth in assets, otherwise capital will be degraded or de-pleted and the SACCO may have insufficient capital to absorb losses.
Obviously a strong growth in reserves is good. The only real money owned by a SACCO is its retained earnings and capital donations where these are received. The more a SACCO’s activities can be fi-nanced out of its own earnings the better. It is interest free. In addition, it does not have to be repaid to an outside financier as loans do.
S10 Growth in Membership
Purpose: To measure the % growth in membership of the SACCO since last year end.
Calculation of ratio: a. Number of Members at current date b. Number of Members as of Last year-end

PEARLS Manual
31
Formula: [(a – b) ÷ b] x 100 Example: [(7,500 – 7,000) ÷ 7,000] x 100 = 7.1 Goal: It is important to compare each SACCO’s growth to the regional average and/or national average for guidance. As above -for supervisory purposes, outliers should be investigated. That is, SACCOs with very high growth and very low growth should be investigated.
S11 Growth in Total Assets
Purpose: To measure the % growth of Total Assets since last year end.
Calculation of ratio: a. Total assets at current date b. Total assets as of the Last year-end Formula: [(a – b) ÷ b] x 100 Example: [(3,000,000 – 2,750,000) ÷ 2,750,000] x 100 = 9 Goal: It is important to compare each SACCO’s growth to the regional average and/or national average for guidance. It should be significantly higher than the rate of inflation.
3. Using PEARLS
Application of PEARLS
Standardised financial ratios create a universal financial language within the SACCO movement. In the case of the individual SACCO, the indicators highlighted by PEARLS ratios can highlight loan arrears problems, signal compliance failures and identify excessive cost ratios. Ultimately ratios assist the management committee in fulfilling its duties with the aim of attending to problems before they be-come too large to deal with. But PEARLS ratios can be used in a variety of manners as elaborated below.
Executive Management and Oversight Tool
Monitoring the performance of the SACCO is the most important use of the PEARLS system. It is designed as a tool to help management teams identify problems and to act as a spur to seek solu-tions. Use of the system helps management teams to quickly and accurately pinpoint troubled areas, and to make the necessary adjustments before problems become serious. In essence, PEARLS can be an ‘early warning system.’ Regular PEARLS reports are typically submitted to boards which also use the information to appraise the performance of the SACCO. Presented with ratio analysis along with other control information, this enables the management and governance to evaluate the status and progress of the SACCO and to make informed decisions on the SACCO’s future direction.
Objective, Comparative Rankings
Standardisation of financial reporting formats means that the performances of individual SACCOs can be compared with their peers. It also means that performances can be compared with a national

PEARLS Manual
32
standard set down with the interest of SACCO soundness in mind. Comparing between different ratios is also important. For example if the institutional capital of an organisation has doubled in six years, it may appear to be good but it is not necessarily so. The institutional capital may have doubled but size of the SACCO may have tripled – meaning that the institutional capital may now be inadequate.
Facilitates Supervisory Control
In addition to its usefulness as a management and governance tool, the PEARLS system provides the framework which can fulfil supervisory requirements at the national level. PEARLS was not originally designed as a supervisory system, however WOCCU have made it freely available to regulators and supervisors who would like to make use of it, and indeed it is commonly used by supervisors some-times in conjunction with other appraisal tools.
Routine Reporting
A large part of the effectiveness of a PEARLS system is that, as mentioned above, it acts as an early warning system alerting SACCOs to a problem before it becomes too serious (or indeed when the problem is small). Thus, for reporting to be effective, financial reports should be submitted on a quar-terly basis and ratios should be reported based on these. If financial reports and ratios are submitted quarterly, the data is current and it should be possible for SACCOs to identify trends in the data and act to resolve problems before they become serious. If a financial report is only completed on a bi-annual or an annual basis, a negative trend may have become more serious and it may be too late to take swift action to “fix” the problem.
An example of a typical PEARLS report format is shown below. It records the PEARLS ratios for the current and three previous quarters. This means that a full year’s results are included in the one form. This format enables the SACCO’s management, and other users, to see trends over a full year.
The national average - and regional average where applicable - for each ratio should also be shown on the report. This helps in comparing the SACCO’s own performance with those of its peers.
PEARLS REPORT FORMAT: SACCO NUMBER & NAME
A full year of Ratios to identify trends Regional and national averages are
shown, and SACCOs can check their
performance against these
Table 1. PEARLS Report Format
PEARLS ratio*
Q1 Q2 Q3 Q4 Regional Average
National Average
P1 Loan Loss / Delinquency > 12 months
P2 Loan Loss / Delinquency 1-12 months
P6 Solvency
E1 Net Loans/Total Assets
E2 Liquid Investments/Total Assets
E3 Savings / Total Assets
E4 Borrowed Funds / Total Assets
E9 Net Institutional Capital / Total Assets
A1 Loan Arrears > 10 weeks / Total Loans
A1a Loan Arrears > 12 months /Total Loans

PEARLS Manual
33
A2 Fixed Assets / Total Assets
R1 Loan Income / Loans
R2 Investment Income / Investments
R3 Total Income / Assets
R5a Staff Costs / Total Income
R5b Operating Expenses / Assets
R12 Return On Assets
L1 Liquid Investments / Total Deposits
S1 Growth in Loans to Members
S2 Growth in Liquid Investments
S5 Growth in Savings
S8 Growth in Capital
S10 Growth in Membership
S11 Growth in Assets
NB. Key ratios are shown in RED.
It may be beneficial to do some deeper analysis on selected ratios, and a simple table as set out below can provide a framework within which to do so. This will involve three steps which are (1) check for change over the previous 9 month period, (2) check for deviation from the average and (3) compare with goal / target.
Table 2. Sample Format for Analysing PEARLS Performance
SACCO results - Latest
SACCO re-sults – Previous
Average in the coun-try
PEARLS Target
Change + (improving) or - (disimproving)
Average + (improving) or - (disimproving)
Goal + (improving) or - (disimproving)
P1
E1
E9
A1
R12
L1
Where ‘>’ means ‘greater than’, and ‘<’ means ‘less than’.
Appraising the ratios involves comparing to the target, performance with peers and the trend within the SACCO. The person conducting the appraisal should then be in a position to assess how the SACCO is performing, whether there are issues of concern, how these are reflected in ratios and why these issues have arisen. It is important to try and gauge how the SACCO can withstand a shock. An overall appraisal should be produced on a regular basis for presentation both to senior SACCO staff (where applicable, and they should be in a position to augment the report) in addition to the manager provid-ing the PEARLS report to the SACCO board. The presentation should provide rationale, insight and appraisal for emerging trends and performance. The following table provides a summary format for the manager can utilize to bring together the main points.

PEARLS Manual
34
Table 3. Sample Format for Analysis and Assessment of PEARLS Ration Change
Ratio Change + (improving) Or - (disimproving)
Average + (improving) Or - (disimproving)
Goal + (improving) Or - (disimproving)
Overall Assessment – strengths, weaknesses and identification of risks and problems.
P1
E1
E9
A1
R12
L1
For reports and for presentations it can be beneficial to show trends diagrammatically as it can help to illustrate unusual movements. The reader can see the effect of ‘shocks’ in the past and this can help to orientate the board and management to deal with ‘shocks’ in the future. If the ratios are tracked over numbers of years, then it is straightforward to identify patterns. The following graph shows the trajec-tory of a SACCO’s institutional capital ratio over a four year period.
Figure 1. Example of SACCO's Institutional Capital Ratio, 2013-2016
The graph shows an overall upward trend, but a sharp decline in 2014 and a decline in 2016. It is easier to interpret a graph than a table and it provides a backdrop for discussion and decision making.
It is straightforward to map out trends using ‘excel.’ To map trends in graph form, carry out the fol-lowing steps:
1. Enter ratios into an excel spreadsheet
0
1
2
3
4
5
6
7
8
9
10
2013Q1
2013Q2
2013Q3
2013Q4
2014Q1
2014Q2
2014Q3
2014Q4
2015Q1
2015Q2
2015Q3
2015Q4
2016Q1
2016Q2
2016Q3
2016Q4

PEARLS Manual
35
2. Do this at consistent intervals 3. When there are a number of quarters or years recorded, create a graph:
Select a line of data (e.g. which ratio you are going to show as a graph)
Click on the ‘Insert’ tab
Select from the ‘Charts’ section and click on e.g. ‘line’ graph option 4. Graph will appear and can be ‘cut and paste’ into a report or presentation
At SACCO level, PEARLS reports should be circulated and reviewed by all decision makers in the SACCO. PEARLS reports provide a regular picture of the financial well-being of the SACCO and are also a crucial check of compliance with regulatory / compliance requirements and performance.
PEARLS and Regulation
As already noted, PEARLS is a measurement tool of prudential supervision devised by the WOCCU as an objective test of key risk areas in SACCOs. The core aim of prudential supervision in SACCOs is to ensure that they are financially and organisationally sound and not indicating risks that threaten the financial well-being of the SACCOs and consequently their members, creditors and other stakeholders. Most regulators take a risk based approach to prudential supervision. This means that parameters are set within which risks may be taken but managed. The upper and lower limits of risk are meant to allow for the reality that financial institutions must assume some measure of risk in order to function effectively.
Prudential supervision is focused on the individual SACCO. It monitors the performance of each SACCO institution on a case by case basis and implements appropriate changes as deemed necessary. This form of regulation can be distinguished from systemic supervision which is perhaps sector or industry focused and looks at the overall performance of the (in this case) financial, market to prevent its fail-ure.
As part of this supervisory approach and to meet regulatory expectations SACCOs submit regular fi-nancial returns to the appropriate authorities in their jurisdiction. Regulators place a strong emphasis on the analysis of periodic financial returns. This is central to the efficient operation of any supervisory or regulatory regime. For regulatory authorities, PEARLS monitoring can:
Establish trends in SACCO performances
Prepare peer group inter SACCO comparison statements
Help identify problem areas by analyzing the results of PEARLS returns & directing attention to SACCOs with specific financial problems
Revise standards where indicated by the financial reports
Prepare feedback, guidelines and advice
Identify systemic risks and swiftly prepare policies and actions to deal with them.
Collate statistics on SACCOs’ reserves, losses and gains, growth trends etc. in order to plan for the movement in financial terms.
Each SACCO movement should select the standards that are most relevant to its circumstances be-cause the risks and saving/lending environment vary from place to place. They may also vary from time to time. Consequently the suite of ratios that are used should be kept under constant review to ensure that they remain relevant to the needs of SACCOs and their regulatory bodies.
Regulators and managers can review the PEARLS results and check performance against the goals and minimum recommended standards set for each ratio. In some cases these goals and minimum re-quirements may change, following any regulatory changes or changes to legislation.

PEARLS Manual
36
The requirements will vary with the type of financial institution involved. For instance the require-ments for banks will be different from those of an insurance company or a SACCO. The standards applied in each case will take into account factors such as the portfolio of products and services of-fered and the risks associated with them. Examples of prudential requirements include capital ade-quacy levels, liquidity and reserve ratios and minimum competency levels for key personnel involved in managing the institutions.
Limitations of PEARLS
The achievement of PEARLS goals can substantiate that the SACCO is strong and sustainable, how-ever, it is important to keep in mind that there may be some unexpected and undetected risks that a SACCO may find it very difficult to withstand (such as a collapse in the value of its assets or invest-ments due to economic or other shock). Ratios provide a substantial and concise amount of infor-mation regarding the performance of a financial organisation but they provide purely a statistical analysis. Unforeseen events or manipulation of data may give a false sense of security.
It is important to bear in mind that an understanding of the context, dynamics and political scene is also important for determining the viability and resilience of the SACCO and the wider sector.
There are other common risk measurement and management systems in use and here we highlight some of the features of an alternative appraisal tool known as ‘CAMEL’ used for assessing the perfor-mance of SACCOs.
The CAMEL system is the National Credit Union Association’s (NCUA) supervisory monitoring system for U.S. SACCOs (SACCO equivalent). The NCUA adopted CAMEL initially back in 1987 (an ‘S’ was later added to CAMELS (S standing for ‘Sensitivity to market’). The letters stand for:
Capital Adequacy
Asset Quality
Management
Earning
Liquidity and Asset Liability management
Sensitivity to market
CAMEL is designed to take into account and reflect all significant financial, operational, and manage-ment factors that examiners use in their evaluation of a SACCO's performance and risk profile.
Camels assigns a rating for each component of the system using a scale from 1 = best to 5 = worst. This is based on an ‘on-site’ evaluation of qualitative and quantitative information (note: Management is based on qualitative only). The numerical rating given is based upon the examiner‘s overall subjective judgement (opinion based on the assessment). Examiners are expected to use their professional judg-ment and consider both qualitative and quantitative factors when analysing a SACCO's performance. Since numbers can be lagging indicators - that is they tell you what has already happened - of a SAC-CO's condition, the examiner must also conduct a qualitative analysis of current and projected opera-tions when assigning CAMEL ratings.
PEARLS, on the other hand, is solely quantitative and was first designed as a management tool but later became a supervisory mechanism (although some would point out that it cannot assess aspects

PEARLS Manual
37
such as the sufficiency of governance). On-site examination when using PEARLS is not required but is encouraged. CAMEL, on the other hand, was created as a supervisory tool and relies on on-site exam-ination and examiners’ opinions including qualitative observations.
4. Conclusion
The global SACCO movement has been associated with some characteristics which are thought to have kept them less effective than they might otherwise be. Some biases against SACCOs are that they put the social philosophy above common business sense or that financial operations are not disciplined. Such criticisms can be addressed by adopting PEARLS. PEARLS ratios facilitate measurement and anal-ysis of the risks that face SACCOs. Monetary amounts and percentages on their own are of little use to users of financial information. It is necessary to have something to compare them to or to measure them against. All businesses, social or otherwise, need to measure performance against historical per-formance and the performance of other similar businesses; and PEARLS ratios provide this for SACCOs.

PEARLS Manual
38
Bibliography
Cahill, E., (1997), Why Companies Fail: Corporate Financial Crises in Ireland (publishers Gill & McMil-
lan, Dublin)
Grace, D., (2007) Analysis of the SACCO Balance Sheet & PEARLS, (presentation)
Hewson, D., (2015), PEAERLS Ratios for Ethiopia (presentations and paper)
Morrissey, L., ILCUF, (2016), PEARLS Manual for Ethiopia
O’Sullivan, T., ILCUF (2014), PEARLS Training Presentations
WOCCU, (2009), Richardson, D. C., PEARLS Monitoring System sourced from
http://www.woccu.org/financialinclusion/pearls/pearlsmonograph (11.2016)