peak oil. this is a complicated and a difficult question facing humanity, few people are aware of...
TRANSCRIPT

Peak Oil

This is a complicated and a difficult question facing humanity, few people are aware of the role oil plays in our lives, here are uses and applications:
60000 Industrial products are based on oil or partially built from oil input, such products include: Ammonia, Anesthetics, Antihistamines, Artificial limbs, Artificial Turf, Antiseptics, Aspirin, Auto Parts, Awnings, Balloons, Ballpoint pens, Bandages, Beach Umbrellas, Boats, Cameras, Candles, Car Battery Cases, Carpets, Caulking, Combs, Cortisones, Cosmetics, Crayons, Credit Cards, Curtains, Deodorants, Detergents, Dice, Disposable Diapers, Dolls, Dyes, Eye Glasses, Electrical Wiring Insulation, Faucet Washers, Fishing Rods, Fishing Line, Fishing Lures, Food Preservatives, Food Packaging, Garden Hose, Glue, Hair Coloring, Hair Curlers, Hand Lotion, Hearing Aids, Heart Valves, Ink, Insect Repellant, Insecticides, Linoleum, Lip Stick, Milk Jugs, Nail Polish, Oil Filters, Panty Hose, Perfume, Petroleum Jelly, Rubber Cement, Rubbing Alcohol, Shampoo, Shaving Cream, Shoes, Toothpaste, Trash Bags, Upholstery, Vitamin Capsules, Water Pipes, Yarn
100% of modern agriculture is powered by oil (fertilizer, insecticide ,transport .. etc). 95% of private and public transport is powered by oil. (55% of oil use in the world)
1 barrel = 25000 human work hours.

World oil consumption85m barrels per day (74 million crude oil, reminder natural gas liquids, bio fuels). 30 Billion barrels per year. (27 billion barrels crude oil per year).

Oil Usage Rates

Car ownership
Where do China and India stand?China car ownership is about 40 per 1000.India car ownership is about 8 per 1000.

Peak Oil defined
The problem of peak oil is a not problem of immediately running out of oil, it is about:
Reaching the peak flow of oil. Degrading quality of oil, as the easy high
quality oil is depleted. Accelerated decline rates. Dwindling reserves, reserves overstatements.
Liquid energy problem. (Wind, solar is
irrelevant).
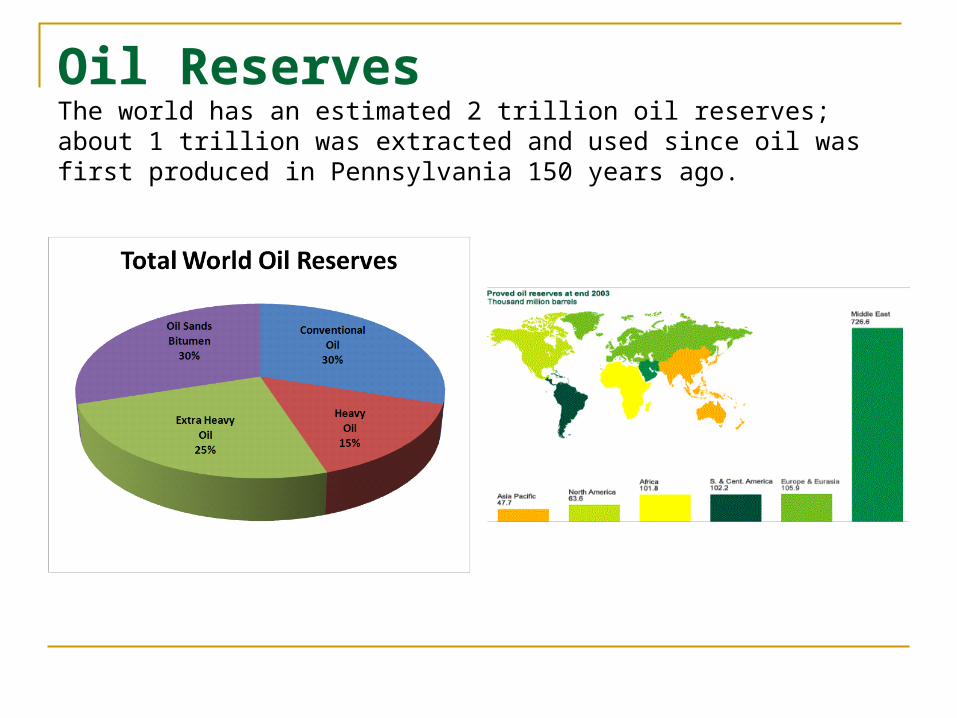
Oil ReservesThe world has an estimated 2 trillion oil reserves; about 1 trillion was extracted and used since oil was first produced in Pennsylvania 150 years ago.

Are the reserves there?Selected Reported Reserves (Gb) with Suspect Increases
YearAbu
Dhabi
Dubai Iran Iraq KuwaitSaudi
Arabia*
VenezuelaSpurious
Amount
1980 28.00 1.40 58.00 31.00 65.40 163.35 17.87 0
1981 29.00 1.40 57.50 30.00 65.90 165.00 17.95 0
1982 30.60 1.27 57.00 29.70 64.48 164.60 20.30 0
1983 30.51 1.44 55.31 41.00? 64.23 162.40 21.50 11.3
1984 30.40 1.44 51.00 43.00 63.90 166.00 24.85 0
1985 30.50 1.44 48.50 44.50 90.00? 169.00 25.85 26.1
1986 31.00 1.40 47.88 44.11 89.77 168.80 25.59 0
1987 31.00 1.35 48.80 47.10 91.92 166.57 25.00 0
1988 92.21? 4.00? 92.85? 100.00? 91.92 166.98 56.30? 192.11
1989 92.21 4.00 92.85 100.00 91.92 169.97 58.08 0
1990 92.00 4.00 93.00 100.00 95.00 258.00?? 59.00 88.3
TOTALS: Declared Reserves for above Nations (1990) = 701.00 Gb - Spurious Claims = 317.54 Gb
data from Dr. Colin Campbell, in SunWorld, 1995 (click here for references)
Growing Gap
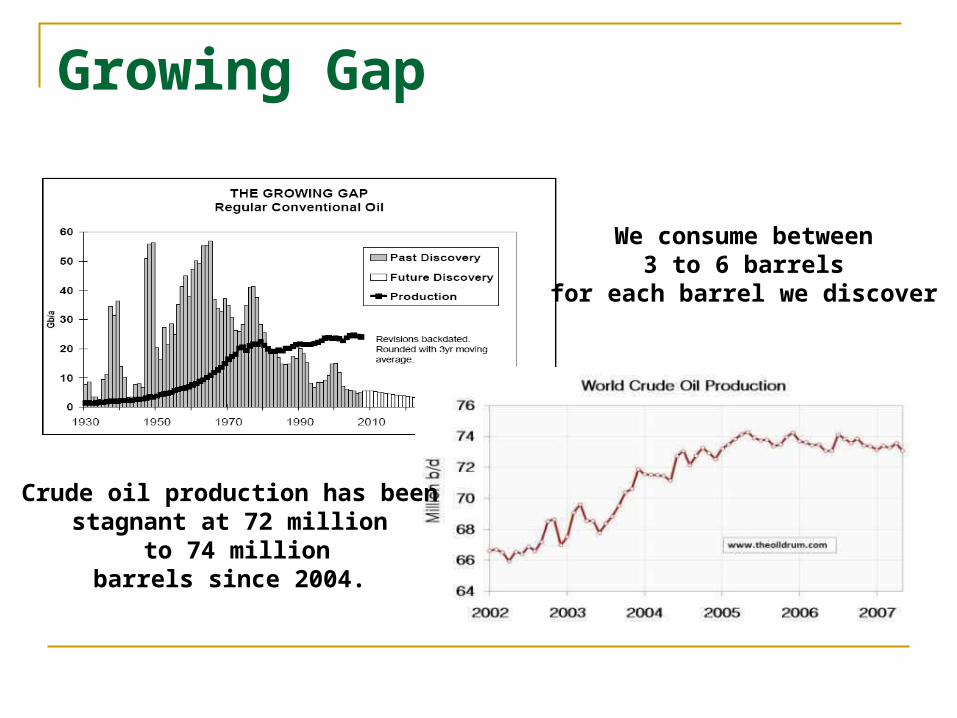
We consume between 3 to 6 barrels
for each barrel we discover
Crude oil production has beenstagnant at 72 million
to 74 millionbarrels since 2004.

State of production todayOnly 14 of the 54 oil producing nations in the world are still increasing their oil
production. Some of the Past Peak Countries:
Country Peak Prod.
2008 Prod.
% Off
Peak
Peak Year
USA 11.2m 7.3m -35% 1970
Libya 3.3m 1.8m -45% 1970
UK 2.9m 1.5m -47% 1999
Norway 3.4m 2.4m -28% 2001
Mexico 3.4m 3.1m -17% 2004
Indonesia 1.6m 1m -41% 1977

Degrading quality of oil
As more expensive oil is extracted the net energy available to society dwindle, and you need to extract more barrels to obtain the same energy (making the problem worst).

Example:
1 Barrel of crude oil include 5.8 million BTU1 Barrel of natural gas liquids include 4.2 million BTU
A barrel of natural gas liquid provide 72% of the energy of a barrel of crude, thus 1.38 barrels of natural gas liquids need to be produced to replace one barrel of oil.

Accelerated decline rates
Oil fields decline, but they don’t decline at the same speed, decline rates vary based on:
- Size of the field - Small fields decline faster. - Location of the field (offshore or onshore). - Offshore fields decline faster. - Technology used to extract the oil. - Modern fields decline faster.
Observed decline rates (with investments):Post Peak: 6.7%
3.4% for the very largest fields, 6.5% for the next-largest 10.4% for the next size down.
Excluding investments, the decline rate is 9% per year.

Meeting the demand Challenge
The IEA calculates that the world will need to add a whopping 64 million barrels per day (mbpd) of new capacity between 2007 and 2030 in order to meet an anticipated demand growing at 1.6% per year. That's like adding six new Saudi Arabias In order to accomplish all this, the IEA projects that the world will need to spend $26 trillion by 2030, or over $1 trillion per year. Of that, over $13 trillion "goes simply to maintain the current level of supply capacity"

In summary:World oil demand is expected to grow substantially due to the
economic growth and urbanization of the developing world, the growth in the earth population and increased mobility due to globalization, meanwhile oil supply suffers from:
High depletion rates. (smaller fields, offshore fields). Overstated reserves. (political reserves) Degrading oil quality. (oil sands, heavy oil and sour oil) Drop in investments. (recession, oil price volatility) Falling discovery rate. (most of the planet has been explored) Political instability in several key oil producers (Nigeria, Iraq, Iran,
Venezuela, Ecuador).
The combination of rising demand vs stagnant supply is likely to exert continued upward pressure on oil prices.

References
Oil Drum. BP Statistical Review. International Energy Agency (IEA). Energy Information Agency (EIA). Energy Bulletin. Simmons and Company International. Cambridge Energy Research Asso. (CERA). ASPO International.