women of color: their employment in the …. equal employment opportunity commission women of color:...
TRANSCRIPT
WOMEN OF COLOR:THEIR EMPLOYMENT IN THE PRIVATESECTOR
U.S. EQUAL EMPLOYMENT OPPORTUNITY COMMISSION
2003

U.S. Equal Employment Opportunity CommissionWOMEN OF COLOR: THEIR EMPLOYMENT IN THE PRIVATE SECTOR
July 2003 Executive Summary
WOMEN OF COLOR:THEIR EMPLOYMENT IN THE PRIVATE SECTOR
EXECUTIVE SUMMARY
• The employment of women of color increased dramatically in the periodbetween 1990 and 2001. The rate of change for African American women isthe lowest increase at 43 percent and the rate of change for Hispanic womenis the highest at 104 percent.
• Although women of color still remain a relatively small percentage of allofficials and managers, their increase in the decade between 1990 and 2001is dramatic. Their rates of changes range from 75 percent for AfricanAmerican women to 135 percent for Asian women.
• Based on a comparison with their employment as professionals, techniciansand sales workers, women of color have high probabilities of becomingmanagers in (1) Legal Services and (2) Offices of Physicians. This is true foreach of the minority groups when analyzed separately. This finding may beproblematic, as officials and managers in these industries are likely to havelower employment status than others. In contrast, each of the minority groupsappears to have low probabilities of becoming managers in DepartmentStores.
• Per capita charge rates were computed by dividing the number of chargesfiled by women of color against firms in an industry by their employment inthat industry. Race/ethnicity and industry both have an effect on per capitacharge rates. While there are minor differences in charge rates betweenrace/ethnic groups of women, there is consistency in the industrial rankings ofcharge rates across these race/ethnic groups.
AFRICAN AMERICAN WOMEN
• African American women represent the largest share of minority women’sEEO-1 employment over the decade with 7.6 percent of employment in 2001. The rate of change from 1990 to 2001 in the number of African Americanwomen employed is 43 percent.

U.S. Equal Employment Opportunity CommissionWOMEN OF COLOR: THEIR EMPLOYMENT IN THE PRIVATE SECTOR
July 2003 Executive Summaryii
• Nursing and Residential Care Facilities has the largest percentage of AfricanAmerican women employed (23.4 percent) and also has the largestpercentage of women overall (82.5 percent).
• African American women represent 7.6 percent of all EEO-1 employment. African American women exceed this representation in sales, clerical andservice jobs.
• The number of African American women reported as officials and managerson EEO-1 reports increased from 111,318 to 195,784 which is a rate ofchange greater than 75 percent.
• The industries most likely to employ African American women as officials andmanagers are (1) Social Assistance, (2) Nursing and Residential CareFacilities and (3) Religious/Grantmaking, Civic, Professional and SimilarOrganizations.
• Based on a comparison with their employment as professionals, techniciansand sales workers, African American women have the highest probabilities ofbecoming managers, in Legal Services and the lowest probability inDepartment Stores.
• Automotive Dealers and Service Stations, Miscellaneous Manufacturing and General Building Contractors have high per capita charge rates for AfricanAmerican women.
HISPANIC WOMEN
• The employment of Hispanic women in the private sector increased from 2.9 percent in 1990 to 4.7 percent in 2001. The rate of change in the numberof Hispanic women employed is 104 percent.
• Crop production employs the largest percentage of Hispanic women (18.5 percent) and the largest percentage of total Hispanics (61.8 percent). However, the variation in these proportions shows the extent to which theindustry is much more male-dominated.
• Hispanic women represent 4.7 percent of all EEO-1 employment. Hispanicwomen exceed this total representation as sales workers, clericals, laborersand service workers.
• The number of female Hispanic officials and managers reported on EEO-1reports more than doubled with a rate of change for Hispanic women of

U.S. Equal Employment Opportunity CommissionWOMEN OF COLOR: THEIR EMPLOYMENT IN THE PRIVATE SECTOR
July 2003 Executive Summaryiii
130 percent.
• Hispanic women are most likely to be employed as managers in (1) Water Transportation, (2) Scenic and Sightseeing Transportation and (3) Accommodations.
• Based on a comparison with their employment as professionals, techniciansand sales workers, Hispanic women have the highest probabilities ofbecoming managers, in (1) Legal Services, (2) Offices of Physicians and(3) Architectural, Engineering and Related Services.
• Based on a comparison with their employment as professionals, techniciansand sales workers, Hispanic women have the highest probabilities ofbecoming managers, in Legal Services and the lowest probability inDepartment Stores.
• Construction-based industries such as Special Trade Contractors andGeneral Building Contractors have high per capita charge rates for Hispanicwomen.
ASIAN WOMEN
• Asian women increased in employment from 1.3 percent in 1990 to 2.1percent in 2001, a change of 51.5 percent. The rate of change in the numberof Asian women employed is 96 percent.
• The top ranked industry for the employment of Asian women is Computer &Electronic Product Manufacturing which is also the highest rated industry forAsians overall. However, the retail industries, Clothing & ClothingAccessories Stores and Health & Personal Care Stores, are higher rankedfor Asian women than for all Asians.
• Asian women represent 2.1 percent of all EEO-1 employment. Asian womenexceed their total representation as professionals, technicians, and clericals.
• The number of female Asian officials and managers reported on EEO-1reports more than doubled from 1990 to 2001 with a rate of change for Asianwomen of 135 percent.
• The top three industries for the employment of Asian women as managersare (1) Motion Picture and Sound Recording Industries, (2) Nursing &Residential Care Facilities and (3) Clothing & Clothing Accessories Stores.

U.S. Equal Employment Opportunity CommissionWOMEN OF COLOR: THEIR EMPLOYMENT IN THE PRIVATE SECTOR
July 2003 Executive Summaryiv
• Based on a comparison with their employment as professionals, techniciansand sales workers, Asian women have the highest probabilities of becomingmanagers, in Full Service Restaurants and the lowest probability inPharmaceutical and Medicine Manufacturing.
• Asian women are most likely to file charges against firms in the Manufacturingof Apparel and Other Textile Products. Auto Repair Services and Parking isranked second for Asian women. Similar to African American women andHispanic women, Automotive Dealers and Service Stations is among thoseindustries with the highest per capita charge rates for Asian women.
NATIVE AMERICAN WOMEN
• From 1990 to 2001, the employment of Native American women grew justslightly from 0.2 percent to 0.3 percent. The rate of change in the number ofAmerican Indian women employed is 81.0 percent.
• Native American women are most frequently employed in the industries of Gasoline Stations and Apparel Manufacturing.
• Native American women make up 0.3 percent of all EEO-1 employment. Native American women exceed their total representation as sales workers,clericals and service workers.
• The number of American Indian officials and managers nearly doubled with arate of change of 87 percent.
• The top three industries for the employment of Native American women asmanagers are (1) Gasoline Stations, (2) Social Assistance and (3) GeneralMerchandise Stores.
• Based on a comparison with their employment as professionals, techniciansand sales workers, Native American women have the highest probabilities ofbecoming managers, in Legal Services and the lowest probability in Pulp,Paper and Paperboard Mills.
• Social Services, Miscellaneous Retail, and Hotels and other Lodgingindustries have high per capita charge rates for Native American women.

U.S. Equal Employment Opportunity CommissionWOMEN OF COLOR: THEIR EMPLOYMENT IN THE PRIVATE SECTOR
July 2003 Table of Contents
TABLE OF CONTENTS
INTRODUCTION . . . . . . . . . . . . . . . . . . . . . . . . . . . . . . . . . . . . . . . . . . . . . . . . . . 1
TOTAL EMPLOYMENT . . . . . . . . . . . . . . . . . . . . . . . . . . . . . . . . . . . . . . . . . . . . . 2
DISTRIBUTION BY JOB GROUP . . . . . . . . . . . . . . . . . . . . . . . . . . . . . . . . . . . . . 8
EMPLOYMENT AS OFFICIALS AND MANAGERS . . . . . . . . . . . . . . . . . . . . . . . 11
MOVEMENT OF WOMEN FROM WHITE COLLAR TO MANAGEMENT POSITIONS . . . . . . . . . . . . . . . . . 17
PER CAPITA CHARGE RATES . . . . . . . . . . . . . . . . . . . . . . . . . . . . . . . . . . . . . . 26
ADDITIONAL INFORMATION . . . . . . . . . . . . . . . . . . . . . . . . . . . . . . . . . . . . . . . 34

U.S. Equal Employment Opportunity CommissionWOMEN OF COLOR: THEIR EMPLOYMENT IN THE PRIVATE SECTOR
1 See “Section 5, Description of Job Categories” in the EEO-1 instruction booklet at
http://www.eeoc.gov/stats/jobpat/e1instruct.htm l.
2 There are more than 100 state and local Fair Employment Practices Agencies (FEPAs). The
EEOC has cooperative relationships with all but a few of them. The EEOC and the FEPAs it works
with have reached W orksharing Agreements that divide up their comm on workload of charges in order
to avoid duplication of charge processing. Each charge of discrimination that is covered by both an
EEOC-enforced statute and the FEPA’s law or ordinance is dual-filed under both laws, regardless of
which agency receives it.
July 2003 Page 1
INTRODUCTION
This examination of the employment status of minority women or women of colorrelies primarily on the Equal Employment Opportunity Commission’s (EEOC’s) EEO-1 report. Characteristics of employment are examined from five differentperspectives: total employment, employment by job group, employment of officialsand managers, the movement of women from white collar to management positionsand per capita charge rates by industry. The report seeks to capture thesemeasures using the most recent EEO-1 data from 2001 and by examining recenttrends from 1990. It also utilizes charge receipt data.
The annual EEO-1 report indicates the composition of an employer’s workforces bysex and by race/ethnic category. The EEO-1 collects data on nine major jobcategories: (1) officials and managers, (2) professionals, (3) technicians, (4) salesworkers, (5) office and clerical workers, (6) craft workers, (7) operatives, (8) laborersand (9) service workers.1 Race/ethnic designations used are White (not of Hispanicorigin), Black (not of Hispanic origin), Hispanic, Asian or Pacific Islander (Asian),American Indian or Alaskan Native (Native American). In addition to the workforcedata provided by the employer, information about each establishment is added tothe database. This includes the establishment’s North American IndustrialClassification System code and, in early years, added the Standard IndustrialClassification code.
The examination of per capita charge rates combines information from the EEO-1with charge data from EEOC’s Integrated Mission System (IMS). IMS is anintegrated data base application which supports charge processing, litigation andoutreach activities. Data used are from fiscal year 2002 (October 2001 toSeptember 2002) and include charges received by either the EEOC or FairEmployment Practice Agencies (FEPAs)2. To be included in the analyses of percapita charge rates, it was necessary that the charge record contain informationregarding gender, race and/or ethnicity for the charging party and informationregarding the employer’s industry.

U.S. Equal Employment Opportunity CommissionWOMEN OF COLOR: THEIR EMPLOYMENT IN THE PRIVATE SECTOR
July 2003 Page 2
TOTAL EMPLOYMENT
Throughout the past decade (1990 to 2001), the total employment of women of colorhas remained for each group a relatively small proportion. However, there has beensome growth and, taken as a group, they grew from 11 percent in 1990 to 14.5percent in 2001 for a 33 percent increase.
Total Employment of Women by Race/Ethnic GroupEEO-1 Data 1990 to 2001
• African American women represent the largest share of minority women’sEEO-1 employment over the decade with 7.6 percent of employment in 2001. The rate of change, from 1990 to 2001, in the number of African Americanwomen employed is 43 percent, showing substantial growth, but this is farbelow the rates for Hispanic and Asian women.
• The employment of Hispanic women in the private sector increased from

U.S. Equal Employment Opportunity CommissionWOMEN OF COLOR: THEIR EMPLOYMENT IN THE PRIVATE SECTOR
3 Industries with 25 or fewer EEO-1 reports filed are excluded from theseanalyses.
July 2003 Page 3
2.9 percent in 1990 to 4.7 percent in 2001. The rate of change in the numberof Hispanic women employed is 104 percent.
• Asian women increased in employment from 1.3 percent to 2.1 percent, achange of 51.5 percent. The rate of change in the number of Asian womenemployed is 96 percent.
• The employment of Native American women grew just slightly from 0.2 percent to 0.3 percent. The rate of change in the number of AmericanIndian women employed is 81.0 percent.
Table 1 provides some of the details of these changes.
Table 1Changes in the Employment of
Minority Women
WOMEN EMPLOYMENT RATE OF PERCENTAGES RATE OF
CHANGE
1990 2001 CHANGE 1990 2001
AFRICAN
AMERICAN
2,780,544 3,983,140 0.433 6.6% 7.6% 0.147
HISPANICS 1,201,609 2,452,120 1.041 2.9% 4.7% 0.633
ASIANS 554,567 1,089,225 0.964 1.3% 2.1% 0.572
NATIVE
AMERICAN
84,978 153,645 0.808 0.2% 0.3% 0.447
Women of color are not employed evenly among all industries. The following tablesrank industries (as defined by the North American Industrial Classification System,industry sub sectors) based on the percentage of women who are AfricanAmericans, Hispanics, Asians and Native Americans.3

U.S. Equal Employment Opportunity CommissionWOMEN OF COLOR: THEIR EMPLOYMENT IN THE PRIVATE SECTOR
July 2003 Page 4
Table 2 lists the 10 industries where African American women have the highestpercentage of employment. Nursing and Residential Care Facilities has the largestpercentage of African American women employed (23.4 percent) and also has thelargest percentage of women overall (82.5 percent).
Table 2Top Ten Industries
Based on the Employment of African American WomenSource: EEO-1 Reports for 2001
INDUSTRY
EMPLOYMENT
REPORTS
FILED
AFRICAN
AMERICAN
WOMEN
AFRICAN
AMERICAN
WOMEN
PERCENT TOTAL
Nursing & Residential
Care Facilities
277,413 23.39 1,185,908 7,747
Social Assistance 49,663 17.62 281,903 1,839
Monetary Authorities -
Central Bank
3,842 15.34 25,041 70
Religious/Grantmaking/
Prof/Like Organizations
34,465 13.69 251,737 1,462
Ambulatory Health
Care Services
121,779 13.39 909,656 4,507
Transit & Ground
Passenger
Transportation
19,432 12.68 153,211 861
Textile Mills 28,954 12.64 229,003 902
Apparel Manufacturing 22,906 12.25 186,951 796
Credit Intermediation &
Related Activities
156,906 11.69 1,341,891 6,094
Broadcasting &
Telecommunications
155,564 11.36 1,368,854 6,585

U.S. Equal Employment Opportunity CommissionWOMEN OF COLOR: THEIR EMPLOYMENT IN THE PRIVATE SECTOR
July 2003 Page 5
Table 3 provides similar data for Hispanic women. Those industries with the largestpercent of Hispanic women are very similar to that for all Hispanics. Crop productionemploys the largest percentage of Hispanic women (18.5 percent) and the largestpercentage of total Hispanics (61.8 percent). However, the variation in theseproportions shows the extent to which the industry is much more male dominated. Like the results for total Hispanics, Agriculture and Forestry Support Servicesemploys the second highest percentage of Hispanics but Personal & LaundryServices while ranked third for Hispanic women, is ranked a bit lower (sixth) for allHispanics.
Table 3Top Ten Industries
Based on the Employment of Hispanic WomenSource: EEO-1 Reports for 2001
INDUSTRY
EMPLOYMENT
REPORTS
FILED
HISPANIC
WOMEN
HISPANIC
WOMEN
PERCENT TOTAL
Crop Production 11,725 18.48 63,440 248
Agriculture & Forestry
Support Activities
4,178 16.35 25,552 86
Personal & Laundry
Services
21,485 13.45 159,773 1,175
Accommodation 105,123 11.60 906,306 3,341
Apparel Manufacturing 20,110 10.76 186,951 796
Animal Production 5,170 9.95 51,979 229
Food Mfg 108,175 9.73 1,112,240 3,673
Scenic & Sightseeing
Transportation
735 9.49 7,749 34
Leather & Allied Product
Mfg
3,463 7.89 43,909 176
Clothing & Clothing
Accessories Stores
17,864 7.75 230,481 1,989

U.S. Equal Employment Opportunity CommissionWOMEN OF COLOR: THEIR EMPLOYMENT IN THE PRIVATE SECTOR
July 2003 Page 6
Industries are also ranked on the basis of their employment of Asian women. Table4 provides those results. The top ranked industry for Asian women is Computer &Electronic Product Manufacturing which is also the highest rated industry for Asiansoverall. The ranking for employment by industry for Asian women and all Asianstends to be very similar. However, the retail industries, Clothing & ClothingAccessories Stores and Health & Personal Care Stores are higher ranked for Asianwomen than for all Asians. Further, Electronic and Appliance Stores, while ranked inthe top ten for all Asians is not ranked in the top ten for Asian women.
Table 4Top Ten Industries
Based on the Employment of Asian WomenSource: EEO-1 Reports for 2001
INDUSTRY
EMPLOYMENT
REPORTS
FILED
ASIAN
WOMEN
ASIAN
WOMEN
PERCENT TOTAL
Computer &
Electronic Product
Mfg
71,241 4.92 1,448,636 4,331
Clothing & Clothing
Accessories Stores
10,048 4.36 230,481 1,989
Health & Personal
Care Stores
5,316 4.07 130,564 1,387
Accommodation 35,004 3.86 906,306 3,341
Miscellaneous Mfg 18,221 3.77 483,589 1,917
Hospitals 145,695 3.70 3,942,645 4,284
Monetary Authorities
- Central Bank
922 3.68 25,041 70
Security, Commodity
Contracts & Like
Activity
15,179 3.51 432,483 1,573
Credit Intermediation
& Related Activities
46,681 3.48 1,341,891 6,094
Nursing & Residential
Care Facilities
38,001 3.20 1,185,908 7,747

U.S. Equal Employment Opportunity CommissionWOMEN OF COLOR: THEIR EMPLOYMENT IN THE PRIVATE SECTOR
July 2003 Page 7
Finally, the employment of Native American women is examined by industry. Results are shown in Table 5. While this group represents just a small percentageof employment, the distribution of these workers is not uniform. While total NativeAmericans/Alaskan Native employment is heavily represented in extractionindustries, Native American women are more frequently found in other industries,such as gasoline stations and apparel manufacturing.
Table 5Top Ten Industries
Based on the Employment of American Indians/Alaskan NativesSource: EEO-1 Reports for 2001
INDUSTRY
EMPLOYMENT
REPORTS
FILED
NATIVE
AMERICAN
WOMEN
NATIVE
AMERICAN
WOMEN
PERCENT TOTAL
Gasoline Stations 432 0.64 67,454 498
Apparel
Manufacturing
1,049 0.56 186,951 796
Pipeline
Transportation
124 0.53 23,307 110
General
Merchandise
Stores
13,467 0.51 2,630,079 13,109
Ambulatory Health
Care Services
4,405 0.48 909,656 4,507
Nursing &
Residential Care
Facilities
5,099 0.43 1,185,908 7,747
Social Assistance 1,119 0.40 281,903 1,839
Food & Beverage
Stores
7,584 0.39 1,945,304 15,509
Hospitals 15,131 0.38 3,942,645 4,284
Food Services &
Drinking Places
5,709 0.38 1,522,230 16,299

U.S. Equal Employment Opportunity CommissionWOMEN OF COLOR: THEIR EMPLOYMENT IN THE PRIVATE SECTOR
July 2003 Page 8
Figure 2
DISTRIBUTION BY JOB GROUP
Traditionally, the employment of women in EEO-1 job groups is heavily skewedtoward high representation in office and clerical jobs and low representation in craftjobs. Nevertheless, the examination of minority women across all job groupsprovides a useful insight into their employment status.
DISTRIBUTION OF AFRICAN AMERICAN WOMENBY JOB GROUP
• African American women represent 7.6 percent of all EEO-1 employment.
• African American women exceed this representation as sales workers,clericals and service workers.
• African American women fall below their overall representation as officialsand managers, professionals, technicians, craft workers, operatives andlaborers.
U.S. Equal Employment Opportunity CommissionWOMEN OF COLOR: THEIR EMPLOYMENT IN THE PRIVATE SECTOR
July 2003 Page 9
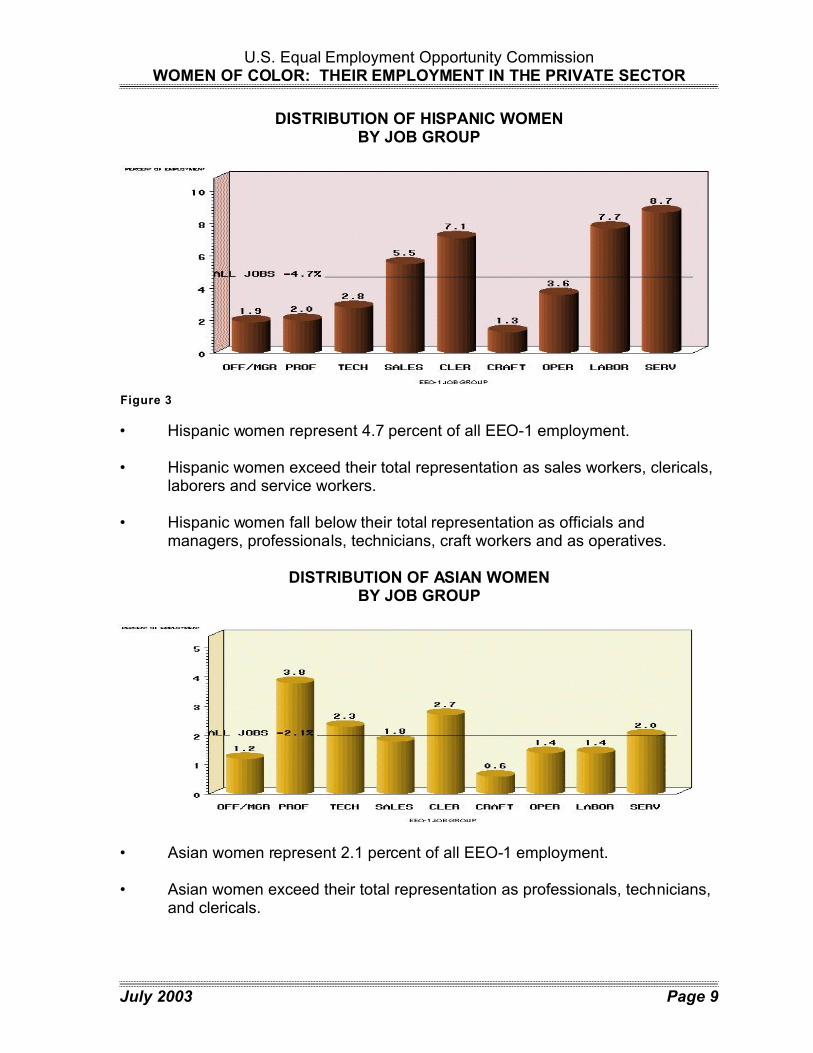
Figure 3
DISTRIBUTION OF HISPANIC WOMENBY JOB GROUP
• Hispanic women represent 4.7 percent of all EEO-1 employment.
• Hispanic women exceed their total representation as sales workers, clericals,laborers and service workers.
• Hispanic women fall below their total representation as officials andmanagers, professionals, technicians, craft workers and as operatives.
DISTRIBUTION OF ASIAN WOMENBY JOB GROUP
• Asian women represent 2.1 percent of all EEO-1 employment.
• Asian women exceed their total representation as professionals, technicians,and clericals.

U.S. Equal Employment Opportunity CommissionWOMEN OF COLOR: THEIR EMPLOYMENT IN THE PRIVATE SECTOR
July 2003 Page 10
• Asian women fall below their total representation as officials and managers,sales workers, craft workers, operatives and laborers.
DISTRIBUTION OF NATIVE AMERICAN WOMENBY JOB GROUP
• Native American women make up 0.3 percent of all EEO-1 employment.
• Native American women exceed their total representation as sales workers,clericals and service workers.
• Native American women fall below their representation as officials andmanagers, professionals, craft workers and operatives.

U.S. Equal Employment Opportunity CommissionWOMEN OF COLOR: THEIR EMPLOYMENT IN THE PRIVATE SECTOR
July 2003 Page 11
Figure 6
EMPLOYMENT AS OFFICIALS AND MANAGERS
Another method for examining the employment status of minority women is toexamine their employment in higher paying job categories, such as officials andmanagers.
The Employment of Minority Womenas Officials and Managers
1990-2001
• Although women of color still remain a relatively small percentage of allofficials and managers, their increase in the decade between 1990 and 2001is dramatic when raw numbers are examined.

U.S. Equal Employment Opportunity CommissionWOMEN OF COLOR: THEIR EMPLOYMENT IN THE PRIVATE SECTOR
July 2003 Page 12
• The number of African American women reported as officials and managerson EEO-1 reports increased from 111,318 to 195,784 which is a rate ofchange greater than 75 percent.
• The number of Hispanic women and Asian women officials and managersreported on EEO-1 reports more than doubled with a rate of change forHispanic women of 130 percent and 135 percent for Asians.
• The number of Native American women officials and managers nearlydoubled with a rate of change of 87 percent.
Table 6 provides some of the details of these changes.
Table 6Changes in the Employment of
Minority Women as Officials and Managers
WOMEN
EMPLOYMENT
RATE OF
CHANGE
PERCENTAGES
RATE OF
CHANGE1990 2001 1990 2001
AFRICAN
AMERICAN
111,318 195,784 0.759 2.2% 3.3% 0.471
HISPANICS 49,137 112,805 1.296 1.0% 1.9% 0.920
ASIANS 29,369 69,009 1.350 0.6% 1.2% 0.965
NATIVE
AMERICAN
4,965 9,279 0.869 0.1% 0.2% 0.563
Just as the total employment of women and minority groups fluctuates by industry,they are not employed evenly across all industries as officials and managers. Table7 lists the 10 industries where African American women have the highest percentageof officials and managers.
The industries with the largest proportion of African American women officials andmanagers are very similar to those industries with the largest proportion of AfricanAmerican women employees. The order of these industries varies. For example,Broadcasting and Telecommunications is the10th ranked industry with respect to theemployment of African American women overall, but it increases to the fifth-ranked

U.S. Equal Employment Opportunity CommissionWOMEN OF COLOR: THEIR EMPLOYMENT IN THE PRIVATE SECTOR
July 2003 Page 13
with respect to African American women managers. The industries most likely toemploy African American women as officials and managers are (1) SocialAssistance, (2) Nursing and Residential Care Facilities and (3) Religious/Grantmaking, Civic, Professional and Similar Organizations.
Table 7Top Ten Industries Based on the
Employment of African American Women as Officials and Managers
INDUSTRY
MANAGERS
REPORTS
FILEDWOMEN
PERCENT
WOMEN TOTAL
Social Assistance 2,678 10.30 26,003 1,839
Nursing & Residential
Care Facilities
6,836 8.870 77,067 7,747
Religious/Grantmaking/
Prof/Like Organizations
2,411 7.922 30,434 1,462
Monetary Authorities -
Central Bank
296 6.433 4,601 70
Broadcasting &
Telecommunications
13,186 6.217 212,109 6,585
Transit & Ground
Passenger
Transportation
321 5.289 6,069 861
Ambulatory Health Care
Services
3,613 5.115 70,636 4,507
Couriers & Messengers 2,964 5.062 58,554 1,066
Accommodation 4,616 4.970 92,875 3,341
Clothing & Clothing
Accessories Stores
1,640 4.907 33,425 1,989
The industries most likely to employ Hispanic women as officials and managers aresomewhat different than those most likely to hire Hispanic women overall. The topthree industries for the total employment of Hispanic women are (1) CropProduction, (2) Agriculture and Forestry Support Activities and (3) Personal andLaundry Support Services. In contrast, Hispanic women are most likely to beemployed as managers in (1) Water Transportation, (2) Scenic and SightseeingTransportation and (3) Accommodations. See Table 8.

U.S. Equal Employment Opportunity CommissionWOMEN OF COLOR: THEIR EMPLOYMENT IN THE PRIVATE SECTOR
July 2003 Page 14
Table 8Top Ten Industries Based on the Employment of Hispanic Women
As Officials and Managers
INDUSTRY
MANAGERS
REPORTS
FILEDHISPANIC
WOMEN
HISPANIC
WOMEN
PERCENT TOTAL
Water Transportation 252 4.14 6,095 107
Scenic & Sightseeing
Transportation
34 4.07 835 34
Accommodation 3,772 4.06 92,875 3,341
Clothing & Clothing
Accessories Stores
1,224 3.66 33,425 1,989
Social Assistance 870 3.35 26,003 1,839
Apparel
Manufacturing
552 3.25 17,010 796
Crop Production 159 3.13 5,087 248
General Merchandise
Stores
5,742 3.09 185,620 13,109
Motion Picture &
Sound Recording
Industries
473 2.93 16,144 769
Credit Intermediation
& Related Activities
7,412 2.78 266,743 6,094
While Motion Picture and Sound Recording Industries is the top employer of Asianwomen managers, it is not in the top ten industries employing Asian women.Similarly, Nursing and Residential Care Facilities is the second highest employer ofAsian managers but just 10th with respect to total employment. See Table 9.

U.S. Equal Employment Opportunity CommissionWOMEN OF COLOR: THEIR EMPLOYMENT IN THE PRIVATE SECTOR
July 2003 Page 15
Table 9Top Ten Industries Based on the
Employment of Asian Women as Officials and Managers
INDUSTRY
MANAGERS
REPORTS
FILED
ASIAN
WOMEN
ASIAN
WOMEN
PERCENT TOTAL
Motion Picture & Sound
Recording Industries
464 2.87 16,144 769
Nursing & Residential
Care Facilities
1,902 2.47 77,067 7,747
Clothing & Clothing
Accessories Stores
794 2.38 33,425 1,989
Accommodation 2,094 2.26 92,875 3,341
Security, Commodity
Contracts & Like Activity
1,581 2.07 76,356 1,573
Credit Intermediation &
Related Activities
5,302 1.99 266,743 6,094
Hospitals 4,368 1.81 241,093 4,284
Monetary Authorities -
Central Bank
82 1.78 4,601 70
Computer & Electronic
Product Mfg
3,742 1.77 211,962 4,331
Museums, Historical
Sites & Like Institutions
76 1.68 4,532 110
Gasoline Stations are the top employer of Native American women overall and asofficials and managers. Besides that similarity, those industries employing thelargest proportion of Native American women as officials and managers are quitedifferent from those employing Native American women in all positions. The secondand third ranked industries with respect to the employment of Native Americanwomen as officials and managers, Social Assistance and General MerchandiseStores, are not even in the top ten industries employing Native American women. See Table 10 for more detailed information.

U.S. Equal Employment Opportunity CommissionWOMEN OF COLOR: THEIR EMPLOYMENT IN THE PRIVATE SECTOR
July 2003 Page 16
Table 10Top Ten Industries Based on the
Employment of American Indian/Alaskan Native Womenas Officials and Managers
INDUSTRY
MANAGERS
REPORTS
FILED
NATIVE
AMERICAN
WOMEN
NATIVE
AMERICAN
WOMEN
PERCENT TOTAL
Gasoline Stations 28 0.325 8,616 498
Social Assistance 68 0.262 26,003 1,839
General Merchandise Stores 477 0.257 185,620 13,109
Nursing & Residential Care
Facilities
192 0.249 77,067 7,747
Ambulatory Health Care
Services
172 0.244 70,636 4,507
Educational Services 23 0.241 9,530 515
Transit & Ground Passenger
Transportation
14 0.231 6,069 861
Food & Beverage Stores 421 0.226 186,126 15,509
Hospitals 525 0.218 241,093 4,284
Air Transportation 70 0.208 33,697 733
Conclusion
While the ranking of industries most likely to employ women of color as managersvaries by race/ethnic group there is some consistency. Industries ranked high onthis criteria for more than one group include, Social Assistance, Accommodations,Clothing and Clothing Accessories Stores, Nursing and Residential Care Facilities,and Motion Picture and Sound Recording Industries.

U.S. Equal Employment Opportunity CommissionWOMEN OF COLOR: THEIR EMPLOYMENT IN THE PRIVATE SECTOR
4 Industries with fewer than 15 com panies are not included, nor are those with m ore offic ials
and managers than white collar workers. Also, those industries where regression results showed no
relationship between white collar and off icials and managers are removed.
5 W eights are generated by us ing a canonical correlation of total off icials and managers with
total professional, total technical and total sales workers. The weights used are the standardized
regress ion coefficients. If the regress ion coefficient is less than zero or is not statistica lly significant, a
weight of zero is assigned. Thus, the job group is not included in the calculation.
July 2003 Page 17
MOVEMENT OF WOMEN FROM WHITE COLLAR TO MANAGEMENT POSITIONS
Associated with the issue of glass ceilings is the exclusion of women frommanagement positions. The issue might be even more severe for women of color.When minority women experience relatively high employment status, it might beexpected that they can move as easily into management positions as theircounterparts. This movement can be examined to some extent using EEO-1 data. For this analysis, the employment of women of color and all others is dividedbetween managers and white collar employees. White collar employees are definedas those in the EEO-1 job groups of professionals, technicians and sales workers. These white collar employees are treated as if they represent the pool of workersfrom which officials and managers are selected.
Steps are taken to eliminate those industries where this assumption is unlikely to beaccurate.4 Further, it is not expected that job groups within the pool of white collarworkers contribute evenly to management positions or that these relationships arethe same in all industries. Therefore, the job groups are weighted based on theircontribution.5 An odds ratio is computed for each firm within an industry. The oddsfor a particular group, such as African American women, is the number of AfricanAmerican women reported as officials and managers divided by the sum of AfricanAmerican women reported as professionals, technicians and sales workers, usingweighted values. The same calculation is made for all others, and the odds ratio isthe division of these two odds. Once an odds ratio is computed for individual firms,a median is then constructed for relevant industries. To improve the accuracy ofthese calculations, the more detailed North American Industrial ClassificationSystem codes for industry groups (four digit codes) are utilized. Results reported inthe following section are limited to the 50 industries with the largest EEO-1employment in order to provide a more meaningful list.
Table 11 shows the top ten major industries where African American women havethe highest probabilities of being managers (high median odds ratios). It isinteresting to note that officials and managers in the most favorable industries, Legal

U.S. Equal Employment Opportunity CommissionWOMEN OF COLOR: THEIR EMPLOYMENT IN THE PRIVATE SECTOR
July 2003 Page 18
Services, Offices of Physicians and Architectural, Engineering & Related Servicesmay have limited management responsibilities. Partners or associates in these firmsmay be the true managers. In these industries a number of “office managers” maycome from office and clerical workers in addition to professionals, technicians orsales workers.
Table 11Those Industries Where African American Women Have the Highest Odds
of Moving from Employment as Professionals, Technicians and Sales Workers to Management
Selected from the Top 50 Industries Based on Total Employment
INDUSTRY
NUMBER
OF
FIRMS
PERCENT OF AFRICAN
AMERICAN WOM EN
WEIGHTED
ODDS
RATIO
TOTAL
EMPLOY-
MENT
RANK MANAGERS
WHITE
COLLAR
POSITIONS
Legal Services 506 6.06 3.16 2.483 42
Offices of Physicians 392 5.93 6.53 1.691 44
Architectural, Engineering
& Related Services
705 1.36 1.86 1.535 18
Scheduled Air
Transportation
50 4.68 6.38 1.410 13
Employment Services 153 3.17 4.62 1.240 41
Building M aterial &
Supplies Dealers
139 1.48 4.94 1.232 19
Investigation & Security
Services
48 3.69 3.58 1.230 20
Computer Systems Design
& Related Services
639 2.94 2.92 1.163 15
Computer & Peripheral
Equipment Mfg
153 1.60 2.25 1.126 29
Nav/M easuring/M edical/
Control Instruments M fg
350 1.21 1.34 1.124 28

U.S. Equal Employment Opportunity CommissionWOMEN OF COLOR: THEIR EMPLOYMENT IN THE PRIVATE SECTOR
July 2003 Page 19
Table 12 shows the top ten major industries where African American women havethe lowest probabilities of being managers (low median odds ratios). DepartmentStores are ranked as having the lowest probability but their ratio may be somewhatskewed by those African American women that work part-time and may not beinterested in management positions due to their full-time employment in anotherarea. On the other hand, the segregation of these workers into sales worker jobswith limited opportunities for advancement may be the more pervasive explanationfor these results.
Table 12Those Industries Where African American Women Have the Lowest Odds
of Moving from Employment as Professionals, Technicians and Sales Workers to Management
Selected from the Top 50 Industries Based on Total Employment
INDUSTRY
NUMBER
OF FIRMS
PERCENT OF AFRICAN AMERICAN
WOMENTOTAL
EMPLOY-
MENT
RANKMANAGERS
WHITE
COLLAR
POSITIONS
WEIGHTED
ODDS
RATIO
Department Stores 50 5.70 12.68 0.478 3
Insurance Carriers 519 4.50 7.31 0.677 5
Pharmaceutical &
Medicine M fg
191 2.11 3.62 0.680 25
Nursing Care Facilities 1,021 7.96 15.51 0.706 10
Pulp, Paper & Paperboard
Mills
65 1.19 3.63 0.739 49
Depository Credit
Intermediation
325 5.24 6.53 0.741 8
Other Ambulatory Health
Care Services
328 6.02 9.57 0.753 48
Community Care Facilities
for the Elderly
449 8.25 16.26 0.760 45
Agencies & Other
Insurance Related
Activities
201 3.72 5.99 0.767 50
Elec Pwr Generation,
Transmsn & Distribution
212 1.70 2.54 0.796 24

U.S. Equal Employment Opportunity CommissionWOMEN OF COLOR: THEIR EMPLOYMENT IN THE PRIVATE SECTOR
July 2003 Page 20
Table 13 shows those industries where Hispanic women have the highest probabilityof becoming managers. The top three industries are the same as the top threeindustries for African American women. As mentioned previously, the predominanceof these industries might reflect negatively on the employment status of Hispanicwomen as managers in these industries are likely to have lower employment statusthan others.
Table 13Those Industries Where Hispanic Women Have the Highest Odds
of Moving from Employment as Professionals, Technicians and Sales Workers to Management
Selected from the Top 50 Industries Based on Total Employment
INDUSTRY
NUMBER
OF
FIRMS
PERCENT OF HISPANIC WOM EN
WEIGHTED
ODDS
RATIO
TOTAL
EMPLOY-
MENT
RANK MANAGERS
WHITE
COLLAR
POSITIONS
Legal Services 506 3.56 1.44 3.100 42
Offices of Physicians 392 4.21 4.46 2.124 44
Architectural,
Engineering & Related
Services
705 1.05 1.21 1.765 18
Employment Services 153 2.82 2.33 1.708 41
Nursing Care Facilities 1,021 3.36 2.70 1.653 10
Community Care
Facilities for the Elderly
449 3.55 2.61 1.519 45
Computer Systems
Design & Related
Services
639 1.61 1.25 1.505 15
Data Processing
Services
170 1.61 1.46 1.500 34
General Medical &
Surgical Hospitals
1,652 2.44 2.80 1.432 1
Investigation & Security
Services
48 1.70 1.28 1.336 20

U.S. Equal Employment Opportunity CommissionWOMEN OF COLOR: THEIR EMPLOYMENT IN THE PRIVATE SECTOR
July 2003 Page 21
Table 14 shows the top ten major industries where Hispanic women have the lowestprobabilities of being managers (low median odds ratios). Like African Americanwomen, Department Stores are ranked as having the lowest probability for Hispanicwomen to move into management positions. Other low ranked industries includeDepository Credit Intermediation (commercial banks and savings and loanassociations) and Pharmaceutical and Medicine Manufacturing. The latter is thethird lowest ranked industry for both African American and Hispanic women.
Table 14Those Industries Where Hispanic Women Have the Lowest Odds
of Moving from Employment as Professionals, Technicians and Sales Workers to Management
Selected from the Top 50 Industries Based on Total Employment
INDUSTRY
NUMBER
OF
FIRMS
PERCENT OF HISPANIC WOM EN
WEIGHTED
ODDS
RATIO
TOTAL
EMPLOY-
MENT
RANKMANAGERS
WHITE
COLLAR
POSITIONS
Department Stores 50 3.60 8.16 0.571 3
Depository Credit
Intermediation
325 2.42 3.14 0.707 8
Pharmaceutical &
Medicine M fg
191 1.25 2.07 0.792 25
Aerospace Product &
Parts Mfg
158 0.74 1.41 0.809 21
Elec Pwr Generation,
Transmsn &
Distribution
212 0.79 1.29 0.811 24
Pulp, Paper &
Paperboard Mills
65 0.89 1.70 0.825 49
Traveler
Accommodation
165 4.08 6.34 0.841 9
Motor Vehicle Mfg 31 0.43 0.49 0.842 30
Nondepository Credit
Intermediation
140 3.72 4.46 0.842 39
Insurance Carriers 519 1.85 2.79 0.849 5

U.S. Equal Employment Opportunity CommissionWOMEN OF COLOR: THEIR EMPLOYMENT IN THE PRIVATE SECTOR
July 2003 Page 22
Table 15 shows the highest ranked industries for Asian women. While LegalServices and Office of Physicians are also highly ranked for the probability of moving from white collar to management positions, some different industries are highlyranked for Asian women. The highest ranked industry is Full-Service Restaurantsand Grocery Stores are ranked fourth.
Table 15Those Industries Where Asian Women Have the Highest Odds
of Moving from Employment as Professionals, Technicians and Sales Workers to Management
Selected from the Top 50 Industries Based on Total Employment
INDUSTRY
NUMBER
OF FIRMS
PERCENT OF ASIAN WOM EN
WEIGHTED
ODDS RATIO
TOTAL
EMPLOY-
MENT
RANK MANAGERS
WHITE
COLLAR
POSITIONS
Full-Service
Restaurants
47 1.62 1.70 2.013 6
Legal Services 506 3.17 2.72 1.997 42
Offices of Physicians 392 2.72 3.76 1.646 44
Grocery Stores 293 0.73 1.46 1.414 2
Services to Buildings
& Dwellings
65 0.95 0.43 1.317 26
Employment Services 153 1.71 2.22 1.280 41
Building M aterial &
Supplies Dealers
139 0.64 0.80 1.236 19
Architectural,
Engineering & Related
Services
705 1.18 1.94 1.212 18
Scheduled Air
Transportation
50 1.29 2.57 1.195 13
Nursing Care
Facilities
1,021 3.37 5.26 1.159 10
Table 16 lists those industries where Asian women have the lowest chance ofmoving into management positions. While Pharmaceutical and MedicineManufacturing is the third lowest ranked industry for both African American andHispanic women, it is the lowest for Asian women. The second lowest rankedindustry for Asian women is Department Stores which is ranked as having the lowest

U.S. Equal Employment Opportunity CommissionWOMEN OF COLOR: THEIR EMPLOYMENT IN THE PRIVATE SECTOR
July 2003 Page 23
probability for African American women and Hispanic women to move intomanagement positions.
Table 16Those Industries Where Asian Women Have the Lowest Odds
of Moving from Employment as Professionals, Technicians and Sales Workers to Management
Selected from the Top 50 Industries Based on Total Employment
INDUSTRY
NUMBER
OF
FIRMS
PERCENT OF ASIAN WOM EN
WEIGHTED
ODDS
RATIO
TOTAL
EMPLOY-
MENT
RANK MANAGERS
WHITE
COLLAR
POSITIONS
Pharmaceutical & Medicine
Mfg
191 2.55 5.25 0.553 25
Department Stores 50 1.65 3.07 0.596 3
Scientific R&D Services 326 1.77 3.98 0.646 31
Medical Equipment &
Supplies Mfg
227 1.60 3.41 0.668 46
Depository Credit
Intermediation
325 1.89 3.30 0.676 8
Computer & Peripheral
Equipment Mfg
153 2.10 3.90 0.677 29
Scrty & Comdty Contracts
Intermed & Brokerage
120 2.43 3.99 0.684 36
Nondepository Credit
Intermediation
140 2.43 4.66 0.698 39
Semiconductor & Oth
Electronic Component Mfg
497 2.72 5.32 0.704 14
Nav/Measuring/Medical/Co
ntrol Instruments M fg
350 1.36 2.39 0.730 28
Table 17 displays those industries where Native American women have the highestodds of moving from white collar to management positions. Legal Services andOffice of Physicians are the highest ranked which is consistent with the results forAfrican American women and Hispanic women. It is also compatible with theresults for Asian women. Native American women also display high odds ofbecoming managers in General Medical & Surgical Hospitals.

U.S. Equal Employment Opportunity CommissionWOMEN OF COLOR: THEIR EMPLOYMENT IN THE PRIVATE SECTOR
July 2003 Page 24
Table 17Those Industries Where Native American Women Have the Highest Odds
of Moving from Employment as Professionals, Technicians and Sales Workers to Management
Selected from the Top 50 Industries Based on Total Employment
INDUSTRY
NUMBER
OF
FIRMS
PERCENT OF NATIVE
AMERICAN WOM EN
WEIGHTED
ODDS
RATIO
TOTAL
EMPLOY-
MENT
RANK MANAGERS
WHITE
COLLAR
POSITIONS
Legal Services 506 1.83 0.08 4.634 42
Offices of Physicians 392 1.48 0.56 3.126 44
General Medical & Surgical
Hospitals
1,652 0.57 0.32 2.856 1
Architectural, Engineering
& Related Services
705 0.60 0.14 2.622 18
Other Ambulatory Health
Care Services
328 0.98 0.37 2.306 48
Employment Services 153 0.83 0.18 2.305 41
Computer Systems Design
& Related Services
639 0.58 0.14 2.304 15
Nursing Care Facilities 1,021 1.51 0.41 2.242 10
Grocery Stores 293 0.31 0.46 2.144 2
Management, Sci & Tech
Consulting Services
287 0.59 0.14 2.030 38
Table 18 shows the industries where Native American women have the lowest oddsof moving into management positions. Like other women of color, DepartmentStores is one of the lowest ranked industries. Depository Credit Intermediation is thesecond lowest ranked industry just as it was for Hispanic women. The lowestranked industry for Native American women is Pulp, Paper & Paperboard Mills. Thisindustry is also on the list of the 10 lowest industries for African American womenand for Hispanic women, but the industry is not as low ranked for those groups.

U.S. Equal Employment Opportunity CommissionWOMEN OF COLOR: THEIR EMPLOYMENT IN THE PRIVATE SECTOR
July 2003 Page 25
Table 18Those Industries Where Native American Women Have the Lowest Odds
of Moving from Employment as Professionals, Technicians and Sales Workers to Management
Selected from the Top 50 Industries Based on Total Employment
INDUSTRY
NUMBER
OF
FIRMS
PERCENT OF NATIVE
AMERICAN WOM EN
WEIGHTED
ODDS
RATIO
TOTAL
EMPLOY-
MENT
RANK MANAGERS
WHITE
COLLAR
POSITIONS
Pulp, Paper & Paperboard M ills 65 0.24 0.17 0.818 49
Depository Credit
Intermediation
325 0.31 0.20 0.819 8
Department Stores 50 0.29 0.52 0.822 3
Elec Pwr Generation, Transmsn
& Distribution
212 0.26 0.14 0.886 24
Converted Paper Product M fg 176 0.85 0.15 0.914 37
Traveler Accommodation 165 0.59 0.24 0.917 9
Motor Vehicle Body & Trailer
Mfg
81 0.32 0.09 0.937 40
Other Fabricated Metal Product
Mfg
296 0.92 0.10 0.980 47
Animal Slaughtering &
Processing
56 1.36 0.19 1.006 23
Aerospace Product & Parts Mfg 158 0.29 0.20 1.012 21
Conclusion
Women of color appear to have some common experiences with respect to themovement from white collar positions into management. Consistently, LegalServices, Offices of Physicians and Architectural, Engineering & Related Servicesare among the industries with the highest odds for minority women moving fromwhite collar positions into management positions. This is not necessarily “good”news, as these industries may have managers with lower employment status thanother industries. Those industries where women of color confront low probabilities ofmovement into management positions consistently include Department Stores andPharmaceutical and Medicine Manufacturing and Depository Credit Intermediation.

U.S. Equal Employment Opportunity CommissionWOMEN OF COLOR: THEIR EMPLOYMENT IN THE PRIVATE SECTOR
6 It should be noted that this information is sometimes m issing in the EEOC charge tracking
system.
July 2003 Page 26
PER CAPITA CHARGE RATES
Another measure to examine the employment status of women of color is a percapita charge rate that compares charges filed to employment. Such rates arecomputed for each race/ethnic group. The EEO-1 data from 2001 and charge datafrom fiscal year 2002 are used. The charge data came from EEOC and FEPAs. Inorder to obtain charging party race/ethnic data in the same way as it is collected forthe EEO-1, only charging party’s race and charging party’s ethnicity are used. A percapita charge rate is computed by dividing charges filed per 1,000 EEO-1 reportedemployees. For example, the number of charges filed by African American womenis divided by every 1,000 female African American employee reported on the EEO-1.The rates are also computed by industry. Here a two-digit SIC code6 is utilized. Inorder to produce meaningful results, the analysis is restricted to those industrieswhich had at least 50 EEO-1 reports and at least 1,000 employees of the groupbeing examined.
In order to measure the differential effects for race/ethnicity and industrial groups, an analysis of variance is conducted. The results indicate an effect for bothrace/ethnicity and industrial groups. Overall, these two items account for 76 percentof the variability in the per capita charge rates by race/ethnic group for specificindustry groups. Of this explained variability, race/ethnic groups account for 35percent and industrial groups account for 65 percent. That is, industrial groups arealmost twice as useful as race/ethnicity for explaining differences in per capitacharge rates.
Two different but related analyses are conducted to detect whether five race/ethnicgroups had substantially different experiences in different industries. Two differentsimple correlation procedures indicate a substantial relationship between per capitacharge rates by industry for race/ethnic groups. The relationship is highest betweenWhite non-Hispanic women and African American women (0.90 correlation), highbetween White non-Hispanic women and Hispanic women (0.81 correlation) andlowest between Asian women and Native American women (0.50 correlation). Factoranalysis confirms that it is not necessary to specify both race/ethnicity and industryto explain per capita charge rates. It is only necessary to specify either race/ethnicgroup or industry.
Per capita charge rates based on race/ethnic groups of women is provided in Table19. When examining per capita charge rates, African American women file chargesat a greater rate than other race/ethnic groups followed by Native American women,Hispanic women, White Non-Hispanic women and Asian women.

U.S. Equal Employment Opportunity CommissionWOMEN OF COLOR: THEIR EMPLOYMENT IN THE PRIVATE SECTOR
July 2003 Page 27
Table 19Charge Rate per 1,000 Employees
WOMEN
CHARGES PER 1,000
EMPLOYEES
WHITE NON-HISPANIC 1.37
AFRICAN AMERICAN 5.19
HISPANIC 2.59
ASIAN 1.12
NATIVE AMERICAN 2.64
Table 20 provides the high and low per capita charge rates by group of women andby industry.
Table 20Highest and Lowest Industry Charge Rates
by Race/Ethnic Group
WOMEN
INDUSTRIES WITH LOW EST
RATES
(CHARGES PER 1,000
EMPLOYEES)
INDUSTRIES WITH HIGHEST
RATES
(CHARGES PER 1,000
EMPLOYEES)
WHITE NON-HISPANIC Engineering & Management
Services (0.22)
Agricultural Services
(9.79 )
AFRICAN AMERICAN Engineering & Management
Services (0.99 )
Automotive Dealers & Service
Stations (27.6 )
HISPANIC Engineering & Management
Services (0.35 )
Special Trade Contractors
(14.3)
ASIAN Stone, Clay, & Glass Products
(0.0)
Apparel & Other Textile
Products (8.20)
NATIVE AM ERICAN Engineering & Management
Services (0.33)
Social Services (7.74)
While industry plays a greater role in explaining per capita charge rates, byexamining results for each of the race/ethnic groups, it is possible to see theconsistency of industry results and identify limited differences. Table 21 lists the industries with the five highest per capita charge rates for African American women. Automotive Dealers and Service Stations and Miscellaneous ManufacturingIndustries are the industries with the highest rates of charges filed by AfricanAmerican women, with each having more than 27 charges per 1,000 employees.

U.S. Equal Employment Opportunity CommissionWOMEN OF COLOR: THEIR EMPLOYMENT IN THE PRIVATE SECTOR
July 2003 Page 28
Table 21Highest Per Capita Charge Rates
for African American Women
INDUSTRY
EEO-1
REPORTS
FILED
TOTAL
EEO-1
EMPLOY-
MENT
AFRICAN
AMERICAN
WOMEN
EEO-1
EMPLOY-
MENT
CHARGES
FILED BY
AFRICAN
AMERICAN
WOMEN
CHARGES PER
1,000 AFRICAN
AMERICAN
WOMEN
EMPLOYEES
Automotive Dealers &
Service Stations
2,297 308,174 9,373 259 27.6
Miscellaneous
Manufacturing Industries
1,131 237,013 9,663 263 27.2
General Building
Contractors
1,024 211,688 3,028 76 25.1
Special Trade
Contractors
2,283 410,140 3,843 82 21.3
Personal Services 929 141,287 13,855 288 20.8
The industries with the lowest per capita charge rates for African American womenare listed in Table 22. Engineering & Management Services is the lowest rankedindustry with slightly less than one charge filed by an African American woman per1,000 female African American employees.
Table 22Lowest Per Capita Charge Rates
for African American Women
INDUSTRY
EEO-1
REPORTS
FILED
TOTAL
EEO-1
EMPLOY-
MENT
AFRICAN
AMERICAN
WOM EN
EEO-1
EMPLOY-
MENT
CHARGES
FILED BY
AFRICAN
AMERICAN
WOMEN
CHARGES
PER 1,000
AFRICAN
AMERICAN
WOM EN
EMPLOYEES
Engineering & Management
Services
6,812 1,334,615 66,784 66 0.99
Textile Mill Products 1,274 351,354 40,375 50 1.24
Paper And Allied Products 2,288 504,996 21,270 45 2.12
Leather and Leather
Products
168 42,228 1,372 3 2.19
General Merchandise
Stores
12,694 2,569,437 269,340 713 2.65

U.S. Equal Employment Opportunity CommissionWOMEN OF COLOR: THEIR EMPLOYMENT IN THE PRIVATE SECTOR
July 2003 Page 29
Table 23 examines the highest ranked industries with respect to charges filed byHispanic women per 1,000 female Hispanic employees. The industries listed hereappear to be heavily represented in construction-related fields. Three of the five
Table 23Highest Per Capita Charge Rates
for Hispanic Women
INDUSTRY
EEO-1
REPORTS
FILED
TOTAL
EEO-1
EMPLOY-
MENT
HISPANIC
WOMEN
EEO-1
EMPLOY-
MENT
CHARGES
FILED BY
HISPANIC
WOMEN
CHARGES
PER 1,000
HISPANIC
WOM EN
EMPLOYEES
Special Trade Contractors 2,283 410,140 4,631 66 14.3
General Building
Contractors
1,024 211,688 3,079 34 11.0
Auto Repair, Services, And
Parking
1,068 152,967 5,361 54 10.1
Heavy Construction, Ex.
Building
1,302 282,533 1,569 15 9.56
Automotive Dealers &
Service Stations
2,297 308,174 9,472 83 8.76
industries are in that sector of the economy. Automotive Dealers and ServiceStations, although listed fifth, is notable as it is the highest ranked industry forAfrican American women filing charges. Of course, General Building Contractorsand Special Trade Contractors are also in the highest five ranked industries for bothHispanic women and African American women filing charges.
Table 24 examines the lowest ranked industries with respect to charges filed byHispanic women per 1,000 female Hispanic employees. Engineering andManagement Services is the lowest ranked industry, with just 0.35 charges filed byHispanic women per 1,000 female Hispanic employees. This industry is also thelowest ranked industry for African American women. General Merchandise Storesalso appears among the lowest ranked groups for both African American womenand Hispanic women.

U.S. Equal Employment Opportunity CommissionWOMEN OF COLOR: THEIR EMPLOYMENT IN THE PRIVATE SECTOR
July 2003 Page 30
Table 24Lowest Per Capita Charge Rates
for Hispanic Women
INDUSTRY
EEO-1
REPORTS
FILED
TOTAL
EEO-1
EMPLOY-
MENT
HISPANIC
WOMEN
EEO-1
EMPLOY-
MENT
CHARGES
FILED BY
HISPANIC
WOMEN
CHARGES
PER 1,000
HISPANIC
WOM EN
EMPLOYEES
Engineering & Management
Services
6,812 1,334,615 34,654 12 0.35
Museums, Botanical,
Zoological Gardens
106 39,787 1,620 1 0.62
Wholesale Trade--Nondurable
Goods
3,802 803,033 33,082 31 0.94
General Merchandise Stores 12,694 2,569,437 174,379 174 1.00
Industrial Machinery and
Equipment
4,429 1,213,063 23,586 25 1.06
Charges filed by Asian women are also examined by industry and the highestranked industries with respect to charges filed by Asian women per 1,000 femaleAsian employees are listed in Table 25.
Table 25Highest Per Capita Charge Rates
for Asian Women
INDUSTRY
EEO-1
REPORTS
FILED
TOTAL
EEO-1
EMPLOY-
MENT
ASIAN
AMERICAN
WOMEN
EEO-1
EMPLOY-
MENT
CHARGES
FILED BY
ASIAN
AMERICAN
WOMEN
CHARGES
PER 1,000
ASIAN
AMERICAN
WOMEN
EMPLOYEES
Apparel And Other Textile
Products
853 178,859 6,094 50 8.20
Auto Repair, Services, And
Parking
1,068 152,967 1,942 13 6.69
Personal Services 929 141,287 3,746 22 5.87
Automotive Dealers &
Service Stations
2,297 308,174 2,270 13 5.73
Real Estate 1,189 184,102 2,724 15 5.51

U.S. Equal Employment Opportunity CommissionWOMEN OF COLOR: THEIR EMPLOYMENT IN THE PRIVATE SECTOR
July 2003 Page 31
The industries where Asian women are most likely to file charges are in some waysvery similar to industries where other women of color are most likely to file charges. For example, Automotive Dealers and Service Stations is ranked as the fourth worstindustry for per capita charge rates for Asian women. It is ranked first for AfricanAmerican women and fifth for Hispanics women. Auto Repair Services and Parkingis ranked second for Asian women and third for Hispanic women. However, theindustry with the highest per capita charge rate for Asian women is theManufacturing of Apparel and Other Textile Products which is not observed on thelist of high charge rates for African American women or for Hispanic women.
Table 26Lowest Per Capita Charge Rates
for Asian Women
INDUSTRY
EEO-1
REPORTS
FILED
TOTAL
EEO-1
EMPLOY-
MENT
ASIAN
AMERICAN
WOMEN
EEO-1
EMPLOY-
MENT
CHARGES
FILED BY
ASIAN
AMERICAN
WOMEN
CHARGES
PER 1,000
ASIAN
AMERICAN
WOM EN
EMPLOYEES
Stone, Clay, And Glass
Products
1,518 294,124 1,590 0 0.
Instruments And Related
Products
2,002 628,539 24,239 4 0.17
Insurance Agents, Brokers,
& Service
1,094 218,671 4,421 1 0.23
Engineering &
Management Services
6,812 1,334,615 38,057 10 0.26
Security And Com modity
Brokers
1,516 414,997 14,790 5 0.34
Table 26 provides the list of the industries with the lowest per capita charge rates forAsian women. The fourth lowest ranked industry for Asian women is Engineering &Management Services. This industry ranks lowest for African American women andHispanic women. The highest ranked industry, Stone, Clay, and Glass Products hadno charges during the period studied but also had very limited employment of Asianwomen.
Table 27 provides the list of the five industries with the highest per capita chargerates for charges filed by Native Americans. The highest ranked industry is SocialServices. Related service industries of Hotel and Other Lodging Places and Eatingand Drinking Places, are also among the industries with a high per capita chargerate for Native American women.

U.S. Equal Employment Opportunity CommissionWOMEN OF COLOR: THEIR EMPLOYMENT IN THE PRIVATE SECTOR
July 2003 Page 32
Table 27Highest Per Capita Charge Rates
for Native American Women
INDUSTRY
EEO-1
REPORTS
FILED
TOTAL
EEO-1
EMPLOY-
MENT
NATIVE
AMERICAN
WOMEN
EEO-1
EMPLOY-
MENT
CHARGES
FILED BY
NATIVE
AMERICAN
WOMEN
CHARGES
PER 1,000
NATIVE
AMERICAN
WOMEN
EMPLOYEES
Social Services 3,352 515,928 1,937 15 7.74
Miscellaneous Retail 3,949 536,867 1,597 11 6.89
Hotels And Other
Lodging Places
3,341 906,306 2,595 16 6.17
Electric, Gas, And
Sanitary Services
3,229 617,907 1,066 5 4.69
Eating And Drinking
Places
16,245 1,512,632 5,698 25 4.39
Table 28 displays those industries where Native American women are least likely tofile charges. The lowest ranked industry for Native American women is Engineeringand Management Services. This industry also ranks lowest for African Americanwomen and Hispanic women. General Merchandise Store is the second lowestranked industry for charges filed by Native American women. The industry is alsoamong the lowest ranked for African American women and Hispanic women.
Table 28Lowest Per Capita Charge Rates
for Native American Women
INDUSTRY
EEO-1
REPORTS
FILED
TOTAL
EEO-1
EMPLOY-
MENT
NATIVE
AMERICAN
WOMEN
EEO-1
EMPLOY-
MENT
CHARGES
FILED BY
NATIVE
AMERICAN
WOMEN
CHARGES
PER 1,000
NATIVE
AMERICAN
WOM EN
EMPLOYEES
Engineering &
Management Services
6,812 1,334,615 3,029 1 0.33
General Merchandise
Stores
12,694 2,569,437 13,126 9 0.69
Instruments And Related
Products
2,002 628,539 1,344 1 0.74
Food Stores 16,021 2,012,395 7,948 6 0.75
Building Materials &
Garden Supplies
2,613 411,865 1,029 1 0.97

U.S. Equal Employment Opportunity CommissionWOMEN OF COLOR: THEIR EMPLOYMENT IN THE PRIVATE SECTOR
July 2003 Page 33
Conclusion
Race/ethnicity and industry both have an effect on per capita charge rates. AfricanAmerican women file charges at a greater rate (5.19) than other race/ethnic groups. Native American women (2.64) and Hispanic women (2.64) file at a similar rate,followed by White Non-Hispanic women (1.37) and Asian women (1.12). Additionally, it is not necessary to specify both race/ethnicity and industry to explainper capita charge rates. It is only necessary to specify either race/ethnic group orindustry. While there are minor differences between race/ethnic groups of women,the consistency of industrial rankings is apparent.
Firms in Engineering and Management Services are least likely to be the subject ofa charge by each of the minority groups of women, except Asian women. While anumber of charges are filed against General Merchandise Stores, accounting foremployment reveals that women of color have a relatively small probability of filingcharges against these type of firms. On the other hand, with the exception of NativeAmerican women, the Automotive Dealers and Service Stations is consistentlyranked among the industries with the highest per capital charge rates. This industryhas the worst charge rate for African American women and Asian women. Construction-based industries, such as Special Trade Contractors and GeneralBuilding Contractors, have high per capita charge rates for both African Americanwomen and Hispanic women. The highest ranked industry with highest level of percapita charges by Asian women is Apparel And Other Textile Products and forNative American women it is Social Services.

U.S. Equal Employment Opportunity CommissionWOMEN OF COLOR: THEIR EMPLOYMENT IN THE PRIVATE SECTOR
July 2003 Page 34
Prepared By:
Office of Research, Information and Planning
U.S. Equal Employment Opportunity Commission
W ashington, D.C.
ADDITIONAL INFORMATION
For additional information, visit our web site at http://www.eeoc.gov. Click onSTATISTICS and JOB PATTERNS FOR MINORITIES AND WOMEN(http://www.eeoc.gov/stats/jobpat/jobpat.html) for sample copies of the EEO-1 form,an instruction booklet and aggregate statistics. Click on EEOC ENFORCEMENTSTATISTICS AND LITIGATION (http://www.eeoc.gov/stats/enforcement.html) fordata regarding charges.