why countries trade - edu @ thinus -...
TRANSCRIPT

08/09/14
1
The foreign sector
• Why do individuals trade?
• What is the basis for specialisation and exchange?
• Same applies to countries
• Absolute advantage
– benefits of trade obvious
– specialise in what you are best at
Why countries trade
08/09/14
2
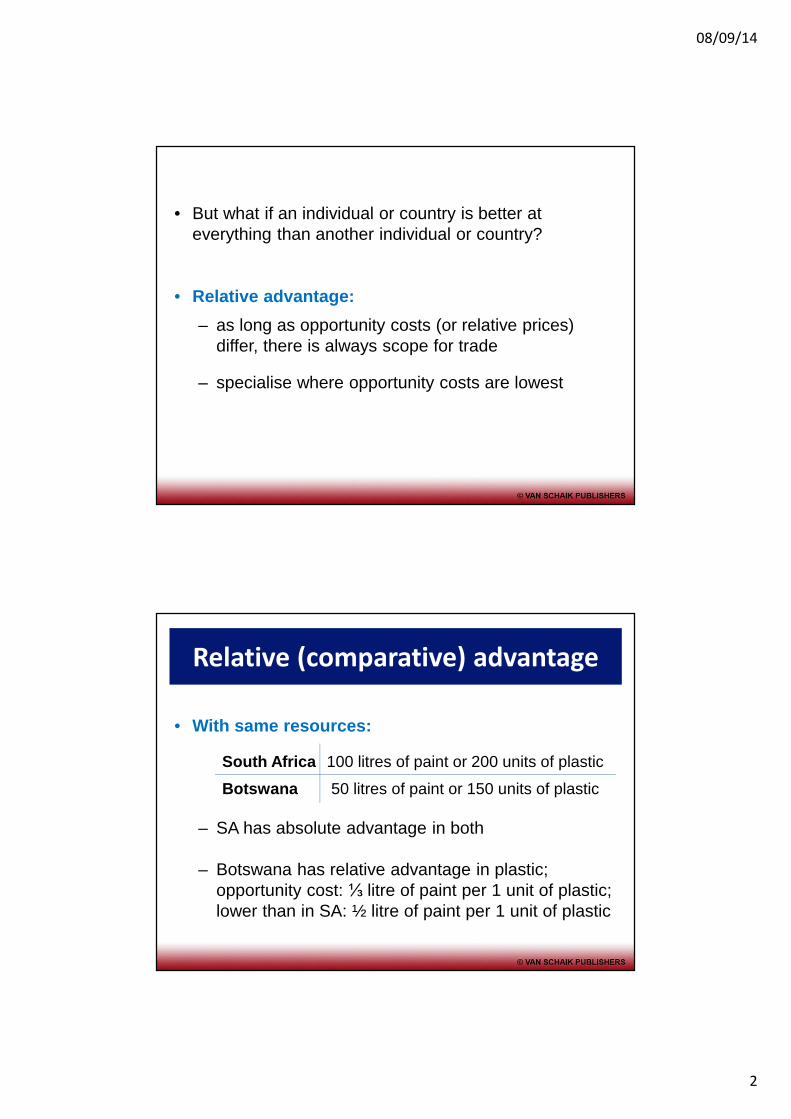
• But what if an individual or country is better at everything than another individual or country?
• Relative advantage:
– as long as opportunity costs (or relative prices) differ, there is always scope for trade
– specialise where opportunity costs are lowest
Relative (comparative) advantage
• With same resources:
South Africa 100 litres of paint or 200 units of plastic
Botswana 50 litres of paint or 150 units of plastic
– SA has absolute advantage in both
– Botswana has relative advantage in plastic; opportunity cost: ⅓ litre of paint per 1 unit of plastic; lower than in SA: ½ litre of paint per 1 unit of plastic

08/09/14
3
– SA has relative advantage in paint; opportunity cost of 2 units of plastic per litre of paint; lower than in Botswana: 3 units of plastic per litre of paint
– SA → paint; Botswana → plastic; then trade at (say) 2,5 units of plastic per litre of paint
– Exchange ratio must be between opportunity cost ratios
• If opportunity costs similar in both countries – no benefits from specialisation and trade
Trade policy
• Import tariffs
• Import quotas
• Subsidies
• Non-tariff barriers
• Exchange controls
• Exchange rate policy

08/09/14
4
Exchange rates
• Definition: price of a currency in terms of another currency
• Foreign exchange market (forex market)– demand for a currency– supply of a currency– equilibrium exchange rate
• Appreciation and depreciation
NB: Always check which currency is being analysed –important because exchange rate always involves two currencies
Exchange: exchange rate between
Rand and Euro
• We examine the market for euro
• Price thus rand per euro (what euro costs in rand)Quantity in euro
• Sources of demand for euro include:– SA importers who have to pay in euro– SA residents who purchase euro-denominated
assets (eg shares in German companies or French government bonds)

08/09/14
5
– Euro zone investors who sell SA assets (eg shares on JSE) and convert proceeds into euro
– SA tourists visiting Euro zone countries who buy euro-denominated travellers’ cheques, etc.
– Speculators who anticipate a decline in the value of the rand against the euro (depreciation of the rand/appreciation of the euro)
• Sources of supply of euro include the following (note that the factors are simply the inverse of those that lie behind the demand for euro):
– SA exporters who exchange their euro earnings for rand
– SA residents who sell euro-denominated assets
– Euro zone investors who invest in SA assets
– Euro zone tourists who visit SA
– Speculators who expect the euro to weaken (depreciation of the euro/appreciation of the rand)

08/09/14
6
• Equilibrium exchange rate:Similar to figure below, which pertains to rand/dollarexchange rate
The foreign exchange market
Changes in supply and demand(Currency appreciation and depreciation)
• Causes of changes in supply of foreign currency
• Causes of changes in demand for foreign currency
• Resultant changes in exchange rate

08/09/14
7
Demand for euro increases → euro appreciates (rand depreciation)
Demand for euro decreases → euro depreciates (rand appreciates)
Supply of euro increases → euro depreciates (rand appreciates)
Supply of euro decreases → euro appreciates (rand depreciates)
EXAMPLE
• Graphical exposition: Similar to figure below which pertains to rand/dollar exchange rate
A decrease in the supply of
dollars

08/09/14
8
Economic impact of
changes in exchange rate
• Rand depreciates → export prices (in forex) decrease
→ import prices (in rand) increase
→ exports tend to increase→ imports tend to decrease→ current account tends to
improve→ domestic prices tend to rise
• Rand appreciation: just the opposite tends to happen
More on forex market
Role of speculation
• demand and supply change in anticipation/ expectation of change in exchange rate
• could result in that which is expected to happen now

08/09/14
9
Official intervention (managed floating)
• authorities may try to intervene in the forex market to affect the exchange rate
• to prevent or counteract depreciation, they have to possess sufficient foreign exchange reserves
• to prevent appreciation, they must be prepared to purchase foreign exchange
• principle illustrated in Figure: Managed floating
• in practice, often difficult
Foreign sector in
Keynesian model
• Exports (X): injection into circular flow of income and spending
• Imports (Z): leakage or withdrawal from circular flow
• Exports autonomous – not related to domestic income Y
Figure: Exports
• Imports strongly related to domestic economic activity Y
Figure
• X = X (autonomous)
• Z = Z + mY, where m = marginal propensity to import

08/09/14
10
Impact of exports and imports
• Exports (X)– raise the level of aggregate spending A– leave multiplier unchanged– raise the equilibrium level of income Y0
• Imports (Z)– act as leakage from circular flow– reduce the level of aggregate spending on domestic
production– reduce the multiplier– reduce the equilibrium level of income
Keynesian model including the
foreign sector
Y = A (equilibrium condition)
A = C + Ī + Ḡ + X – Z (aggregate spending)
C = C + c(1 – t)Y (consumption spending)
Z = Z + mY (imports/spending on imports)
Y0 = αĀ

08/09/14
11
Where α = 1/(1 – c(1 – t) + m)
Ā = C + Ī + Ḡ + X – Z
Graphical exposition:
Net exports, aggregate spending and
equilibrium income in the open economy
Numerical example
Suppose C = 100, Ī = 200, Ḡ = 300, X = 150, Z = 50
c = 0,9, t = 0,33, m = 0,1
Total autonomous spending = C + Ī + Ḡ + X – Z = 700

08/09/14
12
Multiplier = 1/(1–c(1–t) + m)
= 1/(1–0,9(1–0,33) + 0,1)
= 1/(1-0,6 + 0,1)
= 1/0,5
= 2
Y0 = αĀ = 2 x 700 = 1400