unnecessary termination: public and corporate … termination: public and corporate pension...
TRANSCRIPT
Unnecessary Termination: Public and Corporate Pension Plans'
Asset Manager Decisions
Anna Kovner *
PRELIMINARY AND INCOMPLETE. PLEASE DO NOT CITE.
This Draft: November 17, 2006
This paper examines differences in public and corporate pension plans' termination of asset managers. Corporate pension plans terminate their managers significantly more frequently than do public pension plans and are less likely to follow other corporate pensions when considering termination decisions. Despite these differences, corporate pension plans do not appear to select better performing managers. I argue that differences in Chief Investment Officers' incentives can explain the difference in termination rates. The evidence suggests that public pensions' asset management decisions are motivated by inertia, which has no negative consequences for manager performance in publicly traded asset classes. However, this inertial tendency may be less benign when considering other pension decisions, and should be taken into account.
* I am grateful to John Campbell, Paul Gompers, David Scharfstein, Jeremy Stein and seminar participants at the Harvard Finance workshops for helpful suggestions. I am indebted to Jay Josey at S&P's Money Management Directory and David Baeckelandt and Ryan Jusko at Mercer Performance Analytics for their generosity in providing data. I benefited from financial support from Harvard Business School. All errors are my own. Email: [email protected].

2
I. Introduction
Defined benefit pension plans manage more than seven trillion dollars, but little
academic research has examined their characteristics and asset management decisions in
detail. At a time when numerous companies, states and municipalities have underfunded
pension plans, identifying inefficiencies in plan management is critical. Termination of
several acutely underfunded pension plans (e.g., LTV Steel, Bethlehem Steel, US
Airways, United Airlines and Polaroid) has grown the accounting funding deficit of the
Pension Benefit Guaranty Corporation (PBGC) to $22.8 billion as of September 2005.
Substantial heterogeneity in pension plan returns remains insufficiently explored.
In addition to welfare implications for pensioners and employers, the investment
behavior of pension plans has a significant impact on financial markets. While
substantial progress has been made in understanding the behavior of mutual funds and
their investors, pension plan assets are an equally sizeable part of financial markets. It is
thus important to understand these investors' behavior.
This paper examines public and corporate pension plans' investment managers of
publicly traded assets from 1995 to 2005, with panel data on 4,365 pension plans and
9,202 investment funds. Public pension plans are approximately 39% less likely to fire
their managers than are corporate pension plans, even after controlling for manager
performance and pension fund characteristics.
Given that terminating asset managers is associated with transaction costs (0.5-
1% of assets), in order for the high relative level of corporate terminations to be efficient,
corporate pensions should be achieving higher risk-adjusted returns than are their public
peers. Despite differences in termination rates, I find no conclusive evidence that

3
corporate pensions are selecting better managers. There is no significant difference in the
risk-adjusted returns of funds held by corporate pensions relative to public pensions.
If there is no persistence in manager performance, it is perhaps unsurprising that
differences in manager termination rates do not result in performance differences. Goyal
and Wahal (2005) examine pension plan hiring and firing decisions and find that excess
returns from fired investment managers were higher than those delivered by newly hired
managers. While substantially less well-studied than mutual fund managers, academics
and practitioners have considered the question of the existence of managerial skill in
pension fund asset management with mixed results. Coggin and Trezincka (2000) find
no evidence for the persistence of alpha other than style consistency using survivorship-
corrected Mobius data. Lakonishok, Shleifer and Vishny (1992) use SEI data and find no
evidence that pension plan managers add value. Coggin, Fabozzi Rahman (1993) and
Christopherson, Ferson and Glassman (1998) use Frank Russell data and find positive
alpha, and in particular persistence of negative alpha. Busse, Goyal and Wahal (2005)
find persistence in domestic equity portfolios using data from Informa Investment
Solutions. Chan, Dimmock and Lakonishok (2006) use SEI data to assess the relative
merits of several widely used procedures to estimate abnormal returns and find
divergence in the estimated excess return achieved by different benchmark methods.
Since differences in termination rates do not appear to be justified by performance
differences, I propose pension plan Chief Investment Officer (CIO) incentives as an
alternate explanation for the observed termination behavior. The impact of managerial
career concerns on manager behavior has long been considered by theory and supported
by empirical research (Holmstrom (1982), Chevalier and Ellison (1999)). Observed

4
differences in termination rates are consistent with a story of the "quiet life" for public
pension plan executives, where CIOs of public pension plans change jobs less frequently
and are less incentivized to make frequent changes in their asset managers (similar to that
proposed by Betrand and Mullainathan (2003)). In contrast, the career concerns of
corporate pension CIOs motivate them to change managers more frequently so that they
appear busy.
Public pension CIOs are almost 40% less likely to change jobs than are their
corporate peers. Public pension CIOs are also less likely to be terminated (defining
termination as CIOs who change positions after underperforming relative to the median
fund or suffering a net loss in pension assets). Hiring and firing managers may be an
attempt by corporate pension plan CIOs to signal quality, since without selecting new
asset managers, they may appear to be serving only as caretakers. However, changing
managers is a signal which is very costly to the pension plans since it incurs transaction
costs without seeming to result in meaningful outcome differences. Public entities
actually benefit from their employees' relative lack of incentives, given limited
performance persistence of institutional managers of publicly traded assets.
CIO career concerns are one of many differences between public and corporate
pension plans. Public pensions have significantly different governance structures and
levels of public scrutiny than do corporate pensions. And of course they may have
different risk tolerances, and potentially different residual claimants. However,
regardless of these differences, all pensions should share as a goal selecting the highest
performing investment manager in a given risk class. The results are robust to controls
for many of the differences between the two types of pension plans such as plan size,

5
plan use of consultants and asset allocation. The results are important not only for the
prescription that corporate pension plans should seek to discourage their CIOs from
changing asset managers as frequently, but also for the implications about other pension
fund actions. Generally, public pensions appear predisposed to inertia, given the lower
level of CIO incentives, combined with higher levels of bureaucracy. In the case of
publicly-traded assets, this may be an advantage. When considering other public
pension fund actions such as asset allocation, this paper suggests that extra care should be
taken to examine decisions for inertia.
The paper is organized as follows. Section II provides a brief overview of the
structure of the public and corporate pension industry. In Section III, I describe the data
used in the paper and provide background information on pension plans, their CIOs and
their asset managers. Section IV details differences in asset manager termination and
herding. Section V explores the performance implications of these differences, by
looking directly at the pension plans' asset managers' performance. Section VI describes
patterns in job tenure for CIOs. Section VII discusses the implications of the findings
and offers conclusions.
II. Overview of Public and Corporate Pension Plans' Investment Management
The pension industry includes a range of organizations that manage retirement
assets and non-profit endowments. The analysis in this paper is limited to corporate and
public defined benefit pension plans. Non-profit endowments which may pursue non-
economic goals in their investment management decisions (such as invest in donor
managed funds) are excluded. Similarly, union pensions which may explicitly target

6
investments that maximize union employment are excluded. While non-economic
influences on investment decisions are relevant to corporate pensions, which may
overinvest in company stock, and public pensions, which may pursue local investment,
they are less likely to be a critical factor in the oversight of their managers of publicly-
traded assets. I also exclude defined contribution plans which are primarily beneficiary
directed. Fabozzi (1997) and Lakonishok, Shleifer and Vishny (1992) provide detailed
descriptions of the pension investment management industry.
In both corporate and public defined benefit plans, beneficiaries receive a set
amount of benefits upon retirement. The trustees of the plan are legally responsible for
investing the pension plans' assets, which come from employer and beneficiary
contributions. Typically, a corporate plan is invested by a Chief Investment Officer
(CIO) under the supervision of the Chief Financial Officer or Chief Executive Officer of
the company and possibly a board of trustees, which may consist of company employees
and retirees. The CIO's investment responsibilities typically include asset allocation,
investment manager selection, and monitoring. Public pension plans' CIOs are typically
managed by a board of trustees, which may be elected or appointed and which may
include government officials, beneficiaries and industry experts. Both types of pension
plans often hire independent investment consultants to aid in the asset allocation,
manager selection, and monitoring processes. While some pension plans manage assets
internally, it is relatively rare, and less than six percent of the pension assets of pension
plans in this sample were invested internally.
The manager selection and termination process is detailed in Goyal and Wahal
(2005). Generally, the CIO determines a target asset allocation for the plan, in

7
consultation with investment consultants and the relevant CIO's supervisor. This may be
determined by risk-return preferences and asset-liability matching considerations, among
other factors. The broad asset allocation decision is typically a long term decision, and
most corporate and public pension plans do not seek to time the market in their long-term
asset allocation. For example, the median change in asset allocation to domestic variable
return assets for both corporate and public pensions from 1999 to 2005 in this sample was
zero.
Once the target asset allocation has been set, plans select managers in each risk
class. This is typically part of an extensive process, including a Request for Proposal
(RFP) for a set mandate, such as domestic equity or small capitalization growth.
Anecdotally, managers are selected on the basis of historical track record, relative
performance, and a qualitative assessment of manager abilities. Once hired, an
investment management firm may be terminated for performance reasons, changes in
management of the investment management fund, or changes in asset allocation among
other reasons. Goyal and Wahal (2005) find performance and organizational changes to
be the primary stated reason for terminations in their study of pension investment
managers.
Changing asset managers is associated with significant transaction costs. While
there are no publicly available data on these transaction costs, Goyal and Wahal (2005)
estimate the costs based on cases where the portfolio is outsourced to a "transition
manager." This manager attempts to minimize the costs associated with the change in
asset managers, and they cite an anonymous transition management firm with costs from
0.5 to 1 percent of the assets under management. While it is difficult to estimate the

8
exact size of transaction costs, they are not insignificant relative to excess returns, and are
likely to be a linear function of assets managed.
Unlike mutual funds, where investor money is pooled and invested through a
single legal entity, pension plan assets are typically managed as separate accounts. This
allows for the pension plan to retain legal custody of the assets, although the money is
managed at the investment manager's discretion. In addition, certain pensions may add
restrictions to an investment manager's strategy, such as no investments in South Africa,
or tobacco stocks. When investing in a particular strategy, the investment manager will
invest all of the separate accounts under its mandate pro rata, subject to any conditions
placed by the pension plan. Investment managers report performance as a composite of
the performance of these separate accounts, assuming no pension plan restrictions. Such
composite performance must reflect the performance of more than 80 percent of the
assets under management in that strategy. Performance data for pension plan managers is
presented as these "composite returns." For simplicity I will refer throughout the paper to
these pools of money managed to a common strategy as "funds." The performance
measured is always composite performance gross of fees, and while pension plan
restrictions may lead to differences in actual returns, the analysis does not consider the
impact of those restrictions when comparing fund manager results.
The theoretical residual claimants of corporate and pension plans may differ. In
the case of an overfunded corporate pension, the corporation is the residual claimant to
any excess returns. In case of a shortfall, corporate benefits are insured by the Pension
Benefit Guarantee Corporation, creating a nonlinear payoff structure which may be
relevant in asset allocation decisions. For public plans, the government is the residual
9
claimant. In practice, Murphy and Van Nuys (1994) find some sharing of unexpected
high performance between beneficiaries and the state or corporation. Some public
pension trustees refer to the "13th check", which may be distributed at the discretion of
the pension board in the case of returns that beat the pension plan's target. The residual
claimant question is highly relevant to decisions about the risk level of the plan.
However, once a given risk target has been selected, all pension plans should be
motivated to select the highest returning fund manager of that risk class.
III. Data
Data used in the analysis comes from three sources: Standard and Poor’s Money
Market Directory (MMD), an annual listing of pension plans and endowments and their
money managers, Mercer's Manager Performance Analytics and Mobius Check Free M-
search (M-search), two separate databases which track pension plan fund managers’
quarterly investment returns.
The MMD has been published for more than 30 years, with a primary audience of
entities seeking to sell to pension plans and their investment managers. MMD provides
contact and managed asset information for pension plans, investment management firms
and consultants. The data is collected through questionnaires and supplemented with
phone calls to confirm the information. Originally printed as a book, MMD has made
available its complete listings from 1996 (with data current as of December 31, 1995)
through 2005. It includes listings of 13,764 pension plans and endowments. Excluding
foundations, endowments and unions, of the 7,239 corporate and public pensions covered

10
by MMD, I restrict my sample to the 3,512 sponsors managing 4,367 plans with more
than $10 million in assets under management.
For this sample, MMD provides annual information on the name of the individual
with decision making authority for selecting asset managers, whom I label the Chief
Investment Officer (CIO). In addition, MMD tracks pension plan assets, the name of the
pension plan's asset managers and which asset class the manager is managing for the
pension. MMD provides information on asset allocation and dollars managed by asset
managers only since 1999. In certain years, MMD also includes information on pension
sponsors' participation in a variety of practices associated with financial sophistication
such as: securities lending, options, futures, emerging markets and other geographic
diversification, derivatives, currency, timber, other alternative assets among others. As a
measure of pension plans' financial sophistication, I create an index, adding one for each
activity in which the pension participates, allowing for a maximum score of 46. MMD
also provides information on pensions' outside investment consultants, if any.
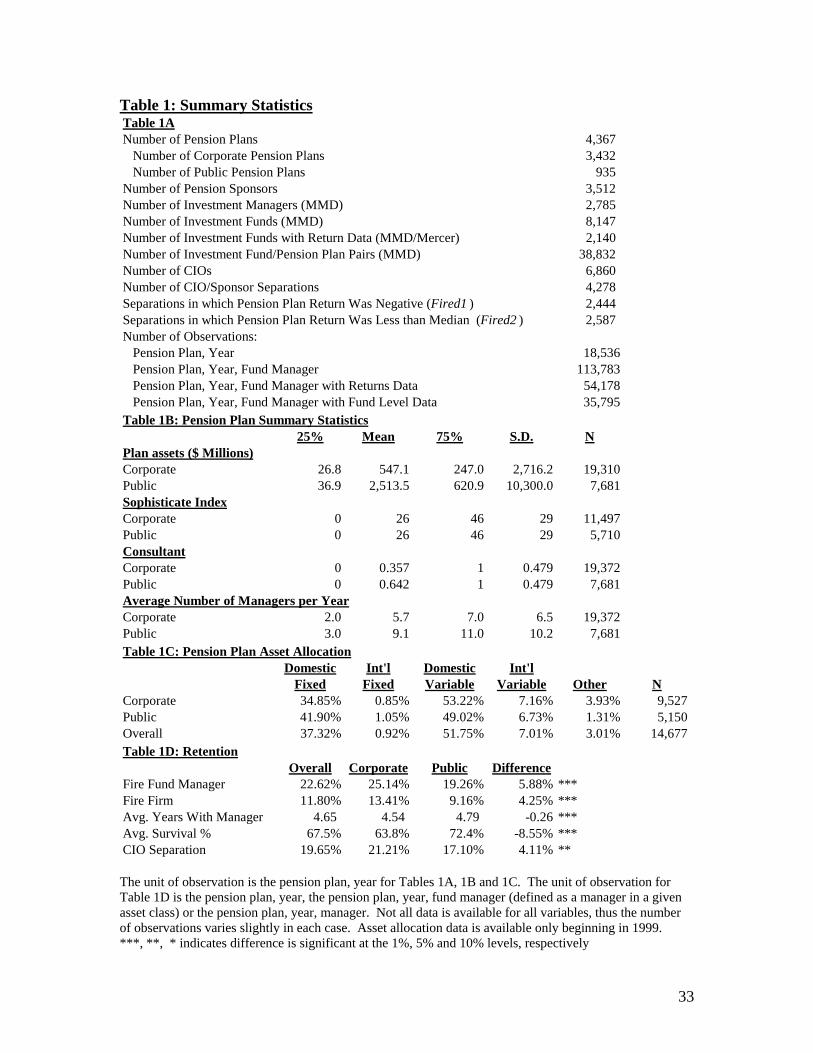
Table 1A provides an overview of the sample and Table 1B provides summary
statistics for control variables that will be used in the subsequent analyses. There are
more than three times as many corporate pension plans as there are public pension plans
in the sample, although public pension plans tend to be significantly larger when
measured by plan assets. The average corporate plan has approximately $550 million in
assets, compared to $2.5 billion for the average public plan. Public pension plans range
from the largest, better known state plans, such as the California Public Employees
Retirement System (CalPERS) and the New York State Common Retirement Fund to
smaller municipalities such as the City of DeKalb and the Village of Franklin Park Fire

11
Pension Fund. The largest corporate pensions include AT&T and General Motors.
Approximately 61 percent of corporate pensions in the sample are those of publicly
traded companies.
Perhaps reflecting the larger average size of public pension plans, public and
corporate pensions are equally financially sophisticated on average. Public pensions are
dramatically more likely to use investment consultants, with approximately 64 percent of
public pensions employing consultants, and only 36 percent of corporate pensions
employing consultants. Public pensions employ an average of nine managers, compared
to corporate pensions' seven managers, implying that public managers manage larger
amounts of assets on average. Perhaps the most significant difference between corporate
and public pension plans is in their asset allocation choices, shown in Table 1C. On
average, corporate pensions invest more in variable return asset classes, as well as more
in the "other" category (which includes hedge funds, private equity, timber and other
alternative assets), while more than 40 percent of public pension assets are invested in
domestic bonds. The analysis in this paper is limited to publicly traded asset classes, due
to the difficulty of determining the appropriate benchmark for alternative assets, and
because the preponderance (more than 95%) of pension assets is invested in publicly
traded assets. In addition, governance issues in public pension funds are likely to be least
severe in publicly traded asset classes, since alternative asset classes are where
investments are most affected by economically targeted investment (ETI) influences.
A fund management firm (manager) is considered to be terminated when it is
listed as a manager of an asset class for a pension plan in the year, and it is not listed as a
manager of that asset class in the subsequent year. For robustness, in case the manager

12
was not terminated, but the asset class was merely redefined, I also consider terminations
of the manager on the whole, when a manager fails to be listed as a manager for that
pension plan in the following year in any asset class. MMD assigns a unique identifier
for fund managers, which is updated for mergers and acquisitions, current as of 2005, so
that a firm which was subsequently acquired will not be considered a termination.
Obviously, there are no terminations observed in 2005, the most recent available year of
the directory. Thus 2005 is excluded from the analysis. In each year, the unit of
observation is a pension plan, asset manager, asset class combination (pension
plan/investment fund), with the variable of interest, termination, a variable equal to one if
the manager is no longer associated with that pension plan in that asset class in the
following year.
MMD provides the first name, last name and title of several contacts at each
pension plan, indicating the individual with primary responsibility for selecting
investment managers. While the actual professional title may vary, I label this individual
the CIO. After cleaning the data for inconsistencies in spelling and assuming that an
individual working for the same pension plan with the same last name and same first
initial is the same person, the dataset includes 6,860 unique CIO / pension plan pairs,
averaging not even two CIOs per pension sponsor over the decade. Of these, I can
identify 4,278 separations, defined as the CIO being replaced by a new name in the
following year of the directory. The vast majority of the time, the CIO disappears from
the pension plan sample, leaving only 209 cases where the CIO assumes a new position at
another pension fund tracked by MMD.

13
Given the many inconsistencies in the spelling of names, it is possible that more
cases of CIOs switching jobs within the pension industry exist, but are not identified.
The cleaning procedure is unlikely to misidentify separations, since the algorithm used
considers close sounding names more closely if the individual is at the same organization.
For example, Robert Jones in 1999 and Bob Jones in 2000 if both working for CalPERS
would be identified as a match, but if Robert Jones in 1999 working for CalPERS
switched jobs in 2000 to IBM and was recorded as Bob Jones, the two records would not
be identified as the same person. For the purposes of the analysis, differentiating
between career opportunities from changing jobs and career risks of termination is not as
important, so I do not pursue this issue further. Anecdotally, a large number of CIOs
switch to positions in the investment management or investment consulting industries
(for example, CalPERS CIO Daniel Szente left in 2001 after only 15 months to work for
an investment fund) thus it is not surprising that a significant number of separations result
in the individual leaving the pension industry. The CIO may also exit the industry to
retire. In each year, the unit of observation is a CIO / pension plan combination, with the
variable of interest, separation, a variable equal to one if the CIO is no longer associated
with that pension plan in the following year. I also create two variables for termination:
Fired1 which assumes that the separation was a termination if the gross change in assets
was negative and Fired2 which defines the separation as a termination if the gross
percentage change in assets was less than the median.
As shown in Table 1D, on a univariate basis, from 1996 to 2005, corporate
pensions terminate their fund managers in 25 percent of the observations, significantly
more than public pensions' 19 percent termination rate. Correspondingly, the average

14
survival percentage, measured as a percentage of the possible years that a manager could
have remained with a pension plan, is only 64 percent for corporate pension managers
versus 72 percent for public pension managers. Over the course of the sample, corporate
pension CIOs separate from their positions four percent more than do public pension
CIOs, a difference which is both economically and statistically significant.
While MMD provides extensive information on pension plan sponsors, it provides
less information on the fund managers. After 1999 the database contains a measure of
the amount of money the manager is managing in a given asset class for approximately
70 percent of the managers. Critically, the MMD database does not provide any measure
of money manager fund returns, total assets under management or fees.
The MMD data is supplemented by two databases, Mercer's Manager
Performance Analytics and Mobius Check Free M-search (M-search) both of which track
composite returns from pension plan asset managers. While there is no requirement for
pension plan investment managers to disclose their track records to any single database,
Mercer and Mobius are among several databases which track the performance of these
funds. Mercer is a large investment consultant and collects data on institutional managers
in order to assist its clients with manager selection. Managers are unlikely to submit
inaccurate information, since Mercer also has access to actual client returns for
comparative purposes. Mobius is an independent database provider which verifies the
data through phone calls to managers, but does not have access to client returns.
Mercer tracks qualitative and quantitative performance and descriptive data on
more than 2,300 investment managers and 12,700 separate account products (funds) with
data beginning in 1981. Data includes details on the investment manager such as age,
15
assets under management, investment professionals and account turnover. Data also
includes details on each fund such as asset class, applicable benchmark and fees. Mobius
has similar data on 1,300 investment managers and 5,500 funds. Unfortunately, the
Mobius data has a survivorship bias issue, since the company does not keep past versions
of its database. Thus, the performance specifications use only the Mercer performance
data, with some regressions supplemented with data only available from Mobius such as
fees and assets under management.
The performance data was matched to the MMD data by hand in several stages.
The first stage was to match the investment manager firm names. 759 of the 2,780 MMD
investment management firms were matched to the Mercer data, representing 80 percent
of dollars managed from 1999 to 2005. Of the matched firms, Mercer matched fund
return information for approximately 41% of dollars managed.1 The Mobius database
would add an additional 117 firms, if used.
The second step was matching specific investment manager funds (a fund being
defined as the combination of a management firm and asset class). MMD categorizes 61
asset classes, including separate categories such as small cap value equities, small cap
equities and value equities. Mercer sorts returns information by product category as well,
with 45 asset categories. The full list of asset classes for Mercer and MMD is provided in
Appendix 1. For managers matched at the firm level between Mercer and MMD, I then
matched the asset classes. For example, if Morgan Stanley manages small capitalization
value equities assets for General Motors, I match this to Morgan Stanley's small
capitalization value equities composite return from Mercer. When there are multiple
1 Note: this number is perhaps high, since data on the amount of assets managed is available only from 1999-2005. Assuming there is a better chance of matching the later data, the percentage of dollars matched for the full sample may be smaller.
16
potential matches, I create a blend of the returns by averaging all potential composite
returns that could be a match. Thus, if a manager is managing "Equities (Unspecified)"
according to MMD, the associated return will be an average of the returns of every equity
fund of that manager. For robustness, I repeat the analysis on the subsection of funds for
which there was an exact match (i.e. only one fund in that asset class). Returns are
windsorized at the one percent level to drop extreme observations which are more likely
to reflect data errors than actual returns.
Summary statistics for the sub-sample of matched pension plan / asset manager
pairs are presented in Table 2. The observation level is one per pension plan / asset
manager / asset class / year, totaling 45,851 observations for years prior to 2005 (since I
cannot calculate termination data for 2005, I also do not present 2005 returns data so that
the tabulations are based on the same sample). The sample contains multiple
observations for funds managing assets for multiple pensions. Thus funds with the
largest number of investors are disproportionately represented. The disparity in corporate
and public termination rates is similar for managers with matched track records as it was
for the entire sample. However, the overall probability of manager termination is lower,
suggesting that the performance database is likely to contain more successful managers.
The subject of evaluating manager performance is actively debated and beyond
the scope of this paper. Since the merits of any single method for evaluating manager
skill are debatable, I use several of the most commonly accepted methods, in the hope
that consistency across specifications may be convincing. Regardless of their actual
ability to estimate manager skill, these methods are commonly used by practitioners in
evaluating performance. The analysis considers the following performance measures:

17
gross returns, risk-adjusted returns and Jensen's alpha. In addition, I examined tracking
error against the manager selected benchmark to see how appropriate that benchmark
might be.
I calculate risk-adjusted returns in three ways: i) The return less an average of the
Mercer-identified benchmark indices for that asset class (ADJR2) ii) The return less the
fund's self-selected benchmark when reporting data to Mercer (ADJBMK) and iii) The
return less the S&P 500 for any equity fund and the return less the risk-free rate for any
fixed income fund (Naively adjusted return or ADJR3). I estimate alpha relative to the
Fama-French factors (ALPHAFF) and relative to the firm's selected benchmark
(ALPHABMK) using rolling 12 quarters of past return data. The correlation between the
benchmark selected by the fund and the average of the benchmarks judged appropriate by
Mercer is surprisingly low at 0.41. Looking at randomly selected data points, this low
correlation reflects manager selection of benchmarks with different risk attributes, such
as a small capitalization growth fund choosing the S&P 500 as a benchmark. The
analysis focuses on the unadjusted gross returns measure and the ADJR2 measure, which
should best capture the true performance relative to an appropriate benchmark. Of the
matched returns, approximately one third are domestic fixed income, 48 percent are
domestic variable return and 18 percent are international variable return. Relative to the
asset allocation mix of the full sample, the sub-sample with matched returns
overrepresents domestic fixed return and international variable return managers,
assuming a direct relationship between dollars managed and number of managers. In
addition, the matched managers are larger than the unmatched managers. (See Table 2B)

18
Average gross returns are similar for corporate and public fund managers at 11 to
13 percent, although returns adjusted for benchmarks appear higher for corporate fund
managers. The average return adjusted for an average of the relevant benchmarks
(ADJR2) is approximately 2 percent. The mean risk adjusted return (ADJR2) is slightly
higher than the style adjusted performance estimated by Coggin, Fabozzi, and Rahman
(1993), and than the roughly 1 percent excess return estimated by various studies for
mutual fund managers. Since higher performing managers are likely to have more
investors, they are overrepresented in the sample, causing the performance means to be
slightly higher than those calculated with only one observation per fund year. The
difference between corporate and public performance is not consistently of one sign in
the different performance measures, presaging multivariate results which do not show
statistically meaningful differences between public and corporate manager returns. In
addition, care should be taken when interpreting the univariate results since the difference
between corporate and public returns likely reflects differences in the distribution of
excess returns between fixed and variable return funds.
Since the MMD data is annual, it does not reveal the quarter in which the
termination decision was made. Performance measures are presented on an annual basis,
and allow for a one year lag in order to allow pension plans time to respond. This may
introduce noise, since many pensions are actually evaluating managers on a quarterly
basis. A pension plan that made a termination decision in March may be considering
different performance data than did a pension that made a termination decision in
December, especially for managers with volatile performance. However, as long as the
two types of pensions are equally likely to be making decisions at different times of the

19
year this should not affect any conclusions. For robustness, in unreported regressions, I
also included a second lag in returns, which did not affect the results.
Finally, historical performance is reported gross of fees. Fees may be an
important consideration in selecting or terminating an investment manager, especially if
the manager's expected outperformance is roughly equal to the annual fee. Typically fees
are levied on a scale basis, with larger investors paying lower fees. In practice, fees are
negotiable for investments of more than $75 million, and possibly for smaller accounts.
Mobius provides information for fees for hypothetical accounts. The analysis presented
uses the fees for a $50 million account as a control, with the assumption that differences
in fees between funds at the $50 million account level will be roughly comparable across
account sizes.
IV. Termination Decisions of Corporate and Public Pension Plans
Public pensions are dramatically less likely to fire their asset managers than are
corporate pensions. A simple model of fund manager termination suggests that the
decision to terminate should be a function of pension plan characteristics such as
transactions costs and asset allocation changes as well as manager characteristics such as
performance (track record) and fund management staffing changes. After controlling for
manager and pension plan factors that should directly affect the termination decision
there is no reason to expect different termination patterns for public and corporate
pensions. However, the observed difference in termination rates between public and
corporate pension plans is robust to controlling for differences in pension plan and
manager characteristics.

20
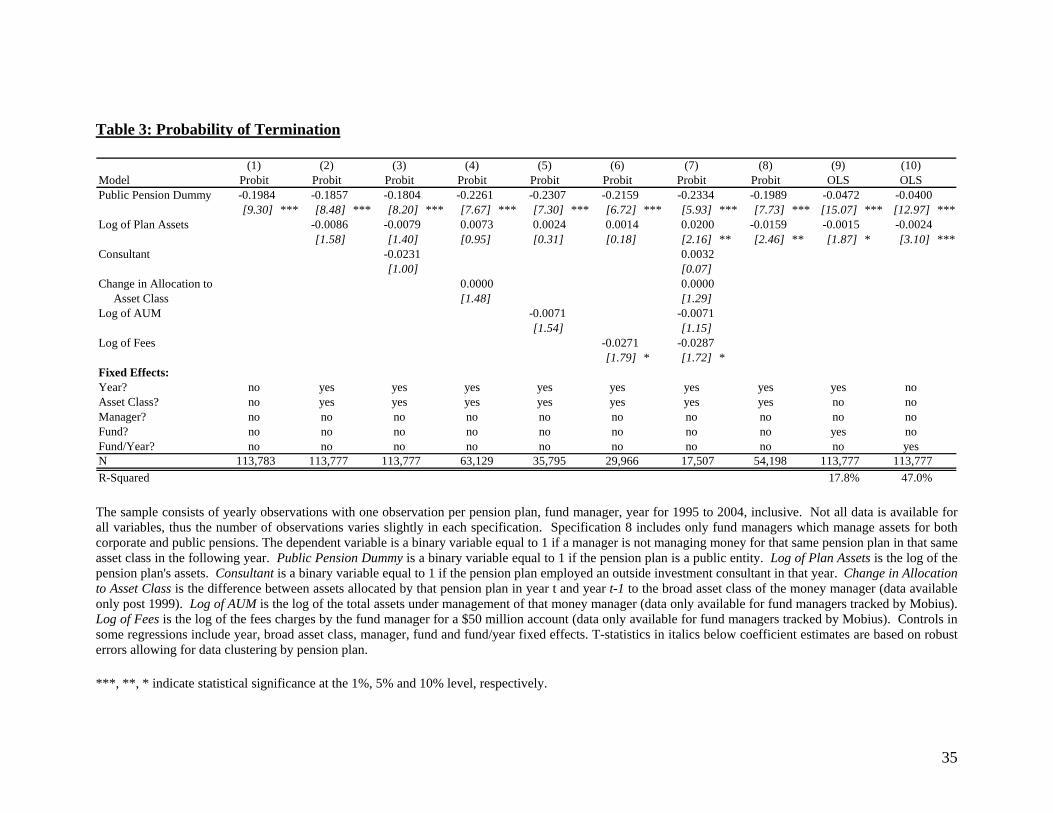
Table 3 details the paper's primary findings on manager termination. Beginning
with the simplest specification which considers only whether the pension plan is
corporate or public, the various specifications add factors that might influence manager
termination rates, seeking to control for any differences between the types of pension
plans that might be driving the result. In every case the coefficient on the public pension
dummy remains negative and statistically significant.
Since transactions costs are likely a linear function of assets under management,
they should be negatively associated with termination rates. Specification 2 uses pension
plan size as a proxy for transactions costs, with the expected negative sign. Pension plan
size may also serve as a proxy for financial sophistication, and thus be a control for
differences in financial sophistication among corporate and public plans. Specification 4
considers an alternate measure of transactions cost, the assets under management of the
fund manager, which again has a negative sign.
As expected, decreasing the dollars allocated to an asset class will increase the
probability of manager termination. Again, after controlling for the effects of changes in
asset allocation, the disparity between public and corporate pensions remains. This
disparity is unaffected by controls for the presence of investment consultants, which may
make it more or less difficult to terminate managers by adding an additional layer to the
process. Specifications control for time and asset class variation in manager terminations
with fixed effects.
Beyond controls for pension plan characteristics which affect termination
decisions directly, if the pool of asset managers that manage money for public and
corporate pension plans is generally similar, we should observe similar rates of

21
termination. Controlling directly for differences in fund manager characteristics such as
assets under management and fees, public pensions continue to terminate managers less
than do corporate pensions.
It is also possible that managers customize their offerings to cater to public or
corporate clients in unobservable ways. There may then be systematic differences in the
types of managers that public and corporate pensions are hiring. I control for that in
several ways. First, Specification 8 of Table 3 limits the sample to only those managers
who manage both public and corporate assets (roughly half). The coefficient on the
public pension dummy remains negative and statistically significant. Second,
Specification 9 absorbs manager fixed effects at the fund level, using an OLS
specification due to the limitations of probit model. After controlling for differences in
fixed fund characteristics, the coefficient on the public pension dummy is negative and
statistically significant.
In their paper on window dressing by asset managers, Lakonishok, Shleifer and
Vishny (1991) suggest that pension plan investment managers are being evaluated on
criteria other than past performance, such as the specific composition of portfolios. The
final specification of Table 3 absorbs fixed effects on the fund-year level, effectively
considering differences in pension plan terminations on the same funds in the same years
which should capture differences such as the composition of portfolios. Public pensions
terminate their managers approximately 4 percentage points (21 percent) less often than
do corporate pensions.
While the fund-year fixed effects should effectively capture any differences in
fund performance, Table 4 considers the impact of manager performance on termination

22
directly. As expected, each performance measure is negatively associated with the
probability of termination. Higher return funds are less likely to be terminated. In
particular, the return less the appropriate benchmarks (ADJR2) coefficient has a t-statistic
of almost six (Specification 3). Holding all other variables at their medians, the
probability of termination for a fund with adjusted returns in the 25th percentile is 11%,
versus 10% for a 75th percentile fund, a difference of approximately 10%. In unreported
regressions, I also considered the impact of two-year prior performance, with similar
results.
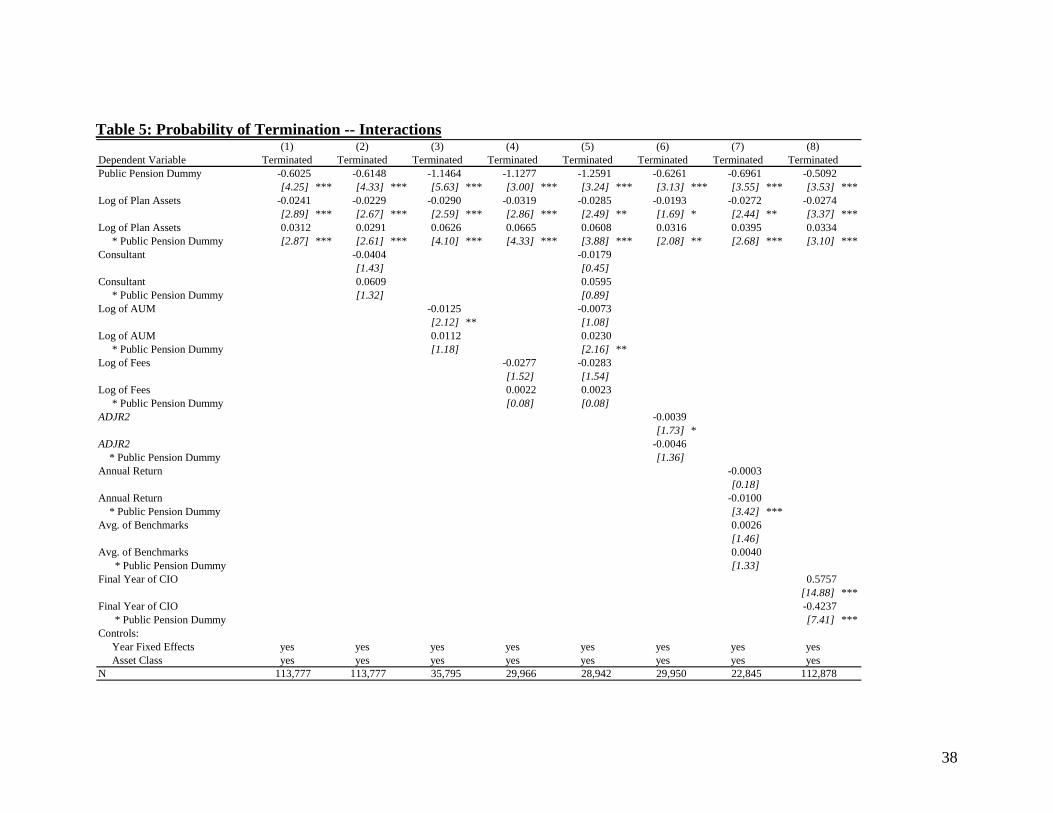
It is possible that organizational or other differences cause public and corporate
funds to respond differently to the control variables presented. Table 5 considers the
results of adding an interaction term between the controls and the public pension dummy,
allowing the impact of the controls to vary between public and corporate pensions.
Curiously, while larger corporate pensions are less likely to fire their asset managers,
termination decisions for public pensions seem largely indifferent to plan size. If there
are more career opportunities for larger public CIOs, they may choose to appear to
manage more actively, while for larger corporate CIOs the impact of high transactions
costs dominates the career concerns. Similarly, there is a different sign for the interaction
term between public pensions and assets under management and fees, suggesting that
public pensions may respond differently to fees, although the coefficients are small, and
the statistical significance is limited. Despite their overall lower willingness to terminate
managers, if anything, public pension managers may be more responsive to adjusted
returns; however, the coefficient on the interaction term is not statistically significant.

23
The implications of these differences are discussed in greater detail in Section VI, which
considers differences in CIO incentives between the two types of pensions.
The preceding analysis is based on a simple model of termination, which includes
factors that pension plans should be concerned about when contemplating manager
termination. In practice, pension plan performance is usually evaluated in the context of
relative performance. Thus, any analysis of pension plan behavior must also consider the
impact of herding of the type considered by the reputational model of Scharfstein and
Stein (1990) and documented in many areas of investment management in which
performance evaluation is based on relative performance (Zweibel (1995), Prendergast
and Stole (1996), Morris (1997) and Avery and Chevalier (1999)).
Asset management is also an area in which externalities to herding exist. If a
significant number of investors are withdrawing assets from a fund manager, it may
adversely affect that manager's positions. Terminations by other pension plans may
directly cause future negative returns, and thus pensions may wish to terminate managers
solely in response to other pension plans' actions, much like the bank runs modeled by
Diamond and Dybig (1983).
The difference in termination rates between public and corporate pensions is
robust to measures of herding. Both types of plans appear to be responsive to behavior of
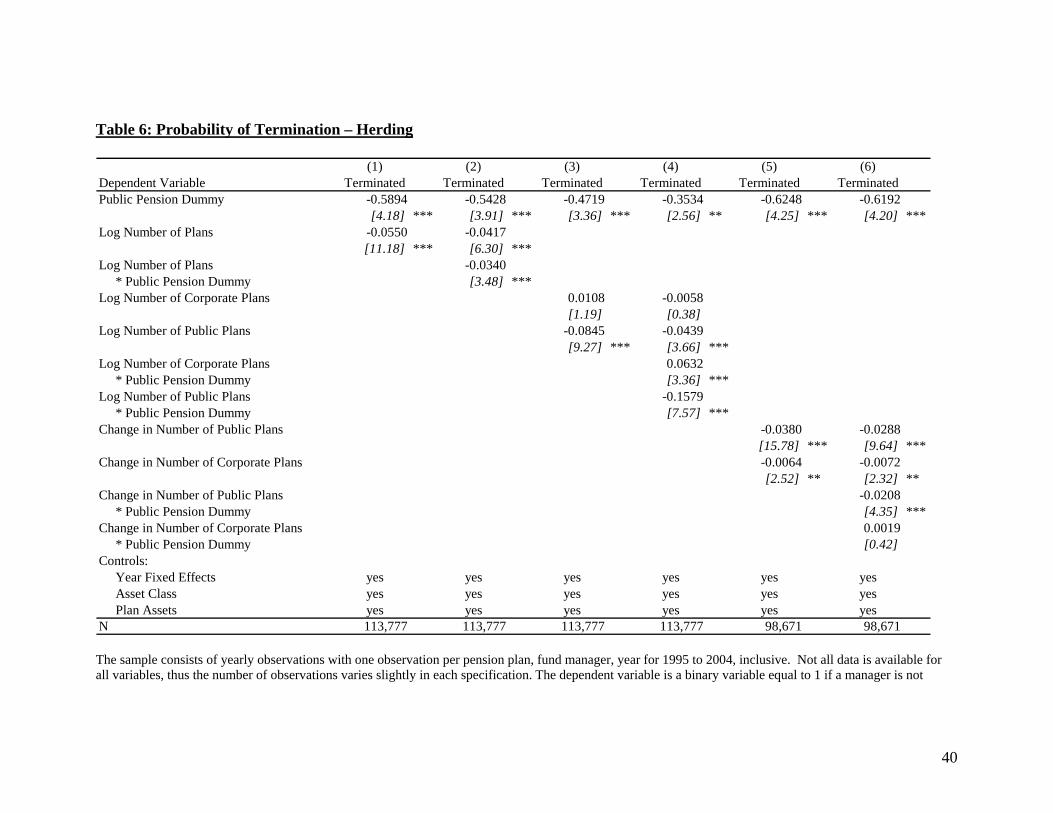
other pension funds. Table 6 shows that while both public and corporate pensions are
less likely to terminate popular fund managers, public managers are even less likely to
fire funds that a large number of plans invest in. Between the 25th percentile in number
of investors and 75th percentile, corporate pensions are 14% less likely to terminate while

24
the same difference means that public pensions are 18% less likely (based on
specification 2).
Interestingly, the influence of other investors appears driven disproportionately by
the actions of public funds. The probability of termination is decreasing in the number of
public plans who invest with a given manager, but increasing (not significantly different
from zero) in the number of corporate plans. Since public funds are less likely to
terminate their investment managers, funds with large numbers of public investors may
be less likely to suffer negative externalities caused by a large mass of investors looking
to exit quickly until the public pensions begin leaving as well. Specification 4 indicates
the possible importance for public funds of the reputational consequences of herding.
Public funds are least likely to terminate their managers who share large numbers of
public funds as investors, but more likely to fire plans with a large number of corporate
investors. These results are seen even more clearly when considering the change in the
number of public and corporate investors (Specifications 5 and 6). Public funds are more
likely to terminate managers who are suffering from public pension investor defections.
Anecdotally, the consequences for public pension plans of investing in notable
fund failures are worse. Counterfactually, this should lead pension plans to terminate
potential blow-ups more frequently, since the negative consequences of investing in such
funds are more severe. Public pensions appear to engage in reputational herding, as their
returns and manager choices may be closely scrutinized only when they diverge
significantly from their peers. Corporate pensions are probably subject to more rigorous
continuous analysis, since corporate pension returns have the potential to contribute to
corporate earnings. Herding may also be the result of an informational story, in which

25
public pension CIOs speak primarily to other public pension CIOs and termination
patterns are the consequence of their learning from each other. In all cases, herding does
not itself explain the overall disparity between public and corporate pension termination
rates remains.
V. Public vs. Corporate Pension Performance
What are the performance consequences of the observed differences in
termination rates? Given the high transactions costs associated with terminating fund
managers, in order for corporate pensions' higher termination rates to benefit their plans,
corporate pensions must be achieving higher performance from their fund managers.
Perhaps the additional monitoring and fear of termination leads fund managers to select
better investments. Perhaps corporate pension plans are able to identify outperforming
funds and exit before those funds' performance reverts to the mean.
While it is always difficult to conclude anything about performance given the
difficulty of appropriate risk adjustment, the preponderance of the evidence suggests no
difference between corporate and public pensions' fund managers' performance. The
distribution of gross returns for public pension plan managers looks very similar to that of
corporate pensions' fund managers, both in mean and standard deviation. Adjusted
returns (ADJR2) are higher by 35 basis points on a univariate basis for corporate
managers, perhaps reflecting the wider ranges of performance possible in variable return
assets. Table 7 considers several different measures of returns as the dependent variable,
controlling for pension plan size and fixed effects at the year and asset class level. In
none of the specifications was the public pension dummy statistically significantly related

26
to performance. No consistent sign for public pensions was estimated, with public
pensions estimated to actually have a positive relationship with returns for the average
benchmark-adjusted return (ADJR2) and alpha vs. the Fama French factors.
Since public and corporate pensions may be forced to invest in different
managers, I control for manager attributes to ensure that the results are not camouflaged
by observed or unobserved differences in the types of managers each can invest in. I did
so directly; using observed fund attributes in specifications 1 and 2 of Table 8, and by
using manager fixed effects in specifications 3 and 4. Specifications 5 and 6 show the
results of including only managers with both public and corporate investors. For
simplicity, I present only gross returns and ADJR2 as performance measures. The results
were conclusively mixed, with no evidence that public and corporate pensions invest in
fund managers that perform differently. Results were similar when using other
performance measures, with a consistent lack of statistical significance for the public
pension dummy coefficient, and varying estimates of the sign. Finally, for robustness, I
show the results from a quantile specification (7 and 8) and using the Fama-MacBeth
method to correct the standard errors for correlations between the same managers over
time. Unsurprisingly, neither method suggests that corporate pension plans outperform
public pensions in manager selection.
Governance is an important concern with public pension plans. In particular,
public pensions are vulnerable to political influences. Public pension CIOs are governed
by a board that includes political officials and appointees. Anecdotal evidence supports
"pay-to-play" contributions where fund managers contribute to political campaigns in
order to be retained as managers. The evidence on publicly traded asset fund managers

27
suggests that the issue of "pay-to-play" contributions is not negatively affecting manager
selection, since public pensions do not appear to be selecting worse managers than their
private sector counterparts. However, my results cannot necessarily be extended to the
question of economically targeted investments (ETI) of pension returns, since this sample
includes only managers of publicly traded investments. The majority of ETI are made
through direct investments in real estate or through alternative investment funds such as
venture capital funds. Any difference in performance at the overall pension plan level
may reflect differences in manager selection, or differences arising from governance
issues and ETI.
If there is not much manager investing skill in publicly traded assets, the fact that
public and corporate pensions do not pick managers of consistently different performance
despite different termination rates is unsurprising. Whatever a pension plan's criteria are
for manager retention, it will not make much of a difference, because managers are the
same. It is also possible that public plans benefit from corporate plans' active monitoring,
which improves performance, and all plans share equally in the benefits. However, an
unreported specification shows no statistically meaningful difference between the
performance of funds with no corporate investors and all other funds.
VI. A Managerial Incentives Explanation of Public and Corporate Differences
What explains the difference in the termination behavior of corporate and public
pensions? This question is especially interesting in the context of the lack of meaningful
performance differences, since the increased level of terminations does not seem to have
any performance benefits for corporate pensions. While decisions for both types of plans

28
are made by Chief Investment Officers, the incentives of public and corporate CIOs are
very different. A Greenwich Associates poll estimated that total annual compensation for
corporate CIOs was almost double that of public CIOs at the median, despite the larger
average size of public pension plans. Corporate CIOs' bonus compensation is also larger
in both absolute terms and as a percentage of base salary.2
Public pension CIOs are 40 percent less likely to leave their positions than are
corporate pension CIOs (Specification 2, Table 9). Public pension CIOs are 49 to 58
percent less likely to be fired (defining fired as those who leave after a gross change in
assets below the median or CIOs who lose assets). Public pension CIOs may have
chosen the public sector deliberately for insulation from the vagaries of corporate careers
and be more inclined to lead the "quiet life." Alternately, if public pensions' CIOs
outside career options are more limited, they may not be incentivized to be active
supervisors of their outside asset managers. I interpret the quiet life in the pension plan
management context to mean making as few changes as possible, and basically lead to
management characterized by inertia. This would lead to reviewing fewer managers per
year and terminating fewer managers as well.
In contrast, corporate pension CIOs are under more pressure to perform, however
defined. They are likely to be more actively monitored, and have more incentives to
point to actions they have taken, in order to change positions or merit incentive
compensation. There does not appear to be a direct relationship between asset manager
performance and the probability of changing jobs, suggesting that CIOs are changing jobs
based on unobserved characteristics.
2 The Greenwich Associates data should be interpreted anecdotally, since it is based on a sample of only 37-39 public and 18 corporate respondents from 2004 and 2005. No central data source for CIO compensation is available.
29
Generally, pensions are more likely to terminate managers when their asset class
has higher returns (see Table 5, specification 6). This may come from funds rebalancing
to maintain a fixed asset allocation. However, relative to corporate pensions, public
pensions are less likely to terminate their managers even when their asset class is doing
well. This again suggests a predilection towards inertia.
While the impact of transaction costs would suggest that larger pensions should
terminate managers less frequently, public pensions are either indifferent to size in
termination decisions, or if anything more likely to terminate managers as fund size
increases (see Table 5 where the sum of the coefficients on plan assets and the interaction
with the public dummy are positive or zero). When controlling for transactions costs
with the managers' assets under management (Table 5, specification 3) larger pension
plans are more likely to terminate managers than are smaller pension plans. Since larger
public pension CIOs may have more career opportunities, this is perhaps suggestive of
career concerns at work.
The bureaucracy involved with public pension fund governance is significantly
more elaborate than the process within corporate pensions. This makes the hiring and
firing process more cumbersome. The primary effect of this should be to delay firing
decisions, perhaps making public pensions less responsive to performance, although the
data show no evidence of this. It is possible that a secondary effect of this is to reduce
overall termination rates, since the possibility of an extended delay in hiring a new
manager makes CIOs wary of termination. However, in a smaller sample of public

30
pension funds for which I had board information, I find no evidence that boards affect
termination decisions.3
VI. Conclusion
Significant differences in termination rates exist between public and corporate
pensions. While public pensions are 39% less likely to fire their asset managers, there is
no significant performance difference between public and corporate managers. While
conventional wisdom often criticizes government organizations for their lack of high-
powered incentives, pension fund management may be an example of a case where low
powered incentives are more appropriate. In a classic case where returns offer only noisy
signals of asset manager ability, it may not be efficient to motivate CIOs with high
powered incentives, since it may result in excessive manager hiring and firing with no
change in performance outcome.
The implications of this finding are many. First, corporate pension plans may
want to consider the basis upon which they evaluate their CIOs. Are they achieving
higher performance given their termination rates? And does this higher performance
justify the transactions costs associated with changing managers? If these actions are
motivated by CIO interest in switching jobs, corporations may wish to explicitly
discourage fund manager switching. While we often look to the private sector to improve
the public sector, asset manager selection seems to be a place where inertia has a positive
impact.
3 Using data from the Public Pension Coordinating Council’s Survey of State and Local Government Employee Retirement Systems (PPCC), a biennial survey of public pensions, I considered the impact of governance quality as measured by the board composition (percentage elected by pensioners) and also the amount of bureaucracy as measured by the number of people on the Board of Trustees.

31
Second, there are many other actions that CIOs take that are more difficult to
evaluate normatively. For example, one of the most important decisions that pension
plans make is the asset allocation decision. However, it has been difficult to normatively
assess asset allocation choices, since they may be driven by differences in risk aversion.
The evidence on manager termination, and the implication that public pension CIOs may
be motivated by inertia, suggests that public pensions' lower allocations to variable asset
classes may merely reflect their desire to live "the quiet life." Thus public pension boards
should be concerned with areas of the pension plan in which change may be appropriate.
This may include the introduction of new asset classes. Generally, public pensions have
lagged corporate pensions in their adoption of new asset classes, such as venture capital
and their late entrance may have generated lower returns in these areas (Lerner, Schoar
and Wong 2006).
Third, deliberately or not, public pensions provide a source of stable capital to
investment managers. While they are equally responsive to performance, by virtue of
their relative absolute unwillingness to terminate fund managers, they may allow
managers to pursue longer horizon trading strategies. Should these pensions be
converted to defined contribution plans, individuals may not have the same investment
tendencies. Looking at the performance information more granularly, corporate CIOs
terminated many value equity managers during the Internet boom of the late 1990s,
resulting in outperformance in the domestic variable return asset class. However, in the
early 2000s, corporate pensions underperformed in the same asset class, as their growth
equity managers stumbled. Public pensions underperformed in the late 1990s in variable
domestic return assets, but outperformed in the early 2000s, since they maintained their

32
investments in value managers. The impact of investor composition on investment
manager behavior is an area for future research.
33
Table 1: Summary Statistics Table 1ANumber of Pension Plans 4,367 Number of Corporate Pension Plans 3,432 Number of Public Pension Plans 935 Number of Pension Sponsors 3,512 Number of Investment Managers (MMD) 2,785 Number of Investment Funds (MMD) 8,147 Number of Investment Funds with Return Data (MMD/Mercer) 2,140 Number of Investment Fund/Pension Plan Pairs (MMD) 38,832 Number of CIOs 6,860 Number of CIO/Sponsor Separations 4,278 Separations in which Pension Plan Return Was Negative (Fired1 ) 2,444 Separations in which Pension Plan Return Was Less than Median (Fired2 ) 2,587 Number of Observations: Pension Plan, Year 18,536 Pension Plan, Year, Fund Manager 113,783 Pension Plan, Year, Fund Manager with Returns Data 54,178 Pension Plan, Year, Fund Manager with Fund Level Data 35,795 Table 1B: Pension Plan Summary Statistics
25% Mean 75% S.D. NPlan assets ($ Millions)Corporate 26.8 547.1 247.0 2,716.2 19,310Public 36.9 2,513.5 620.9 10,300.0 7,681Sophisticate IndexCorporate 0 26 46 29 11,497Public 0 26 46 29 5,710ConsultantCorporate 0 0.357 1 0.479 19,372Public 0 0.642 1 0.479 7,681Average Number of Managers per YearCorporate 2.0 5.7 7.0 6.5 19,372Public 3.0 9.1 11.0 10.2 7,681 Table 1C: Pension Plan Asset Allocation
Domestic Int'l Domestic Int'lFixed Fixed Variable Variable Other N
Corporate 34.85% 0.85% 53.22% 7.16% 3.93% 9,527Public 41.90% 1.05% 49.02% 6.73% 1.31% 5,150Overall 37.32% 0.92% 51.75% 7.01% 3.01% 14,677 Table 1D: Retention
Overall Corporate Public DifferenceFire Fund Manager 22.62% 25.14% 19.26% 5.88% ***Fire Firm 11.80% 13.41% 9.16% 4.25% ***Avg. Years With Manager 4.65 4.54 4.79 -0.26 ***Avg. Survival % 67.5% 63.8% 72.4% -8.55% ***CIO Separation 19.65% 21.21% 17.10% 4.11% ** The unit of observation is the pension plan, year for Tables 1A, 1B and 1C. The unit of observation for Table 1D is the pension plan, year, the pension plan, year, fund manager (defined as a manager in a given asset class) or the pension plan, year, manager. Not all data is available for all variables, thus the number of observations varies slightly in each case. Asset allocation data is available only beginning in 1999. ***, **, * indicates difference is significant at the 1%, 5% and 10% levels, respectively

34
Table 2A: Summary Statistics II -- Performance
25% Mean 75% S.D. NProbability of Termination (Managers with Matched Track Records)Corporate 0.00% 21.43% 0.00% 41.04% 26,401Public 0.00% 15.91% 0.00% 36.58% 20,450 Difference 0.00% 5.53%*** 0.00%ReturnCorporate 1.08 11.20 22.52 18.18 26,401Public -0.76 12.64 28.68 21.29 18,878 Difference 1.84 -1.43*** -6.17S&P 500 -11.89 11.22 28.68 21.62 34,105Risk Free Rate 1.67 3.81 5.07 1.71 34,105Return Less Benchmark Return (ADJRBMK)Corporate -12.73 0.38 12.19 19.65 9,262Public -14.51 -0.18 12.84 19.75 6,853 Difference 1.78 0.56 -0.65Return Less Average of Appropriate Benchmarks (ADJR2)Corporate -1.09 2.16 4.00 6.49 14,084Public -1.27 1.81 3.72 6.30 11,195 Difference 0.18 0.35*** 0.28Fama French Factor Adjusted AlphaCorporate 4.31 8.54 12.14 7.59 18,700Public 4.31 8.63 12.21 7.84 14,993 Difference 0.00 -0.10 -0.07Avg. Benchmark Adjusted AlphaCorporate 0.20 2.72 4.45 4.66 13,471Public 0.07 2.80 4.42 4.90 10,811 Difference 0.13 -0.07** 0.04Tracking Error vs. Avg. BenchmarkCorporate 1.80 6.20 8.83 5.94 10,737Public 1.60 6.30 8.58 6.41 8,884 Difference 0.20 -0.09 0.25 Table 2B: Matched vs. Unmatched Managers
Matched UnmatchedMatched Sample vs. MMD DataN 46,851 55,633 Plan Assets ($ millions) 5,032.0$ 5,311.1$ Consultant 71.1% 59.8%Dollars Managed 216.2$ 136.0$ Asset Class:Domestic Fixed Income 31.8% 25.7%International Fixed Income 1.7% 3.6%Domestic Variable Return 48.3% 55.0%International Variable Return 17.7% 15.0%Other 0.5% 0.7% The unit of observation is the pension plan, year, fund manager (defined as manager in a given asset class) for 1995 to 2004, inclusive. Returns information based on Mercer performance data. ***, **, * indicates difference between means is significant at the 1%, 5% and 10% levels, respectively.
35
Table 3: Probability of Termination
(1) (2) (3) (4) (5) (6) (7) (8) (9) (10)Model Probit Probit Probit Probit Probit Probit Probit Probit OLS OLSPublic Pension Dummy -0.1984 -0.1857 -0.1804 -0.2261 -0.2307 -0.2159 -0.2334 -0.1989 -0.0472 -0.0400
[9.30] *** [8.48] *** [8.20] *** [7.67] *** [7.30] *** [6.72] *** [5.93] *** [7.73] *** [15.07] *** [12.97] ***Log of Plan Assets -0.0086 -0.0079 0.0073 0.0024 0.0014 0.0200 -0.0159 -0.0015 -0.0024
[1.58] [1.40] [0.95] [0.31] [0.18] [2.16] ** [2.46] ** [1.87] * [3.10] ***Consultant -0.0231 0.0032
[1.00] [0.07] Change in Allocation to 0.0000 0.0000 Asset Class [1.48] [1.29] Log of AUM -0.0071 -0.0071
[1.54] [1.15] Log of Fees -0.0271 -0.0287
[1.79] * [1.72] * Fixed Effects:Year? no yes yes yes yes yes yes yes yes noAsset Class? no yes yes yes yes yes yes yes no noManager? no no no no no no no no no noFund? no no no no no no no no yes noFund/Year? no no no no no no no no no yesN 113,783 113,777 113,777 63,129 35,795 29,966 17,507 54,198 113,777 113,777R-Squared 17.8% 47.0% The sample consists of yearly observations with one observation per pension plan, fund manager, year for 1995 to 2004, inclusive. Not all data is available for all variables, thus the number of observations varies slightly in each specification. Specification 8 includes only fund managers which manage assets for both corporate and public pensions. The dependent variable is a binary variable equal to 1 if a manager is not managing money for that same pension plan in that same asset class in the following year. Public Pension Dummy is a binary variable equal to 1 if the pension plan is a public entity. Log of Plan Assets is the log of the pension plan's assets. Consultant is a binary variable equal to 1 if the pension plan employed an outside investment consultant in that year. Change in Allocation to Asset Class is the difference between assets allocated by that pension plan in year t and year t-1 to the broad asset class of the money manager (data available only post 1999). Log of AUM is the log of the total assets under management of that money manager (data only available for fund managers tracked by Mobius). Log of Fees is the log of the fees charges by the fund manager for a $50 million account (data only available for fund managers tracked by Mobius). Controls in some regressions include year, broad asset class, manager, fund and fund/year fixed effects. T-statistics in italics below coefficient estimates are based on robust errors allowing for data clustering by pension plan. ***, **, * indicate statistical significance at the 1%, 5% and 10% level, respectively.

36
Table 4: Probability of Termination Controlling for Fund Performance
(1) (2) (3) (4) (5) (6) (7) (8) (9)Public Pension Dummy -0.8696 -0.9169 -0.6642 -0.8258 -0.7881 -0.8006 -0.6945 -0.7258 -0.6891
[4.80] *** [3.86] *** [3.32] *** [4.35] *** [4.15] *** [4.18] *** [3.49] *** [3.48] *** [2.02] **Fund Performance Measure:Annual Return -0.0012
[1.93] *Return less Benchmark (ADJBR) -0.0009
[1.37] Return Less Average Return of -0.0095 Benchmarks (ADJR2) [5.76] *** Naively Adjusted Return (ADJR3) -0.0027
[3.63] ***Return Less Mean Return of Mgrs. -0.0075 in that Asset Class (ADJR4) [5.88] ***Alpha vs. Fama French -0.0060 Factors (ALPHAFF) [4.67] ***Alpha vs. Benchmark (ALPHABMK) -0.0159
[7.04] ***Tracking Error vs. Benchmark 0.0028
[1.35] Mean of Rolling 12 Quarters Return -0.0199 less Benchmark (mADJBR) [2.79] ***Controls: Year Fixed Effects yes yes yes yes yes yes yes yes yes Asset Class yes yes yes yes yes yes yes yes yesN 54,178 16,420 25,680 35,495 35,782 34,600 24,826 20,068 6,680 The sample consists of yearly observations with one observation per pension plan, fund manager, year for 1995 to 2004, inclusive. Not all data is available for all variables, thus the number of observations varies slightly in each specification. The dependent variable is a binary variable equal to 1 if a manager is not managing money for that same pension plan in that same asset class in the following year. Public Pension Dummy is a binary variable equal to 1 if the pension plan is a public entity. Annual Return is the average gross return on the manager's funds in that asset class in that year. Return less Benchmark (ADJBR) is the average of the gross returns of the manager's funds in that asset class in that year less the manager selected benchmark. Return less Average Return of Benchmarks (ADJR2) is the average of the gross returns of the manager's funds in that asset class in that year less the average of comparative indices selected for that asset class by Mercer. Return less S&P500 or Risk Free (ADJR3) is the average of the gross returns of the manager's funds in that asset class in that year less the S&P 500 for any variable return fund and the return less the risk free rate for any fixed return fund. Alpha vs. Fama French Factors (ALPHAFF) is

37
Jensen's alpha with respect to the three Fama French factors using rolling 12 quarters of past return data. Alpha vs. Benchmark (ALPHABMK) is the average of Jensen's alpha with respect to the manager selected benchmark using rolling 12 quarters of past return data. Tracking Error vs. Benchmark is the tracking error relative to the manager selected benchmark. Mean of Rolling 12 Quarters Return less Benchmark (mADJBR) is the average of the mean of the quarterly return less the manager selected benchmark based on rolling 12 quarters of data. Controls in include year and broad asset class fixed effects. T-statistics in italics below coefficient estimates are based on robust errors allowing for data clustering by pension plan. ***, **, * indicate statistical significance at the 1%, 5% and 10% level, respectively.
38
Table 5: Probability of Termination -- Interactions (1) (2) (3) (4) (5) (6) (7) (8)
Dependent Variable Terminated Terminated Terminated Terminated Terminated Terminated Terminated TerminatedPublic Pension Dummy -0.6025 -0.6148 -1.1464 -1.1277 -1.2591 -0.6261 -0.6961 -0.5092
[4.25] *** [4.33] *** [5.63] *** [3.00] *** [3.24] *** [3.13] *** [3.55] *** [3.53] ***Log of Plan Assets -0.0241 -0.0229 -0.0290 -0.0319 -0.0285 -0.0193 -0.0272 -0.0274
[2.89] *** [2.67] *** [2.59] *** [2.86] *** [2.49] ** [1.69] * [2.44] ** [3.37] ***Log of Plan Assets 0.0312 0.0291 0.0626 0.0665 0.0608 0.0316 0.0395 0.0334 * Public Pension Dummy [2.87] *** [2.61] *** [4.10] *** [4.33] *** [3.88] *** [2.08] ** [2.68] *** [3.10] ***Consultant -0.0404 -0.0179
[1.43] [0.45] Consultant 0.0609 0.0595 * Public Pension Dummy [1.32] [0.89] Log of AUM -0.0125 -0.0073
[2.12] ** [1.08] Log of AUM 0.0112 0.0230 * Public Pension Dummy [1.18] [2.16] ** Log of Fees -0.0277 -0.0283
[1.52] [1.54] Log of Fees 0.0022 0.0023 * Public Pension Dummy [0.08] [0.08] ADJR2 -0.0039
[1.73] * ADJR2 -0.0046 * Public Pension Dummy [1.36] Annual Return -0.0003
[0.18] Annual Return -0.0100 * Public Pension Dummy [3.42] ***Avg. of Benchmarks 0.0026
[1.46] Avg. of Benchmarks 0.0040 * Public Pension Dummy [1.33] Final Year of CIO 0.5757
[14.88] ***Final Year of CIO -0.4237 * Public Pension Dummy [7.41] ***Controls: Year Fixed Effects yes yes yes yes yes yes yes yes Asset Class yes yes yes yes yes yes yes yesN 113,777 113,777 35,795 29,966 28,942 29,950 22,845 112,878

39
The sample consists of yearly observations with one observation per pension plan, fund manager, year for 1995 to 2004, inclusive. Not all data is available for all variables, thus the number of observations varies slightly in each specification. The dependent variable is a binary variable equal to 1 if a manager is not managing money for that same pension plan in that same asset class in the following year. Public Pension Dummy is a binary variable equal to 1 if the pension plan is a public entity. Log of Plan Assets is the log of the pension plan's assets. Consultant is a binary variable equal to 1 if the pension plan employed an outside investment consultant in that year. Change in Allocation to Asset Class is the difference between assets allocated by that pension plan in year t and year t-1 to the broad asset class of the money manager (data available only post 1999). Log of AUM is the log of the total assets under management of that money manager (data only available for fund managers tracked by Mobius). Log of Fees is the log of the fees charges by the fund manager for a $50 million account (data only available for fund managers tracked by Mobius). Return less Average Return of Benchmarks (ADJR2) is the average of the gross returns of the manager's funds in that asset class in that year less the average of comparative indices selected for that asset class by Mercer. Annual Return is the average gross return on the manager's funds in that asset class in that year. Avg. of Benchmarks is the average of comparative indices selected for that asset class by Mercer. Controls in include year and broad asset class fixed effects. T-statistics in italics below coefficient estimates are based on robust errors allowing for data clustering by pension plan. ***, **, * indicate statistical significance at the 1%, 5% and 10% level, respectively.
40
Table 6: Probability of Termination – Herding
(1) (2) (3) (4) (5) (6)Dependent Variable Terminated Terminated Terminated Terminated Terminated TerminatedPublic Pension Dummy -0.5894 -0.5428 -0.4719 -0.3534 -0.6248 -0.6192
[4.18] *** [3.91] *** [3.36] *** [2.56] ** [4.25] *** [4.20] ***Log Number of Plans -0.0550 -0.0417
[11.18] *** [6.30] ***Log Number of Plans -0.0340 * Public Pension Dummy [3.48] *** Log Number of Corporate Plans 0.0108 -0.0058
[1.19] [0.38] Log Number of Public Plans -0.0845 -0.0439
[9.27] *** [3.66] *** Log Number of Corporate Plans 0.0632 * Public Pension Dummy [3.36] *** Log Number of Public Plans -0.1579 * Public Pension Dummy [7.57] *** Change in Number of Public Plans -0.0380 -0.0288
[15.78] *** [9.64] ***Change in Number of Corporate Plans -0.0064 -0.0072
[2.52] ** [2.32] **Change in Number of Public Plans -0.0208 * Public Pension Dummy [4.35] ***Change in Number of Corporate Plans 0.0019 * Public Pension Dummy [0.42] Controls: Year Fixed Effects yes yes yes yes yes yes Asset Class yes yes yes yes yes yes Plan Assets yes yes yes yes yes yesN 113,777 113,777 113,777 113,777 98,671 98,671 The sample consists of yearly observations with one observation per pension plan, fund manager, year for 1995 to 2004, inclusive. Not all data is available for all variables, thus the number of observations varies slightly in each specification. The dependent variable is a binary variable equal to 1 if a manager is not

41
managing money for that same pension plan in that same asset class in the following year. Public Pension Dummy is a binary variable equal to 1 if the pension plan is a public entity. Log of Plan Assets is the log of the pension plan's assets. Log Number of Plans is the log of the number of pension plans in the sample who are investors in the fund manager. Log Number of Corporate Plans is the log of the number of corporate pension plans in the sample who are investors in the fund manager. Log Number of Pension Plans is the log of the number of public pension plans in the sample who are investors in the fund manager. Change in Number of Plans is the difference between the number of pension plans investing in the manager in year t less the number of plans investing in year t-1. Change in Number of Corporate Plans is the difference between the number of corporate pension plans investing in the manager in year t less the number of plans investing in year t-1. Change in Number of Public Plans is the difference between the number of public pension plans investing in the manager in year t less the number of plans investing in year t-1. Controls include year and broad asset class fixed effects as well as the log of plan assets. T-statistics in italics below coefficient estimates are based on robust errors allowing for data clustering by pension plan. ***, **, * indicate statistical significance at the 1%, 5% and 10% level, respectively.

42
Table 7: Performance of Pension Fund Managers
(1) (2) (3) (4) (5) (6)Return Less Return Less
Avg. Return of S&P500 or Return less Alpha vs. Alpha vs.Dependent Variable Annual Benchmarks Risk Free Benchmark FF Factors Benchmark
Return (ADJR2) (ADJR3) (ADJBR) (ALPHAFF) (ALPHABMK)Public Pensions Dummy -0.1462 0.0302 -0.1190 -1.0876 0.1364 -1.2203
[0.84] [0.21] [0.76] [2.24] [0.74] [1.20]Controls: Log of Plan Assets yes yes yes yes yes yesFixed Effects: Asset Class yes yes yes yes yes yes Year yes yes yes yes yes yes
R-squared 46.6% 12.5% 26.8% 3.5% 22.2% 10.0%Observations 46,851 25,279 34,932 16,115 33,693 15,347 The sample consists of yearly observations with one observation per pension plan, fund manager, year for 1995 to 2004, inclusive. Not all data is available for all variables, thus the number of observations varies slightly in each specification. The dependent variable is a measure of fund manager performance equal to one of the following: Annual Return is the average gross return on the manager's funds in that asset class in that year. Alpha vs. Benchmark (ALPHABMK) is the average of Jensen's alpha with respect to the manager selected benchmark using rolling 12 quarters of past return data. Return less Average Return of Benchmarks (ADJR2) is the average of the gross returns of the manager's funds in that asset class in that year less the average of comparative indices selected for that asset class by Mercer. Return less S&P500 or Risk Free (ADJR3) is the average of the gross returns of the manager's funds in that asset class in that year less the S&P 500 for any variable return fund and the return less the risk free rate for any fixed return fund. Return less Benchmark (ADJBR) is the average of the gross returns of the manager's funds in that asset class in that year less the manager selected benchmark. Alpha vs. Fama French Factors (ALPHAFF) is Jensen's alpha with respect to the three Fama French factors using rolling 12 quarters of past return data. The independent variable of interest is Public Pension Dummy, a binary variable equal to 1 if the pension plan is a public entity. Controls include year, broad asset class fixed effects and the log of pension plan assets. T-statistics in italics below coefficient estimates are based on robust errors allowing for data clustering by manager. ***, **, * indicate statistical significance at the 1%, 5% and 10% level, respectively.
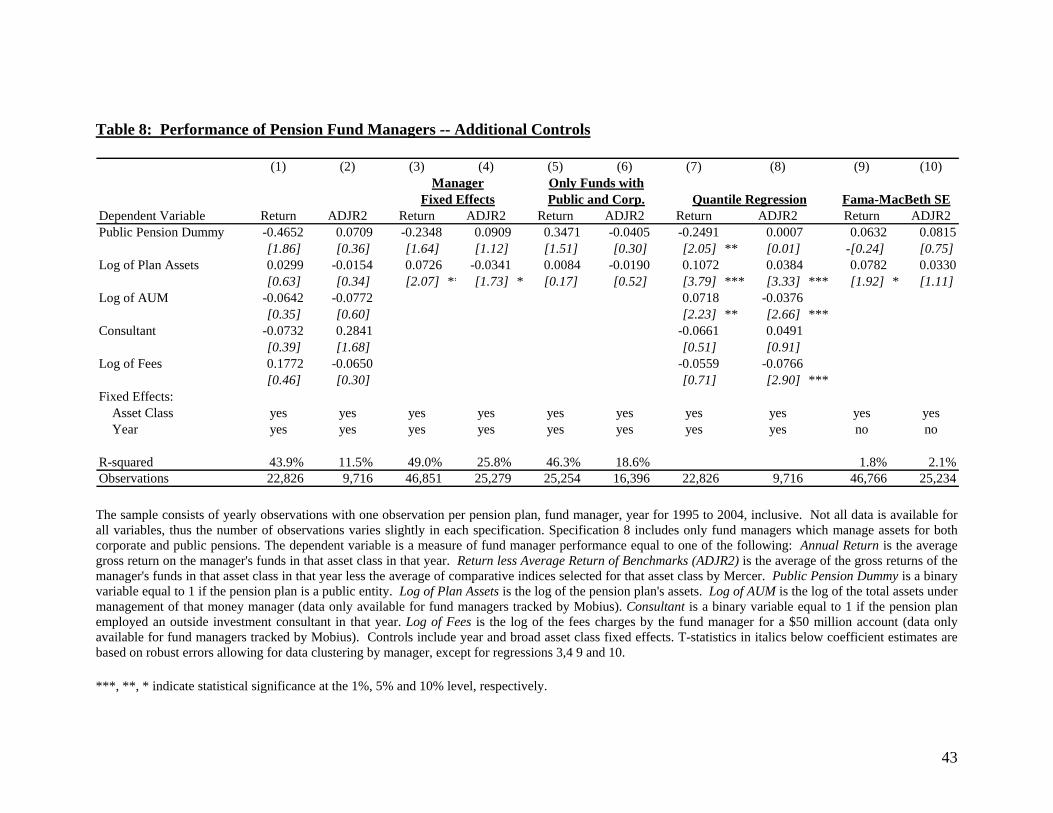
43
Table 8: Performance of Pension Fund Managers -- Additional Controls
(1) (2) (3) (4) (5) (6) (7) (8) (9) (10)Manager Only Funds with
Fixed Effects Public and Corp. Quantile Regression Fama-MacBeth SEDependent Variable Return ADJR2 Return ADJR2 Return ADJR2 Return ADJR2 Return ADJR2Public Pension Dummy -0.4652 0.0709 -0.2348 0.0909 0.3471 -0.0405 -0.2491 0.0007 0.0632 0.0815
[1.86] [0.36] [1.64] [1.12] [1.51] [0.30] [2.05] ** [0.01] -[0.24] [0.75]Log of Plan Assets 0.0299 -0.0154 0.0726 -0.0341 0.0084 -0.0190 0.1072 0.0384 0.0782 0.0330
[0.63] [0.34] [2.07] ** [1.73] * [0.17] [0.52] [3.79] *** [3.33] *** [1.92] * [1.11]Log of AUM -0.0642 -0.0772 0.0718 -0.0376
[0.35] [0.60] [2.23] ** [2.66] ***Consultant -0.0732 0.2841 -0.0661 0.0491
[0.39] [1.68] [0.51] [0.91] Log of Fees 0.1772 -0.0650 -0.0559 -0.0766
[0.46] [0.30] [0.71] [2.90] ***Fixed Effects: Asset Class yes yes yes yes yes yes yes yes yes yes Year yes yes yes yes yes yes yes yes no no
R-squared 43.9% 11.5% 49.0% 25.8% 46.3% 18.6% 1.8% 2.1%Observations 22,826 9,716 46,851 25,279 25,254 16,396 22,826 9,716 46,766 25,234 The sample consists of yearly observations with one observation per pension plan, fund manager, year for 1995 to 2004, inclusive. Not all data is available for all variables, thus the number of observations varies slightly in each specification. Specification 8 includes only fund managers which manage assets for both corporate and public pensions. The dependent variable is a measure of fund manager performance equal to one of the following: Annual Return is the average gross return on the manager's funds in that asset class in that year. Return less Average Return of Benchmarks (ADJR2) is the average of the gross returns of the manager's funds in that asset class in that year less the average of comparative indices selected for that asset class by Mercer. Public Pension Dummy is a binary variable equal to 1 if the pension plan is a public entity. Log of Plan Assets is the log of the pension plan's assets. Log of AUM is the log of the total assets under management of that money manager (data only available for fund managers tracked by Mobius). Consultant is a binary variable equal to 1 if the pension plan employed an outside investment consultant in that year. Log of Fees is the log of the fees charges by the fund manager for a $50 million account (data only available for fund managers tracked by Mobius). Controls include year and broad asset class fixed effects. T-statistics in italics below coefficient estimates are based on robust errors allowing for data clustering by manager, except for regressions 3,4 9 and 10. ***, **, * indicate statistical significance at the 1%, 5% and 10% level, respectively.

44
Table 9: CIO Incentives -- Likelihood of Changing Jobs
(1) (2) (3) (4) (5)Dependent Variable Separation Separation Separation Fired1 Fired2Public Pension Dummy -0.2258 -0.2316 -0.2821 -0.2742 -0.2402
[9.03] *** [9.13] *** [10.36] *** [9.43] *** [8.53] ***Log of Plan Assets 0.0078 -0.0108 -0.0680 -0.0300
[1.31] [1.60] [9.13] *** [4.29] ***Controls: Year Fixed Effects no no yes yes yes
N 21,010 20,993 18,309 18,536 18,536 The sample consists of yearly observations with one observation per pension plan, year for 1995 to 2004, inclusive. The dependent variable is either: Separation, a binary variable equal to 1 if a CIO is no longer listed as the primary decision maker for that same pension plan in the following year, Fired1, a binary variable equal to 1 if a CIO is no longer listed as the primary decision maker for that same pension plan in the following year and the gross change in pension plan assets was negative or Fired2, a binary variable equal to 1 if a CIO is no longer listed as the primary decision maker for that same pension plan in the following year and the gross change in pension plan assets was below the median change in gross pension assets. Public Pension Dummy is a binary variable equal to 1 if the pension plan is a public entity. Log of Plan Assets is the log of the pension plan's assets. Controls include year fixed effects. T-statistics in italics below coefficient estimates are based on robust errors allowing for data clustering by pension plan. ***, **, * indicate statistical significance at the 1%, 5% and 10% level, respectively.

45
Appendix I: Asset Categories MMD Asset Categories Mercer Asset Categories Cash & Short Term Investments Hedge Funds Asia Ex Japan Equity Fixed Return Company Stock Asian Fixed Income Core Fixed Income Leveraged Buyouts Emerging Market Debt Core PLUS Fixed Income Managed Futures Emerging Markets Equity Corporate Bonds Other Europe inc UK Equity US Government Bonds Alternative Investment Europe inc UKEquitySmallCap Municipal Bonds Balanced Funds Global Equity High Yield Tactical Asset Allocation Global Fixed Hedged European Fixed Income Participant Loans Global Fixed Unhedged Japanese Fixed Income Global TAA Asian / Pacific Rim Fixed Income International Equity Latin America Fixed Income International Equity SmallCap Other International Fixed Income International Fixed Hedged Global Fixed Income International Fixed Unhedged Indexed Bonds Japanese Equity Emerging Markets Bonds Pacific ex Japan Equity Bonds (unspecified) Pacific inc Japan Equity GIC / BICs US Balanced Synthetic GICs US Balanced Tactical Allocation Mortgages US Convertible Composites Mortgage Securities US Equity Large Cap Core Convertibles US Equity Large Cap Equity Fixed Private Placements US Equity Large Cap Growth General Insurance Account US Equity Large Cap Value Variable Return US Equity Mid Cap Micro Cap Equities US Equity Mid Cap Core Small Cap Equities US Equity Mid Cap Growth Small Cap Growth US Equity Small and Mid Small Cap Value US Equity Small and Mid Core Mid Cap Equities US Equity Small and Mid Growth Mid Cap Growth US Equity Small Cap Core Mid Cap Value US Equity Small Cap Micro Large Cap Equities US Equity SMID Growth Large Cap Growth US Equity SMID Large Cap Value US Equity SMID Value Growth Equities US Equity Value Value Equities US Fixed 1 to 3 Years Core Diversified Equities US Fixed Combined Indexed Equities US Fixed Core Enhanced Indexed Equities US Fixed Core Investment Grade Real Estate Equity US Fixed Core Opportunistic REITS US Fixed High Yield Private Placements (variable) US Fixed Intermediate European Equities US Fixed Long Duration Japanese Equities US Fixed Mortgage Backed Asian / Pacific Rim Equities Latin American Equities EAFE Other International Equities Global Equities Emerging markets Equities Equities (unspecified) Venture Capital Oil & Gas Investments Mutual funds Private Equity

46
References Bertrand, Marianne and Sendhil Mullainathan. "Enjoying the Quiet Life? Corporate Governance and Managerial Preferences" Journal of Political Economy, vol. 111, no. 5, October 2003, pp. 1043-75 Busse, Jeff, Amit Goyal and Sunil Wahal, "Performance Persistence in Institutional Investment Management" Unpublished Working Paper, November 2005. Chan, Louis, Stephen Dimmock and Josef Lakonishok, "Benchmarking Money Manager Performance: Issues and Evidence." NBER Working Paper 12461, August 2006. Chevalier, Judith and Glenn Ellison. "Career Concerns of Mutual Fund Managers," Quarterly Journal of Economics, vol. 114, no. 2, May 1999, pp. 389-432 Christopherson, Jon, Wayne Ferson, and Debra Glassman, Conditioning manager alphas on economic information: Another look at the persistence of performance, Review of Financial Studies 11, 111142, 1998. Coggin, T Daniel, Frank Fabozzi and Shafiqur Rahman, "The Investment Performance of US Equity Pension Fund Managers: An Empirical Investigation" Journal of Finance, 1993 (3), July, 1039-55. Coggin, T Daniel, and Charles Trzcinka. "A Panel Study of US Equity Pension Funds Manager Style Performance" The Journal of Investing Summer 2000, p. 6-12 Diamond, Douglas W. and Philip H. Dybvig, "Bank runs, deposit insurance, and liquidity", Journal of Political Economy 91, no. 3, 401-419, 1983. Goyal, Amit and Sunil Wahal, "The Selection and Termination of Investment Managers by Plan Sponsors," Unpublished Working Paper, 2005. Hess, David and Gregorio Impavido, "Governance of Public Pension Funds: Lessons from Corporate Governance and International Evidence" World Bank Policy Research Working Paper 3110, August 2003. Holmstrom, Bengt, "Managerial Incentive Problems – A Dynamic Perspective" Essays in Economics and Management in Honor of Lars Wahlbeck, Helsinki: Swedish School of Economics 1982. Lakonishok, Joseph, Andrei Shleifer and Robert Vishny, "The Structure and Performance of the Money Management Industry" Brookings Papers on Economic Activity: Microeconomics, 339-91. 1992 Lakonishok, Josef, Andrei Shleifer, Richard Thaler and Robert Vishny. "Window Dressing by Pension Fund Managers" American Economic Review. Vol. 81 (2). p 227-31. May 1991

47
Lakonishok, Josef, Andrei Shleifer, and Robert Vishny, 1992, "The Structure and Performance of the Money Management Industry," Brookings Papers: Microeconomics, 339-391. Lerner, Josh, Antoinette Schoar and Wan Wong “Smart Institutions, Foolish Choices?: The Limited Partner Performance Puzzle”, Journal of Finance, forthcoming. Earlier version distributed as National Bureau of Economic Research Working Paper No. 11136. Murphy, Kevin and Karen Van Nuys. "Governance, Behavior and Performance of State and Corporate Pension Funds" Working Paper, September, 1994.