timing of subsurface heat magnitude for the growth of...
TRANSCRIPT

Timing of subsurface heat magnitudefor the growth of El Niño eventsJoan Ballester1,2,3 , Desislava Petrova1,3, Simona Bordoni2 , Ben Cash4 , and Xavier Rodó1,3,5
1Climate and Health Program, Barcelona Institute for Global Health (ISGlobal), Barcelona, Spain, 2California Institute ofTechnology (Caltech), Pasadena, California, USA, 3Institut Català de Ciències del Clima (IC3), Barcelona, Spain, 4Center forOcean–Land–Atmosphere Studies, George Mason University, Fairfax, Virginia, USA, 5Institució Catalana de Recerca i EstudisAvançats, Barcelona, Spain
Abstract The subsurface heat buildup in the western tropical Pacific and the recharge phase in equatorialheat content are intrinsic elements of El Niño–Southern Oscillation, leading to changes in zonal wind stress,sea surface temperature, and thermocline tilt that characterize the growing andmature phases of El Niño (EN)events. Here we use numerical simulations to study the impact on subsequent EN episodes of a suddenincrease or decrease in ocean heat content during the recharge phase and compare results with previousstudies in which this perturbation is prescribed earlier during the tilting mode. We found that while notsubstantially affected by the phase at which a sudden rise in heat content is prescribed, the timing andmagnitude of the events are very sensitive to the phase at which a major decrease is imposed. The differentresponse to the phase of increases and decreases substantiates the importance of nonlinear subsurfaceocean dynamics to the onset and growth of EN episodes and provides insight into the irreversibility of theevents at different stages of the oscillation.
1. Introduction
El Niño–Southern Oscillation (ENSO) is the dominant variability mode at interannual timescales [Wang andPicaut, 2004], a primary source of seasonal-to-interannual climate predictability [Chen et al., 2004; Izumoet al., 2010; Barnston et al., 2012; Petrova et al., 2016], and a key factor explaining large-scale teleconnections[Ballester et al., 2011] with global impacts [Ballester et al., 2013, 2016a]. The dynamics of ENSO arise from acomplex interaction between the atmosphere and the ocean in the tropical Pacific [Bjerknes, 1969;McPhaden et al., 2006], involving upper and lower level atmospheric winds, ocean waves traveling alongthe equatorial thermocline, zonal redistribution of surface and subsurface ocean temperatures, and meridio-nal recharge or discharge of the tropical ocean heat content [Suarez and Schopf, 1988; Jin, 1997; Picaut et al.,1997; Weisberg and Wang, 1997; Fedorov et al., 2015].
ENSO is typically characterized by its two main opposite phases, El Niño (EN) and La Niña (LN), which definean anomalous warming or cooling of sea surface temperatures (SSTs) in the central and eastern tropicalPacific, respectively. EN (LN) is always preceded by a meridional recharge (discharge) of basin-wide tropicalocean heat content about two to three seasons in advance, which deepens (shoals) the whole equatorialthermocline and warms (cools) the ocean subsurface at about 100 to 150 m depth [Meinen and McPhaden,2000; Ramesh and Murtugudde, 2013]. This phase is in turn typically led by the tiltingmode, a maximum (mini-mum) in the slope of the equatorial thermocline explained by the strengthening (weakening) of the equator-ial trade winds and the subsequent anomalous downwelling (upwelling) of surface warm (subsurface cold)waters in the western Pacific warm pool [Wyrtki, 1985; Ballester et al., 2015].
The leading paradigm explaining the oscillatory nature of ENSO, the recharge oscillator, emphasizes thedelayed effect of the enhancement (weakening) of the equatorial trade winds that precedes the recharge(discharge) phase. Thus, the off-equatorial wind stress curl controls the change rate in equatorward subsur-face convergence (divergence) of water masses in the central Pacific, and therefore the tendency toward thedeepening (shoaling) of the thermocline [Jin, 1997]. Once the equatorial trade winds return to their climato-logical values, westerly (easterly) wind bursts can occur and trigger eastward traveling downwelling (upwel-ling) Kelvin waves that deepen (shoal) the thermocline in the eastern Pacific, suppress (enhance) the coastalupwelling there, and activate the growth of an EN (LN) event [Ballester et al., 2016b]. This succession of phasesis, however, subject to sources of irregularity, so that it is nowadays widely accepted that ENSO is a slightlydamped periodic oscillation modulated by stochastic noise [Kessler, 2002].
BALLESTER ET AL. HEAT BUILDUP AND GROWTH OF EL NIÑO 8501
PUBLICATIONSGeophysical Research Letters
RESEARCH LETTER10.1002/2017GL074557
Key Points:• The timing and magnitude of eventslargely depend on the phase ofdischarges
• Events are not substantially affectedby the timing of a sudden recharge
• Simulations are used to analyze theunexpected behavior of recent ENevents
Supporting Information:• Supporting Information S1
Correspondence to:J. Ballester,[email protected]
Citation:Ballester, J., D. Petrova, S. Bordoni,B. Cash, and X. Rodó (2017), Timing ofsubsurface heat magnitude for thegrowth of El Niño events, Geophys. Res.Lett., 44, 8501–8509, doi:10.1002/2017GL074557.
Received 14 JUN 2017Accepted 30 JUL 2017Accepted article online 3 AUG 2017Published online 19 AUG 2017
©2017. American Geophysical Union.All Rights Reserved.
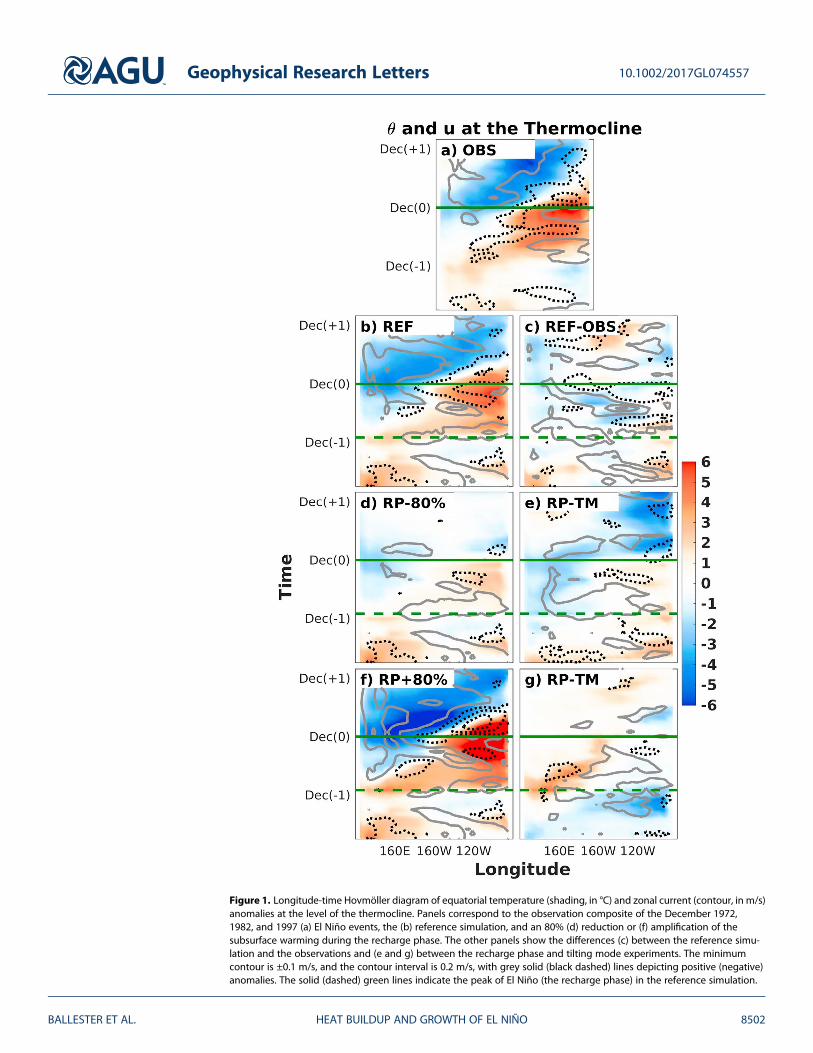
Figure 1. Longitude-time Hovmöller diagram of equatorial temperature (shading, in °C) and zonal current (contour, in m/s)anomalies at the level of the thermocline. Panels correspond to the observation composite of the December 1972,1982, and 1997 (a) El Niño events, the (b) reference simulation, and an 80% (d) reduction or (f) amplification of thesubsurface warming during the recharge phase. The other panels show the differences (c) between the reference simu-lation and the observations and (e and g) between the recharge phase and tilting mode experiments. The minimumcontour is ±0.1 m/s, and the contour interval is 0.2 m/s, with grey solid (black dashed) lines depicting positive (negative)anomalies. The solid (dashed) green lines indicate the peak of El Niño (the recharge phase) in the reference simulation.
Geophysical Research Letters 10.1002/2017GL074557
BALLESTER ET AL. HEAT BUILDUP AND GROWTH OF EL NIÑO 8502
Ballester et al. [2016c] recently studied the sensitivity of EN to a rise or fall in ocean heat content 21 monthsearlier by means of an ensemble of numerical simulations. These experiments showed that basin-wide uni-form warm equatorial SSTs follow a major increase in heat content, which favor the occurrence of a verystrong EN event 1 year later. The simulations also showed that the heat content of the system is naturallyrestored after an initial major decrease; the resulting EN event is, however, delayed by up to 1 year. In thepresent study, we extend this analysis with a new set of numerical experiments, in which we use exactlythe same methodology, but initial conditions are modified at a later stage of the onset of EN. More specifi-cally, we compare these two families of simulations with the aim of identifying the dynamical mechanismsthat explain how differences in the lead time of a sudden rise or fall in heat content affect subsequentEN events.
2. Methods
Themodel used here is the Community Earth SystemModel (CESM) v1.2 [Hurrell et al., 2013]. The atmosphericcomponent has a resolution of 2.5° in longitude and 1.875° in latitude, with 30 vertical levels. The oceanmodel uses a displaced pole grid with approximately 1° resolution in longitude and 0.5° in latitude, whichis refined within the tropical band up to 0.25° at the equator. There are 60 vertical levels, with vertical resolu-tion decreasing from 10 m in the upper 150 m to 250 m in the deep ocean.
An EN episode with the samemagnitude as the recent 2015/2016 event (i.e., Niño3.4 Index = +2.8°C) was cho-sen from a reference (REF) 100 year spin-up simulation, which is validated against the composite of the1972/1973 (+2.5°C), 1982/1983 (+2.6°C), and 1997/1998 (+2.7°C) EN events in the ORAS4 [Balmaseda et al.,2013] and National Centers for Environmental Prediction/National Center for Atmospheric Research[Kalnay et al., 1996] reanalyses (here referred to as observational composite, and labeled as OBS).
We describe a new family of ensemble experiments with initial conditions corresponding to a lead timeof 11 months before the December peak of this event (i.e., 1 January of year 0) and compare the results witha family initialized 10 months earlier (i.e., 1 March of year !1, simulations reported in Ballester et al. [2016c]).We note that these stages of the episode correspond to an early phase of the basin-wide deepening of thethermocline (referred here to as RP, standing for Recharge Phase) and the maximum in the slope of the equa-torial thermocline (TM for Tilting Mode), respectively.
In each of these families, the intensity of the initial subsurface warm anomaly was decreased (negative sign)or increased (positive sign). The warm temperature anomalies were fully modified only in the inner three-dimensional box [120°E–80°W] × [10°S–10°N] × [50–200 m], and this modification was linearly decreasedto zero from the border of this inner box to the frontier of the outer box [100°E–60°W] × [15°S–15°N] × [20–300 m]. Each set of experiments in turn consists of 10 simulations with slightly perturbedinitial conditions.
3. Results
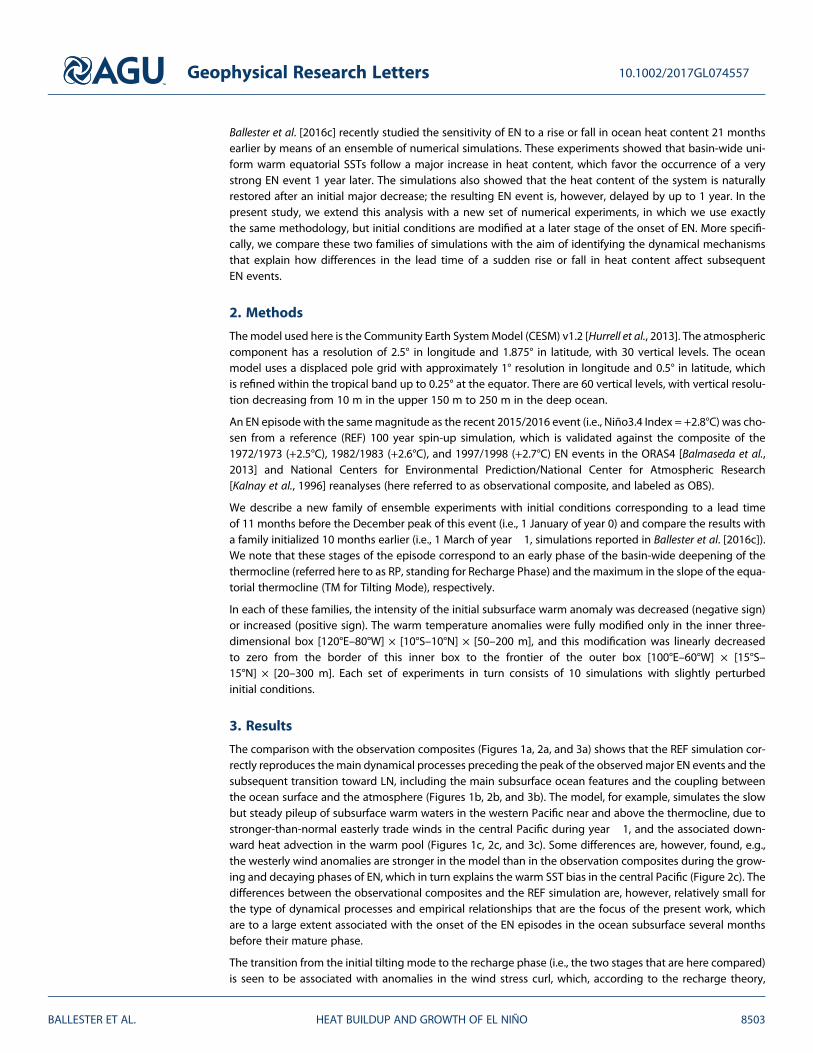
The comparison with the observation composites (Figures 1a, 2a, and 3a) shows that the REF simulation cor-rectly reproduces themain dynamical processes preceding the peak of the observedmajor EN events and thesubsequent transition toward LN, including the main subsurface ocean features and the coupling betweenthe ocean surface and the atmosphere (Figures 1b, 2b, and 3b). The model, for example, simulates the slowbut steady pileup of subsurface warm waters in the western Pacific near and above the thermocline, due tostronger-than-normal easterly trade winds in the central Pacific during year !1, and the associated down-ward heat advection in the warm pool (Figures 1c, 2c, and 3c). Some differences are, however, found, e.g.,the westerly wind anomalies are stronger in the model than in the observation composites during the grow-ing and decaying phases of EN, which in turn explains the warm SST bias in the central Pacific (Figure 2c). Thedifferences between the observational composites and the REF simulation are, however, relatively small forthe type of dynamical processes and empirical relationships that are the focus of the present work, whichare to a large extent associated with the onset of the EN episodes in the ocean subsurface several monthsbefore their mature phase.
The transition from the initial tilting mode to the recharge phase (i.e., the two stages that are here compared)is seen to be associated with anomalies in the wind stress curl, which, according to the recharge theory,
Geophysical Research Letters 10.1002/2017GL074557
BALLESTER ET AL. HEAT BUILDUP AND GROWTH OF EL NIÑO 8503
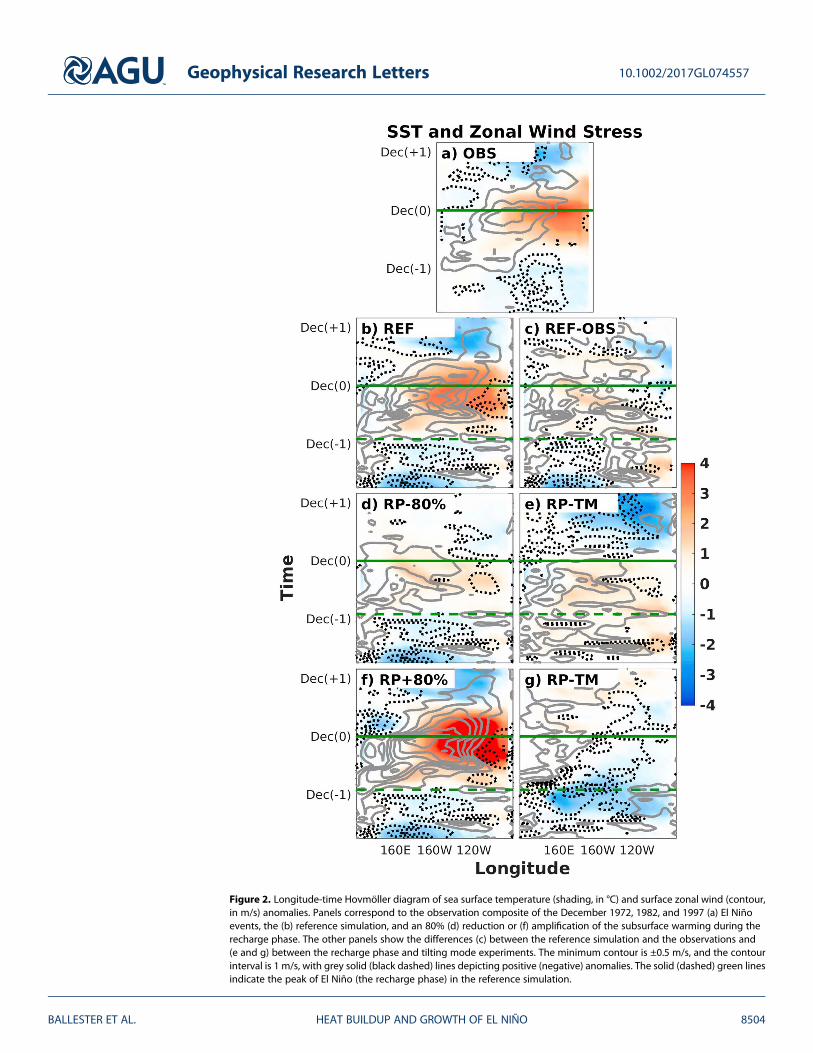
Figure 2. Longitude-time Hovmöller diagram of sea surface temperature (shading, in °C) and surface zonal wind (contour,in m/s) anomalies. Panels correspond to the observation composite of the December 1972, 1982, and 1997 (a) El Niñoevents, the (b) reference simulation, and an 80% (d) reduction or (f) amplification of the subsurface warming during therecharge phase. The other panels show the differences (c) between the reference simulation and the observations and(e and g) between the recharge phase and tilting mode experiments. The minimum contour is ±0.5 m/s, and the contourinterval is 1 m/s, with grey solid (black dashed) lines depicting positive (negative) anomalies. The solid (dashed) green linesindicate the peak of El Niño (the recharge phase) in the reference simulation.
Geophysical Research Letters 10.1002/2017GL074557
BALLESTER ET AL. HEAT BUILDUP AND GROWTH OF EL NIÑO 8504

Figure 3. Longitude-time Hovmöller diagram of sea surface height (shading, in cm) and surface zonal current (contour, inm/s) anomalies. Panels correspond to the observation composite of the December 1972, 1982, and 1997 (a) El Niñoevents, the (b) reference simulation, and an 80% (d) reduction or (f) amplification of the subsurface warming during therecharge phase. The other panels show the differences (c) between the reference simulation and the observations and(e and g) between the recharge phase and tilting mode experiments. The minimum contour is ±0.1 m/s, and the contourinterval is 0.2 m/s, with grey solid (black dashed) lines depicting positive (negative) anomalies. The solid (dashed) greenlines indicate the peak of El Niño (the recharge phase) in the reference simulation.
Geophysical Research Letters 10.1002/2017GL074557
BALLESTER ET AL. HEAT BUILDUP AND GROWTH OF EL NIÑO 8505

generates equatorward subsurfaceconvergence of water masses inthe central Pacific, and thereforethe tendency toward the overalldeepening of the thermocline [Jin,1997]. Figure 4 shows that the inter-hemispheric difference (NorthernHemisphere minus SouthernHemisphere) of the tropical windstress curl is negative throughoutyear !1 in the whole basin, as wellas in the central and eastern Pacificduring the stages of largest warm-ing rate in year 0. Ballester et al.[2016b] showed that a fractionof this subsurface warming is addi-tionally explained by zonal and ver-tical advection of heat along thesubsurface currents near the tiltedthermocline. We note that positiveanomalies in interhemispheric windstress curl difference also coincidewith the eastward propagating sub-surface cooling tendency and theassociated transition towards LNconditions in year +1 [McGregoret al., 2012].
In agreement with the observational composites, the initial conditions in the RP experiments were prescribedat the beginning of the last month in which the ocean surface and the atmosphere are in a neutral phase inthe REF simulation (e.g., last month with slightly negative values of the Niño3.4 Index; Figure S1b in the sup-porting information). Just a few months later, in early spring of year 0, the first strong westerly wind anoma-lies develop in the warm pool (dashed green line in Figure 2b): as a result, the downwelling Kelvin waves startto cross the basin (Figure 3b) and the accumulated subsurface heat reaches the eastern Pacific (Figure 1b).The timely prescription of subsurface heat content anomalies in the RP experiment just before the activationof the Bjerknes feedback is therefore designed to provide some insight into the irreversibility of the EN eventat this advanced stage of the oscillation.
A sudden reduction of 80% in the heat content stored in the ocean subsurface during the recharge phase (i.e.,experiment RP-80%) does not significantly modify the dynamical mechanisms that precede the peak of theepisode in the REF simulation (Figures 1d, 2d, 3d, and S1). As a result, the timing of the subsequent EN eventremains essentially unaffected, and the anomaly of the Niño3.4 Index reaches +1.15°C, which represents anearly proportional relative decrease of about 60%. The maximum in westerly wind and SST anomalies is,however, found to occur earlier, in August of year 0, so that the heat content in the basin is completely dis-charged by the end of the year and the Niño3.4 Index returns to values close to 0 in March of year +1. The fastand early termination of the event generates very weak cold subsurface temperature anomalies and no rein-forcement of the trade winds in the warm pool, which explains the lack of a LN event by the end of year +1.
The dynamics of ENSO in the RP-80% experiment are completely different from those resulting from theensemble of simulations in which the same fraction of the heat content is removed during the tilting mode10months earlier (i.e., TM-80%). Ballester et al. [2016c] showed that in these runs a weak LN event develops atthe end of year !1, which reactivates the generation of the subsurface heat buildup in the western Pacificand leads to a strong EN episode that peaks in December of year +1 (Niño3.4 Index = +2°C). Differencesbetween both cases therefore highlight the importance of the timing of the prescribed decrease in heat con-tent (Figures 1e, 2e, and 3e). When this reduction occurs during the tilting mode, the system is forced to takea step back and restore the heat content; if the decrease occurs just before the maximum of the recharge
Figure 4. Longitude-time Hovmöller diagram of anomalies in equatorialtemperature tendency at the level of the thermocline (shading, in °C/yr)and the interhemispheric difference in wind stress curl between [0,20°N] and[20°S,0] (contour, in N/m3). The panel corresponds to the observationcomposite of the December 1972, 1982, and 1997 El Niño events. Theminimum contour is ±0.5·10!8 N/m3, and the contour interval is 10!8 N/m3,with grey solid (black dashed) lines depicting positive (negative) anomalies.The solid green line indicates the peak of El Niño.
Geophysical Research Letters 10.1002/2017GL074557
BALLESTER ET AL. HEAT BUILDUP AND GROWTH OF EL NIÑO 8506

phase, the system is at a point of no return in which the remaining heat is immediately released to the easternPacific, leading to a weak EN event. Differences in the timing of the initial reduction in heat content and theeventual occurrence of a restoring process have a substantial effect on the magnitude of the subsequent ENevent, with the event occurring with 1 year of delay in TM-80% and being almost twice as large than the onein RP-80%.
The response of the coupled ocean-atmosphere system to a sudden amplification of 80% in the heat contentduring the recharge phase (i.e., experiment RP + 80%) is immediate, with the excess heat being released aseastward traveling downwelling Kelvin waves and leading to an event of very strongmagnitude at the end ofthe year (Niño3.4 Index = +4°C; Figures 1f, 2f, 3f, and S1). A similar immediate release of the excess heat wasdescribed in Ballester et al. [2016c] for the TM + 80% experiment 10 months earlier, but in that case, the sur-face warming at the end of year!1 was found to be uniformly distributed along the equatorial Pacific. Underthese conditions, the Bjerknes feedback cannot be activated, and therefore, the initial warming only repre-sents a transition step toward a very strong EN episode of similar magnitude 1 year later. For this reason, evenif there are important differences in the involved dynamical mechanisms, anomalies in atmospheric winds,heat content and surface, and subsurface temperatures and currents are relatively similar between the twoexperiments (Figures 1g, 2g, and 3g).
4. Discussion and Summary
Previous studies have argued that there exists a boreal winter barrier in equatorial Pacific upper ocean heatcontent predictability due to a seasonal minimum in overall variability [Balmaseda et al., 1995; McPhaden,2003], in addition to the well-known boreal spring barrier in atmosphere and surface ocean ENSO predictabil-ity. As a result of this boreal winter barrier, equatorial Pacific upper ocean heat content anomalies in borealautumn and early winter (i.e., September to January) do not necessarily persist until the following winter sea-son, while anomalies that exist in late boreal winter and spring (i.e., February to May) tend to persist for thenext two to three seasons [McPhaden, 2003]. Because of this, equatorial heat content anomalies in borealautumn and early winter are not necessarily associated with ENSO events the following year. We have herechosen January of year 0 as a particularly relevant time of the year to prescribe a sudden change in heatcontent, in order to test the inertia of the oscillation to perturbations in the evolution of subsurface tempera-tures. On the one hand, it follows the boreal winter barrier in equatorial Pacific upper ocean heat content pre-dictability, whose role can be evaluated through the analysis of the differences between the TM and RPexperiments. On the other hand, it precedes the boreal spring barrier in atmosphere and surface oceanENSO predictability, and therefore, it provides information about the irreversibility of the coupled ocean-atmosphere system.
A sudden increase or decrease in heat content can indeed occur at any time of the year, regardless of thephase of the ENSO oscillation. For example, Hu and Fedorov [2016] showed that a fast increase in heat contentfollowed the January-to-March 2014 westerly wind bursts in the western Pacific, and a major decreaseoccurred immediately after the unusually strong basin-wide easterly wind burst in June 2014. These changeswere relatively fast given that wind bursts generated Kelvin and Rossby waves that modified the depth of thethermocline as they were traveling along the zonal axis. This type of increase (decrease) in heat contentis different from the meridional recharge (discharge) occurring during the mature phase of LN (EN).According to the recharge theory [Jin, 1997], the off-equatorial wind stress curl determines the tendencytoward equatorward mass convergence (poleward mass divergence), and therefore the recharge (discharge)in tropical heat content through the meridional displacement of water masses. In this case, however, giventhat only the tendency is determined by winds, this process is relatively slower.
The present work highlights the asymmetry between the impact of a sudden increase or decrease in oceanheat content on subsequent EN events. We find that the timing and magnitude of the episodes are not sub-stantially affected by the phase at which a sudden rise is prescribed: (1) TM + 80%: peak in year 0,Niño3.4 = +4°C; (2) RP + 80%: peak in year 0, Niño3.4 = +4°C.
In this regard, even if there are substantial differences in the mechanisms involved, EN events are seen to beindependent from the timing of a sudden subsurface heat content reinforcement, given that the largerwarming rate in the RP + 80% experiment quickly transforms the subsurface heat content into surface tem-perature anomalies. This result provides support to the hypothesis that the transition from the tiltingmode to
Geophysical Research Letters 10.1002/2017GL074557
BALLESTER ET AL. HEAT BUILDUP AND GROWTH OF EL NIÑO 8507

the recharge phase is a necessary step for the onset of EN events [Meinen and McPhaden, 2000] and that itcannot be fastened or bypassed by suddenly increasing the heat content in the western Pacific or in thewhole basin. In contrast, the timing and magnitude of EN episodes are substantially affected by the phaseat which a large decrease in heat content is prescribed, given that the restoring process reinforcing the heatcontent and delaying the event by 1 year only takes place when heat is largely removed during the tiltingmode: (1) TM-80%: peak in year 1, Niño3.4 = +2°C; (2) RP-80%: peak in year 0, Niño3.4 = +1.15°C. No suchbehavior is instead seen if the decrease occurs later during the recharge phase.
The asymmetry in the response to the increased and decreased heat content scenarios is explained by thedirect relationship between the wind power (i.e., zonal wind stress acting on the kinetic energy of surface cur-rents) and the buoyancy power (i.e., anomalous tilt of the equatorial thermocline sustained by the kineticenergy of the ocean currents [Brown et al., 2011]). In the initially increased experiments, the additional heatis rapidly released regardless of the phase of the oscillation in which it is prescribed, because the unmodifiedtrade winds cannot sustain the anomalous slope of the thermocline resulting from the superimposed heatcontent. Instead, in the initially decreased experiments, the unmodified winds can sustain and eventuallyreinforce the imposed more stable flatter slope of the thermocline. In this case, the response of the coupledocean-atmosphere system indeed depends on the stage of the oscillation (i.e., state of the thermocline) inwhich the anomalous heat content is decreased.
ReferencesBallester, J., M. A. Rodríguez-Arias, and X. Rodó (2011), A new extratropical tracer describing the role of the western Pacific in the onset of
El Niño: Implications for ENSO understanding and forecasting, J. Clim., 24, 1425–1437.Ballester, J., J. C. Burns, D. Cayan, Y. Nakamura, R. Uehara, and X. Rodó (2013), Kawasaki disease and ENSO-driven wind circulation,
Geophys. Res. Lett., 40, 2284–2289, doi:10.1002/grl.50388.Ballester, J., S. Bordoni, D. Petrova, and X. Rodó (2015), On the dynamical mechanisms explaining the western Pacific subsurface temperature
buildup leading to ENSO events, Geophys. Res. Lett., 42, 2961–2967, doi:10.1002/2015GL063701.Ballester, J., S. Bordoni, D. Petrova, and X. Rodó (2016a), Heat advection processes leading to El Niño events as depicted by an ensemble of
ocean assimilation products, J. Geophys. Res. Oceans, 121, 3710–3729, doi:10.1002/2016JC011718.Ballester, J., R. Lowe, P. Diggle, and X. Rodó (2016b), Modelling and prediction of climate and health impacts: Challenges and opportunities,
Ann. N.Y. Acad. Sci., doi:10.1111/nyas.13129.Ballester, J., D. Petrova, S. Bordoni, B. Cash, M. García-Díez, and X. Rodó (2016c), Sensitivity of El Niño intensity and timing to preceding
subsurface heat magnitude, Sci. Rep., 6 36344.Balmaseda, M. A., M. K. Davey, and D. L. T. Anderson (1995), Decadal and seasonal dependence of ENSO prediction skill, J. Clim., 8,
2705–2715.Balmaseda, M. A., K. Mogensen, and A. T. Weaver (2013), Evaluation of the ECMWF ocean reanalysis system ORAS4, Q. J. R. Meteorol. Soc., 139,
1132–1161.Barnston, A. G., M. K. Tippett, M. L. L’Heureux, S. Li, and D. G. DeWitt (2012), Skill of real-time seasonal ENSO model predictions during
2002–11: Is our capability increasing?, Bull. Am. Meteorol. Soc., 93, 631–651.Bjerknes, J. (1969), Atmospheric teleconnections from the equatorial Pacific, Mon. Weather Rev., 97, 163–172.Brown, J. N., A. V. Fedorov, and E. Guilyardi (2011), How well do coupled models replicate ocean energetics relevant to ENSO?, Clim. Dyn., 36,
2147–2158.Chen, D., M. A. Cane, A. Kaplan, S. E. Zebiak, and D. Huang (2004), Predictability of El Niño over the past 148 years, Nature, 428, 733–736.Fedorov, A. V., S. Hu, M. Lengaigne, and E. Guilyardi (2015), The impact of westerly wind bursts and ocean initial state on the development,
and diversity of El Niño events, Clim. Dyn., 44, 1381–1401.Jin, F. F. (1997), An equatorial ocean recharge paradigm for ENSO. Part I: Conceptual model, J. Atmos. Sci., 54, 811–829, doi:10.1175/
1520-0469(1997)054<0811:AEORPF>2.0.CO;2.Hu, S., and A. V. Fedorov (2016), Exceptionally strong easterly wind burst stalling El Niño of 2014, Proc. Nat. Acad. Sci. U.S.A., doi:10.1073/
pnas.1514182113.Hurrell, J. W., et al. (2013), The community earth system model: A framework for collaborative research, Bull. Am. Meteorol. Soc., 94,
1339–1360.Izumo, T., J. Vialard, M. Lengaigne, M. C. de Boyer, S. K. Behera, J. J. Luo, S. Cravatte, S. Masson, and T. Yamagata (2010), Influence of the state
of the Indian Ocean Dipole on the following year’s El Niño, Nat. Geosci., 3, 168–172.Kalnay, E., et al. (1996), The NCEP/NCAR 40-year reanalysis project, Bull. Am. Meteorol. Soc., 77, 437.Kessler, W. S. (2002), Is ENSO a cycle or a series of events?, Geophys. Res. Lett., 29(23), 2125, doi:10.1029/2002GL015924.McGregor, S., A. Timmermann, N. Shneider, M. Stuecker, and M. England (2012), The effect of the South Pacific convergence zone on the
termination of El Niño events and the meridional asymmetry of ENSO, J. Clim., 25, 5566–5586.McPhaden, M. J. (2003), Tropical Pacific Ocean heat content variations and ENSO persistence barriers. Geophys. Res. Lett. 30(9), 1480,
doi:10.1029/2003GL016872.McPhaden, M. J., S. E. Zebiak, and M. H. Glantz (2006), ENSO as an integrating concept in Earth Science, Science, 314, 1740.Meinen, C. S., and M. J. McPhaden (2000), Observations of warm water volume changes in the equatorial Pacific and their relationship to
El Niño and La Niña, J. Clim., 13, 3551–3559.Petrova, D., S. J. Koopman, J. Ballester, and X. Rodó (2016), Improving the long-lead predictability of El Niño using a novel forecasting scheme
based on a dynamic components model, Clim. Dyn., doi:10.1007/s00382-016-3139-y.Picaut, J., F. Masia, and Y. du Penhoat (1997), An advective-reflective conceptual model for the oscillatory nature of ENSO, Science, 277,
663–666.
Geophysical Research Letters 10.1002/2017GL074557
BALLESTER ET AL. HEAT BUILDUP AND GROWTH OF EL NIÑO 8508
AcknowledgmentsJ.B. gratefully acknowledges fundingfrom the European Commissionthrough a Marie Curie InternationalOutgoing Fellowship (projectMEMENTO from the FP7-PEOPLE-2011-IOF call) and a Marie Curie IndividualFellowship (project ACCLIM from theH2020-MSCA-IF-2016 call) and from theEuropean Commission and the CatalanGovernment through a Marie Curie-Beatriu de Pinós Fellowship (project00068 from the BP-DGR-2014-B call). Alldata sets used in this study are pre-sented in this paper and in the sup-porting information file.

Ramesh, N., and R. Murtugudde (2013), All flavours of El Niño have similar early subsurface origins, Nat. Clim. Change, 3, 42–46.Suarez, M. J., and P. S. Schopf (1988), A delayed action oscillator for ENSO, J. Atmos. Sci., 45, 3283–3287.Wang, C., and J. Picaut (2004), Understanding ENSO physics—A review, in Earth’s Climate, edited by C. Wang, S. P. Xie, and J. A. Carton,
pp. 21–48, AGU, Washington, D. C.Weisberg, R. H., and C. Wang (1997), A western Pacific oscillator paradigm for the El Niño–Southern Oscillation, Geophys. Res. Lett., 24,
779–782, doi:10.1029/97GL00689.Wyrtki, K. (1985), Water displacements in the Pacific and the genesis of El Nino cycles, J. Geophys. Res., 90, 7129–7132, doi:10.1029/
JC090iC04p07129.
Geophysical Research Letters 10.1002/2017GL074557
BALLESTER ET AL. HEAT BUILDUP AND GROWTH OF EL NIÑO 8509