philippine tourism: a small sized sector - world...
TRANSCRIPT
1
Philippine Tourism: A Small Sized Sector
Roy van der Weide
The World Bank
1. Introduction
The Philippines has a lot to offer as a tourist destination, yet the number of visitor arrivals is small
relative to neighboring destinations. By studying a decade of monthly visitor arrival data disaggregated
by country of origin we are able to address a range of questions pertaining to the size and prospects of
Philippine tourism. What are the main tourism markets for the Philippines? Can the success stories be
replicated? Is the Philippines successfully tapping into growing markets? And, are there any missed
opportunities?
We build a list of the most significant drivers and constraints by comparing the Philippine’s strengths
and weaknesses to other popular destinations in the region, and by drawing from interviews with the
Philippine Department of Tourism (DOT), the Chamber of Commerce, and with general managers of
some of the capital’s leading hotels. By regressing selected determinants (for which we have data)
against the monthly visitor arrivals, we let the data tell us which of these drivers and constraints stand
out. The regression results confirm international connectivity, price competitiveness, and security
concerns as key determinants. Interviews, and cross-destination comparisons, also highlight weak
domestic infrastructure (including unwelcoming international airports) and lack of a `brand name’ as
important constraints to Philippine tourism. In a separate section we review the recent literature that
shows how stimulating tourism industry development may serve as an engine to pro-poor growth.
“In 2008, 924 million tourists travelled abroad. That is a lot of people – amounting to over 100,000
people every hour. Three-quarters of these journeys started in a high or upper-middle income country.
Remarkably 40 per cent of these journeys ended in a developing country destination. International
tourists are significantly better than development agencies at spending money in poor countries. In
2007 tourists spent US$295 billion in developing countries – almost three times the level of official
development assistance. It is for this reason that tourism has been described as the world’s largest
voluntary transfer of resources from rich people to poor people.” (Mitchell and Ashley, 2010; page 1).

2
Where does travel to the Philippines originate from, and what can we learn from that? The Philippines’
leading markets are Korea and the United States (US). Both represent a success for the Philippines,
albeit for different reasons. We identified five factors. First, direct flight connections and travel time are
key, particularly for Korean tourists for whom the Philippine is the nearest exotic holiday destination
with a travel time of less than four hours. Second, the fact that English is widely spoken in the
Philippines has appeal to tourists from both countries. For Korean students, the Philippines is an
attractive place to learn English. For American tourists, being able to rely on one’s native language
makes the Philippines a particularly accessible destination. Third, the relatively low prices in the
Philippines play a critical role for both countries. The low cost price of English education helps the
Philippines compete with alternative locations to learn English such as the United States, Canada, the
United Kingdom and Australia, which might have been preferred had it not been for the price difference.
The Philippines is also using its lower price levels to promote health tourism, which is found to attract an
increasing number of patient tourists from the United States. Fourth, the Philippines is actively
promoted as a holiday destination in Korea (not so much in the United States). Fifth, the United States is
home to a large number of Philippine migrant workers who periodically return to the Philippines to visit
their relatives.
The Philippines is found to be less successful in attracting tourists from destination other than Korea and
the United States. It is tapping into the fast growing Chinese tourism market, but is losing market share
to other destinations in the region. The Japanese tourism market is still the Philippines’ third largest, but
is found to be in decline. With other tourism markets, think of Europe, Australia and Russia, the
Philippines is missing the boat all together. The reasons for this lack of success arguably include: (a) poor
international connectivity (to Europe and Russia in particular), (b) weak domestic infrastructure, and (c)
lack of a `brand name’.
Some of the factors behind the success of the Korean and US tourism markets can in principle be
adopted to replicate success elsewhere. This would turn some of the above mentioned constraints into
drivers, think of improving international connectivity, promoting education tourism (think of e.g. Japan,
China, Russia), promoting health tourism, maintaining price competitiveness, and adopting an
international marketing campaign promoting the Philippines as an exotic holiday destination.
The remainder of this report is organized as follows. Section 2 reviews the recent literature on the links
between tourism and poverty reduction. Section 3 shows the time-trends in the Philippines’ visitor
arrivals and receipts relative to other destinations in the region. Leading and lagging tourism markets for
the Philippines are identified in Section 4. The drivers and constraints are studied in Section 5. Section 6
shows the trends in supply of accommodation in the Philippines’ capital. Finally, we conclude with
Section 7.

3
2. Stimulating tourism and implications for poverty: An overview
With this section we give a brief overview of: (a) The channels via which tourism may induce pro-poor
growth, (b) What factors determine the magnitude of the tourism and pro-poor growth linkage, and (c)
Some of the possible adverse effects of tourism development.
Channels via which tourism may induce pro-poor growth:
i. The tourist sector is among the most labor intensive, more than other non-agricultural sectors,
and generally provides good opportunities for lower-skilled workers to make a contribution
(think of hotel and restaurant staff, tour guides etc.). Descriptive statistics for the South-East
Asia region for the period 2001-2005 show that the tourism industry is on average almost twice
as labor intensive than other non-agricultural sectors (the agricultural sector is the most labor
intensive), see e.g. Mitchell and Ashley (2010; Table 4.4). Moreover, Christie and Crompton
(2003), among others, find that jobs in the tourist sector also tend to be `good jobs’ in the sense
that they often provide healthy, safe and pleasant working conditions.
ii. The tourist sector generally exhibits strong inter-sectorial linkages. Growth in the tourism
industry often also yields growth in agriculture and fishing, food processing, transportation,
construction, furniture making, handicrafts, laundry services, security services etc. This growth is
expected to be pro-poor as many of the sectors linked to the tourist sector also tend to be
relatively labor intensive, predominantly non high-tech, and generally do not require large
investments so that almost anyone can contribute and benefit, including the poor. According to
estimates from Lejarraga and Walkenhorst (2006) for South-East Asia and the Pacific, a 10%
growth rate in the tourist sector generates on average a 7.8% growth rate in the non-tourism
sectors that are linked to the tourist sector. Many of these sectors can be located anywhere in
the country so that growth may potentially reach areas that rarely get to see a tourist.
iii. Steady growth in the tourism industry may in time also trigger: (a) investments in domestic
infrastructure and public goods, (b) human resource development, and (c) discovery of new
products and exports. The first two effects denote a supply response to meet the demand for
services brought on by tourism, which in turn will also benefit other sectors of the economy. The
third effect describes a situation where entrepreneurs get a chance to figure out what goods
and services have appeal to foreign tourists before deciding to export their produce to their
origin countries (see e.g. Lejarraga and Walkenhorst, 2006).
iv. A growing tourism industry may bring about potentially large scale remittances sent by those
benefitting from this growth to some of the poorest areas within the country and region (see
e.g. Mitchell and Ashley, page 36).

4
v. The tourism industry denotes a source of taxation for the government. This will benefit the poor
in countries where the government have a redistributive policy program.
vi. The tourism industry is found to provide opportunities for women to enter the labor market. A
study for the Philippines finds that the tourism industry in fact employed more women than
men (see Virola et al., 2001). Naturally, some subsectors are found to be more gender-biased
than others; retail tends to attract more women while transportation attracts more men.
The size of the effect of tourism development on poverty reduction depends in part on:
i. Whether the industry is dominated by high-end or low-end tourism. High-end tourism generally
creates more jobs (higher staff per room ratio), but more often demands higher-skilled labor,
and tends to be more dependent on import (think of specific food items such as meat and
cheese, management staff etc.). Lower-end tourists have a larger demand for local goods and
services (therefore relies less on imports), tend to stay and eat at locally owned hotels and
restaurants (so that most receipts stay in the country), do not demand high-skilled labor, and
are more forgiving with respect to underdeveloped infrastructure and public services.
Moreover, the lower entry costs in the lower-end tourism industry, the lower skill requirements,
and the higher demand for local produce, often yields that a given unit of investment in lower-
end tourism generates more jobs than if that unit were invested in high-end tourism.
ii. The minimum wage level; growth is expected to be more pro-poor in countries with more
generous minimum wage legislation.
iii. Ownership structure; foreign owners are found to pay higher wages (see e.g. Mitchell and
Ashley, 2010; page 42).
iv. Larger, more developed, and more diversified domestic economies are better able to provide
the goods and services that foreign tourists demand, i.e. making the tourist destination less
dependent on imports and foreign services. This in turn creates stronger inter-sectorial linkages,
and ensures that most of the receipts stay in the country.
v. The local business environment plays a key role in determining the size of the inter-sectorial
linkages. A well-functioning market helps: (a) small firms to respond to the needs of the tourist
sector, and similarly helps (b) the tourist sector to take advantage of the local economy when
needed. Recent empirical studies find that about half of the variation in the size of inter-
sectorial linkages with tourism can be attributed to the local business environment (see Mitchel
and Ashley, 2010; page 79).
Some possible adverse effects of tourism development:
i. Competition for infrastructure and public services if supply is not adjusted for new found
demand.
ii. Constrained access to natural resources by the local population (think of access to land, coast-
line and marine resources). A recent study of the Philippines attributes overfishing as a result of

5
new found demand brought on by tourism to malnutrition outcomes in some of the Philippine’s
coastal areas (see Mitchell and Shepherd, 2006).
iii. Price inflation for “shared goods and services”, such as local transportation (taxis) and property.
3. The Philippines ranks poorly as a tourist destination in the region
The number of visitors to the Philippines has been growing steadily over the last 25 years at an average
annual rate of roughly 8 percent, see Figure 1. This growth does little however, for putting the
Philippines on the map as a competitive tourist destination in South-East Asia, as subsequent figures will
show.
Figure 1: Total number of visitor arrivals into the Philippines (monthly)
The Philippine tourist sector has had its setbacks as can be seen in the periodic up and down
movements in visitor arrivals shown in Figure 1. Notice in particular the decline in visitors between the
years 2000 and 2004. This slump can be attributed to a number of exogenous shocks. The unfortunate
event that arguably started this decline is the hostage taking of 19 foreigners and 2 locals on a popular
dive resort island in May 2000 by the Abu Sayyaf guerillas (a violent group of Muslim separatists). A year
later, in September 2001, the world was taken by the 9/11 bombing of the World Trade Center in New
York. Another year went by when the South-East Asia region was hit by the SARS health crisis. The first
alleged SARS outbreak was recorded in China late 2002, in a province bordering on Hong Kong. Not long
thereafter SARS was found to have spread to countries throughout the region. In April 2003, the
Philippines reported a case of SARS involving a person returning from Hong Kong. The SARS outbreak
0
50
100
150
200
250
300
350
Tho
usa
nd
s
Visitors (total)
Visitors (total)
6
depressed travel to all popular tourist destinations in the region. The last incident was reported in early
2004. By that time the number of visitor arrivals to the Philippines had already started climbing again.
The regularly spaced spikes observed in the monthly data reflect the seasonality in visitor arrivals. Note
that the patterns in seasonality have changed over time. In recent years, the drops in visitors during low
season are as pronounced as the peaks in visitors during high season. Before the 2000-2004 slump,
however, spikes were only observed during high season.
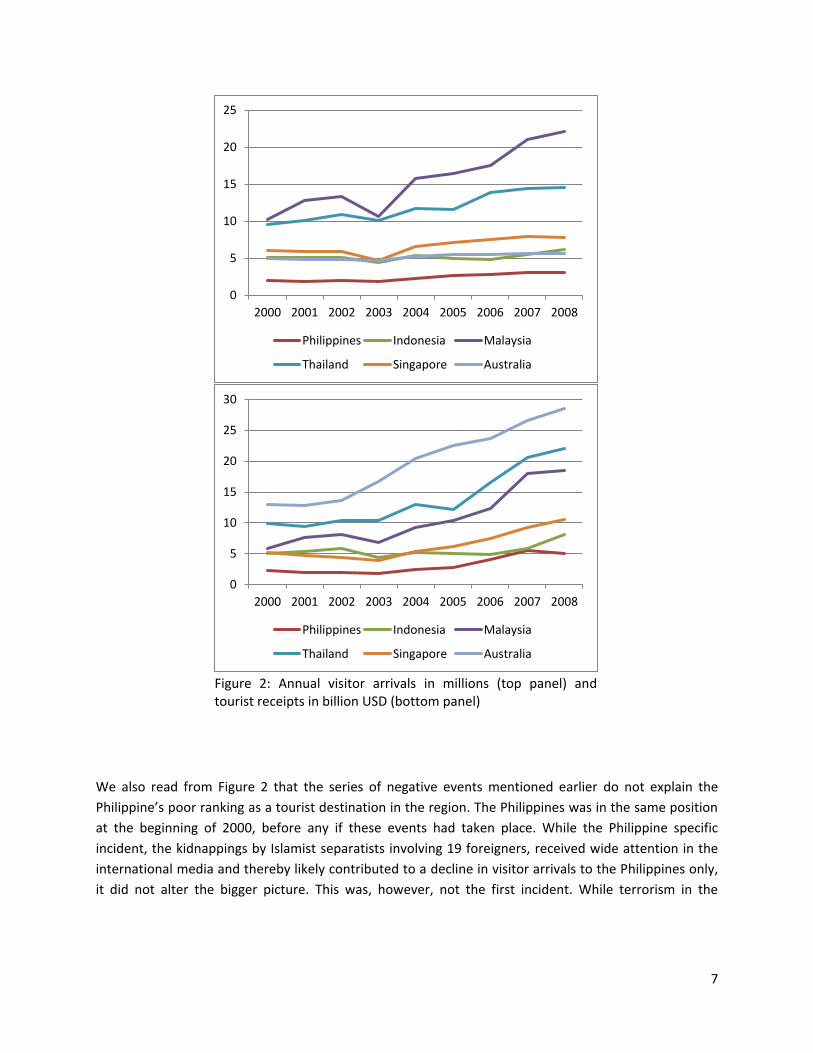
Comparing the Philippines to other destinations in the region shows the Philippines ranking all the way
at the bottom, clearly lagging behind both in terms of number of visitor arrivals (top panel of Figure 2)
and total receipts (bottom panel of Figure 2). There are no signs that this will change any time soon.
Thailand is among the region’s leading tourist destinations. Malaysia owns its top ranking in number of
visitor arrivals largely to the Singaporean residents that frequent the country for short visits.
Note that the 2003-2004 SARS outbreak seems to have affected Thailand, Malaysia, Singapore and
Indonesia more than the Philippines. Possible reasons for why the Philippines has been less affected by
SARS include: (i) a sizeable share of visitors of Philippine descent that are arguably less likely to stay
away from visiting their family in the Philippines; and (ii) visitors that are found to be more sensitive to
the health crisis (visitors from e.g. the United States, Europe, Japan, and Australia), that are not of
Philippine descent, represent a small share of total visitors compared to neighboring destinations.
7
Figure 2: Annual visitor arrivals in millions (top panel) and tourist receipts in billion USD (bottom panel)
We also read from Figure 2 that the series of negative events mentioned earlier do not explain the
Philippine’s poor ranking as a tourist destination in the region. The Philippines was in the same position
at the beginning of 2000, before any if these events had taken place. While the Philippine specific
incident, the kidnappings by Islamist separatists involving 19 foreigners, received wide attention in the
international media and thereby likely contributed to a decline in visitor arrivals to the Philippines only,
it did not alter the bigger picture. This was, however, not the first incident. While terrorism in the
0
5
10
15
20
25
2000 2001 2002 2003 2004 2005 2006 2007 2008
Philippines Indonesia Malaysia
Thailand Singapore Australia
0
5
10
15
20
25
30
2000 2001 2002 2003 2004 2005 2006 2007 2008
Philippines Indonesia Malaysia
Thailand Singapore Australia

8
Philippines seems to have intensified since 2000, earlier incidents date back to the 1970s.1 Since 2000,
there has on average been at least a hand full of incidents every single year. While each incident does
not receive the same media attention, it is conceivable that the Philippine’s ongoing struggle with
domestic terrorism, in recent years with Islamist separatists in particular, makes that the Philippines is
perceived as a relatively unsafe destination.
We find empirical support for the negative effect of domestic terrorism news on visitor arrivals,
although it does not seem to have a large part in explaining the poor performance of the Philippines as a
tourist destination (see regression results presented later in this paper).
Figure 3: Tourist receipts as a % of GDP (left panel) and as a % of total exports (right panel)
The Philippines climbs a few steps up the ranking when we compare total tourism receipts as a share of
GDP (left panel of Figure 3) or as a share of total exports (right panel of Figure 3). This arguably says
more about the Philippine economy as a whole than about the tourism economy; It means that not only
the Philippine’s tourism receipts are low, so is its GDP and export. It is not uncommon that the tourism
industry represents a large share of the economy in less developed countries, while tourist receipts are
relatively small in absolute value (see e.g. Mitchell and Ashley, 2010). The Philippines is no exception.
[The positive to take away from this is that stimulating the tourism sector is expected to have a sizeable
impact on economic growth in the Philippines, and very possibly on poverty reduction (see discussion on
links between tourism and poverty in Section 2). In terms of employment, the Philippine tourism
industry employs roughly 9 to 10 percent of the total workforce; see e.g. Yi (2010).
1 Islamist separatists are not the only groups to have terrorized the Philippines. Some of the earlier attacks were carried out by communist organizations such as the “New People’s Army”.
0%
2%
4%
6%
8%
10%
12%
2000 2001 2002 2003 2004 2005 2006 2007 2008
Philippines Indonesia Malaysia
Thailand Singapore Australia
0%
2%
4%
6%
8%
10%
12%
14%
16%
18%
20%
2000 2001 2002 2003 2004 2005 2006 2007 2008
Philippines Indonesia Malaysia
Thailand Singapore Australia

9
4. Leading and lagging tourism markets for the Philippines
Where do the majority of tourists come from, and which tourists are underrepresented? Is the
Philippines tapping into new tourism markets that could help the Philippines grow into a larger tourist
destination in the region? We first identify which markets are important for the Philippines. In the
subsections we evaluate for each origin country (tourism market) how the Philippines ranks as a tourist
destination in the region. These intra-regional comparisons help put the number of Philippine visitor
arrivals in perspective. What may be a large tourism market for the Philippines may still represent a
modest market share, and vice versa.
Figures 4 and 5 show the annual number of visitors to the Philippines disaggregated by country of origin.
The figures are organized by market size; the five largest markets for the Philippines are shown in Figure
4, followed by a selection of medium-sized markets (left panel of Figure 5) and small-sized markets (right
panel of Figure 5).
Figure 4: Largest tourism markets for the Philippines (China as reference)
South Korea and the United States stand out as the Philippines largest contributors to annual visitor
arrivals. Both these markets continue to grow. The Korean market is showing the highest growth rate,
and has recently surpassed the United States to become the Philippine’s largest tourism market. Japan
and Europe are ranked third and fourth respectively. Note that while Europe is growing as a tourism
0
100
200
300
400
500
600
700
2001 2002 2003 2004 2005 2006 2007 2008
Tho
usa
nd
s
Europe China Japan Korea USA

10
market to the Philippines, the number of visitors from Japan is in decline. China is still behind the `big
four’ but is showing impressive growth in visitors since 2004.
Figure 5: Medium and small tourism markets for the Philippines (annual visitors in thousands)
China’s growth as a tourism market for the Philippines is particularly impressive when compared to the
markets outside of the top five (shown in Figure 5). Note that China still ranked among the smallest
tourism markets as late as 2004. Since then it surpassed all of these markets, and is currently ranked as
the Philippine’s fifth largest tourism market. Russia stands out as one of the Philippines smallest
markets, which is somewhat surprising given the growing number of Russian tourists.
Korea: A success story
The fast growing Korean tourism market has been a success story for the Philippines. In the region, the
Philippines is the second most popular destinations for travellers from Korea, and continues to gain
market share. Growth is roughly at par with Thailand, but is outgrowing Indonesia and Malaysia as a
tourist destination for Koreans. In 2001, the Philippines and Indonesia were still receiving the same
number of visitors. By 2008, the Philippines was receiving twice as many visitors as Indonesia. Thailand
remains the most popular tourist destination in the region, for Korean travellers as well for travellers
from other parts of the world.
0
20
40
60
80
100
120
140
160
180
2001 2002 2003 2004 2005 2006 2007 2008
Singapore China Hong Kong
Taiwan Canada Australia
0
20
40
60
80
100
120
140
160
180
2001 2002 2003 2004 2005 2006 2007 2008
Malaysia China Germany
Netherlands United Kingdom Russia

11
Why is the Philippines such a popular destination for travel originating in Korea? And can this success be
replicated elsewhere? We can think of a number of reasons, of which not all are transferable. First,
Korea and the Philippines are well connected. Direct flights between Seoul and Manila are both short
and cheap. The Philippines offers pristine beaches, a large variety of diving sites, golf resorts, spa resorts
and hiking in less than four hours flying from Korea. Second, Koreans tend to spend a relatively little
number of days on holiday, so that short travel time will be much preferred. (A flight to Bali, Indonesia’s
popular holiday destination, instead of to Manila, will add three hours of flight time. Direct flights to
Bangkok add an hour and a half.) Third, the Philippines is developing into a popular destination for
Korean students to learn English, largely because of the low course fees and low cost of living in the
Philippines compared to popular alternatives such as the Unites States, the UK and Australia (which
might be preferred were it not for the price difference). Fourth, the Department of Tourism (DOT) in the
Philippines is running an active marketing campaign in Korea. (Note that Korean tour agencies too
promote the Philippines as a popular holiday destination; as many Korean tourists book their holidays
via such operators it is not obvious what the value added is of the DOT’s promotion efforts.) Fifth, the
Philippines is a relatively cheap holiday destination for Korean travellers. While consumer prices are
roughly at par with prices in Thailand, Indonesia and Malaysia, Koreans will save on the flight ticket to
the Philippines. (Vietnam may develop as a popular alternative to the Philippines; a direct flight between
Seoul and Hanoi takes 4.5 hours.) The lower cost of living is also found to attract Koreans who see the
Philippines as a place to retire.
Figure 6: Annual visitors from Korea (in thousands)
If any lesson(s) can be learned from the Philippine’s success with the Korean tourism market, it would be
that short and affordable travel to one’s holidays destination, competitive prices, and marketing are all
important factors in attracting tourists. In the case of Korea, the Philippines seems to be the closest
holiday destination that offers the type of attractions many would look for when planning a (short)
0
200
400
600
800
1000
1200
2001 2002 2003 2004 2005 2006 2007 2008
To Philippines To Indonesia
To Malaysia To Thailand

12
holiday, i.e. beaches, diving, golf and spa resorts. The number of other high-income countries for which
the Philippines would be the closets holiday destination is naturally limited. This makes that well-
connected and affordable international flights become that much more important to stay competitive.
Notice that the Philippines is the only destination that is not experiencing a decline in Korean visitors
during the 2003-2004 SARS outbreak. By the same token, the declines observed in neighboring
destinations are modest. (It appears that Korean travellers are not easily deterred.)
The U.S.: Also a large market but a different story
The United States denotes the second largest tourism market for the Philippines, but is essentially of the
same size as the Korean market. Both are growing at the same rate, and both are gaining market share
with respect to other destinations in the region. As with the Korean market, the Philippines comes in
second to Thailand, see Figure 7. Overall the picture looks very similar to the picture for the Korean
market (compare Figures 7 to Figure 6). Yet the two markets are rather different.
Figure 7: Annual visitors from the United States (in thousands)
How does the Philippines manage to attract so many visitors from the United States? The driving factors
are likely to be different from those that made Korea a large tourism market, simply because the two
countries are very different. Firstly, the United States is located considerably further away from the
Philippines than Korea. A flight between Manila and Los Angeles, which is among the U.S cities closest to
0
100
200
300
400
500
600
700
800
2001 2002 2003 2004 2005 2006 2007 2008
To Philippines To Indonesia
To Malaysia To Thailand

13
the Philippines, takes more than 13 hours (compared to less than 4 hours between Manila and Seoul). A
holiday to Mexico or the Caribbean would involve much less travel time. Second, to the best of our
knowledge, the Philippines is not running a targeted marketing campaign in the United States (as they
do in Korea). Third, the fact that English is a widely spoken language in the Philippines is unlikely to
attract students from the United States for studies in the Philippines (as it does in Korea). Yet, as English
denotes a common language between the United States and the Philippines, it may nevertheless be a
positive factor for American visitors. Being able to communicate in your native language while on
holiday has obvious appeal. The common language is also testimony to the historical ties between the
United States and the Philippines, which in itself may persuade some Americans to choose the
Philippines as their holiday destination.
We hypothesize that a substantial number of visitors from the Unites States are of Philippine descent
that travel to the Philippines to visit their family. The United States is a popular choice for Philippine
migrant workers in search for economic opportunities, arguably because of the historical ties and the
common language. This hypothesis is consistent with the positive correlation we find between the
number of visitors from the Unites States and the occupancy rates of budget accommodation (in Metro-
Manila), where visitor arrivals from Korea are more correlated with occupancy rates in the mid to high-
end accommodation (see Section 6).
The lower-end budget travel to the Philippines, whether or not originating from the Unites States, is not
necessarily a bad thing. While budget tourism yields lower receipts compared to high-end tourism, a
larger share of the receipts tends to remain in the local economy. Budget tourists are found to have
more demand for local goods and services, especially visitors from Philippine descent, which creates
stronger inter-sectorial linkages between tourism and the rest of the economy. In contrast, high-end
tourism is more depend on imports. Moreover, budget tourism requires lower investments and provides
more opportunities for unskilled workers. For these reasons, economic growth as a result from budget
tourism expansion is more likely to be pro-poor growth.
In recent years the DOT has recorded an increase in health tourism. A large number of the patient
tourists come from the United States that arguably travel to the Philippines to take advantage of the
lower costs of health care (see DOT, 2008) – analogous to the competitively priced education tourism
that is attracting an increasing number of Koreans.

14
Japan: Large market but in decline
The Philippines has been less successful with attracting visitors from Japan in recent years. One would
think that if Korea could be a major tourism market for the Philippines, then so could Japan. In terms of
travel time, the Philippines is one of the closest holidays destination when travelling from Japan,
likewise when travelling from Korea. Both Japan and Korea are well-connected to the Philippines; a
direct flight from Tokyo to Manila takes 4 hours and 20 minutes. Flying from Tokyo to Bangkok, as
opposed to Manila, would add an hour and a half of flight time (similarly when flying from Seoul to
Bangkok instead of to Manila). A holiday to Indonesia would involve even longer travel time, the
Philippines is located exactly in between Japan and Indonesia, yet Indonesia is able to attract more
visitors from Japan that the Philippines.
Japanese spend relatively little time on holiday, as Koreans do, making less time spend on travel that
much more important. The Philippines offers beaches, diving, golf and spa resorts, which have great
appeal to both Koreans and Japanese. Also, both Japan and Korea benefit from the lower prices in the
Philippines.
Why is it then that the number of visitors from Japan is in decline while the Korean tourism market is
growing rapidly? We do not yet have a satisfactory answer to this question, but note that the gap
between Thailand and the Philippines as a destination is much larger for the Japanese market when
compared to the Korean market. Thailand clearly stands out as the popular destination for Japanese
tourists, despite the longer travel time and higher costs involved. It is conceivable that Japanese tourists
are more likely to demand high quality domestic infrastructure and services, and more likely to be
concerned with the Philippine’s security concerns, making Thailand a preferred destination.

15
Figure 8: Annual visitors from Japan (in thousands)
Interestingly, note that the Philippines is once again found to be less affected by the 2003-2004 SARS
outbreak compared to other destinations in the region. Could this mean that a sizeable share of visitors
from Japan is from Philippine descent (e.g. domestic workers), where travel from Korea is more driven
by tourism?
China: Growing market but losing market share
While China denotes one of the fastest growing tourism markets (see Figures 4 and 5), the Philippines is
nevertheless losing market share to other destinations in the region (see Figure 9). By 2008, Indonesia
was receiving twice as many visitors from China as the Philippines. Four years earlier, Indonesia and the
Philippines were still at par. Malaysia also denotes a major player for Chinese tourism (where it is a
relatively small player for most other tourism markets), which is likely to be attributed to the Chinese
heritage in Malaysia (about a quarter of the Malaysian population is ethnically Chinese).
Why is the Philippines’ share of Chinese tourism so small? The Philippines is not further away from China
than Thailand, Malaysia and Indonesia is. Chinese tourists are likely to be more forgiving with respect to
the underdeveloped infrastructure in the Philippines. China may not have been as well connected to the
Philippines as it is to other destinations in the region. A number of direct flights between the Philippines
0
200
400
600
800
1000
1200
1400
2001 2002 2003 2004 2005 2006 2007 2008
To Philippines To Indonesia
To Malaysia To Thailand

16
and China have only recently been added (see DOT, 2008).2 Also, the Philippines does not have the same
brand name as its more popular neighbors, due to the lack of a strong international marketing
campaign, which may play a larger role in an emerging tourism market such as China.
Figure 9: Annual visitors from China (in thousands)
Europe: Largely left behind
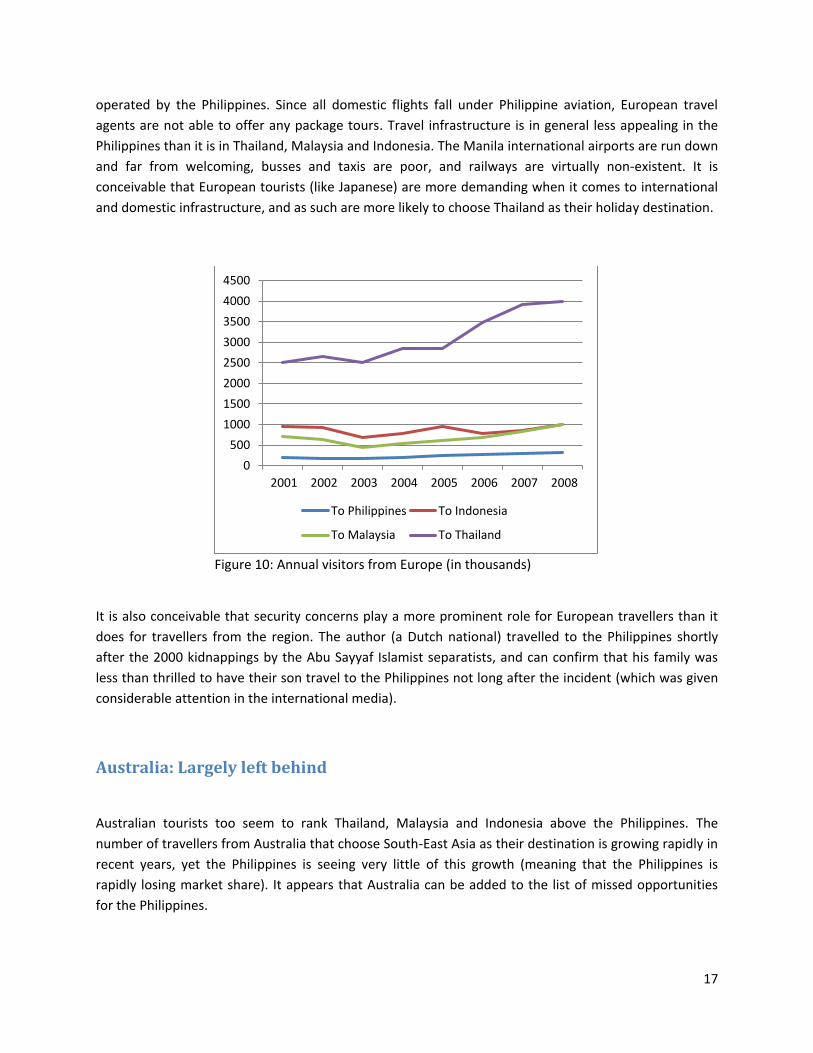
The Philippines is attracting a shockingly small share of European tourists (see Figure 10). In 2008,
Indonesia and Malaysia both attract four times as many European visitors than the Philippines. The
number of Europeans travelling to Thailand is off the charts, roughly twenty times the number of
arrivals in the Philippines.
The European tourism market clearly denotes a missed opportunity for the Philippines. The answer as to
why the Philippines is missing out is less of a mystery in this case. For one, the Philippines stands out in
the region as a tourist destination that is remarkably poorly connected to Europe. There is only one city
in Europe that has a direct flight to the Philippines, which is Amsterdam (the Netherlands), operated by
KLM. In the past, Lufthansa also used to operate a flight between Manila and Frankfurt, but that flight
has been discontinued. Moreover, Europe has downgraded Philippine aviation, which means that it is
not possible for Europeans to insure their travel to/in the Philippines when they make use of airlines
2 These new flights are between Beijing and Guangzhou to Clark, Shanghai and Nanning to Cebu, and between Nanning and Kunming to Manila. New data will have to show how effective these policies have been in attracting a larger share of the Chinese tourism market.
0
100
200
300
400
500
600
700
800
900
1000
2001 2002 2003 2004 2005 2006 2007 2008
To Philippines To Indonesia
To Malaysia To Thailand
17
operated by the Philippines. Since all domestic flights fall under Philippine aviation, European travel
agents are not able to offer any package tours. Travel infrastructure is in general less appealing in the
Philippines than it is in Thailand, Malaysia and Indonesia. The Manila international airports are run down
and far from welcoming, busses and taxis are poor, and railways are virtually non-existent. It is
conceivable that European tourists (like Japanese) are more demanding when it comes to international
and domestic infrastructure, and as such are more likely to choose Thailand as their holiday destination.
Figure 10: Annual visitors from Europe (in thousands)
It is also conceivable that security concerns play a more prominent role for European travellers than it
does for travellers from the region. The author (a Dutch national) travelled to the Philippines shortly
after the 2000 kidnappings by the Abu Sayyaf Islamist separatists, and can confirm that his family was
less than thrilled to have their son travel to the Philippines not long after the incident (which was given
considerable attention in the international media).
Australia: Largely left behind
Australian tourists too seem to rank Thailand, Malaysia and Indonesia above the Philippines. The
number of travellers from Australia that choose South-East Asia as their destination is growing rapidly in
recent years, yet the Philippines is seeing very little of this growth (meaning that the Philippines is
rapidly losing market share). It appears that Australia can be added to the list of missed opportunities
for the Philippines.
0
500
1000
1500
2000
2500
3000
3500
4000
4500
2001 2002 2003 2004 2005 2006 2007 2008
To Philippines To Indonesia
To Malaysia To Thailand

18
The reasons for why the Philippines is unable to compete for Australian travellers are arguably very
similar to the reasons it is failing to attract (more) travellers from Europe and Japan. The only factor that
applies more to Europe, and not so much to Australia, is international connectivity. There are plenty of
direct flights between Australia and the Philippines. The direct flight between Darwin and Manila takes a
little over 4 hours (same distance as Manila – Seoul), while the flight between Sydney to Manila is just
under 8 hours.
Figure 11: Annual visitors from Australia (in thousands)
The up and down movement in Australian visitors to Indonesia arguably confirms the significance of
security concerns. The first dip follows shortly after the October 2002 Bali bombing by members of a
violent Islamist group that claimed the lives of 202 people of which 88 were Australian. The second
decline, which is even larger than the first, coincides with two (major) terrorist attacks on Indonesian
soil that involved Australian casualties: The September 2004 bombing of the Australian embassy in
Jakarta, and the October 2005 bombing in Bali.
Notice that all destinations experience a noticeable dip in visitor arrivals around 2003, the time of the
SARS outbreak, except the Philippines. Our working hypothesis is that many of those travelling between
Australia and the Philippines are from Philippine descent (e.g. domestic workers), as is the case in e.g.
Europe, Japan and the United States.
0
100
200
300
400
500
600
700
800
2001 2002 2003 2004 2005 2006 2007 2008
To Philippines To Indonesia
To Malaysia To Thailand

19
Russia: Largely ignored
The absence of the Russian tourism market truly denotes a missed opportunity. The number of Russian
tourists is growing rapidly. Thailand, Indonesia, and Malaysia are all getting their share, see Figure 12.
For Thailand, the Russian market tripled in just three years’ time. Not only is the Philippines getting a
negligible share of Russian tourists, it is also the only country in the region that is seeing negative
growth.
Figure 12: Annual visitors from Russia (in thousands)
What explains the Philippine’s lack of popularity with Russian travellers? Like Europe, Russia is poorly
connected to the Philippines. There are no direct flights between Moscow and Manila (nor any other
location in the Philippines), while neighboring destinations are better connected. The lack of a strong
international marketing campaign promoting the Philippines has arguably also kept the Philippines
below the radar of Russian tourists, where Thailand, Malaysia and Indonesia have all established a brand
name for themselves.
Results presented in section 5 show that visitors from Russia are attracted to high-end accommodation
in the Philippines, judging by correlation between visitors and occupancy rates in high-end hotels in
metro-Manila. It is possible, however, that these visitors from Russia represent business travel, in which
case these results cannot be extrapolated to leisure tourism (in the event that takes off).
0
50
100
150
200
250
300
350
2001 2002 2003 2004 2005 2006 2007 2008
To Philippines To Indonesia
To Malaysia To Thailand

20
5. Factors determining size of tourist sector
The findings presented in this section draw from descriptive statistics on a range of determinants of
visitor arrivals, regression results with visitor arrivals as the dependent variable, and on interviews with
the Philippine Department of Tourism, a representative of the Chamber of Commerce, and general
managers of some of Manila’s leading hotels.
What makes the Philippines an attractive destination?
The Philippine’s strengths as a holiday destination include (in no particular order):
1. The Philippines offers a wide range of attractions: pristine islands and beaches, a variety of
UNESCO World Heritage sites (including the 2000-year old Banaue Rice Terrace sometimes
referred to as the Eighth Wonder of the World), spectacular diving sites, rainforests with
beautiful hiking opportunities etc.
2. Unlike Thailand for example, which also offers many of the above mentioned attractions, the
Philippines is less explored with many beautiful sites still unspoiled and underdeveloped. This is
perhaps both a positive and a negative, depending on the type of tourist. The Philippines is in
many ways a more exotic destination which has much to offer to the more adventurous
traveller. While more developed sites are also on offer, travel in the Philippines is not as
comfortable as it is in Thailand, say, which arguably makes the latter destination more attractive
to the comfort traveller. The author travelled through South-East Asia, including the Philippines,
long before writing this report. In all honesty, he ranks the Philippines as his favorite
destination, largely because of the beautiful and unspoiled nature, and lack of regulation. While
this clearly makes the Philippines attractive in the eyes of some, it naturally limits the scope for
development.
3. English is widely spoken in the Philippines, which is unique on the region. This makes that the
Philippines is: (a) easily accessible to a large audience (as there is no language barrier), and (b)
an attractive destination to learn English (the low costs, and proximity, is already attracting large
numbers of Korean students to learn English in the Philippines).
4. Philippine hospitality too stands out.
5. Prices are relatively low. Hotel prices are on average lower than in Thailand, while at par with
Malaysia and Indonesia (see Figure 13). Consumer prices are largely at par with Thailand,
Malaysia and Indonesia, but naturally considerably lower than prices in e.g. Korea and the
United States (see Figure 14), which are both large tourism markets for the Philippines.

21
Figure 13: Hotel price index
Figure 14: PPP to exchange rate ratio (left panel) and price of a Big Mac in USD (right panel)
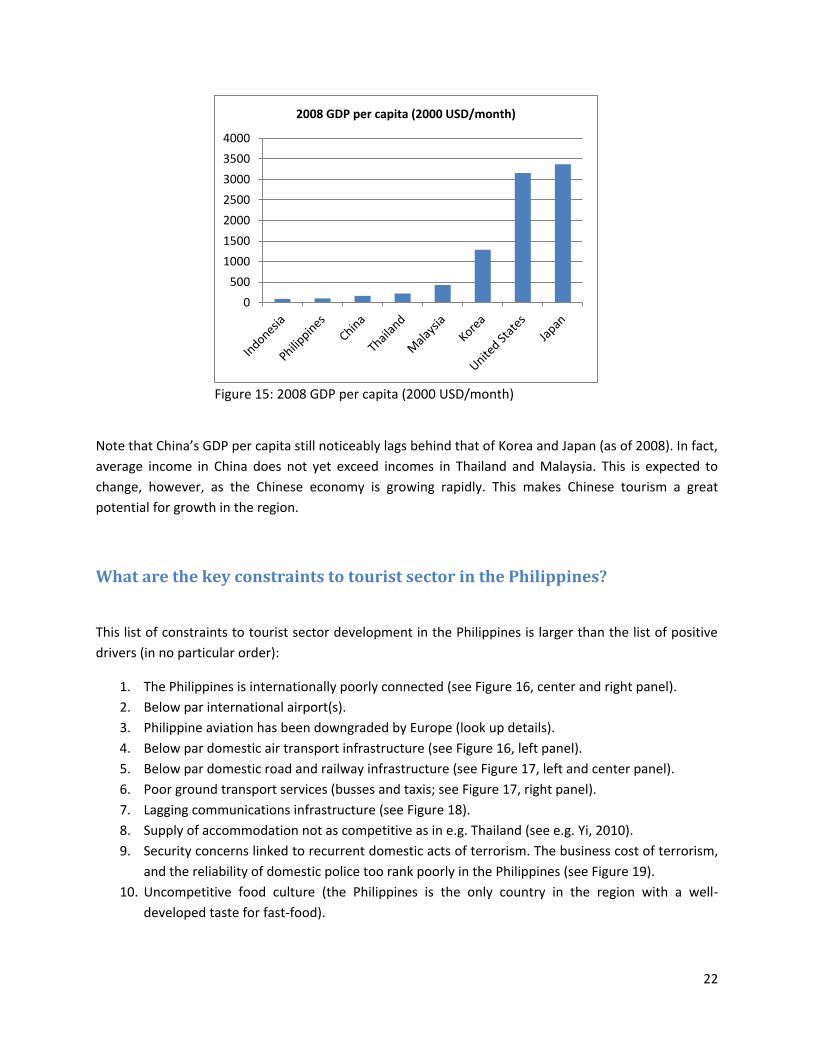
Tourists coming from e.g. Korea, Japan, the United States, Europe benefit from higher incomes as well
as favorable price differences when travelling to South-East Asia (see Figure 15).
0.0
20.0
40.0
60.0
80.0
100.0
120.0
Malaysia Thailand Indonesia Philippines
Hotel price index
0
0.2
0.4
0.6
0.8
1
1.2
2000 2001 2002 2003 2004 2005 2006 2007 2008
Philippines Indonesia
Malaysia Thailand
Korea United States
0
0.5
1
1.5
2
2.5
3
3.5
4
1998 2000 2002 2004 2006 2008
Philippines Indonesia
Malaysia Korea
Thailand United States
22
Figure 15: 2008 GDP per capita (2000 USD/month)
Note that China’s GDP per capita still noticeably lags behind that of Korea and Japan (as of 2008). In fact,
average income in China does not yet exceed incomes in Thailand and Malaysia. This is expected to
change, however, as the Chinese economy is growing rapidly. This makes Chinese tourism a great
potential for growth in the region.
What are the key constraints to tourist sector in the Philippines?
This list of constraints to tourist sector development in the Philippines is larger than the list of positive
drivers (in no particular order):
1. The Philippines is internationally poorly connected (see Figure 16, center and right panel).
2. Below par international airport(s).
3. Philippine aviation has been downgraded by Europe (look up details).
4. Below par domestic air transport infrastructure (see Figure 16, left panel).
5. Below par domestic road and railway infrastructure (see Figure 17, left and center panel).
6. Poor ground transport services (busses and taxis; see Figure 17, right panel).
7. Lagging communications infrastructure (see Figure 18).
8. Supply of accommodation not as competitive as in e.g. Thailand (see e.g. Yi, 2010).
9. Security concerns linked to recurrent domestic acts of terrorism. The business cost of terrorism,
and the reliability of domestic police too rank poorly in the Philippines (see Figure 19).
10. Uncompetitive food culture (the Philippines is the only country in the region with a well-
developed taste for fast-food).
0
500
1000
1500
2000
2500
3000
3500
4000
2008 GDP per capita (2000 USD/month)
23
11. Lack of a ‘brand name’. The Philippines does not have a strong international marketing
campaign, unlike Thailand, Malaysia and Indonesia, and as such does not have the ‘brand name’
that these destinations have (think of “Amazing Thailand”, and “Malaysia, truly Asia”).
12. The Philippines lies in relative isolation, like Australia and New Zealand, which makes it difficult
for visitors to combine a holiday to the Philippines with a visit to other destinations in the
region. This is perhaps both a positive and a negative; it may curb the total number of visitor
arrivals, but arguably increases the average length of stay.
Let us also list some of the constraints put forward by the hotel managers we interviewed:
1. Poor business climate and lack of development planning.
2. Difficult to attract and keep local staff for high-skilled work, largely due to the limited supply of
high-skilled workers and the high demand for them. Local candidates for management level
positions have a range of outside options both inside and outside the tourism sector, both inside
the Philippines and abroad.
3. High energy costs.
We will briefly elaborate on some of the constraints. A detailed discussion of the Philippine’s
weaknesses in tourism competitiveness can also be found in Yi (2010).
International airport: For many, the international airport that welcomes the passenger on arrival and
departure will have an important part in how the visitor experiences his or her stay. The main
international airports in Manila are unlikely to leave a good impression. Ninoy Aquino International
Airport (NAIA) is 30 years old, and has not aged well. Its outdated facilities and over capacity (it is
handling way more passengers than it was designed for) means that many passengers will want to
spend as little time in the airport as possible due to pure lack of comfort. NAIA ranks without doubt
among the poorest airports in the region. The NAIA-2 terminal, used exclusively by Philippine Airlines, is
not as old, but also not great, and too small to make it the new main terminal. NAIA-3, located a little
further, has the most modern facilities of the three terminals. But also NAIA-3 is by now outdated, and
would require substantial investments to upgrade the facilities to international standards. As NAIA-3 is
small and lacks the space to develop it into the new main terminal, it is not obvious if makes sense to
make the necessary investments. There is also Clark international airport, which is currently mostly used
by budget airlines. To make Clark the main international terminal too would require a major investment.
While it has the space needed to make it the modern day international airport for the Philippines, it is
located almost two hours from Manila. Without the necessary investment in the ground infrastructure,
the travel time could easily get even longer. A high-speed railway connection between Clark and Manila
would make Clark a real option.

24
Figure 16: Air transport indicators
Internationally poorly connected: There are few countries in the region that are as poorly connected to
international tourism markets as the Philippines is. The number of foreign carrier-flights per week to the
Philippines is about one-third of flights to Thailand (see e.g. Yi, 2010). Most notably, there is only one
direct flight between Europe and the Philippines, a flight between Amsterdam and Manila operated by
KLM, which leaves the Philippines very much disadvantaged in attracting visitors from Europe.
Figure 17: Ground transport indicators
Poor domestic road and railway network: Let us borrow an example from Yi (2010) as an illustration of
how the Philippine’s underdeveloped ground transport infrastructure negatively impacts on tourism.
Consider the journey to the Banaue Rice Terrace, one of the Philippine’s highlights. While Banaue is
merely 350 kilometers from Manila, it easily takes a visitor 10 hours or more to get there by car or bus,
the only two real options for the time being (see e.g. Yi, 2010). The weak infrastructure in Manila leaves
0.01.02.03.04.05.06.07.0
Quality of air transport infrastructure
0.0
20.0
40.0
60.0
80.0
100.0
Number of operating airlines
0.01.02.03.04.05.06.07.0
International air transport network
0.0
1.0
2.0
3.0
4.0
5.0
6.0
Quality of roads
0.0
1.0
2.0
3.0
4.0
5.0
6.0
Quality of railroads
0.0
1.0
2.0
3.0
4.0
5.0
6.0
Quality of ground transport network

25
the city in an almost continuous state of congestion. The lack of a good alternative (think of the well-
connected monorail in Bangkok) means that there is often little choice but to face the traffic, with all the
frustration that comes with it.
Figure 18: Internet users (left), telephone lines (middle), and mobile phones (right) per 100 individuals
Figure 19: Corruption, security and costs of terrorism (lower value means higher cost)
Security perception: While terrorism in the Philippines has been a problem for decades now, it seems to
have intensified since 2000. There is easily a hand full of incidents on average per year. Table 1 lists the
most significant incidents, of which all will have reached the international media. While some incidents
receive more media attention than others, it is easily seen that the Philippine’s ongoing struggle with
domestic terrorism, in recent years with Islamist separatists in particular, means that certain tourists
may avoid the Philippines for security concerns. Note that not all incidents are linked to Islamists
separatist. In November 2007, for example, a senator, a brigadier general, and 25 other officers on trial
0
20
40
60
80
2000 2002 2004 2006 2008
Philippines Indonesia
Malaysia Thailand
Korea United States
0
20
40
60
80
2000 2002 2004 2006 2008
Philippines Indonesia
Malaysia Thailand
Korea United States
0
20
40
60
80
100
120
2000 2002 2004 2006 2008
Philippines Indonesia
Malaysia Thailand
Korea United States
0.0
1.0
2.0
3.0
4.0
5.0
6.0
Malaysia Thailand Indonesia Philippines
Reliability of police
0.0
1.0
2.0
3.0
4.0
5.0
6.0
Malaysia Thailand Indonesia Philippines
Business cost of terrorism

26
for mutiny occupied the Peninsula Hotel in Manila, which made international headlines. There were no
casualties. (The Philippines also ranks as one of the most dangerous countries for journalists.)
Date Terrorist incident
May 2000 Dive resort kidnapping December 2000 Rizal Day Bombings May 2001 Dos Palmas kidnappings October 2002 Zamboanga bombing incident February 2004 Super-Ferry 14 bombing incident October 2006 Bombing incidents in Central Mindanao July 2007 Basilan beheading incident November 2007 Batasang Pambansa bombing July 2009 Bombing incidents in Mindanao Table 1
Lack of a ‘brand name’: Unlike Thailand, Malaysia, and Indonesia, the Philippines is not airing tourism
promotion campaigns on CNN, BBC and/or other international media. As a result, the Philippines will for
many be a little known destination compared to other popular destinations in the region. According to
interviews with the DOT, the Philippines has a small marketing budget compared to Thailand and
Malaysia, largely because the overall government budget is smaller (as a share of the overall budget, the
Philippines are not spending less on marketing). From the same interviews we learned that a sizeable
share of the marketing budget is allocated to the Korean market. It remains to be seen whether this is
an efficient use of resources, as Korea denotes a select number of markets where the Philippines has
already established a brand name (in part also due to promotion activities by Korean tour agencies).
Regression results: Determinants of visitor arrivals
Regressing (log) tourist arrivals on a selection of determinants for which we have data confirms their
significance. International connectivity and price competitiveness are found to play the largest role.
International connectivity is key: Controlling for distance, a direct flight to the Philippines is associated
with a significantly larger number of visitor arrivals. Interestingly, note that the effect is stronger for
countries served by Philippine Airlines send more visitors than countries served by foreign carriers only.
We cannot rule out endogeneity bias from these results; direct flight connections are more likely to
reach out to people that have a high demand for travel. Having said that, there being only one direct
flight between the Philippines and Europe is unlikely to reflect Europe’s limited appetite for travel to the
Philippines. More likely is that the supply of flight connections in this case is constraint. Resolving this
constraint is expected to stimulate European travel to the Philippines.

27
Climate matters: The number of visitors that are drawn to the Philippine’s warm climate is found to
increase with poor weather in the origin country. More specifically, origin countries are more likely to
send visitors when their temperatures are low and/or when rainfall is high. While significant in all four
model specifications, there are no obvious policy implications that can take advantage of this regularity.
Price competitiveness is key: Lower prices in the Philippines relative to the origin country are helping
the Philippines attracting tourism. We include a general consumer price index (log difference between
the Philippine’s PPP to the exchange rate and the origin country’s index) and a hotel price index (also a
log difference). Both are strongly significant with the expected sign, and are robust to inclusion of more
control variables. These results confirm that price competitiveness matters. The obvious policy
implication is to stimulate competition in the Philippine tourist sector, which includes international and
domestic flights, domestic travel, hotels etc. (think of relaxing barriers to entry where there are any).
As expected, visitors are also more likely to come from countries that have more to spend (higher GDP
per capita), although the effect is reduced when we control for prices.
Communications infrastructure in origin country – merely a proxy for income?: Visitors are more likely
to come from countries with a larger number of internet users and higher penetration of telephone
infrastructure. Most probably, these variables serve as proxies for income, which would explain their
positive effect. Note that the effect of GDP per capita is significantly reduced when we include the
communications infrastructure variables. To some extent, the variables may also proxy for access to
information, which too may play a positive role, especially in the absence of a strong international
marketing campaign promoting the Philippines as a holiday destination.
Negative news shocks – raising security concerns: The `negative news’ dummy variable equals 1 during
the events listed in Table 1, and 0 otherwise. All events refer to acts of domestic terrorism that will have
reached the international media. As expected, these news shocks have a negative effect on Philippine’s
visitor arrivals. Somewhat unexpected perhaps is the modest size of the effect. Note, however, that our
time-series is very small, making it difficult to measure the effect of news shocks that has to be
identified on the basis of the joint time-variation in visitor arrivals and news shocks. It is very well
possible that the effect of news becomes more pronounced when we have more data.
Private health expenditure to GDP in origin country: Like communications infrastructure, private health
expenditure too might merely serve as another proxy to income, thereby explaining its positive effect.
There is an outside chance that its effect may also be linked to health tourism. Private health
expenditure is about 9% of GDP in the United States, which is considerably higher than in other
28
countries. The high local cost of health care might tempt some to fulfill their health care needs in
countries where the cost is lower, such as in the Philippines and Thailand.
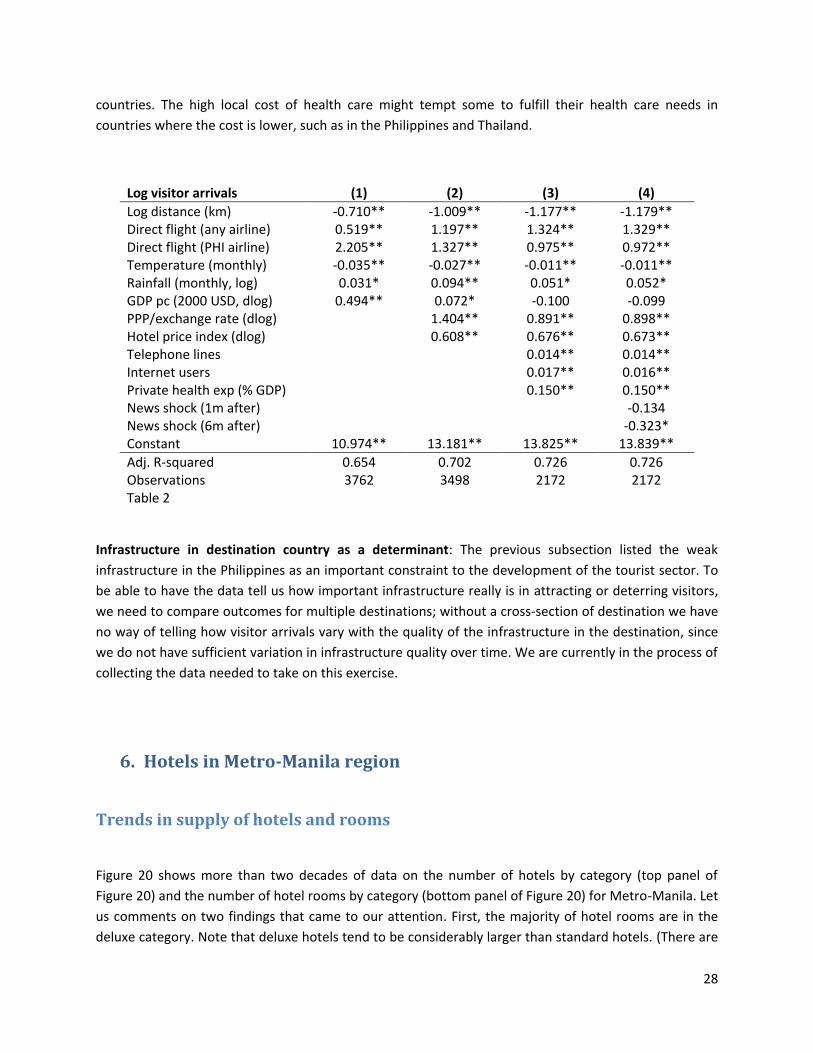
Log visitor arrivals (1) (2) (3) (4)
Log distance (km) -0.710** -1.009** -1.177** -1.179** Direct flight (any airline) 0.519** 1.197** 1.324** 1.329** Direct flight (PHI airline) 2.205** 1.327** 0.975** 0.972** Temperature (monthly) -0.035** -0.027** -0.011** -0.011** Rainfall (monthly, log) 0.031* 0.094** 0.051* 0.052* GDP pc (2000 USD, dlog) 0.494** 0.072* -0.100 -0.099 PPP/exchange rate (dlog) 1.404** 0.891** 0.898** Hotel price index (dlog) 0.608** 0.676** 0.673** Telephone lines 0.014** 0.014** Internet users 0.017** 0.016** Private health exp (% GDP) 0.150** 0.150** News shock (1m after) -0.134 News shock (6m after) -0.323* Constant 10.974** 13.181** 13.825** 13.839**
Adj. R-squared 0.654 0.702 0.726 0.726 Observations 3762 3498 2172 2172 Table 2
Infrastructure in destination country as a determinant: The previous subsection listed the weak
infrastructure in the Philippines as an important constraint to the development of the tourist sector. To
be able to have the data tell us how important infrastructure really is in attracting or deterring visitors,
we need to compare outcomes for multiple destinations; without a cross-section of destination we have
no way of telling how visitor arrivals vary with the quality of the infrastructure in the destination, since
we do not have sufficient variation in infrastructure quality over time. We are currently in the process of
collecting the data needed to take on this exercise.
6. Hotels in Metro-Manila region
Trends in supply of hotels and rooms
Figure 20 shows more than two decades of data on the number of hotels by category (top panel of
Figure 20) and the number of hotel rooms by category (bottom panel of Figure 20) for Metro-Manila. Let
us comments on two findings that came to our attention. First, the majority of hotel rooms are in the
deluxe category. Note that deluxe hotels tend to be considerably larger than standard hotels. (There are

29
more hotels in the standard category, but a smaller number of standard rooms.) The reason for the large
supply of deluxe accommodation arguably signifies that the majority of travel to Manila is business
travel.
Second, mid-range (standard) accommodation is expanding at the expense of budget (economy)
accommodation. This probably means that an increasing number of budget hotels are being upgraded to
standard hotels.
Figure 20: Number of hotels and rooms in Metro-Manila
0
5
10
15
20
25
30
35
40
45
Hotels (Deluxe) Hotels (First Class)
Hotels (Standard) Hotels (Economy)
0
1000
2000
3000
4000
5000
6000
7000
8000
9000
Rooms (Deluxe) Rooms (First Class)
Rooms (Standard) Rooms (Economy)

30
Business travel also seems to provide a more stable demand for accommodation in Manila, judging from
data on occupancy rates shown in Figure 21. Occupancy rates in the deluxe category rarely fall below 50
percent, and are usually much higher than that, unlike the lower-end segment where occupancy rates
are seen to fall to as low as 30 percent (during the 2003-2004 slump following Abu Sayyaf kidnappings
and the SARS outbreak).
Figure 21: Hotel occupancy rates in Metro-Manila
Who stays where?
By lack of visitor survey data that could tell us who stays where, among other things, we regress the
hotel occupancy rates by hotel category on the number of visitor arrivals by country of origin. These
correlations give us an approximate idea of which visitors are occupying what hotels.
Hotel occupancy (Manila) Deluxe First class Standard Economy
China (log visitors) 1.412 4.198** 5.384** 4.625** Hong Kong (log visitors) 6.152** 3.940* 0.557 0.380 Japan (log visitors) 4.607 3.464 1.742 2.012 South Korea (log visitors) 9.135** 7.346** 5.790** 4.626 United States (log visitors) -0.823 -0.338 0.183 8.053** Russia (log visitors) 3.596** 0.902 0.023 -0.545 Constant -155.935** -120.382** -67.578** -137.164**
Adj. R-squared 0.637 0.654 0.844 0.532 Observations 96 96 96 96 Table 3
0.0
10.0
20.0
30.0
40.0
50.0
60.0
70.0
80.0
90.0
100.0
Occupancy (Deluxe) Occupancy (First Class)
Occupancy (Standard) Occupancy (Economy)

31
Visitors from the United States occupy the budget hotels: We hypothesize that the United States has
attracted many Philippine migrants that are showing up in the data as tourists from the United States
visiting their relatives in the Philippines. While these visitors may account for a modest share of receipts,
they have a demand for local goods and services, which means that their expenditure is likely to stay in
the Philippines and stimulate pro-poor growth.
Visitors from Korea occupy a wide range of hotels with the exception of budget accommodation: We
deduce from this that the Korean tourism market largely consists of Korean tourists, students and
retirees etc., with relatively low numbers of Philippine migrants.
Visitors from China occupy lower-end hotels: This is likely to change in the years to come as Chinese
incomes continue to grow. In time, the Chinese hotel occupation patterns may look more like those
from Hong Kong, Korea and Japan. (While none of the coefficients are significant for visitor arrivals from
Japan, the coefficients are largest for the higher-end accommodation).
Visitors from Russia occupy the high-end hotels: The number of visitors from Russia, however, is almost
negligible.
7. Concluding remarks
The Philippine tourism industry is known to be small relative to other destinations in the region.
Stimulating tourism is expected to be an effective vehicle for generating economic growth and reducing
poverty. By dissecting data on monthly visitor arrivals to the Philippines disaggregated by country of
origin, including regressions of the visitor arrivals on a set of determinants, we identified the following
drivers and constraints as being most significant to Philippine tourism: (i) poor international
connectivity, (ii) favorable price competitiveness, (iii) underdeveloped domestic infrastructure, (iv)
security concerns linked to recurring acts of domestic terrorism, and (v) lack of a `brand name’.
Interviews with the Philippine Department of Tourism (DOT), the Chamber of Commerce, and general
managers of some of the leading hotels in Manila were used to inform our analysis.
32
Let us review some of the government’s policies designed to stimulate the Philippines’ tourism industry:
1. Joint efforts of the DOT and Chinese travel agents and airlines have resulted in an expansion of
direct flights between China (Beijing, Shanghai, Nanning, Guangzhou, and Kunming) and the
Philippines (Manila, Clark, and Cebu), which is anticipated to help the Philippines obtain a larger
share of the fast growing Chinese tourism market (see DOT, 2008). We know of no initiatives to
improve the connections to Europe as well as Russia. Without such improvements, these large
tourism markets will likely remain `missed opportunities’ for the Philippines.
2. The DOT has made initiatives to disperse international arrivals to different regional airports in
the Philippines (see DOT, 2008). This has a number of advantages: (a) it resolves some of the
over capacity problems with the main international terminal in Manila, (b) visitors may avoid
being forced to spend a night in Manila en-route to their destination, (c) it relieves the
underdeveloped domestic infrastructure of tourist travel.
3. To the best of our knowledge, decisions have not yet been made on what will be the next main
international terminal of the Philippines. The problem with the current main terminal (NAIA) is
that it is severely outdated and does not have the required capacity to handle current
international visitor arrivals. Clark international airport has been coined as an alternative. It too
would require a major investment to upgrade the airport to international standards. While Clark
has the necessary space to make it the new main terminal, it is located about two hours from
downtown Manila. Without a high-speed train-connection, this may pose a deterrent for many
international travellers.
4. The Philippine government has made investments in its weak ground transport infrastructure a
priority (see e.g. Yi, 2010). In the next few years we should be able to make a first assessment.
5. The new government pledged to tackle corruption and improve the business climate, which will
in particular benefit the inter-sectorial linkages with the tourist sector.
6. The limited marketing budget (in absolute value) means that there are currently no concrete
plans to develop a strong international marketing campaign promoting the Philippines as a
holiday destination. The DOT instead focuses on campaigns targeting a select number of
countries that include Korea and China. Efforts are also made to promote education tourism and
health tourism (see DOT, 2008).
8. References
Christie I. and D. Crompton (2003), “Republic of Madagascar: Tourism sector study”, Africa Region
Working Paper Series 63, The World Bank
DOT (2008), “Philippine Tourism: Stable amidst a global tourism downturn”, Philippine Department of
Tourism, Tourism Statistics Archives
33
Lejarraga I. and P. Walkenhorst (2006), “Of linkages and leakages: How tourism can foster economic
diversification”, mimeo, The World Bank
Mitchell J. and C. Ashley (2010), “Tourism and poverty reduction: Pathways to prosperity”, Earthscan
(publisher), University of Central Lancashire, the United Kingdom
Mitchell J. and A. Shepherd (2006), “Productive strategies for poor rural households to participate
successfully in global economic processes”, report prepared for IDRC, ODI, London
Virola R., M. Remulla, L. Amoro, and Y. Say Milagros (2001), “Measuring the contribution of tourism to
the economy: The Philippine tourism satellite account”, paper prepared for the 8th National Convention
on Statistics, 1-2 October, Manila, the Philippines
Yi S. (2010), “What factors matter for services exports?: The Philippines”, The World Bank