our own action kinematics predict the perceived …eprints.bbk.ac.uk/18243/1/emper ms+supp...
TRANSCRIPT

1
Re-submitted to Journal of Experimental Psychology: Human Perception and Performance as an
Observation on 24th February 2017
Our own action kinematics predict the perceived affective states of others
Rosanna Edey a, Daniel Yon
a, Jennifer Cook
b, Iroise Dumontheil
a, and Clare Press
a*
a Department of Psychological Sciences, Birkbeck, University of London
b School of Psychology, University of Birmingham
*Corresponding author
Address: Department of Psychological Sciences, Birkbeck, University of London, Malet Street,
London, England, WC1E 7HX
Telephone number: +44(0) 20 3073 8007; E-mail address: [email protected]
Words in body of text: 2434 (<2500).
Acknowledgements: We are grateful to Kaat Alaerts for providing the original stimuli and
much useful advice concerning their generation, as well as Nicholas Holmes for advice concerning the
bootstrapping analysis. RE was funded by a graduate teaching assistantship from Birkbeck, University
of London and DY was funded by an ESRC Studentship. JC is supported by the Birmingham Fellows
programme.

2
Abstract
Our movement kinematics provide useful cues about our affective states. Given that our experiences
furnish models that help us to interpret our environment, and that a rich source of action experience
comes from our own movements, the present study examined whether we use models of our own
action kinematics to make judgments about the affective states of others. For example, relative to
one’s typical kinematics, anger is associated with fast movements. Therefore, the extent to which we
perceive anger in others may be determined by the degree to which their movements are faster than
our own typical movements. We related participants’ walking kinematics in a neutral context to their
judgments of the affective states conveyed by observed point-light walkers (PLWs). As predicted, we
found a linear relationship between one’s own walking kinematics and affective state judgments, such
that faster participants rated slower emotions more intensely relative to their ratings for faster
emotions. This relationship was absent when observing PLWs where differences in velocity between
affective states were removed. These findings suggest that perception of affective states in others is
predicted by one’s own movement kinematics, with important implications for perception of, and
interaction with, those who move differently.
Keywords: Action perception; emotion; affective states; point-light walkers; expertise
Public significance statement: The way that we move provides useful cues about our
emotions. For example, we move more quickly than our average speed when we are feeling angry and
more slowly when we are feeling sad. The present study shows that we make judgments about others’
emotional expressions relative to how we move ourselves. To give an example, rather than everyone
interpreting movements of a certain speed as angry, individuals may only think that others feel angry
if these movements are faster than their own typical movement speed. Therefore, we are better placed
to understand the emotions of others who tend to move more similarly to us. These findings have

3
important implications for our understanding of and interactions with clinical and cultural groups
whose movements are dramatically different from our own.
4
1. Introduction
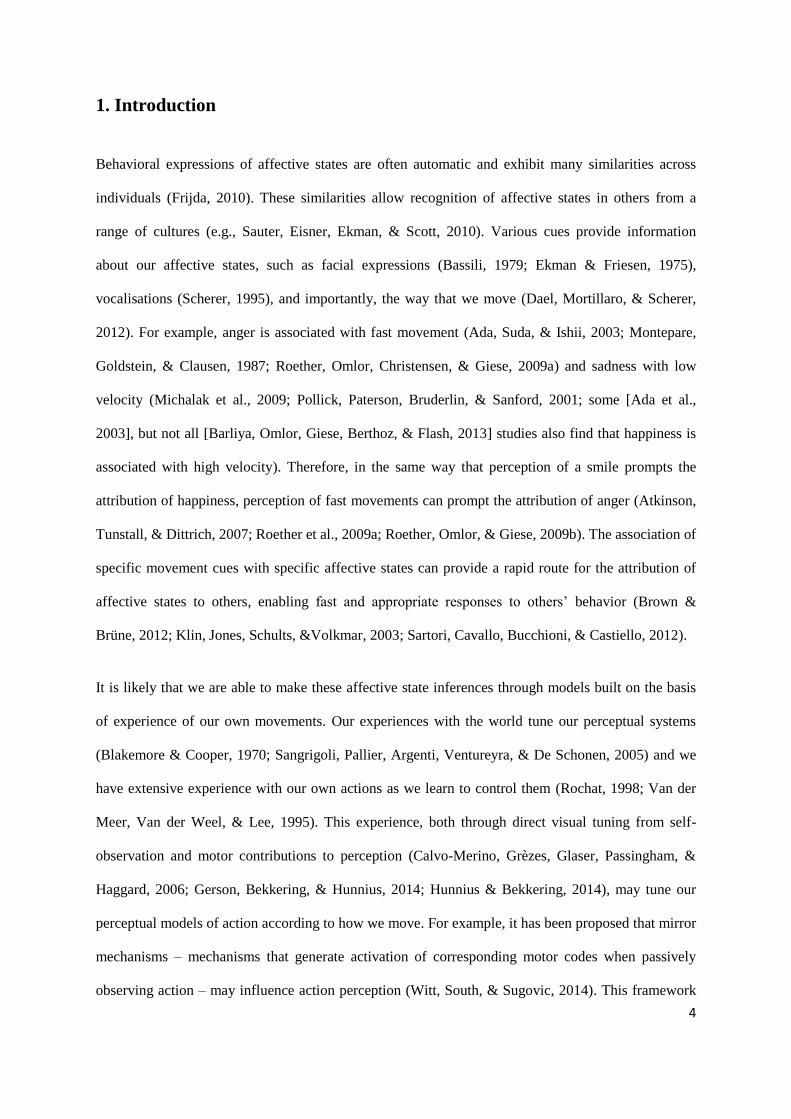
Behavioral expressions of affective states are often automatic and exhibit many similarities across
individuals (Frijda, 2010). These similarities allow recognition of affective states in others from a
range of cultures (e.g., Sauter, Eisner, Ekman, & Scott, 2010). Various cues provide information
about our affective states, such as facial expressions (Bassili, 1979; Ekman & Friesen, 1975),
vocalisations (Scherer, 1995), and importantly, the way that we move (Dael, Mortillaro, & Scherer,
2012). For example, anger is associated with fast movement (Ada, Suda, & Ishii, 2003; Montepare,
Goldstein, & Clausen, 1987; Roether, Omlor, Christensen, & Giese, 2009a) and sadness with low
velocity (Michalak et al., 2009; Pollick, Paterson, Bruderlin, & Sanford, 2001; some [Ada et al.,
2003], but not all [Barliya, Omlor, Giese, Berthoz, & Flash, 2013] studies also find that happiness is
associated with high velocity). Therefore, in the same way that perception of a smile prompts the
attribution of happiness, perception of fast movements can prompt the attribution of anger (Atkinson,
Tunstall, & Dittrich, 2007; Roether et al., 2009a; Roether, Omlor, & Giese, 2009b). The association of
specific movement cues with specific affective states can provide a rapid route for the attribution of
affective states to others, enabling fast and appropriate responses to others’ behavior (Brown &
Brüne, 2012; Klin, Jones, Schults, &Volkmar, 2003; Sartori, Cavallo, Bucchioni, & Castiello, 2012).
It is likely that we are able to make these affective state inferences through models built on the basis
of experience of our own movements. Our experiences with the world tune our perceptual systems
(Blakemore & Cooper, 1970; Sangrigoli, Pallier, Argenti, Ventureyra, & De Schonen, 2005) and we
have extensive experience with our own actions as we learn to control them (Rochat, 1998; Van der
Meer, Van der Weel, & Lee, 1995). This experience, both through direct visual tuning from self-
observation and motor contributions to perception (Calvo-Merino, Grèzes, Glaser, Passingham, &
Haggard, 2006; Gerson, Bekkering, & Hunnius, 2014; Hunnius & Bekkering, 2014), may tune our
perceptual models of action according to how we move. For example, it has been proposed that mirror
mechanisms – mechanisms that generate activation of corresponding motor codes when passively
observing action – may influence action perception (Witt, South, & Sugovic, 2014). This framework

5
could explain findings whereby one’s own actions determine perception of related stimuli (Jordan &
Hunsinger, 2008).
The present study tests for the first time whether participants’ models of their own movements
influence their interpretation of the emotions of others. This hypothesis predicts differences in
affective state perception between participants who move with distinct kinematics. For example, we
may all increase our velocity when we feel angry, and reduce our velocity when we feel sad.
However, a ‘fast mover’ – who typically moves faster than an average person – will move particularly
quickly when they are angry, but when feeling sad their speed might be more comparable to that of an
average person who is not experiencing any strong emotional state (Figure 1A). If this ‘fast mover’ is
using a model of their own kinematics to interpret others’ affective states, another’s fast movements
(conveying anger) are unlikely to be perceived as intensely angry (see Figure 1Aii) because they are
comparable to the fast mover’s own typical movements. However, this person will perceive sad
(slow) movements as intensely sad, because these movements are very different from how they
typically move. Conversely, someone who moves more slowly than average would perceive fast
(angry) movements as more intensely emotional relative to slow (sad) movements (See Figure 1Ai).
Variability in participants’ own typical kinematics was assessed by recording velocity while walking
in a neutral context. In addition, participants viewed emotional (angry, happy or sad) point-light
walker stimuli (PLW, see Figure 1B). The kinematics of these stimuli were either affect-specific (e.g.,
high velocity for angry walkers), or manipulated to converge to neutral kinematics (see Figure 1C).
Participants were asked to rate the extent to which the PLW appeared happy, angry and sad. We
predicted that we would find a linear relationship between one’s own walking kinematics and
affective state judgments of others, such that the faster participants would rate the slower emotions
more intensely relative to the faster emotions. We predicted attenuation of this relationship as the
differences in kinematics between affective states were removed. Findings of this nature would
indicate that our perception of others’ affective cues is determined by our own action models.

6
2. Method
2.1 Participants
This study was first conducted with 41 participants (17 males, aged 20-43 years, M=27.37,
SEM=1.04) recruited from the local university database and the effects reported below were present in
this initial group (see Supplementary Materials). It was subsequently deemed prudent to increase the
sample to 87 (23 males, aged 18-62 years, M=31.37, SEM=1.66) to ensure that effects were not due to
sampling error and the effects were replicated in the 46 new participants (see Supplementary
Materials). Given that the precision of effect size estimation depends primarily on sample size
(Maxwell, Kelley, & Rausch, 2008; Asendorpf et al., 2013) we pooled the participants for optimal
sensitivity, and determined the robustness of the effect with bootstrapping analyses (see
Supplementary Materials). There were no multivariate outliers. All participants gave informed
consent, and procedures received local ethical approval.
2.2 Stimuli
The stimuli were PLWs (Figure 1B) adapted from those developed by Nackaerts et al. (2012). The
original PLWs depicted a male or female actor expressing happy, sad, angry or neutral affective
states, in two different viewpoints (coronal [0°] and intermediate to coronal and sagittal [45°]).
To confirm that kinematic information is used to make affective state judgments, and examine how
this use varies according to one’s own kinematics, we also generated three velocity adapted
animations corresponding to each original emotional animation (original animations are referred to
hereafter as 100% emotion stimuli). The 0% animations exhibited a mean velocity equal to the mean
velocity of the corresponding neutral animation, and 33% and 67% animations exhibited velocities
between the neutral and 100% emotional stimuli (Figure 1C). These manipulations resulted in 48
emotion stimuli.

7
Two random frames from each neutral walker frame-set were also selected, resulting in eight static
control images which contained no affective information – postures were neutral and there was no
kinematic information.
8
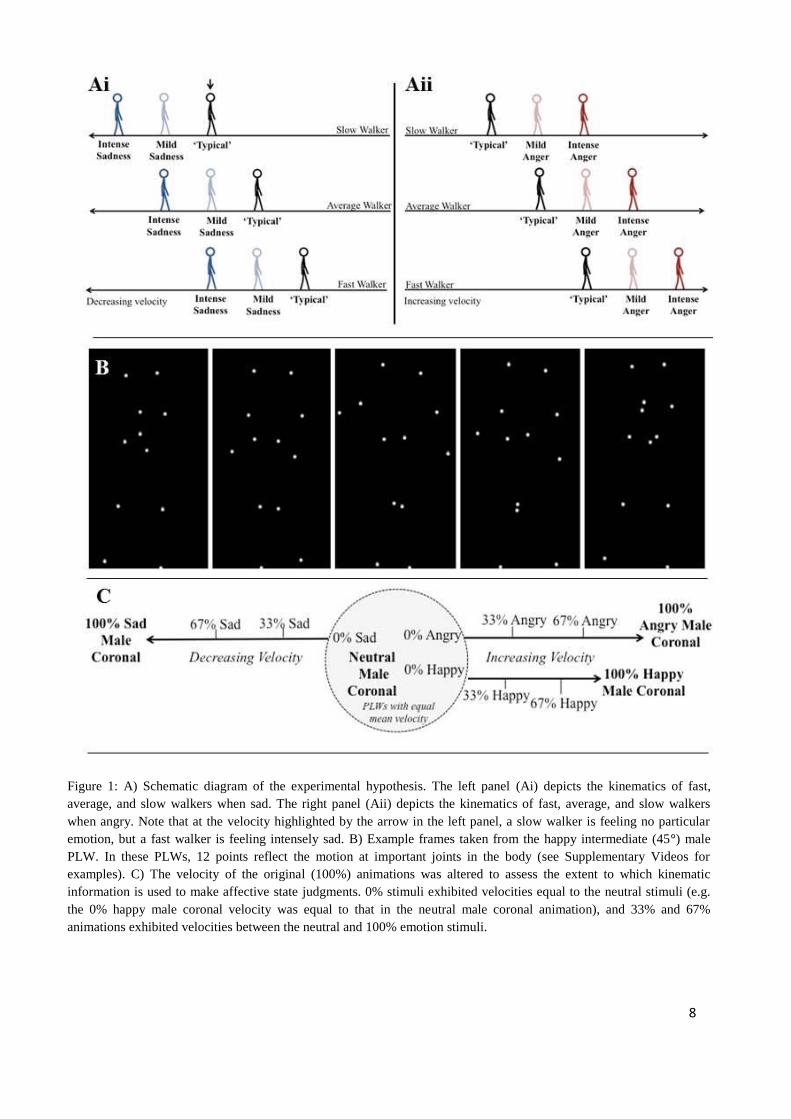
Figure 1: A) Schematic diagram of the experimental hypothesis. The left panel (Ai) depicts the kinematics of fast,
average, and slow walkers when sad. The right panel (Aii) depicts the kinematics of fast, average, and slow walkers
when angry. Note that at the velocity highlighted by the arrow in the left panel, a slow walker is feeling no particular
emotion, but a fast walker is feeling intensely sad. B) Example frames taken from the happy intermediate (45°) male
PLW. In these PLWs, 12 points reflect the motion at important joints in the body (see Supplementary Videos for
examples). C) The velocity of the original (100%) animations was altered to assess the extent to which kinematic
information is used to make affective state judgments. 0% stimuli exhibited velocities equal to the neutral stimuli (e.g.
the 0% happy male coronal velocity was equal to that in the neutral male coronal animation), and 33% and 67%
animations exhibited velocities between the neutral and 100% emotion stimuli.

9
2.3.1 Procedure
All participants first completed emotion perception tasks with the original PLWs, then the velocity
adapted PLWs, and finally the static control images. Participants subsequently performed the walking
task and completed the questionnaire measures1.
2.3.2 Emotion perception tasks
On each trial, the participants were presented with a PLW and asked to rate the extent to which the
walker was expressing one of the three target emotions: happy, angry or sad. The rating scale ranged
from ‘not at all (happy, angry, sad)’ to ‘very (happy, angry, sad)’. Participants clicked on a visual
analogue scale, and responses were recorded on a 0-10 scale (to two decimal places; value not shown
to participants). The initial position of the cursor was randomized for each trial. Participants could
change their response until they pressed a key to continue. The affective state judgment to be made
was blocked, resulting in three separate blocks (happy, angry and sad judgments). All stimuli were
presented once in each block, and the order of the blocks was counterbalanced across participants. In
addition, the order of presentation of the stimuli was randomized for each participant within each
block. Before beginning the study the participants had three practice trials. In each practice trial
participants were asked to rate one of the three emotions and were shown a randomly selected 100%
emotional sagittal PLW.
The procedure was the same when viewing the static control images. On each trial within each of the
three blocks, one of eight images was presented for 2.04 seconds (mean duration of the animations).
These stimuli were used to measure response bias (see Supplementary Materials).
1A fixed order was selected to enable comparability between the testing conditions for all participants and allow
the study of individual differences. It was deemed that the walking task should always be performed after the
emotion perception tasks to minimize the risk that participants were primed to make explicit reference to their
own walking pace during the perception tasks.

10
In the test phase participants were therefore asked to make a total of 48 ratings of the original PLWs,
then 108 ratings of the velocity adapted emotional PLWs, and 24 ratings of the static control images.
2.3.3 Walking task and questionnaires
Participants were instructed to walk continuously between two cones (10 meters apart) at their own
typical walking pace and that they would be told when to stop (after 120 seconds). An iPhone 5c was
attached to the medial side of the participants’ right ankle, and the internal accelerometer was used to
track the precise time taken and distance travelled for each participant, via the Sensor Kinetics Pro©
application. For pre-processing of the walking task data see Supplementary Materials.
To assess any response biases associated with mood (Forgas, 1995; Fiedler, Nickel, Muehlefriedel, &
Unkelback, 2000), all participants rated their current mood (happy, angry and sad) using the same
scale as that used in the emotion tasks, from ‘not at all (happy, angry, sad)’ to ‘very (happy, angry,
sad)’. Sixty-six of the participants also completed the Positive and Negative Affect Schedule-
Expanded form (PANAS-X, Watson & Clark, 1994) to assess trait General Positive and General
Negative Affect.
3. Results
3.1.1 Emotion perception measures
We calculated ‘emotional intensity scores’ (EIS) for each emotion and velocity level (3 emotions x 4
levels). These measures were calculated as the mean rating on the modeled emotion scale (e.g., angry
for the 0%, 33%, 67% and 100% angry stimuli) minus the mean of the two ratings on the non-
modeled emotion scales (happy and sad in this case; the subtraction was performed to isolate
participants’ rating of the modeled emotion from the non-modeled emotions). High EIS scores
indicate that participants judged the PLW as intensely expressing the modeled emotion, while low (or
negative) scores indicate that the PLW is judged as weakly expressing the modeled emotion or

11
expressing a non-modeled emotion. Group-level analyses of performance across different stimulus
types are presented within the Supplementary Materials.
We then calculated composite emotional intensity beta scores (EIBS). The EIBS represent the linear
relationship in intensity scores from the slowest (sad) to the fastest (angry) emotions (via happy). This
score was calculated by modeling the regression slope (β) between animation kinematics and EIS,
such that the predictor values were the mean velocity of the PLWs’ right ankle for each of the three
modeled emotions in the 100% emotion stimuli (see Figure 2A), and the dependent values were the
corresponding EIS. A positive EIBS denotes higher intensity ratings for the faster relative to the
slower emotions and a negative score represents higher intensity ratings for the slower emotions.
3.1.2 Relationship between walking kinematics and emotion perception
To test our primary hypothesis, we performed a Pearson Product Moment Correlation to examine
whether individual differences in walking velocity were related to emotion perception, measured by
our 100% EIBS. In line with our hypotheses, we found a negative relationship (r = -.310, N=87,
p=.003, 95% CI [-.489, -.106]; see Figure 2B) such that participants whose walking kinematics were
faster rated the slower emotions more intensely relative to the faster emotions.
To test whether the kinematic cues in the PLWs mediated this effect, we examined whether a similar
correlation was present between the 0% EIBS (animations with emotional postural information, but
no emotion specific kinematic cues) and walking velocity. There was no relationship between these
variables (r=-.025, N=87, p=.820, 95% CI [-.234, .187]; Steiger test comparing 0% and 100% EIBS
correlation coefficients: z=-2.38, p=.017; see Figure 2C), indicating that the emotion specific velocity
cues are important for the observed relationship between walking velocity and emotion perception.

12
Finally, to ensure that mood did not mediate the observed relationships between walking kinematics
and emotional perception we performed partial correlations, controlling for variability relating to
mood. The analysis controlling for participant’s state mood ratings (happy, sad and angry) showed the
same negative correlations as reported above (100% EIBS: r=-.305, N=87, p=.005, 95% CI [-.485, -
.101], as did that controlling for General Negativity and Positivity on the PANAS-X, in the sub-
sample for whom we had these scores (r=-.337, N=66, p=.006, 95% CI [-.535, -.103]).
Figure 2: A) Mean ankle velocity for animations in each affective category. Error bars represent SEM in
both panels. B) Scatter plot of the negative correlation between the 100% EIBS and the participants’ own
walking velocity. A high 100% EIBS represents participants rating the faster emotions (anger) as more
intense relative to the slower emotions (sadness). C) Scatter plot demonstrating no relationship between the
0% EIBS and participants’ own walking velocity.

13
4. Discussion
This study examined whether an individual’s own movement kinematics predict the perception of
others’ affective states. In line with our predictions, we found that participants who walked with
greater speed rated high velocity (angry) emotions as less intense relative to low velocity (sad)
emotions. This association was abolished when the kinematic information relating to affective state
was removed, and could not be explained by variance related to participants’ state or trait mood.
Such findings provide novel evidence that attributions about others’ covert affective states are
calibrated to one’s own action experiences. Passive action observation has been found to generate
activation of corresponding motor codes, which may contribute to perception (e.g., Witt, South, &
Sugovic, 2014). Observation of walking may therefore be assumed to activate codes for walking at
that velocity oneself, and attribution of an affective state to the observed other may be determined by
the speed of these codes relative to one’s own typical pace. The precise nature of the general
mechanism that links action and perception is a matter of debate, and a variety of versions of an ‘own
action calibration’ mechanism could generate our effects. For example, the effects may be a product
of visual tuning of perceptual models during production of our own actions (Peelen & Dowling,
2007), or may rely upon motor contributions to perception that are not exclusive to observation of
actions per se (Press & Cook, 2015).
The present findings have important implications for our understanding of affect perception between
different populations. The current study predicts that social interactions should be most successful
between interaction partners who move similarly, as greater understanding of others’ internal states is
likely to result in more successful social interactions. For example, differences in the production of
actions may impact cross-cultural affect perception (Hareli, Kafetsios, & Hess, 2015; Matsumoto,
Seung Hee Yoo, & Fontaine, 2008; Quiros-Ramirez & Onisawa, 2015). Consistent with this
speculation, individuals with Autism Spectrum Disorder (ASD), who have a range of social and
communicative impairments, have been shown to move with atypical action kinematics compared to

14
typical individuals, and individuals with the most atypical kinematics are also those with the most
severe social difficulties (Cook, Blakemore, & Press, 2013; Cook, 2016; see also Edey et al., 2016).
The speculation that social interaction may be impaired between interactants who move dissimilarly,
might in part explain a range of social interaction difficulties across various clinical groups associated
with motor atypicalities (e.g., ADHD, Tervo, Azuma, Forgas, & Fiechtner, 2007 and cerebella ataxia
D’Agata et al., 2011).
In conclusion, the present findings suggest that we use models of our own movement kinematics to
make affective judgments about others. This finding may have important implications for perception
of, and interaction with those who move differently.

15
References
Ada, M. S., Suda, K., & Ishii, M. (2003). Expression of emotions in dance: Relation between arm
movement characteristics and emotion. Perceptual and Motor Skills, 97(3), 697–708.
http://doi.org/10.2466/pms.2003.97.3.697
Asendorpf, J. B., Conner, M., De Fruyt, F., De Houwer, J., Denissen, J. J., Fiedler, K., … Perugini,
M. (2013). Recommendations for increasing replicability in psychology. European Journal of
Personality, 27(2), 108–119. http://doi.org/10.1002/per.1919
Atkinson, A. P., Tunstall, M. L., & Dittrich, W. H. (2007). Evidence for distinct contributions of form
and motion information to the recognition of emotions from body gestures. Cognition, 104(1), 59–72.
http://doi.org/10.1016/j.cognition.2006.05.005
Barliya, A., Omlor, L., Giese, M. A., Berthoz, A., & Flash, T. (2013). Expression of emotion in the
kinematics of locomotion. Experimental Brain Research, 225(2), 159–176.
http://doi.org/10.1007/s00221-012-3357-4
Bassili, J. N. (1979). Emotion recognition: The role of facial movement and the relative importance of
upper and lower areas of the face. Journal of Personality and Social Psychology, 37(11), 2049–2058.
http://doi.org/10.1037/0022-3514.37.11.2049
Blakemore, C., & Cooper, G. F. (1970). Development of the brain depends on the visual environment.
Nature, 228(5270), 477–478. http://doi.org/10.1038/228477a0
Brown, E. C., & Brüne, M. (2012). The role of prediction in social neuroscience. Frontiers in Human
Neuroscience, 6m 147. http://doi.org/10.3389/fnhum.2012.00147
Calvo-Merino, B., Grèzes, J., Glaser, D. E., Passingham, R. E., & Haggard, P. (2006). Seeing or
doing? Influence of visual and motor familiarity in action observation. Current Biology, 16(19),
1905–1910. http://doi.org/10.1016/j.cub.2006.07.065
Cook, J. L. (2016). From movement kinematics to social cognition: the case of autism. Phil. Trans. R.
Soc. B, 371(1693), 20150372. http://doi.org/10.1098/rstb.2015.0372
Cook, J. L., Blakemore, S., & Press, C. (2013). Atypical basic movement kinematics in autism
spectrum conditions. Brain, 136(9), 2816–2824. http://doi.org/10.1093/brain/awt208
Cumming, G. (2008). Replication and p intervals: p values predict the future only vaguely, but
confidence intervals do much better. Perspectives on Psychological Science, 3(4), 286–300.
http://doi.org/10.1111/j.1745-6924.2008.00079.x
Dael, N., Mortillaro, M., & Scherer, K. R. (2012). Emotion expression in body action and posture.
Emotion, 12(5), 1085–1101. http://doi.org/10.1037/a0025737
D’Agata, F., Caroppo, P., Baudino, B., Caglio, M., Croce, M., Bergui, M., … Orsi, L. (2011). The
recognition of facial emotions in spinocerebellar ataxia patients. The Cerebellum, 10(3), 600–610.
http://doi.org/10.1007/s12311-011-0276-z
Eddy, C. M., & Rickards, H. E. (2015). Interaction without intent: The shape of the social world in
Huntington’s disease. Social Cognitive and Affective Neuroscience, 10(9), 1228–1235.
http://doi.org/10.1093/scan/nsv012
Edey, R., Cook, J., Brewer, R., Johnson, M. H., Bird, G., & Press, C. (2016). Interaction takes two:
Typical adults exhibit mind-blindness towards those with Autism Spectrum Disorder. Journal of
Abnormal Psychology, 125(7), 879-885. http://dx.doi.org/10.1037/abn0000199
Ekman, P., & Friesen, W. V. (1975). Unmasking the face: A guide to recognizing emotions from
facial clues. Englewood Cliffs, N.J: Prentice-Hall.

16
Fiedler, K., Nickel, S., Muehlfriedel, T., & Unkelbach, C. (2001). Is mood congruency an effect of
genuine memory or response bias? Journal of Experimental Social Psychology, 37(3), 201–214.
http://doi.org/10.1006/jesp.2000.1442
Forgas, J. P. (1995). Mood and judgment: The affect infusion model (AIM). Psychological Bulletin,
117(1), 39–66. http://doi.org/10.1037/0033-2909.117.1.39
Frijda, N. H. (2010). Impulsive action and motivation. Biological Psychology, 84, 570–579. http://doi:10.1016/j.biopsycho.2010.01.005
Gerson, S. A., Bekkering, H., & Hunnius, S. (2014). Short-term motor training, but not observational
training, alters neurocognitive mechanisms of action processing in infancy. Journal of Cognitive
Neuroscience, 27(6) 1–9. http://doi.org/10.1162/jocn_a_00774
Hareli, S., Kafetsios, K., & Hess, U. (2015). A cross-cultural study on emotion expression and the
learning of social norms. Frontiers in Psychology, 6:1501 http://doi.org/10.3389/fpsyg.2015.01501
Hunnius, S., & Bekkering, H. (2014). What are you doing? How active and observational experience
shape infants’ action understanding. Philosophical Transactions of the Royal Society B: Biological
Sciences, 369(1644), 20130490. http://doi.org/10.1098/rstb.2013.0490
Jordan, J. S., & Hunsinger, M. (2008). Learned patterns of action-effect anticipation contribute to the
spatial displacement of continuously moving stimuli. Journal of Experimental Psychology: Human
Perception and Performance, 34(1), 113–124. http://doi.org/10.1037/0096-1523.34.1.113
Kleinsmith, A., De Silva, P. R., & Bianchi-Berthouze, N. (2006). Cross-cultural differences in
recognizing affect from body posture. Interacting with Computers, 18, 1371–1389.
http://doi.org/10.1016/j.intcom.2006.04.003
Klin, A., Jones, W., Schultz, R., & Volkmar, F. (2003). The enactive mind, or from actions to
cognition: Lessons from autism. Philosophical Transactions of the Royal Society B: Biological
Sciences, 358(1430), 345–360. http://doi.org/10.1098/rstb.2002.1202
Matsumoto, D., Hee Yoo, S., & Fontaine, J. (2008). Mapping expressive differences around the
world: The relationship between emotional display rules and individualism versus collectivism.
Journal of Cross-Cultural Psychology, 39(1), 55–74. http://doi.org/10.1177/0022022107311854
Maxwell, S. E., Kelley, K., & Rausch, J. R. (2008). Sample size planning for statistical power and
accuracy in parameter estimation. Annual Review of Psychology, 59, 537–563.
http://doi.org/10.1146/annurev.psych.59.103006.093735
Michalak, J., Troje, N. F., Fischer, J., Vollmar, P., Heidenreich, T., & Schulte, D. (2009).
Embodiment of sadness and depression – gait patterns associated with dysphoric mood.
Psychosomatic Medicine, 71(5), 580–587. http://doi.org/10.1097/PSY.0b013e3181a2515c
Montepare, J. M., Goldstein, S. B., & Clausen, A. (1987). The identification of emotions from gait
information. Journal of Nonverbal Behavior, 11(1), 33–42. http://doi.org/10.1007/BF00999605
Nackaerts, E., Wagemans, J., Helsen, W., Swinnen, S. P., Wenderoth, N., & Alaerts, K. (2012).
Recognizing biological motion and emotions from point-light displays in Autism Spectrum Disorders.
PLoS ONE, 7(9), e44473. http://doi.org/10.1371/journal.pone.0044473
Peelen, M. V., & Downing, P. E. (2007). The neural basis of visual body perception. Nature Reviews
Neuroscience, 8(8), 636–648. http://doi.org/10.1038/nrn2195
Pollick, F. E., Paterson, H. M., Bruderlin, A., & Sanford, A. J. (2001). Perceiving affect from arm
movement. Cognition, 82(2), B51–B61. http://doi.org/10.1016/S0010-0277(01)00147-0
Press, C., & Cook, R. (2015). Beyond action-specific simulation: domain-general motor contributions
to perception. Trends in Cognitive Sciences, 19(4), 176–178. http://doi.org/10.1016/j.tics.2015.01.006

17
Quiros-Ramirez, M. A., & Onisawa, T. (2015). Considering cross-cultural context in the automatic
recognition of emotions. International Journal of Machine Learning and Cybernetics, 6(1), 119–127.
http://doi.org/10.1007/s13042-013-0192-2
Rochat, P. (1998). Self-perception and action in infancy. Experimental Brain Research, 123(1-2),
102–109. http://doi.org/10.1007/s002210050550
Roether, C. L., Omlor, L., Christensen, A., & Giese, M. A. (2009a). Critical features for the
perception of emotion from gait. Journal of Vision, 9(6):15, 1–32. http://doi.org/10.1167/9.6.15
Roether, C. L., Omlor, L., & Giese, M. A. (2009b). Features in the recognition of emotions from
dynamic bodily expression. In U. J. Ilg & G. S. Masson (Eds.), Dynamics of Visual Motion
Processing: Neuronal, Behavioral, and Computational Approaches. (pp. 313–340). Boston, MA:
Springer US. Retrieved from http://link.springer.com/10.1007/978-1-4419-0781-3_14
Sangrigoli, S., Pallier, C., Argenti, A. M., Ventureyra, V. A. G., & De Schonen, S. (2005).
Reversibility of the other-race effect in face recognition during childhood. Psychological Science,
16(6), 440–444. http://doi.org/10.1111/j.0956-7976.2005.01554.x
Sartori, L., Cavallo, A., Bucchioni, G., & Castiello, U. (2012). From simulation to reciprocity: The
case of complementary actions. Social Neuroscience, 7(2), 146–158.
http://doi.org/10.1080/17470919.2011.586579
Sauter, D. A., Eisner, F., Ekman, P., & Scott, S. K. (2010). Cross-cultural recognition of basic
emotions through nonverbal emotional vocalizations. Proceedings of the National Academy of
Sciences, 107(6), 2408–2412. http://doi.org/10.1073/pnas.0908239106
Scherer, K. R. (1995). Expression of emotion in voice and music. Journal of Voice, 9(3), 235–248.
http://doi.org/10.1016/S0892-1997(05)80231-0
Schilbach, L. (2016). Towards a second-person neuropsychiatry. Philosophical Transactions of the
Royal Society B: Biological Sciences, 371(1686), 20150081. http://doi.org/10.1098/rstb.2015.0081
Van der Meer, A. L. H., Van der Weel, F. R., & Lee, D. N. (1995). The functional significance of arm
movements in neonates. Science, 267, 693–695.
Watson, D., & Clark, L. A. (1994). The PANAS-X: Manual for the positive and negative affect
schedule-expanded form. Ames: The University of Iowa.
Witt, J. K., South, S. C., & Sugovic, M. (2014). A perceiver’s own abilities influence perception, even
when observing others. Psychonomic Bulletin & Review, 21(2), 384–389.
http://doi.org/10.3758/s13423-013-0505-1

18
Our own action kinematics predict the perceived affective states of others:
Supplementary Methods and Results
Rosanna Edey, Daniel Yon, Jennifer Cook, Iroise Dumontheil and Clare Press
1. Methods
1.1 Stimuli
Stimuli were approximately 21° visual angle vertically, and 8–17° horizontally, when viewed at the
typical distance of 40cm. Given that the stimuli varied in both length of animation and number of step
cycles, we ran two versions of the experiment, cropping all animations to either the same duration
(2.04s, N=17), or the same number of step-cycles (1.8 cycles; N=69). The findings did not differ
according to the animation type used so analyses are reported collapsed across both versions.
1.2 Pre-processing of walking task data
During the walking task the iPhone was attached to the medial side of the right ankle using a running
strap, and an identical band was attached to the left ankle with an equivalent weight to the iPhone. For
each participant we calculated a mean walking velocity during the walking task. Each participant’s
data were cropped to the beginning of the walking period by visual inspection. The distance walked
(m) was calculated from the accelerometer data as the number of full laps multiplied by 10 (one lap
corresponded to 10 m). The duration was calculated as the difference between the time at which
participants completed the last full lap and the time at which they started walking (deduced from
Sensor Kinetics Pro© timestamps). Mean velocity was calculated as the distance traveled divided by
the time taken. There was no difference in mean velocity between male and female participants
(t(85)=.64, p=.527).

19
Note that the participants’ own walking kinematics could not be precisely compared to those of the
PLWs for several reasons, such as the fact that the kinematics of the animations were two-
dimensional. This limitation precludes the possibility of determining absolute differences between the
kinematics of the observed PLWs and one’s own walking pace. Nevertheless, regardless of the precise
equivalence point, our analyses relate to the fact that the emotional kinematics in the animations will
have been lower /higher relative to the typical kinematics of the fast /slow participants.
2. Results
2.1 Group level results
2.1.1 Static control task
To test for response biases, a one-way ANOVA was conducted on the emotional intensity scores
(EIS) from the static control task. There was a main effect of emotion scale (F(1.84,158.11)=44.12,
p<.001, ηp2=.339), with follow up simple comparisons revealing higher ‘happy’ ratings for the neutral
static images (M=5.28, SEM=.12) compared to both ‘sad’ (M=3.82, SEM=.13, p<.001, 95% CI [1.52,
2.83]) and angry ratings (M=4.19, SEM=.15, p<.001, 95% CI [1.12, 2.13]), with no difference
between ‘angry’ and ‘sad’ ratings (p=.080, 95% [-.046, 1.14]). This effect is indicative of a ‘happy’
response bias. A partial correlation demonstrated that the effect between walking velocity and
emotion perception (100% EIBS) remained when controlling for the happy bias as reflected by this
static control score (r=-.310, N=87, p=.004, 95% CI [-.486, -.110]).
2.1.3 Velocity adaptations
To test whether participants, as a group, were using the kinematic information in the animations to
make their emotion intensity judgments we ran a 3x4 ANOVA with emotion (happy, angry and sad)
and velocity level (0%, 33%, 67% and 100%) as within-participant factors. There was a main effect of
velocity level (F(2.48,213.66)=157.29, p<.001, ηp2=.647). This main effect was accompanied by a

20
linear trend for velocity level (F(1,86)=290.71, p<.001, ηp2=.772), suggesting that as the emotion-
specific velocity information was removed, intensity ratings for the modeled emotion decreased (see
Supplementary Figure 1).
There was also a main effect of emotion (F(2,172)=16.87, p<.001, ηp2=.164) and an emotion x
velocity level interaction (F(4.88,419.93)=25.74, p<.001, ηp2=.230). To examine this interaction
separate ANOVAs were performed for the three emotions with velocity level as the within-participant
factor. For all three analyses there was a main effect of velocity level (sad: F(2.52,217.19)=112.68,
p<.001, ηp2=.588; angry: F(2.52,216.56)=50.05, p<.001, ηp
2=.338; happy: F(2.56,220.21)=17.78,
p<.001, ηp2=.171) and significant linear trends (sad: F(1,86)=230.67, p<.001, ηp
2=.728; angry:
F(1,86)=86.23, p<.001, ηp2=.501; happy: F(1,86)=26.98, p<.001, ηp
2=.239).
These analyses suggest that the kinematic cues are important for detecting all three emotions, with the
interaction driven by greater use for some emotions than others (see Supplementary Figure 1 which
suggests greatest use for the sad animations). These results therefore extend previous findings that
kinematic information determines emotion perception (Atkinson, Tunstall, & Dittrich, 2007; Roether,
Omlor, Christensen, & Giese, 2009a; Roether, Omlor, & Giese, 2009b) by demonstrating that
removing kinematic cues from emotional stimuli decreases the perception of emotion.
Supplementary Figure 1: Emotional intensity scores (EIS) across the four velocity levels for the three emotions.
Shaded areas represent the SEM.

21
2.3 Bootstrapping analysis of relationship between emotion perception and walking kinematics
As outlined in the Main Text, this study was first conducted with 41 participants where we found a
negative relationship between our 100 % EIBS and walking velocity (r=-.335, N=41, p=.032, 95% CI
[-.575, -.042]) and this effect was replicated in the subsequently tested 46 participants (r=-.276, N=46,
one-tailed p=.032, 95% CI [-.032]). Given that the precision of effect size estimation depends
primarily on sample size we pooled the samples for optimal sensitivity (see Main Text). To test the
robustness of the relationship between walking velocity and emotion perception we then performed a
bootstrapping analysis. Using a method of sampling with replacement we generated 10,000 random
samples of 87 from our dataset and calculated the correlation within each sample. This analysis treats
the datapoints as if they are each possible individuals that can be sampled either every time or never,
regardless of how their walking velocity and emotion perception measures covary. Therefore the
robustness of the effect is determined by ensuring that across the 10,000 randomly generated samples
the 95% confidence intervals do not include zero (Cumming, 2008). The distribution of these r values
can be seen in Figure 2. The 95% confidence intervals (highlighted with the blue lines, [-.502, -.089])
do not include zero, thereby demonstrating that the effect is not likely to be a function of the specific
sample tested.
Supplementary Figure 2: Frequency distribution of randomly generated effect sizes (r) using Bootstrapping with
replacement method for the whole sample (N=87). Blue lines indicate the 95% Confidence Intervals of the
effect. The red line indicates the effect size reported in the Main Text.

22
2.3 Relationship between walking kinematics and individual emotion intensity scores
To examine the individual contribution of each emotion to the relationship found between walking
velocity and emotion perception (as measured by the EIBS) reported in the Main Text, we performed
three follow-up correlations. The EIS of angry animations showed a negative relationship with
velocity (r=-.243, N=87, p=.023, 95% CI [-.038, -.429]), and the EIS of sad animations showed a
small numerical, but non-significant positive relationship (r=.126, N=87, p=.245, 95% CI [.325, -
.083]). There was no sign of a relationship between the EIS of happy animations and velocity (r=.062,
N=87, p=.570, 95% CI [.266, -.147]); see Supplementary Figure 2). While one would have predicted
that any unique relationship between happy ratings and walking velocity would have been negative –
given findings that happiness is sometimes associated with high velocity (Ada et al., 2003) – the
absence of a relationship may be unsurprising given the inconsistencies in this finding (Barliya,
Omlor, Giese, Berthoz, & Flash, 2013). Furthermore, although the relationship between sad EIS and
walking velocity did not approach statistical significance the numerical relationship was in the
positive direction that would be expected (see Supplementary Figure 3). The non-significance of this
relationship is perhaps related to the reduced variability in the sad EIS (see Supplementary Figure
3A). It is worth noting that the aim of the present study was to look for overall relationships between
the EIBS and walking velocity and that one should be cautious in drawing emotion-specific inferences
from the present findings.

23
Supplementary Figure 3: Scatter plots showing correlations between participants’ walking velocity and
100% EIS A) Sad EIS showing a non-significant correlation trending in a positive direction, B) Happy EIS
showing no correlation and C) Angry EIS showing a negative correlation.

24
References
Atkinson, A. P., Tunstall, M. L., & Dittrich, W. H. (2007). Evidence for distinct contributions of form
and motion information to the recognition of emotions from body gestures. Cognition, 104(1), 59–72.
http://doi.org/10.1016/j.cognition.2006.05.005
Cumming, G. (2008). Replication and p intervals: p values predict the future only vaguely, but
confidence intervals do much better. Perspectives on Psychological Science, 3(4), 286–300.
http://doi.org/10.1111/j.1745-6924.2008.00079.x
Roether, C. L., Omlor, L., Christensen, A., & Giese, M. A. (2009a). Critical features for the
perception of emotion from gait. Journal of Vision, 9(6):15, 1–32. http://doi.org/10.1167/9.6.15
Roether, C. L., Omlor, L., & Giese, M. A. (2009b). Features in the recognition of emotions from
dynamic bodily expression. In U. J. Ilg & G. S. Masson (Eds.), Dynamics of Visual Motion
Processing: Neuronal, Behavioral, and Computational Approaches. (pp. 313–340). Boston, MA:
Springer US. Retrieved from http://link.springer.com/10.1007/978-1-4419-0781-3_14