opcost: an open-source system for estimating costs of ... with disabilities who require alternative...
TRANSCRIPT

United States Department of Agriculture
DE
PAR TMENT OF AGRICULTU
RE
Forest Service
Pacific Northwest Research Station
General Technical Report PNW-GTR-960
October 2017
OpCost: an Open-Source System for Estimating Costs of Stand-Level Forest Operations Conor K. Bell, Robert F. Keefe, and Jeremy S. Fried
In accordance with Federal civil rights law and U.S. Department of Agriculture (USDA) civil rights regulations and policies, the USDA, its Agencies, offices, and employees, and institutions participating in or administering USDA programs are prohibited from discriminating based on race, color, national origin, religion, sex, gender identity (including gender expression), sexual orientation, disability, age, marital status, family/parental status, income derived from a public assistance program, political beliefs, or reprisal or retaliation for prior civil rights activity, in any program or activity conducted or funded by USDA (not all bases apply to all programs). Remedies and complaint filing deadlines vary by program or incident.
Persons with disabilities who require alternative means of communication for program information (e.g., Braille, large print, audiotape, American Sign Language, etc.) should contact the responsible Agency or USDA’s TARGET Center at (202) 720-2600 (voice and TTY) or contact USDA through the Federal Relay Service at (800) 877-8339. Additionally, program information may be made available in languages other than English.
To file a program discrimination complaint, complete the USDA Program Discrimination Complaint Form, AD-3027, found online at http://www.ascr.usda.gov/complaint_filing_cust.html and at any USDA office or write a letter addressed to USDA and provide in the letter all of the information requested in the form. To request a copy of the complaint form, call (866) 632-9992. Submit your completed form or letter to USDA by: (1) mail: U.S. Department of Agriculture, Office of the Assistant Secretary for Civil Rights, 1400 Independence Avenue, SW, Washington, D.C. 20250-9410; (2) fax: (202) 690-7442; or (3) email: [email protected].
USDA is an equal opportunity provider, employer, and lender.
AuthorsConor K. Bell is a graduate research assistant, Forest Operations Research Lab, University of Idaho, 875 Perimeter Dr., Moscow, ID 83844-1133; Robert F. Keefe is assistant professor of forest operations and director, University of Idaho Experi-mental Forest, 875 Perimeter Dr., Moscow, ID 83844-1133; Jeremy S. Fried is a research forester, U.S. Department of Agriculture, Forest Service, Pacific Northwest Research Station, 620 SW Main St., Suite 400, Portland, OR 97205.
Published in cooperation with the University of Idaho.
Cover photo: Log deck resulting from a mechanical forest thinning operation in Washington Douglas-fir forest. Photo by Robert Keefe.

AbstractBell, Conor K.; Keefe, Robert F.; Fried, Jeremy S. 2017. OpCost: an open-source
system for estimating costs of stand-level forest operations. Gen. Tech. Rep. PNW-GTR-960. Portland, OR: U.S. Department of Agriculture, Forest Service, Pacific Northwest Research Station 23 p.
This report describes and documents the OpCost forest operations cost model, a key component of the BioSum analysis framework. OpCost is available in two editions: as a callable module for use with BioSum, and in a stand-alone edition that can be run directly from R. OpCost model logic and assumptions for this open-source tool are explained, references to the literature used in all of the submodels included in OpCost are provided, and guidance is offered on how to change the default hourly machine rates associated with overall logging cost calculations. OpCost enhance-ments such as cost component breakout, and identifying the least-cost harvest system, are also described and explained.
Keywords: Harvest systems modeling, mechanical fuel treatment logging cost estimation calculator.
Contents 1 Introduction 2 OpCost Framework Overview 3 Estimating Machine Time Required 3 Estimating Machine Cost 4 Estimating Harvest System Cost 4 Enhancements 5 How It Works, in Detail 10 Inputs 10 Transformations 12 Filtering 12 Size Class Specific Versus Total/Average 12 OpCost Workflow 13 Putting It All together 14 OpCost Stand-Alone Edition (SE) 18 Future Directions 19 Acknowledgments 19 English Equivalents 20 Literature Citations
1
OpCost: an Open-Source System for Estimating Costs of Stand-Level Forest Operations
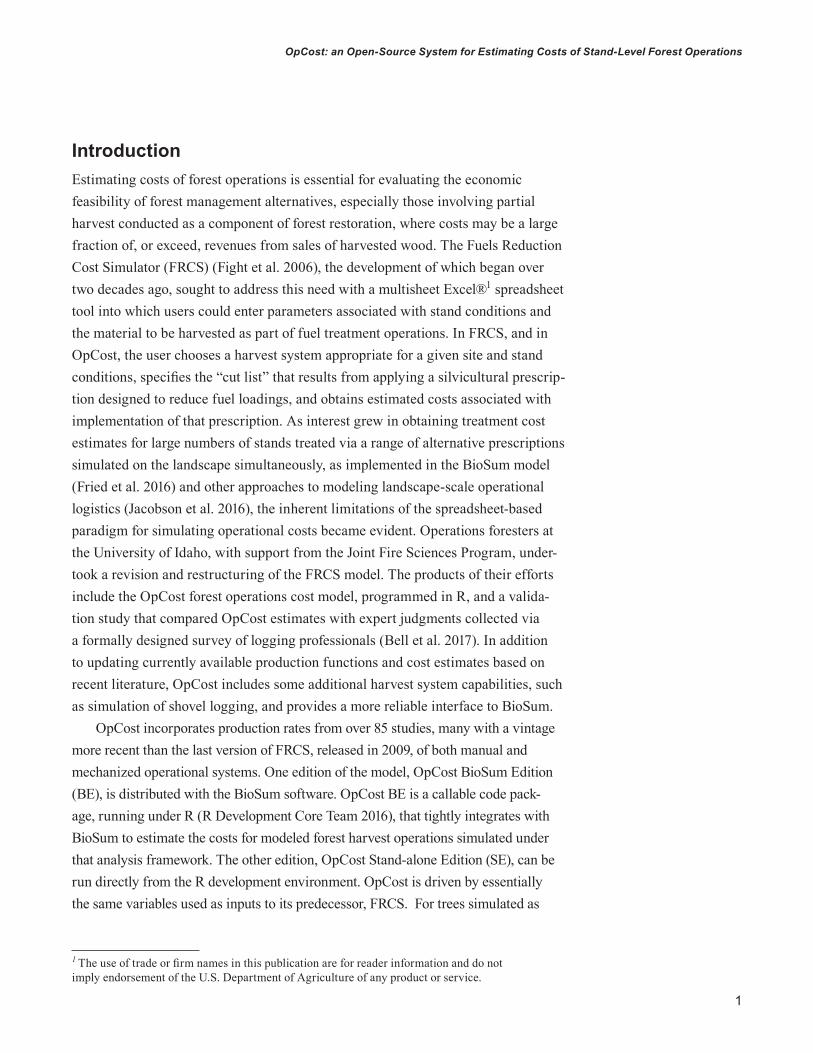
IntroductionEstimating costs of forest operations is essential for evaluating the economic feasibility of forest management alternatives, especially those involving partial harvest conducted as a component of forest restoration, where costs may be a large fraction of, or exceed, revenues from sales of harvested wood. The Fuels Reduction Cost Simulator (FRCS) (Fight et al. 2006), the development of which began over two decades ago, sought to address this need with a multisheet Excel®1 spreadsheet tool into which users could enter parameters associated with stand conditions and the material to be harvested as part of fuel treatment operations. In FRCS, and in OpCost, the user chooses a harvest system appropriate for a given site and stand conditions, specifies the “cut list” that results from applying a silvicultural prescrip-tion designed to reduce fuel loadings, and obtains estimated costs associated with implementation of that prescription. As interest grew in obtaining treatment cost estimates for large numbers of stands treated via a range of alternative prescriptions simulated on the landscape simultaneously, as implemented in the BioSum model (Fried et al. 2016) and other approaches to modeling landscape-scale operational logistics (Jacobson et al. 2016), the inherent limitations of the spreadsheet-based paradigm for simulating operational costs became evident. Operations foresters at the University of Idaho, with support from the Joint Fire Sciences Program, under-took a revision and restructuring of the FRCS model. The products of their efforts include the OpCost forest operations cost model, programmed in R, and a valida-tion study that compared OpCost estimates with expert judgments collected via a formally designed survey of logging professionals (Bell et al. 2017). In addition to updating currently available production functions and cost estimates based on recent literature, OpCost includes some additional harvest system capabilities, such as simulation of shovel logging, and provides a more reliable interface to BioSum.
OpCost incorporates production rates from over 85 studies, many with a vintage more recent than the last version of FRCS, released in 2009, of both manual and mechanized operational systems. One edition of the model, OpCost BioSum Edition (BE), is distributed with the BioSum software. OpCost BE is a callable code pack-age, running under R (R Development Core Team 2016), that tightly integrates with BioSum to estimate the costs for modeled forest harvest operations simulated under that analysis framework. The other edition, OpCost Stand-alone Edition (SE), can be run directly from the R development environment. OpCost is driven by essentially the same variables used as inputs to its predecessor, FRCS. For trees simulated as
1 The use of trade or firm names in this publication are for reader information and do not imply endorsement of the U.S. Department of Agriculture of any product or service.

2
GENERAL TECHNICAL REPORT PNW-GTR-960
harvested, 35 variables account the for the average volume per tree, number of trees harvested per acre, hardwood fraction, merchantable volume as a percentage of total volume and wood density for each of three user-defined tree size classes, along with trees per acre and average tree volume of small (“brush cut” size, in FRCS parlance) trees that are cut but not used. Other inputs include slope and average distance to the nearest landing and, for small and large log trees, the percentage of wood volume transported to the landing that will be chipped owing to its derivation from trees of submerchantable size or noncommercial species. Average travel time, in hours, required to move-in a harvest system equipment component (e.g., a skidder) to the harvest site and operation size, in acres, are required to estimate move-in costs on a per-acre basis.
OpCost greatly streamlines workflow of a batch operation relative to FRCS by eliminating the need to export data to Microsoft (MS) Excel as an intermediate step prior to cost estimation. OpCost is also designed to operate in batch mode, but reads inputs from and writes outputs to MS Access database tables, making it equally easy for users to estimate costs for one stand and treatment or thousands of stands and dozens of treatment alternatives. The integration of OpCost with Bio-Sum produces cost estimates for each analyst-specified combination of silvicultural prescription and harvest system on each inventory plot modeled in BioSum. This facilitates estimates of cost effectiveness for the wide range of fuel treatments on managed forests in the Western United States (e.g., Jain et al. 2012). The system can also estimate harvest costs for implementing any silvicultural prescription, not just those intended to reduce hazardous fuels.
OpCost Framework Overview Production functions in OpCost use, as inputs, the estimated amount of removed or altered material within forest stands based on summary metrics from simulated silvicultural prescriptions that generate a “cut list” in the Forest Vegetation Simulator (FVS) (Dixon 2002) format. These predict, on a per-acre basis, the time and expense required to harvest and process wood volume. In essence, OpCost is an equation fil-tering and aggregation engine that, considering the specifics of a stand, silvicultural treatment to be modeled, and harvest system to be implemented, applies several possible equations extracted from peer-reviewed forest operations literature. These are typically based on past elemental time analysis and work sampling studies that are identified as applicable to the stand and site under consideration; OpCost com-putes the average of the predictions of all applicable equations. By using the regres-sion equations from descriptive studies, OpCost can predict the production rates of the equipment within certain conditions. Applicability is determined by whether an

3
OpCost: an Open-Source System for Estimating Costs of Stand-Level Forest Operations
equation is eliminated from consideration by “rejection” criteria that differ among equations for a given harvesting, extraction, or processing machine. Examples of rejection criteria, which are evaluated for each operation based on whether the OpCost inputs fall within the acceptable range for an equation, include slope, aver-age volume per tree, average distance to landing, whether hardwoods are part of the harvest, average tree diameter, average tree weight, and harvested trees per acre. Nonrejected equations for each machine used in a harvest system advance to the next computation phase. The rejection criteria are based on the range of data over which original studies were evaluated, in order to avoid extrapolation of production or cost functions beyond the range of their source data and intended application.
Estimating Machine Time RequiredA harvest system can be thought of as a collection of the equipment, or machines, and labor required to implement operations under that system. For example, a cable manual whole-tree system typically operates on steep slopes and, after manual tree felling by a sawyer, brings entire trees, including bole, branches and top (as opposed to previously bucked logs) to the landing using a yarder. At the landing, whole trees are processed into merchantable logs and nonmerchantable residues with a processor, which may be either a stroke-boom delimber or danglehead pro-cessor. Logs are then loaded onto log trucks with a loader and residues are chipped and blown into a chip van. Thus, this system involves five machines: manual fell-ing (sawyer with a chainsaw), yarder, processor, loader, and chipper, each of which may have up to a dozen or more published equations that could be used to predict the time required per unit of trees or volume handled. Given the diversity of study purposes and locales behind the published equations, and differences in the factors affecting costs for different machines, tree units differ among machines and among studies. Wood characteristics tracked by the model may be expressed on a volume or mass basis, depending on the relevant production function and study. Volumes may be expressed in cubic feet, board feet, cords or cubic meters, and mass values may be in pounds or kilograms. Times are summed across size classes, and these sums are then combined into the mean time in hours per acre.
Estimating Machine CostOnce total machine working time has been adjusted into hours per acre, machine cost per acre is computed as the product of hours and machine cost rates, which are based on conventional cost control processes (Matthews 1942). Calculations occur in productive machine-hours (PMH) and follow-ing convention in forest operations studies, a utilization rate is assigned to distinguish between production and delay time. Because OpCost generates

4
GENERAL TECHNICAL REPORT PNW-GTR-960
estimates at a stand level, without regard to stand location, it cannot assign location-specific move-in costs associated with each machine’s use. However, when using OpCost within a BioSum analysis, per-acre move-in costs can be accounted for based on travel time to wood processing facilities (a parameter calculated as part of the BioSum workflow and a viable proxy for move-in time) and assumed stand area undergoing treatment. Move-in costs could also be affected by the locations of scheduled work in a particular year; however, this level of detail is beyond the scope of OpCost and BioSum and is not addressed. Wherever available, machine rates include fixed and vari-able costs associated with owning and operating the equipment. These have been updated with current estimates (Dodson et al. 2015). Default machine cost rates, developed for the Pacific Northwest region, are supplied in the OpCost code, but can be changed by the user, if desired and necessary, via a straightforward text edit to the open source model code (for OpCost BE) or to the appropriate input table (for OpCost SE).
Estimating Harvest System CostAfter machine cost estimates are complete, harvest cost per acre can be calculated as the sum of each of the predicted machine-specific treatment costs associated with the harvest system working in the BioSum-supplied site and stand conditions. For the cable manual whole-tree system example, this would be the sum of treatment costs per acre for sawyer, yarder and carriage combination, processor, loader, and chipper. Treatment cost accounts for both the machine rates and the production rates for each piece of equipment. Production rates are typically expressed in tons per PMH or thousand board feet (MBF) per PMH and provide predictions of the total treatment time required by each piece of equipment to treat volume removed per acre. See, for example, Keefe et al. (2014) for further description of the relationship between machine rates, production rates, and treatment costs. Move-in cost, derived from the number of machines transported to the harvest site and assumptions that account for delays in setting up equipment, when applicable, is added to obtain the final harvest cost reported in the table OpCost_Output. That table also contains calculated move-in cost in a separate column to better inform the analyst wishing to consider, for example, savings that might accrue from consolidating forest operations.
EnhancementsA significant enhancement compared to FRCS is the simultaneous estimation of costs for multiple, potentially more cost-efficient harvest systems. These estimates can be compared to the costs of the analyst-specified harvest system, replacing
5
OpCost: an Open-Source System for Estimating Costs of Stand-Level Forest Operations
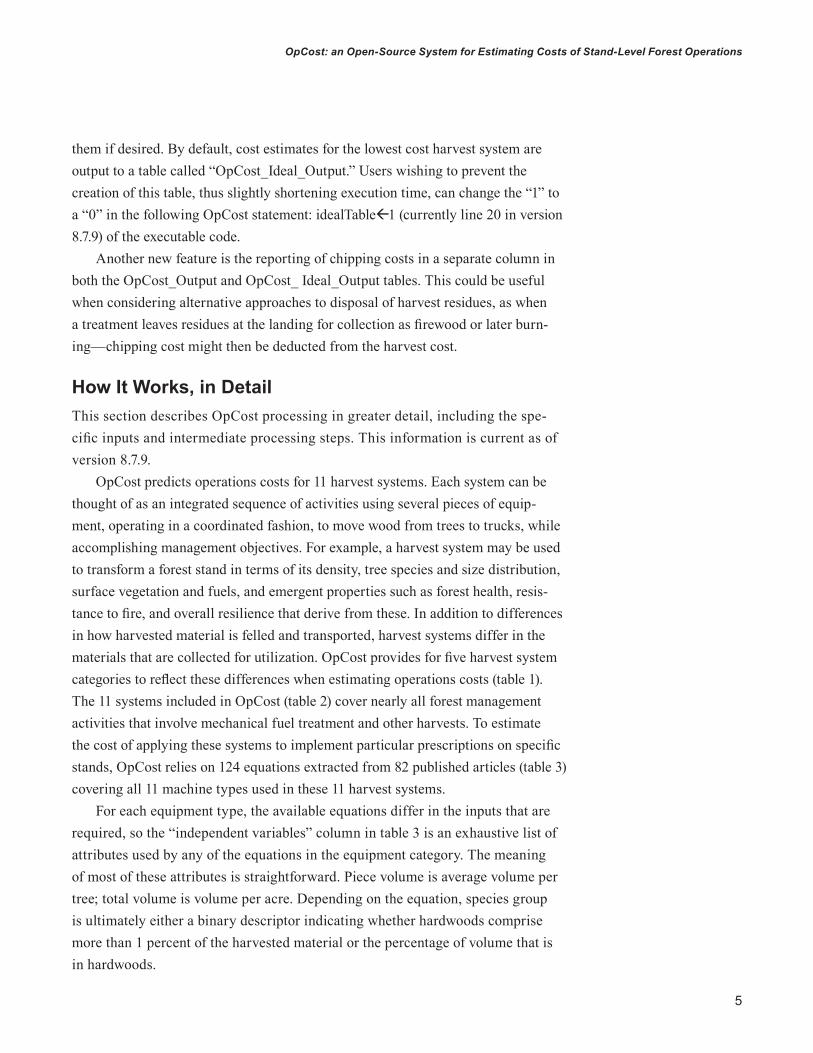
them if desired. By default, cost estimates for the lowest cost harvest system are output to a table called “OpCost_Ideal_Output.” Users wishing to prevent the creation of this table, thus slightly shortening execution time, can change the “1” to a “0” in the following OpCost statement: idealTable1 (currently line 20 in version 8.7.9) of the executable code.
Another new feature is the reporting of chipping costs in a separate column in both the OpCost_Output and OpCost_ Ideal_Output tables. This could be useful when considering alternative approaches to disposal of harvest residues, as when a treatment leaves residues at the landing for collection as firewood or later burn-ing—chipping cost might then be deducted from the harvest cost.
How It Works, in DetailThis section describes OpCost processing in greater detail, including the spe-cific inputs and intermediate processing steps. This information is current as of version 8.7.9.
OpCost predicts operations costs for 11 harvest systems. Each system can be thought of as an integrated sequence of activities using several pieces of equip-ment, operating in a coordinated fashion, to move wood from trees to trucks, while accomplishing management objectives. For example, a harvest system may be used to transform a forest stand in terms of its density, tree species and size distribution, surface vegetation and fuels, and emergent properties such as forest health, resis-tance to fire, and overall resilience that derive from these. In addition to differences in how harvested material is felled and transported, harvest systems differ in the materials that are collected for utilization. OpCost provides for five harvest system categories to reflect these differences when estimating operations costs (table 1). The 11 systems included in OpCost (table 2) cover nearly all forest management activities that involve mechanical fuel treatment and other harvests. To estimate the cost of applying these systems to implement particular prescriptions on specific stands, OpCost relies on 124 equations extracted from 82 published articles (table 3) covering all 11 machine types used in these 11 harvest systems.
For each equipment type, the available equations differ in the inputs that are required, so the “independent variables” column in table 3 is an exhaustive list of attributes used by any of the equations in the equipment category. The meaning of most of these attributes is straightforward. Piece volume is average volume per tree; total volume is volume per acre. Depending on the equation, species group is ultimately either a binary descriptor indicating whether hardwoods comprise more than 1 percent of the harvested material or the percentage of volume that is in hardwoods.

6
GENERAL TECHNICAL REPORT PNW-GTR-960
Table 1—Utilization of wood in tops and limbs varied by harvest system category and slope
Harvest system category Slope Outcome for tops and limbs1 Low Left in the woods2 Low Forwarded to landing for chipping3 High Left in the woods4 Any Except for large log trees, forwarded to landing
for chipping5 Any Forwarded to landing for chipping only when size
is submerchantable or species is noncommercial
Table 2—Harvest systems options available in the OpCost model and the equipment types used in each system
Harvest system name Equipment types usedHarvest system
categoryGround-based manual whole tree Sawyer, skidder, processor, loader, chipper 2Ground-based mechanical whole tree Feller-buncher, skidder, processor, loader, chipper 2Ground-based cut to length (CTL) CTL harvester, forwarder, loader, chipper 1Ground-based manual log Sawyer, forwarder, loader, chipper 1Cable manual whole tree Sawyer, yarder, processor, loader, chipper 4Cable manual whole tree/log Sawyer, feller-buncher, processor, loader, chipper
Note: all large trees are assumed to be manually bucked into logs prior to yarding
5
Cable manual log Sawyer, yarder, loader, chipper 3Cable CTL CTL harvester, yarder, loader, chipper 1Helicopter manual whole tree Helicopter, sawyer, processor, loader, chipper 3Helicopter CTL Helicopter, CTL harvester, loader, chipper 1Shovel manual whole tree Shovel, sawyer, processor, loader, chipper 4

7
OpCost: an Open-Source System for Estimating Costs of Stand-Level Forest Operations
Table 3—OpCost source of equations to estimate machine time requirements for forest harvest operations by machine type, and input variables equations draw from as independent variables for predicting machine time per unit tree volume or mass
References for production equations by machine type Required independent variablesSawyer:
Behjou and Majnounian 2009 Diameter at breast height (d.b.h.)Ghaffariyan et al. 2012 Total volumeHartsough et al. 2001 Piece volumeKlepac et al. 2011 Distance between treesKluender and Stokes 1996 SlopeLortz et al. 1997Visser and Spinelli 2012Wang et al. 2004
Cut-to-length (CTL) harvester:Acuna and Kellogg 2013 D.b.h.Adebayo et al. 2007 SlopeBerhongaray et al. 2013 Trees/acreBolding et al. 2002 Total volumeBolding and Lanford 2001 Piece volumeDrews et al. 2001 Species groupEliasson 1999 Distance between treesHiesl 2013Hiesl and Benjamin 2012Jiroušek et al. 2007Kärhäet et al. 2004Jiroušek et al. 2007Keegan et al. 2002Klepac et al. 2006Klepac et al. 2011Numinen et al. 2006Visser and Spinelli 2012
Skidder:Adebayoet al. 2007Bolding et al. 2002 D.b.h.Boswell 1998 Piece volume Ghaffariyan et al. 2012 Species groupHiesl and Benjamin 2012 One-way yarding distanceKeegan et al. 2002 Total volumeKluender and Stokes 1996 Trees/acre

8
GENERAL TECHNICAL REPORT PNW-GTR-960
Table 3—OpCost source of equations to estimate machine time requirements for forest harvest operations by machine type, and input variables equations draw from as independent variables for predicting machine time per unit tree volume or mass (continued)References for production equations by machine type Required independent variables
Wang et al. 2004 SlopeFeller-buncher: D.b.h.Adebayo et al. 2007 Distance between treesBerhongaray et al. 2013 Piece volumeBolding and Lanford 2001 Trees/acreBoswell 2001 Species groupDykstra 1976 Trees/acreHartsough et al. 1997 SlopeHartsough et al. 1997Hartsough et al. 2001Hiesl 2013Hiesl and Benjamin 2012Kärhä et al. 2004Kluender and Stokes 1996Spinelli et al. 2007Wang et al. 2004
Helicopter:Christian and Brackley 2007 Piece weightDykstra 1976 One-way yarding distanceFlatten 1991 ElevationFlatten 1991 Piece volume
Trees/acreForwarder:
Acuna and Kellogg 2013 One-way yarding distanceBolding et al. 2002 Piece volumeBolding and Lanford 2001 SlopeDrews et al. 2001 Trees/acreDykstra 1976 Total volumeHiesl 2013 D.b.h.Jiroušek et al. 2007 WeightJiroušek et al. 2007Kluender and Stokes 1996Numinen et al. 2006Sirén and Aaltio 2003

9
OpCost: an Open-Source System for Estimating Costs of Stand-Level Forest Operations
Table 3—OpCost source of equations to estimate machine time requirements for forest harvest operations by machine type, and input variables equations draw from as independent variables for predicting machine time per unit tree volume or mass (continued)References for production equations by machine type Required independent variablesCable:
Drews et al. 2001 Trees/acreAubuchon 1982 SlopeDykstra 1976 Piece volumeBoswell 2001 Piece weightLeDoux 1987 One-way yarding distanceHartsough et al. 2001Huyler and LeDoux 1997
Chipper:Bolding et al. 2002 Piece volumeBolding and Lanford 2001 Species groupCuchet 2004 D.b.h.Spinelli and Magagnotti 2014
Shovel:Fisher 1986 One-way yarding distanceSessions and Boston 2013 ElevationWang and Haarlaa 2002 Piece volume
Piece volumeTrees/acreWeight
Stroke-boom delimber:Ghaffariyan et al. 2012 Piece volumeSpinelli and Hartsough 2006 D.b.h.Hiesl 2013 Species groupSpinelli and Magagnotti 2010

10
GENERAL TECHNICAL REPORT PNW-GTR-960
InputsBioSum initiates an instance of R, passing to it the OpCost BE filename and the name of an Access file that contains all input data in a table named opcost_input. This table consists of 36 attributes per stand (table 4). In general, but with a few exceptions for size classes, where some are not needed, there is a quintet of harvested tree descriptors for each of four size classes defined by the user in BioSum, plus a few site descriptors. Note that the size class definitions themselves (in terms of minimum and maximum diameter at breast height [d.b.h.]) are not passed to, or needed by, OpCost. The four size classes are brush cut (BC), chip trees (CT), small log trees (SLT) and large log trees (LLT). Each of these size classes is determined by the analyst. The BC trees are harvested but not used, so OpCost accounts only for the costs of their felling. The CT boles are assumed to be used as “dirty” chips (with bark not removed before chipping) and have no merchantable value that would exceed their value as dirty chips; limbs are also used as chips when whole-tree harvest systems are used. To account for the costs of chipping trees in the SLT and LLT size classes that are noncommercial species not used to produce merchantable wood products, inputs to OpCost include the percent of log volume that would be chipped. These “chip percent” parameters are provided for each of three groups of harvest system categories, because the chip percentages vary depending on exactly what material (e.g., boles-only or tops and limbs also) gets transported to the landing, for example, depending on system, size and species. Tops and limbs that harvest systems do not bring to the landing are assumed to be left in the woods and incur no chipping costs. Note that average tree volumes provided as inputs to OpCost are total volumes, including tops and limbs.
TransformationsA comparison of the variables listed in table 3 (required input variables) and table 4 (OpCost inputs) shows that while most are aligned, there are some required vari-ables not provided by BioSum. As each stand is processed, OpCost effects trans-formations to ensure that the input requirements for all 124 equations can be met. For example, OpCost estimates average d.b.h., which is required by at least some production functions for most equipment types, by inverting formulas associated with common log scale rules such as the international ¼-inch rule (Grosenbaugh 1952) and Scribner’s Decimal C (Bruce and Schumacher 1950), to predict d.b.h. from BioSum-supplied average volume per tree. In several cases, it is necessary to estimate average intertree distance (which is required by at least some of the sawyer, CTL harvester, and feller-buncher equations) from trees per acre (TPA) supplied by BioSum. Mean inter-tree distance is estimated from TPA as follows:
Intertree distance = Because some equations estimate time required per unit mass, OpCost calculates
mass per acre, by tree size class and in total, by multiplying BioSum-supplied average

11
OpCost: an Open-Source System for Estimating Costs of Stand-Level Forest OperationsTable 4—OpCost inputs and what they mean
Column Input Item Description1 Stand Stand identifier (condition id + rxPackage + rx + rxCycle)2 Percent slope Slope 3 One-way yarding distance Distance in feet between volume centroid of the stand and nearest road4 YearCostCalc Year of harvest (used only in OpCost stand-alone edition)5 Project elevation Stand elevation in feet above mean sea level6 Harvesting system Name of harvest system7 Chip trees per acre Trees per acre (TPA) of chip trees8 Chip trees Merch As Pct Of Total Percentage of chip tree volume in merchantable-sized wood (used for
harvest systems that do not recover tops and limbs)9 Chip trees average volume(ft3) TPA weighted average of total volume10 Chip trees average density (lb/ft3) TPA and volume weighted average wood density of all chip trees11 Chip tree hardwood percent TPA and volume weighted percentage of chip tree volume that is in
hardwoods12 Small log trees per acre TPA of small log trees13 Small log trees Merch As Pct Of Total Percentage of small log volume in merchantable-sized wood14 Small log trees ChipPct_Cat1_3 Percentage of harvested small log volume that will be chipped under harvest
systems in category 1 or 315 Small log trees ChipPct_Cat2_4 Percentage of harvested small log volume that will be chipped under harvest
systems in category 2 or 416 Small log trees ChipPct_Cat5 Percentage of harvested small log volume that will be chipped under harvest
systems in category 517 Small log trees total average volume(ft3) TPA weighted average total volume per small log tree18 Small log trees average density(lb/ft3) TPA and volume weighted average wood density of small log tree volume19 Small log trees hardwood percent TPA and volume weighted percentage of small log tree volume that is in
hardwoods20 Large log trees per acre TPA of large log trees21 Large log trees Merch As Pct Of Total Percentage of large log tree volume in merchantable-sized wood22 Large log trees ChipPct_Cat1_3_4 Percentage of harvested large log tree volume that will be chipped under
harvest systems in category 1 or 3 or 423 Large log trees ChipPct_Cat2 Percentage of harvested large log tree volume that will be chipped under
harvest systems in category 224 Large log trees ChipPct_Cat5 Percentage of harvested large log tree volume that will be chipped under
harvest systems in category 525 Large log trees total average vol(ft3) TPA weighted average total volume per large log tree26 Large log trees average density(lb/ft3) TPA and volume weighted average wood density of all the large log tree
volume27 Large log trees hardwood percent TPA and volume weighted percentage of large log tree volume that is in
hardwoods28 BrushCutTPA TPA of brush cut trees29 BrushCutAvgVol TPA weighted average bole+branch volume of brush cut trees30 RxPackage_Rx_RxCycle Code indicating silvicultural sequence, prescription and Forest Vegetation
Simuator cycle under which trees were harvested31 BioSum_cond_id Needed for table joins32 Rxpackage Needed for table joins33 rx Needed for table joins34 rxcycle Needed for table joins35 Move-in hours Time required to move in and setup logging equipment36 Harvest area assumed acres Area assumed for the size of the harvest operation

12
GENERAL TECHNICAL REPORT PNW-GTR-960
wood density by average tree volume and TPA. Depending on the referenced equa-tions used, some volumes are converted to cubic feet, board feet, or cords per acre. All volumes and masses are also converted to metric units (cubic meters per hectare or kilograms per hectare) to fulfill the requirements of equations defined in metric units.
FilteringWhen processing each stand, OpCost applies the rejection criteria associated with each of the 124 equipment equations to eliminate equations deemed unsuitable for estimating costs for that stand. Typically, these rejection criteria are derived from the range of an attribute reflected in the empirical data on which an equation was fit. Any of the attributes may be the basis for rejection criteria. For CTL harvesters and feller-bunchers, d.b.h. is an important filter; for yarders, distance to landing and slope might be attributes with rejection criteria, but the criteria will differ among equipment types and among equations for a given equipment type, thus the sets of equations used for any two stands that are in some respects similar, may still differ.
Size Class Specific Versus Total/AverageEquations differ as to whether or not they take stand-level- or size-class-specific inputs, even for a given equipment type. For those that operate with individual size classes (e.g., CT, SLT, and LLT), harvested tree descriptors such as average volume and TPA are processed for a specific size class to obtain equipment time associ-ated with that size class. Ultimately, the equipment times for all size classes are summed. With mixed systems, for example, when only large log trees are manually felled, sawyer equations would use only the LLT descriptors. Because the require-ments differ among equations, OpCost calculates overall stand averages and totals for all harvested trees, as noted under “Transformations” above, so that these are available for the equations that rely on them.
OpCost WorkflowFor a given equipment type, OpCost calls a machine-specific function. For a yarder time estimate, for example, it would call the yarder function, passing two arguments: the input variables generated by BioSum via the opcost_input table and the list of candidate production functions for that equipment. Parsing each opcost_input record, that function would reject inappropriate yarder equations, create the necessary trans-formed attributes, estimate yarder times per unit of material for all the appropriate equations, and adjust time per tree unit to time per acre for each tree size class sepa-rately, if necessary. It would then sum across size classes, compute the average over estimates from all yarder equations, multiply the estimated time per acre by yarder unit cost in dollars per hour, and return that cost component to be used when adding up the cost of all machines used on that stand, at that time, with that harvest system.

13
OpCost: an Open-Source System for Estimating Costs of Stand-Level Forest Operations
When using OpCost SE, harvest year can be included as an input and option-ally, if a discount (interest) rate is provided, harvest cost estimates can be expressed in present or future value terms. When using OpCost BE with BioSum, discounting and inflation considerations are handled within the BioSum modeling framework.
Putting It All togetherFigure 1 summarizes the seven major processing steps that occur within OpCost to compute the multiple components of harvest cost and combine them into an estimate of complete harvest cost per acre. Model output is deterministic in that a given set of stand inputs will always produce the same results as long as the same forest vegitation simulator (FVS) stand projection (output) data are included. Note that, apart from BioSum, users sometimes choose to run FVS in a stochastic mode. Thus, OpCost users that repeat growth and yield predictions for the same stand multiple times in FVS prior to postprocessing with OpCost should expect that projected stand conditions may differ owing to inclusion of random numbers in underlying FVS code. This, in turn, may result in variability among associated OpCost treatment cost estimates.
Figure 1—Example of workflow within OpCost to estimate complete harvest cost for a stand harvested via ground-based mechanical whole-tree harvest system.
2. Select equipment: e.g., feller-buncher, skidder, processor, loader, chipper.
1. Stand input: Read in 37 summary attributes, including harvest system (e.g., ground-based mechanical whole tree).
3. Apply rejection criteria to each candidate equation: For each equipment type, e.g., for a feller-buncher, for each equation, for which of the associated production equations do stand parameters not fall within the required range for the equation? Reject these.
4. Estimate machine time: For an equation and tree size class, compute feller-buncher time per tree, e.g.: 24.796 + 0.31419*DBH2. Compute feller-buncher time per acre: Time per tree × TPASum time per acre for all size classes. Average delay-free time per acre across all applicable feller-buncher equation results.
5. Estimate machine cost: Multiply time per acre by a calculated machine rate that accounts for fixed and variable costs to obtain a cost per acre for that machine.
6. Repeat 4 and 5:For all other machines used in a system (e.g., skidder, processor, loader, chipper).
7. Estimate complete harvest cost:Sum per acre machine costs for all machines used in the system, e.g., for feller-buncher, skidder, processor, loader, and chipper. Return this total harvest cost to BioSum.

14
GENERAL TECHNICAL REPORT PNW-GTR-960
OpCost Stand-Alone Edition (SE)OpCost SE is designed to operate without BioSum, and relies on an installed ver-sion of R 3.0 or greater (R Development Core Team 2016), with the R (language) Open Database Connectivity (RODBC) (Ripley and Lapsley 2016), Shiny (Chang et al. 2016), and ggplot2 (Wickham 2009) packages installed and loaded. There are three required script files that are available for download, and all three files should be saved to a single reference folder in the analyst’s computer. The files are called ui.r, server.r, and OpCostShiny.r. These files are available at the following URL: http://www.uidahoforestoperations.com/forest-operations-modeling.html. Each R script needs to be stored in the same directory on the user’s computer so the server code can locate the other files. After the files have been loaded, they are then available to open in the R environment using either the R console or a develop-ment environment such as RStudio. The user then runs the Shiny-based OpCost Graphical User Interface in R and the app will appear in the computer’s default web browser (tested with Internet Explorer) allowing for a simple, interactive and intuitive user interface. The inputs are the same as for OpCost BE and can be stored in either comma or space delimited text files.
Once the application is open in the browser window, the user begins by navigat-ing to and selecting the input file. A progress bar provides feedback as this data is loaded and processed, typically within seconds. When the progress bar achieves 100 percent, the estimated costs per acre using the harvest system chosen by the user will appear in a table, with one row per stand ID and prescription year. Each table generated by OpCost may be selected and copied or downloaded as a text file using the table buttons. After the table appears, the user also has the option of selecting the “ideal” table, present cost of future treatments, and ideal present costs of future treatments. The present cost and ideal present cost tables contain the dis-counted costs of harvest prescribed for a future year. The analyst also has the ability to select a different state, with different assumed machine rates, or can designate custom machine rates using the third tab of the interface by selecting the designated check box, which activates the custom machine rate table (figs. 2, 3, and 4).

15
OpCost: an Open-Source System for Estimating Costs of Stand-Level Forest Operations
Figure 2—Initial “Tables” page in OpCost stand-alone.

16
GENERAL TECHNICAL REPORT PNW-GTR-960
Each loaded table actively updates as an analyst adjusts prescription year or machine rates, streamlining the process for experimenting with different scenarios. After creating these tables, the analyst can proceed to the figures page where each of the tables previously created can be displayed graphically. The figures page also provides a graphical cost comparison of the analyst-defined harvest system and the system estimated by OpCost as the lowest cost alternative. Note that figures will only be viewable after tables have been created. Figures can be copied and pasted to a separate document, or saved to a disk, using the menu options that appear when right-clicking on the image.
To run another set of stand operations without starting a new session, save the output data, if desired, before loading a new dataset. OpCost SE does not automatically save outputs to files or maintain previous estimates in memory, so any information from the previous analysis will be overwritten when new data are loaded. All output tables and figures will also be lost if exiting the program without first saving these to disk.
Figure 3—The “Custom Cost” page in OpCost stand-alone edition.

17
OpCost: an Open-Source System for Estimating Costs of Stand-Level Forest Operations
Figure 4—The “Plots” page of the OpCost stand-alone edition.

18
GENERAL TECHNICAL REPORT PNW-GTR-960
Future Directions OpCost’s adaptable design enables it to handle a wide variety of systems and to accommodate new systems yet to be developed. Development is underway to enable production rates for new kinds of equipment to be implemented by entering the parameter and predictor variables associated with production and machine rates for new equipment and systems into a preformatted Excel table. The production func-tion supplied should include output in total treatment time (delay-free productive machine hours), expressed on a per-acre basis. Users should also supply the key com-ponents of equipment machine rates: purchase price, utilization rate, etc (See, e.g., Brinker et al. 2002 for a description of machine rate calculations). The user-supplied production function parameters and machine rates will be incorporated into system-level logging cost predictions as described in, for example, Keefe et al. (2014). A sample Excel table and details on how this table will be accessed by OpCost will be documented in the release notes accompanying a future OpCost version.
One of the great benefits of providing OpCost in the open-source R frame-work is that it facilitates coordinated growth, development, and testing by a more expansive set of users than did earlier Excel, and Visual Basic for Applications or VBA-based versions of FRCS and related models. We anticipate making OpCost available as part of a package of R functions in the future in order to foster wide-spread distribution and use, especially for automated landscape-scale analyses. In its current incarnation, OpCost relies on stand-level FVS summaries of harvested trees. We envision refinements to the model that would base cost estimates on the full FVS tree list data, instead of summary metrics, potentially leading to greater accuracy and higher resolution simulation of operational logistics.

19
OpCost: an Open-Source System for Estimating Costs of Stand-Level Forest Operations
Acknowledgments Terrie Jain and Nicholas Crookston from the U.S. Forest Service Rocky Mountain Research Station provided valuable assistance in the development of OpCost. We appreciate the useful suggestions contributed by reviewers Beth Dodson, Sandor Toth, and Kevin Boston that improved this report, and the extensive quality assurance testing by Portland State University Dynamic Ecosystems Lab’s Tina Mozelewski which ensured the validity of OpCost output. We also acknowledge and appreciate funding provided by the Joint Fire Sciences Program (Project # 13-1-03-8) and the Pacific Northwest Resource Monitoring and Assessment Program. Additional funding support was provided by the University of Idaho College of Natural Resources McIntire-Stennis project IDAZ-MS-0103 and the Idaho Forest Utilization Research (FUR) program.
English EquivalentsWhen you know: Multiply by: To get:Acres 0.4046 HectaresCubic feet 0.0283 Cubic meters

20
GENERAL TECHNICAL REPORT PNW-GTR-960
Literature CitationsAcuna, M.; Kellogg, L.D. 2013. Evaluation of alternative cut-to-length harvesting
technology for native forest thinning in Australia. International Journal of Forest Engineering. 20: 17–25.
Adebayo, A.B.; Han, H.S.; Johnson, L. 2007. Productivity and cost of cut-to-length and whole-tree harvesting in a mixed-conifer stand. Forest Products Journal. 57: 59–69.
Aubuchon, R. 1982. Compendium of cable yarding production equations. Corvallis, OR: Oregon State University. https://ir.library.oregonstate.edu/xmlui/bitstream/handle/1957/11234/Aubuchon%2c%20Richard%20MF.pdf?sequence=1. (16 February 2017).
Behjou, F.; Majnounian, B. 2009. Productivity and cost of manual felling with a chainsaw in Caspian forests. Journal of Forest Science. 55: 96–100.
Bell, C.K.; Keefe, R.F.; Fried, J.S. 2017. Validation of the OpCost logging cost model using contractor surveys. International Journal of Forest Engineering. 28(2), 73-84. DOI: 10.1080/14942119.2017.1313488
Berhongaray, G.; El Kasmioui, O.; Ceulemans, R. 2013. Comparative analysis of harvesting machines on an operational high-density short rotation woody crop (SRWC) culture: one-process versus two-process harvest operation. Biomass and Bioenergy. 58: 333–342.
Bolding, M.; Lanford, B.L. 2001. Forest fuel reduction through energy wood production using a small chipper/CTL harvesting system. In: Wang, J.; Wolford, M.; McNeel, J., eds. Appalachian hardwoods: managing change. Proceedings of the 24th annual meeting of the Council on Forest Engineering. [CD-ROM]. Corvallis, OR: Council on Forest Engineering: 65–70.
Bolding, M.C.; Lanford, B.L.; Hall, M.W.S. 2002. Productivity of a Ponsse Ergo harvester working on steep terrain. In: Proceedings of the 25th annual meeting of the Council on Forest Engineering. Corvallis, OR: Council on Forest Engineering.
Boswell, B. 1998. Vancouver Island mechanized thinning trials. Tech. Note TN-217. Pointe-Claire, QC: Forest Engineering Research Institute of Canada. 15 p.
Boswell, B. 2001. Partial cutting with a cable yarding system in coastal British Columbia. Res. Note 2. Pointe-Claire, Québec, Canada: Forest Engineering Research Institute of Canada: 20.

21
OpCost: an Open-Source System for Estimating Costs of Stand-Level Forest Operations
Brinker, R.W.; Miller, D.; Stokes, B.J.; Lanford, B.L. 1989. Machine rates for selected forest harvesting machines, Circular Vol. 296, 24. Alabama Agriculture Expperiment Station, Auburn University.
Bruce, D.; Schumacher, F.X. 1950. Forest mensuration. 3rd ed. New York: McGraw-Hill Book Company, Inc. 483 p.
Chang, W.; Cheng, J.; Allaire, J.J.; Xie, Y; McPherson, J. 2016. Shiny: Web application framework for R. R package version 0.13.2. http://CRAN.R-project.org/package=shiny
Christian, L.E.; Brackley, A.M. 2007. Helicopter logging productivity on harvesting operations in southeast Alaska, using ecologically based silvicultural prescriptions. Western Journal of Applied Forestry. 22: 142–147.
Cuchet, E. 2004. Performance of a logging residue bundler in the temperate forests of France. Biomass & Bioenergy. 27: 31–39.
Dixon, G. 2002. Essential FVS: a user’s guide to the Forest Vegetation Simulator. Fort Collins, CO: U.S. Department of Agriculture, Forest Service, Forest Management Service Center. 226 p.
Dodson, E.; Hayes, S.; Meek, J.; Keyes, C. 2015. Montana logging machine rates. International Journal of Forest Engineering. 26: 85-95.
Drews, E.S.; Hartsough, B.R.; Doyal, J.A.; Kellogg, L.D. 2001. Harvester-forwarder and harvester-yarder systems for fuel reduction treatments. Journal of Forest Engineering. 12: 81–91.
Dykstra, D.P. 1976. Production rates and costs for yarding by cable, balloon, and helicopter compared for clearcuttings and partial cuttings. Research Bull. 22. Corvallis, OR: Oregon State University, School of Forestry, Forest Research Laboratory. 44 p.
Eliasson, L. 1999. Simulation of thinning with a single-grip harvester. Forest Science. 45: 26–34.
Fight, R.D.; Hartsough, B.R.; Noordijk, P. 2006. Users guide for FRCS: fuel reduction cost simulator software. Gen. Tech. Rep. PNW-GTR-668. Portland, OR: U.S. Department of Agriculture, Forest Service, Pacific Northwest Research Station. 23 p.
Fisher, J.G. 1986. Logging with a hydraulic excavator: a case study. Corvallis, OR: Oregon State University.

22
GENERAL TECHNICAL REPORT PNW-GTR-960
Flatten, L. 1991. The use of small helicopters for commercial thinning in steep, mountainous terrain. Corvallis, OR: Oregon State University. 90 p.
Ghaffariyan, M.R.; Naghdi, R.; Ghajar, I.; Nikooy, M. 2012. Time prediction models and cost evaluation of cut-to-length (ctl) harvesting method in a mountainous forest. Small-Scale Forestry. 12: 181–192.
Goodman, J.S. 1996. assessing the non-random sampling effects of subject attrition in longitudinal research. Journal of Management. 22: 627–652.
Goyder, J. 1985. Face-to-face interviews and mailed questionnaires: the net difference in response rate. Public Opinion Quarterly. 49: 234.
Hartsough, B.R.; Drews, E.S.: McNeel, J.F.: Durston, T.A.; Stokes, B.J. 1997. Comparison of mechanized systems for thinning ponderosa pine and mixed conifer stands. Forest Products Journal. 47: 59–68.
Hartsough, B.R.; Zhang, X.; Fight, R.D. 2001. Harvesting cost model for small trees in natural stands in the interior Northwest. Forest Products Journal. 51(4): 54–61.
Hiesl, P. 2013. Productivity standards for whole-tree and cut-to-length harvesting systems in Maine. Orono, ME: University of Maine. 150 p. M.S. thesis.
Hiesl, P.; Benjamin, J.G. 2013. Cycle time analysis of harvesting equipment from an early commercial thinning treatment in Maine. International Journal of Forest Engineering. 24(2): 101–108.
Huyler, N.K.; LeDoux, C.B. 1997. Cycle-time equation for the Koller K300 cable yarder operating on steep slopes in the Northeast. Res. Pap. NE-705. Radnor, PA: U.S. Department of Agriculture, Forest Service, Northeastern Forest Experiment Station. 8 p.
Jacobson, R.A.; Keefe, R.F.; Smith, A.M.; Metlen, S.; Saul, D.A.; Newman, S.M.; Laninga, T.J.; Inman, D. 2016. Multi-spatial analysis of forest residue utilization for bioenergy. Biofuels, Bioproducts and Biorefining. 10: 560–575.
Jain, T.B.; Battaglia, M.A.; Han, H.-S.; Graham, R.T.; Keyes, C.R.; Fried, J.S.; Sandquist, J.E. 2012. A comprehensive guide to fuel management practices for dry mixed conifer forests in the northwestern United States. Gen. Tech. Rep. RMRS-GTR-292. Fort Collins, CO: U.S. Department of Agriculture, Forest Service, Rocky Mountain Research Station. 331 p.

23
OpCost: an Open-Source System for Estimating Costs of Stand-Level Forest Operations
Jiroušek, R.; Klvač, R.; Skoupý, A. 2007. Productivity and costs of the mechanised cut-to-length wood harvesting system in clear-felling operations. Journal of Forest Science. 10: 476–482.
Kärhä, K.; Rönkkö, E.; Gumse, S.-I. 2004. Productivity and cutting costs of thinning harvesters. International Journal of Forest Engineering. 15: 43–56.
Keefe, R.; Anderson, N.; Hogland, J.; Muhlenfeld, K. 2014. Woody biomass logistics. In: Karlen, D.L., ed. Cellulosic energy cropping systems. Chichester, United Kingdom: John Wiley & Sons: 251–279. doi:10.1002/9781118676332.ch14.
Keegan, C., III; Niccolucci, M.; Fiedler, C.; Jones, J.; Regel, R. 2002. Harvest cost collection approaches and associated equations for restoriation treaments on national forests. Forest Products Journal. 52: 96.
Klepac, J.; Rummer, B.; Thompson, J. 2006. Evaluation of a cut-to-length system implementing fuel reduction treatments on the Coconino National Forest in Arizona. The 29th meeting of the Council on Forest Engineering. Quebec City, QC: Council on Forest Engineering: 405–414.
Klepac, J.; Rummer, R.; Thompson, J. 2011. Harvesting small trees for bio-energy. Proceedings of the 34th annual meeting of the Council on Forest Engineering. Quebec City, QC: Council of Forest Engineering.11 p.
Kluender, R.A.; Stokes, B.J. 1996. Felling and skidding productivity and harvesting cost in southern pine forests. Misc. Publ. In: Proceedings: Certification—environmental implications for forestry operations. [Place of publication unknown]: International Union of Forest Research Organizations: 35–39.
LeDoux, C.B. 1987. Estimating yarding costs for the Clearwater cable yarder. Res. Pap. NE-609. Broomall, PA: U.S. Department of Agriculture, Forest Service, Northeastern Forest Experiment Station. 4 p.
Lortz, D.; Kluender, R.; McCoy, W. 1997. Manual felling time and productivity in southern pine forests. Forest Products Journal. 47: 59–63.
Matthews, D.M. 1942. Cost control in the logging industry. New York: McGraw-Hill. 374 p.
Numinen, T.; Korpunen, H.; Uusitalo, J. 2006. Time consumption analysis of the mechanized cut-to-length harvesting system. Silva Fennica. 40: 335–363.

R Development Core Team (2016). R: A language and environment for statistical computing. R Foundation for Statistical Computing, Vienna, Austria. https://www.R-project.org/ (6 September 2017)
Sessions, J.; Boston, K. 2013. Optimization of road spacing for log length shovel logging on Gentle Terrain. International Journal of Forest Engineering. 17: 67–75.
Sirén, M.; Aaltio, H. 2003. Productivity and costs of thinning harvesters and harvester-forwarders. International Journal of Forest Engineering. 14: 39–48.
Spinelli, R.; Cuchet, E.; Roux, P. 2007. A new feller-buncher for harvesting energy wood: results from a European test programme. Biomass and Bioenergy. 31: 205–210.
Spinelli, R.; Hartsough, B.R. 2006. Harvesting SRF poplar for pulpwood. Biomass and Bioenergy. 30: 439–445.
Spinelli, R.; Magagnotti, N. 2010. A tool for productivity and cost forecasting of decentralised wood chipping. Forest Policy and Economics. 12: 194–198.
Spinelli, R.; Magagnotti, N. 2014. Determining long-term chipper usage, productivity and fuel consumption. Biomass & Bioenergy. 66: 442–449.
Visser, R.; Spinelli, R. 2012. Determining the shape of the productivity function for mechanized felling and felling-processing. Journal of Forest Research. 17: 397–402.
Wang, J.; Haarlaa, R. 2002. Production analysis of an excavator-based harvester: a case study in Finnish forest operations. Forest Products Journal. 52: 85.
Wang, J.; Long, C.; McNeel, J. 2004. Production and cost analysis of a feller-buncher and grapple skidder in central Appalachian hardwood forests. Forest Products Journal. 54: 159–167.


Pacific Northwest Research Station
Website http://www.fs.fed.us/pnw/Telephone (503) 808–2592Publication requests (503) 808–2138FAX (503) 808–2130E-mail [email protected] address Publications Distribution Pacific Northwest Research Station P.O. Box 3890 Portland, OR 97208–3890

U.S. Department of Agriculture Pacific Northwest Research Station 1220 SW 3rd Ave., Suite 1400 P.O. Box 3890 Portland, OR 97208–3890
Official Business Penalty for Private Use, $300