observations of the northern seasonal polar cap on...
TRANSCRIPT
Observations of the northern seasonal polar cap on Mars: I. Spring sublimationactivity and processes
C.J. Hansen a,!, S. Byrne b, G. Portyankina c, M. Bourke a, C. Dundas d, A. McEwen b, M. Mellon e,A. Pommerol c, N. Thomas c
a Planetary Science Institute, 1700 E. Fort Lowell, Suite 106, Tucson, AZ 85719, United Statesb Lunar and Planetary Lab, University of Arizona, Tucson, AZ 85721, United Statesc University of Bern, Sidlerstr. 5, CH-3012 Bern, Switzerlandd USGS, 2255 N. Gemini Dr., Flagstaff, AZ 86001, United Statese Southwest Research Institute, 1050 Walnut St., Boulder, CO 80302, United States
a r t i c l e i n f o
Article history:Available online 16 October 2012
Keyword:Mars, Polar caps
a b s t r a c t
Spring sublimation of the seasonal CO2 northern polar cap is a dynamic process in the current Mars cli-mate. Phenomena include dark fans of dune material propelled out onto the seasonal ice layer, polygonalcracks in the seasonal ice, sand flow down slipfaces, and outbreaks of gas and sand around the dune mar-gins. These phenomena are concentrated on the north polar erg that encircles the northern residual polarcap. The Mars Reconnaissance Orbiter has been in orbit for three Mars years, allowing us to observe threenorthern spring seasons. Activity is consistent with and well described by the Kieffer model of basal sub-limation of the seasonal layer of ice applied originally in the southern hemisphere. Three typical weakspots have been identified on the dunes for escape of gas sublimed from the bottom of the seasonalice layer: the crest of the dune, the interface of the dune with the interdune substrate, and through polyg-onal cracks in the ice. Pressurized gas flows through these vents and carries out material entrained fromthe dune. Furrows in the dunes channel gas to outbreak points and may be the northern equivalent ofsouthern radially-organized channels (‘‘araneiform’’ terrain), albeit not permanent. Properties of the sea-sonal CO2 ice layer are derived from timing of seasonal events such as when final sublimation occurs.Modification of dune morphology shows that landscape evolution is occurring on Mars today, drivenby seasonal activity associated with sublimation of the seasonal CO2 polar cap.
! 2012 Elsevier Inc. All rights reserved.
1. Introduction
1.1. Background and overview
Every winter !25% of Mars’ CO2 atmosphere condenses to forma seasonal polar cap (Leighton and Murray, 1966). Northern springphenomena associated with sublimation of seasonal ice were firstimaged at moderately high resolution by the Mars Orbiter Camera(MOC) on the Mars Global Surveyor (MGS) spacecraft (Malin et al.,1998), and Malin and Edgett (2001) noted the appearance of darkspots on the dunes of the north polar erg in the spring. The HighResolution Imaging Science Experiment (HiRISE) on the MarsReconnaissance Orbiter (MRO) has imaged seasonal activity forthree Mars years. This temporal coverage allows us to compareprocesses extant in one spring to the next, and to compare phe-nomena in the north to the south. HiRISE’s high signal to noise ra-tio (SNR) facilitates imaging at low light levels (McEwen et al.,2007), which allows imaging of the sublimation process to start
just after the Sun rises at latitudes equivalent to Mars’ arctic circle.The high SNR is key to getting images of the dark dunes of high en-ough quality to identify changes when the seasonal frost is gone.The capability of the MRO spacecraft to roll off-nadir enables col-lection of images in the same location throughout the spring, sowe can study the sublimation process as a function of time. Thiscapability also allows us to image features at different emission an-gles, enabling the acquisition of stereo pairs and production ofanaglyphs.
At high northern latitudes dynamic activity associated withsublimation of the seasonal polar cap is mostly found on the dunes.Mars’ north polar residual cap is ringed by a vast north polar erg(Cutts et al., 1976; Tsoar et al., 1979), subdivided into 4 sand seas(Lancaster and Greeley, 1990) stretching between !70N and 85N.Most of the dunes are barchans, barchanoid ridges and transversedunes, depending on sediment supply, formed by predominantlyunidirectional winds (Hayward et al., 2008). The north polar erghas a double ring of wind circulation patterns, divided at approxi-mately 80N, determined from slipface orientation, which showthat winds north of 80N blow predominantly from the east andsouth of 80N blow predominantly from the west (Tsoar et al.,
0019-1035/$ - see front matter ! 2012 Elsevier Inc. All rights reserved.http://dx.doi.org/10.1016/j.icarus.2012.09.024
! Corresponding author.E-mail address: [email protected] (C.J. Hansen).
Icarus 225 (2013) 881–897
Contents lists available at SciVerse ScienceDirect
Icarus
journal homepage: www.elsevier .com/locate / icarus
1979; Ward and Doyle, 1983; Coleman and Hayward, 2011), atleast during the summer and fall when the dunes are free of theirprotective layer of seasonal ice. The spacing of the dunes variesfrom sparse to complete coverage. The average dune height is20–25 m (Garvin et al., 1999) although barchans in less-denseareas average closer to 50 m in height (Bourke et al., 2006). Thesource of the dark basaltic and gypsum sand in the dunes appearsto be the basal unit of the polar layered deposits, the Planum Bor-eum cavi unit (Byrne and Murray, 2002; Tanaka and Hayward,2008) and the Upper Polar Layered deposits (Massé et al., 2010,2012).
In the well-studied southern polar region of Mars seasonal CO2
ice is at times impermeable and translucent, allowing sunlight topenetrate and warm the ground below (Kieffer, 2000; Langevinet al., 2007). The ice layer sublimates from the bottom, trappinggas between the ice and the surface (Kieffer et al., 2006; Pilorgetet al., 2011). This pressurized gas ruptures the ice and escapes,entraining fine material eroded from the surface, carving uniquelymartian radially-organized channels in the surface, dubbed ‘‘arane-iform’’ (spider-like) terrain (Piqueux et al., 2003; Kieffer, 2007;Piqueux and Christensen, 2008; Hansen et al., 2010; Portyankinaet al., 2010). Surface material is transported by the escaping gasto the top of the ice, then deposited in relatively dark fans directedby prevailing winds and slopes (Malin and Edgett, 2001; Thomaset al., 2010). After the ice is gone the fans blend back into the sur-face. When conditions are favorable fans of bright CO2 frost, fromgas that cools adiabatically after escaping from the subsurface,can form (Titus et al., 2007). We refer to the entire process as the‘‘Kieffer Model.’’
Southern and northern winters are not identical due to Mars’elliptical orbit, and it is not necessarily the case that processesoperating in one hemisphere will be active in the other. Southernwinters are longer allowing more CO2 to condense. Viking, MGS,Odyssey and Mars Express observations show that in the northernhemisphere H2O atmospheric transport is greater than in thesouthern hemisphere (Farmer and Doms, 1979; Kieffer and Titus,2001; Wagstaff et al., 2008; Appere et al., 2011). Observations byMRO of the composition of the seasonal ice cap are discussed inthe companion paper by Pommerol et al. (2013).
In this paper we use the terms ‘‘frost’’ and ‘‘ice’’ somewhatinterchangeably, but always in reference to the seasonally con-densed volatile. MGS gravimetric data combined with MOLA datashow that a layer of condensed CO2 ! 1 m deep (depth is lati-tude-dependent) initially (Aharonson et al., 2004) gradually com-pacts to higher density (Matsuo and Heki, 2009).
Piqueux and Christensen (2008) analyzed northern MOC imagesand proposed the application of the Kieffer model to northern ter-rain based on MGS data. Slab ice is consistent with MGS ThermalEmission Spectrometer (TES) data (Titus et al., 2001). With darkdunes below a layer of translucent ice the conditions are set upfor basal sublimation. When the ice ruptures the gas will escape,carrying sand and dust from the surface of the dune to the top ofthe seasonal ice layer. Polygonal cracks visible in MOC and HiRISEimages are consistent with slab ice cracking from the pressure ofthe gas confined below and releasing dust and sand-laden gas(Piqueux and Christensen, 2008; Portyankina et al., 2011).
Morphological changes were observed on the dunes (new al-coves and debris aprons) in the second Mars year of HiRISE opera-tion, detected when ice-free images were compared between thetwo years. Temporal coverage of the same location throughoutspring showed that changes in dune morphology could be corre-lated with seasonal activity (Hansen et al., 2011), and destabiliza-tion of the dune brink by gas flow from basal sublimation wasproposed as the cause, described further in Section 3 of this paper.The formation of large new alcoves may be initiated by fluidizationof eolian sediment from CO2 sublimation and destabilization of
nearby material, provided the CO2 is blanketed by a layer of sedi-ment (Cedillo-Flores et al., 2011). A purely wind-driven originhas also been proposed (Horgan and Bell, 2012); however, in thesouthern hemisphere we know new gullies are formed while CO2
is on the ground, not when the sand is active from the wind(Diniega et al., 2010).
1.2. Investigation goals and data
In this paper we focus on seasonal processes in the northernhemisphere. The questions we want to address with HiRISE dataare as follows: What is the nature of the activity associated withsublimation of the seasonal polar cap in the north? Does the north-ern seasonal polar cap exhibit the same sorts of phenomena as thesouth? What phenomena are unique to the sublimation of thenorth seasonal cap? In the first spring observed our emphasiswas to characterize the types of seasonal activity extant in north-ern spring. With images from the second Mars year we identifiedmorphological changes on the dunes of the north polar erg, includ-ing new alcoves and debris aprons, caused by seasonal processes.In this third year we are systematically investigating the factorsinfluencing the efficacy of seasonal activity such as slipface orien-tation and dune morphology and we are monitoring the northerndunes through the current northern summer.
Section 2 describes the variety of activity observed by HiRISE.Section 3 evaluates the processes that are responsible for the ob-served activity and discusses the applicability of the Kieffer modelto the northern hemisphere. Section 4 concludes with north–southcomparisons.
The sand dunes in the north polar erg host a wide variety of sea-sonal phenomena, while there is very little observable seasonalactivity in non-dune areas (Kieffer and Titus, 2001). The small HiR-ISE image size (typically 6 km " 12 km) means that spatial cover-age is limited. Only a few sites can be selected for in-depthinvestigation, which in the context of seasonal processes equatesto temporal coverage. Sites that were selected in the northern polarregion, primarily on the north polar erg, for detailed study arelisted in Table 1 with locations shown in Fig. 1. In order to investi-gate factors influencing the seasonal sublimation process in ourstudy year 3 we targeted slipfaces facing ! east and slipfaces fac-ing !west, good longitudinal coverage, sites with scarce sandand scattered barchans, transverse dunes at sites with abundantsand, and a variety of dune forms.
Image identifiers starting with ‘‘PSP’’ (Primary Science Phase)are from the first Mars year of MRO’s mission, those starting with‘‘ESP_01nnn_mmmm’’ (Extended Science Phase; 01nnn is the orbitnumber) are from the second Mars year, and those starting with‘‘ESP_02nnn_mmmm’’ are from MRO’s third Mars year; conven-tionally labeled MY29, MY30 and MY31, respectively (Clancyet al., 2000). Image series were started at a much earlier Ls in thethird Mars year compared to the first and second.
All images unless otherwise noted are the HiRISE RGB.NOMAPproduct, produced routinely by the HiRISE ground processing pipe-line. ‘‘NOMAP’’ signifies that these images are not map-projected.This means that south is up and illumination is from the upperright.
RGB.NOMAP images are calibrated however no pointing or geo-metric corrections are applied, and they retain full spatial resolu-tion because the pixels are not re-sampled. HiRISE’s threemonochromatic bands are referred to as ‘‘RED’’, ‘‘Blue-Green(BG)’’ and ‘‘InfraRed (IR)’’ – the IR data is not used in this product.The RGB false-color image is produced using only the RED and BGdata. The synthetic blue is generated by multiplying the BG imageby 2 minus 30% of the RED image DN for each corresponding pixel(McEwen et al., 2010; Delamere et al., 2010). Each color filter isstretched individually to maximize contrast and stretches are not
882 C.J. Hansen et al. / Icarus 225 (2013) 881–897

the same from image to image. Even if stretches were the same col-ors would vary with atmospheric conditions. Color images are veryuseful for identifying frost, which is brighter and bluer than bareground. The contrast between the seasonal ice and surface materialon top of the seasonal ice is easy to discern in color images. CO2 vs.water ice cannot be differentiated in a HiRISE image – for thatCRISM data is required, as discussed in the companion paper byPommerol et al. (2013).
Figs. 2–5 illustrate the full range of HiRISE spatial resolution andcoverage: Fig. 2 shows the 1.3 km wide color strip imbedded in the6.5 km wide image. Fig. 3 zooms into show just the color strip.Fig. 4 zooms in more to a sub-image of the color strip. Fig. 5 iszoomed into almost full resolution.
1.3. Depth of seasonal ice
Mars Orbiter Laser Altimeter (MOLA) and Gamma Ray Spec-trometer (GRS) data have been used to calculate the amount ofaccumulated CO2 ice in winter as a function of Ls and latitude(Smith et al., 2001; Boynton et al., 2003; Aharonson et al., 2004;Kelly et al., 2006; Litvak et al., 2007), where Ls is the solar longi-tude, measured from Mars’ vernal equinox [Ls = 0 is the first dayof spring in the northern hemisphere; Ls = 90 is the first day ofsummer]. Values in these papers are generally given as the ob-served column density in gm/cm2, because the ice bulk density isnot directly measured. The global/temporal average bulk CO2 den-sity was estimated from MOLA and GRS data to be 500 kg/m3
(Aharonson et al., 2004). MGS gravimetric data combined withMOLA data show that density increases over the course of a mar-tian winter/spring, varying in the north from 100 kg/m3 at thebeginning of deposition, like light fresh snow or frost, graduallycompacting to up to as high as !1500 kg/m3, the density of nonpo-rous CO2 ice, at Ls 60 (Matsuo and Heki, 2009).
Table 2 gives the approximate depth of the CO2 layer for twolatitudes and three times based on the column density derivedfrom Odyssey GRS data (Kelly et al., 2006) and bulk ice density de-rived from MOLA plus MGS gravimetric data, with a linear increasein density as a function of time (Matsuo and Heki, 2009). (It is help-ful to keep these approximate depths in mind when analyzing im-age data, but it is also important to recognize that these are verycoarse estimates – for example interannual variability is com-pletely ignored as are a variety of other factors.)
2. Northern seasonal cap spring sublimation phenomena
This section will serve as both a review and an update with newimages from the third northern spring that HiRISE has imaged.HiRISE results have been published in an assortment of papersand abstracts, but not as a comprehensive description of the sea-sonal processes extant in the northern hemisphere.
2.1. Fans on sand dunes
We use the term ‘‘spring activity’’ to generically describe fea-tures that show up on the dunes in the presence of the seasonallayer of frost, and then disappear when the dunes are ice-free.
Table 1Sites imaged systematically by HiRISE in study year 3 (MY31) of seasonal campaign. The names are informal, some based on the sand dunes in the science fiction book ‘‘Dune.’’
Latitude Longitude east Informal name Ls imaged year 3 Slipface orientation Comment
72.29 311.75 South Beach 338, 347, 22, 30, 32, 50, 52, 67, 74 South, southeast Barchanoid ridges, furrows73.35 355.1 Windy City 337, 346, 8, 21, 29, 44, 49, 63, 73 East Scattered barchans73.65 328.2 Caladan 8, 31, 37, 68 Southeast Isolated barchans and domes, furrows73.89 334.7 T-Party 344, 350, 6, 17, 22, 35, 40, 52, 67, 74 South, southeast T-shaped dunes, domes74.0 288.3 Erg outlier 10, 23, 36, 50 Northeast Linear dunes75.0 300.0 Translucent Ice 336, 346, 16, 22, 29, 34, 39, 42, 49, 54, 66, 76 East, southeast Linear dunes75.38 317.36 Variable packing 342, 351, 7, 23, 28, 48 South, southeast Barchans75.53 281.87 Ts and Vs 341, 347, 17, 23, 32, 43, 55, 67 Southeast T- and V-shaped75.8 94.06 Classic barchan 339, 7, 13, 20, 31, 43, 48, 75, 79 East, northeast Scattered barchans76.6 104.1 Romo 14, 21, 39, 61 East, northeast Barchans76.63 89.49 Windy City 2 347, 15, 30, 41, 50, 62, 65 Northeast Barchanoid ridges76.85 30.24 Chusuk 9, 22, 40, 45, 67, 76 West, northwest Rounded barchanoid ridges78.0 84.0 Hagal 14, 20, 30, 55, 64 Southeast Linear, rounded80.0 122.5 Arrakis 8, 18, 23, 36, 39, 46, 53, 61, 72, 78, 82 East Barchanoid ridge80.0 240.0 Gypsum Source 6, 32, 56, 73 Southeast Linear, rounded transverse80.22 217.08 Cool Fans 1, 14, 20, 37, 57, 71, 76 South Complex81.0 156.0 Zanovar 0, 35, 49, 69, 73 Northwest Transverse81.65 178.8 Gypsum dunes 13, 21, 34, 54, 66, 73 West, northwest Transverse83.5 118.5 Tleilax 13, 25, 34, 39, 47, 54, 66, 74, 80 West, southwest Transverse84.0 233.2 Buzzel 11, 14, 24, 34, 40, 50, 55, 64, 81 West (but broad distribution) Barchanoid ridges84.7 0.7 Kolhar 3, 8, 16, 24, 37, 44, 49, 61, 71, 75 Northwest, north Barchanoid ridges
Fig. 1. This basemap of Mars’ north polar region was provided by R. Hayward.Yellow circles show craters with dunes. Dark red areas show regions of the polar ergwith abundant sand, with dunes almost entirely covering the substrate; pink areasfeature sparse coverage by crescentic dunes; the reddish-pink color has a highdensity of dunes but not complete coverage of the interdune substrate (Haywardet al., 2010). Blue stars indicate the approximate locations of HiRISE study sites. (Forinterpretation of the references to color in this figure legend, the reader is referredto the web version of this article.)
C.J. Hansen et al. / Icarus 225 (2013) 881–897 883

Fig. 2a and b show a region of dark barchanoid dunes on a rela-tively brighter interdune substrate without and with seasonal frostcover, respectively. In the spring many small dark fans of fine
material are seen deposited on top of the brighter seasonal layerof ice (Fig. 3). This material is being transported from below theseasonal ice layer to the top, in a process that is likely analogousto the well-modeled process that occurs in the southern hemi-sphere, described briefly above, and discussed in detail in Section 3.Material emerging from below the ice is carried downwind and/ordownslope. When the ice is gone the fans are no longer visible,blending back into their source material.
Fig. 3 zooms into the center of this region, dubbed ‘‘Arrakis’’ alsoimaged by MOC (Kieffer, 2007, Fig. 2). Seasonal activity starts veryearly at Ls 7.5, first on the interdune substrate, then on the dunes.Fans observed very early on the substrate disappear quickly. If theKieffer model of basal sublimation is correct this early release ofgas may fracture the seasonal ice layer enough on the substratethat fans do not recur throughout spring, because the gas is nolonger trapped at all.
A full spring sequence from study year 3 (MY31) is illustrated inFig. 4 for the Y-shaped dune shown in Fig. 3 (the center of the Y isindicated by the purple box). Between Ls 7 (left side of Fig. 3) and Ls
18 (Fig. 4) spring activity on the dunes has started. Polygonalcracks have opened releasing dune material to be blown down-wind in narrow fans. At Ls 39 material propelled from below theseasonal ice layer to the top has been blown in a number of direc-tions and also slides downslope. The dune margin is a source ofmaterial to be blown downwind, obvious at Ls 46. By Ls 72 patchesat the top of the dunes are bare of seasonal ice.
The images shown in Fig. 5a–c are sub-images of pictures takenthroughout spring in MY30 at the same location in Arrakis as Figs. 2and 3, zooming into the blue box indicated in Fig. 3. Many smallrelatively dark fans of fine material are seen deposited on top ofthe brighter seasonal layer of ice. Fig. 5b, taken at Ls 46.8, showsbright fans emanating from the same sources as the dark fans.Analogous to the southern hemisphere, this shows that whenatmospheric conditions are favorable fans of bright frost, CO2 thatcools adiabatically after escaping from the subsurface, may form(Titus et al., 2007). Piqueux and Christensen (2008) reported thatthey had not found bright fans in MOC images in the north polar
Fig. 2. (a) Map-projected image PSP_009122_2600 on the left, acquired at 80.0N/122.5E, Ls 95.4, shows a region with ice-free barchanoid dunes on a patterned groundinterdune substrate. The dark dunes have a surface reflectance of 0.16; the interdune substrate is only slightly brighter (see companion paper by Portyankina et al., 2013).These two images show the full 6.5 km width of the HiRISE images. Color is available only in the !1.3 km wide center strip. (b) Map-projected image ESP_016032_2600 on theright, taken the following spring at Ls = 29.7, shows seasonal activity concentrated on the dunes. At this latitude and Ls seasonal ice covers the entire scene, !0.5 m deep,depending on the assumed ice density. These dunes are informally referred to as ‘‘Arrakis.’’ (For interpretation of the references to color in this figure legend, the reader isreferred to the web version of this article.)
Fig. 3. The image on the left is ESP_024247_2600, acquired at Ls 7.5, at 80N/122.5E.Fans are visible on the interdune substrate but not on the dunes. PSP_007725_2600,the image on the right, was acquired at Ls 47.5, still covered with seasonal ice, withsublimation activity concentrated on the dunes. Both images are !1.3 km wide. Theblue rectangle shows the location of Fig. 5 (and center of Fig. 4); the yellowrectangle shows the location of Fig. 10a.
884 C.J. Hansen et al. / Icarus 225 (2013) 881–897

region; however, this may be due to their small scale or MOC’s lim-ited temporal coverage. The bright fans on these dunes were ob-served at Ls 46.8. No bright fans were observed at Ls 42.2, andonly the remnants of those at 46.8 are visible at Ls 50.0.
In the southern hemisphere, for example, in the region knowninformally as Ithaca, at 85.13S/180.67E, bright fans were only ob-served at Ls 187. At Ls < 185 and Ls > 211 there were no visiblebright fans. A different mechanism for producing bright fans wassuggested by Pommerol et al. (2011) based on the analysis of suc-cessive HiRISE images acquired in Ithaca. In Ithaca, around Ls 200,the external edges of the largest dark fans suddenly brightened sig-nificantly and show a pronounced blue color in false-color images(‘‘blue haloes’’). Smaller dark fans can even become entirely bright
at this time. For the largest fans, the blue color rapidly disappearswhile smaller fans might remain hidden for a much longer time,possibly until the end of spring. Sinking of dark sand grainsthrough the ice layer or formation of micro-dimples around eachdeposited mineral grain (Kieffer, 2007) could explain the observedevolution. Dark grains deposited at the surface of clean and com-pact CO2 ice will absorb the sunlight very efficiently, warm-up,and sublime the CO2 ice around them. The hole carved by the grainmay remain open (micro-dimples) or be sealed by re-condensationof the CO2 on top of the grain (sinking). The ‘‘cleaned’’ surface pre-viously covered by the dark fan can thus appear brighter (andbluer) than the surrounding ice, producing bright fans at the exactlocation where the dark fans were.
Fig. 4. The sequence of spring activity is illustrated for Arrakis, using the following images, from left to right: (top) ESP_024537_2600, ESP_024669_2600, ESP_025104_2600,(bottom) ESP_025315_2600, ESP_025737_2600, ESP_026080_2600. An estimate of ice thickness at Ls 18 is 60 cm; estimated thickness at Ls 46.1 is !25 cm.
Fig. 5. (a) Zooming in on the center of the Y-shaped dune in this scene, a sub-image of ESP_016388_2600 acquired at 80N/122.5E, Ls 42.2, fans of dark dune sediment can beseen on top of brighter seasonal ice. The direction of fans is downslope and/or directed by the wind. (b) Bright fans also form when the conditions are right, as shown in thissub-image of ESP_016520_2600, Ls 46.8. (c) Dark fans are fading as material sinks into the ice in this sub-image of ESP_016612_2600, acquired at Ls 50.0.
C.J. Hansen et al. / Icarus 225 (2013) 881–897 885

Fig. 5 shows evidence for both processes occurring in the north-ern hemisphere with similar effects on the temporal evolution ofthe appearance of fan deposits. The small bright fans not associatedwith previous dark fans (5b) may be fresh deposits of frost, whilethe gray appearance of fans in false color images may be due tothe change in contrast of the originally dark fans. In the case illus-trated in Fig. 5 comparison of dark fans in Fig. 5a–c shows that thesinking of material into the ice layer and/or the development of mi-cro-dimples around the mineral grains may cause the gray appear-ance where there was a dark fan. In addition to the processesalready described, the final fading of the dark fans might be ex-plained by another process described for southern polar areas byKieffer (2007). If the dark mineral material actually consists ofaggregates of smaller particles the disaggregation of these agglom-erates can explain the progressive brightening of the dark deposits.
Barchan dunes have a distinctive sequence of seasonal activity,as shown in Fig. 6, a more southerly site at the edge of the polarerg. Activity begins at the interface of the substrate with the dunes
where dark sand is observed in fan-shaped deposits, presumablypropelled out from under the seasonal ice layer. On the flatter stossside of the dune polygonal cracks develop (Piqueux andChristensen, 2008; Portyankina et al., 2011). At Ls 7 dark materialemerges from the cracks; by Ls 13 the contrast of the fans isobserved to fade, as the material (possibly) sinks back into theice. Bright frost can be seen condensing around the cracks at Ls
20. Bright fans may emerge, as shown at Ls 43. At the end of thespring sequence, Ls 79, ice lingers in cold traps, then disappears.
A similar sequence takes place at the more northerly ‘‘Kolhar’’site although some types of activity occur later, as shown inFig. 7. For example polygonal cracks show up at Ls 24, and brightfans at Ls 61.
A typical sequence of defrosting for dunes in an area with abun-dant sand covering most of the substrate is shown in Fig. 8. Thisseries at 80.22N/217.1E begins at Ls 1 before seasonal activity hasstarted. By Ls 14 fans of sediment have emerged along the dunecrest and thin polygonal cracks can be detected (narrow lineations– these are easier to see in Fig. 11c, a different sub-image of thesame site at Ls 14). Non-fan-shaped deposits of bright materialcan be seen in the images at Ls 20. The scene at Ls 57 appears tohave been generally re-frosted, as older fans have disappearedand new ones emerged – Mars Express OMEGA data show thatthere is an optically thick layer of H2O ice that gradually condenseson the CO2 ice to the point that at Ls 50 the spectral signature ofCO2 is hidden (Appere et al., 2011). HiRISE cannot detect the differ-ence between CO2 and H2O, but new H2O frost deposition mayexplain the difference in appearance (older fans disappearing,new fans forming) between Ls = 37 and 57, in addition to thepreviously discussed possibilities. The crests of the dunes arelargely defrosted by Ls 71.
2.2. Furrows as sources of fans
The activity that rings barchan dunes at the dune-substrate inter-face is a very typical seasonal phenomenon, illustrated in Fig. 9, first
Table 2The depth of the CO2 layer is computed from column densities determined from GRSdata⁄ (Kelly et al., 2006) with a linearly increasing density⁄⁄ (Matsuo and Heki, 2009)to provide a convenient estimate when looking at the images. Depths will vary fromyear-to year, and where on the dune (slipface vs. stoss) the frost was deposited.
Latitude Column density⁄
(g/cm2)CO2 layer density⁄⁄
(g/cm3)Depth(cm)
Ls = 350 0.5675 45 8082.5 65 120
Ls = 20 0.8675 34 4082.5 60 70
Ls = 50 1.1575 10 982.5 35 30
Fig. 6. This series of sub-images were acquired at 75.8N/94.055E. The sequence of seasonal activity illustrated is observed on numerous barchan dunes in the north polar erg.Images shown are (upper row, left to right) ESP_023536_2560, ESP_024235_2560, ESP_024380_2560, ESP_024591_2650, (lower row) ESP_024881_2650, ESP_025237_2650,ESP_025369_2650 and ESP_026292_2560 (which has been brightened relative to nominal RGB processing).
886 C.J. Hansen et al. / Icarus 225 (2013) 881–897
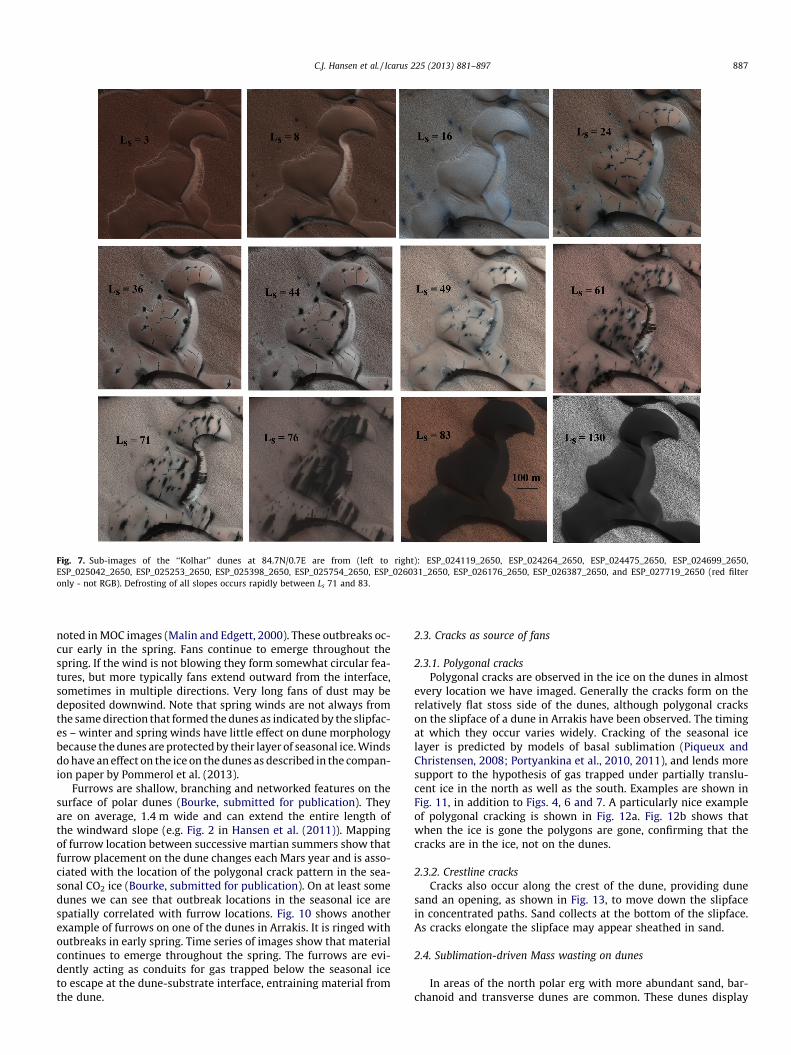
noted in MOC images (Malin and Edgett, 2000). These outbreaks oc-cur early in the spring. Fans continue to emerge throughout thespring. If the wind is not blowing they form somewhat circular fea-tures, but more typically fans extend outward from the interface,sometimes in multiple directions. Very long fans of dust may bedeposited downwind. Note that spring winds are not always fromthe same direction that formed the dunes as indicated by the slipfac-es – winter and spring winds have little effect on dune morphologybecause the dunes are protected by their layer of seasonal ice. Windsdo have an effect on the ice on the dunes as described in the compan-ion paper by Pommerol et al. (2013).
Furrows are shallow, branching and networked features on thesurface of polar dunes (Bourke, submitted for publication). Theyare on average, 1.4 m wide and can extend the entire length ofthe windward slope (e.g. Fig. 2 in Hansen et al. (2011)). Mappingof furrow location between successive martian summers show thatfurrow placement on the dune changes each Mars year and is asso-ciated with the location of the polygonal crack pattern in the sea-sonal CO2 ice (Bourke, submitted for publication). On at least somedunes we can see that outbreak locations in the seasonal ice arespatially correlated with furrow locations. Fig. 10 shows anotherexample of furrows on one of the dunes in Arrakis. It is ringed withoutbreaks in early spring. Time series of images show that materialcontinues to emerge throughout the spring. The furrows are evi-dently acting as conduits for gas trapped below the seasonal iceto escape at the dune-substrate interface, entraining material fromthe dune.
2.3. Cracks as source of fans
2.3.1. Polygonal cracksPolygonal cracks are observed in the ice on the dunes in almost
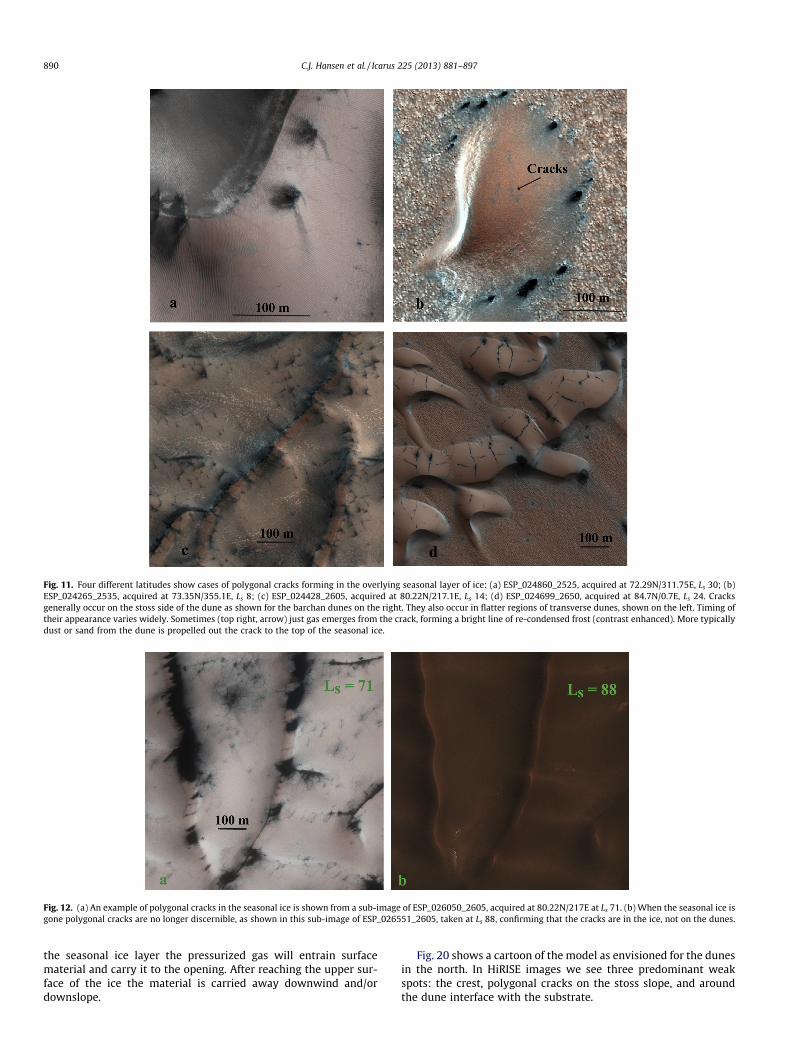
every location we have imaged. Generally the cracks form on therelatively flat stoss side of the dunes, although polygonal crackson the slipface of a dune in Arrakis have been observed. The timingat which they occur varies widely. Cracking of the seasonal icelayer is predicted by models of basal sublimation (Piqueux andChristensen, 2008; Portyankina et al., 2010, 2011), and lends moresupport to the hypothesis of gas trapped under partially translu-cent ice in the north as well as the south. Examples are shown inFig. 11, in addition to Figs. 4, 6 and 7. A particularly nice exampleof polygonal cracking is shown in Fig. 12a. Fig. 12b shows thatwhen the ice is gone the polygons are gone, confirming that thecracks are in the ice, not on the dunes.
2.3.2. Crestline cracksCracks also occur along the crest of the dune, providing dune
sand an opening, as shown in Fig. 13, to move down the slipfacein concentrated paths. Sand collects at the bottom of the slipface.As cracks elongate the slipface may appear sheathed in sand.
2.4. Sublimation-driven Mass wasting on dunes
In areas of the north polar erg with more abundant sand, bar-chanoid and transverse dunes are common. These dunes display
Fig. 7. Sub-images of the ‘‘Kolhar’’ dunes at 84.7N/0.7E are from (left to right): ESP_024119_2650, ESP_024264_2650, ESP_024475_2650, ESP_024699_2650,ESP_025042_2650, ESP_025253_2650, ESP_025398_2650, ESP_025754_2650, ESP_026031_2650, ESP_026176_2650, ESP_026387_2650, and ESP_027719_2650 (red filteronly - not RGB). Defrosting of all slopes occurs rapidly between Ls 71 and 83.
C.J. Hansen et al. / Icarus 225 (2013) 881–897 887

sand flows down slipfaces in the spring, mobilized by the destabi-lizing activity associated with the sublimation of CO2. Fig. 14shows numerous dark sand flows, including a dust cloud beingraised by falling material (Hansen et al., 2011).
Sand flows are observed to appear and lengthen as the springseason progresses, guided by existing dune morphology. Möhl-mann (2008) discuss the possibility that thin layers of interfacialwater might be present in the dunes, reducing friction. Kereszturiet al. (2009) attribute the streaks to liquid brine flows, however li-quid brine would be in direct association with CO2 ice at !145 K,and would have to stay liquid while flowing tens of meters. Ourpreferred explanation is gravity-driven mass wasting, initiated byCO2 sublimation and gas flow. See Section 3 for further discussion.
2.5. Sand avalanches and dune erosion
Comparison of HiRISE images of ice-free dunes acquired inMY29 and MY30 showed sediment transport on the dunes. Theseimages show substantial change in the form of new alcoves anddebris aprons, association of changes with seasonal activity, andthe reworking of the debris aprons by wind forming new ripples(Hansen et al., 2011), as shown in Fig. 15.
Some sand avalanches move hundreds of cubic meters of mate-rial (Hansen et al., 2011, SOM). New alcoves may be cut many me-ters into the existing dune brink. We hypothesize that gas flowfrom basal sublimation of the seasonal ice layer destabilizes thetop of the dune. Fluidization of the eolian sediment by CO2 subli-mation has also been proposed (Hoffman, 2002; Cedillo-Floreset al., 2011). The Cedillo-Flores model requires mantling of theCO2 frost by a layer of sand or dust. HiRISE images show that thisis indeed possible (Fig. 14 for example) but more detailed analysisof where new alcoves are detected and whether they meet all thecriteria for CO2 fluidization is required.
In the third study year images show that alcoves are rapidlyfilled in, as illustrated in Fig. 16. A prominent alcove imaged inMY29 is entirely filled in by MY31. It is not clear at this timewhether that is entirely due to sand transport by the wind, orwhether the weight of the layer of seasonal ice is somehow helpingto smooth out the sand on the slipface.
2.6. Bright–dark–bright banding
Another puzzling sublimation feature appears at the crests ofdunes, along cracks on the stoss side of the dunes, and at theinterfaces of the dune with the interdune substrate, illustratedin Fig. 17. Bright–dark–bright bands appear early in spring
Fig. 8. This series of sub-images was acquired in study year 3 (MY31) at 80.22N/217.1E. The images shown (with incidence angles in parentheses) are, left to right,ESP_024072_2605 (80.4), ESP_024428_2605 (74.7), ESP_024573_2605 (72.5), ESP_025061_2605 (66.4), ESP_025628_2605 (60.6), and ESP_026050_2605 (58.0).
Fig. 9. ‘‘Outbreaks’’ of dune sand and dust ring these barchan dunes. This 1.3 kmwide sub-image of ESP_024621_2535 at 73.35N/355.1E was acquired at Ls 21.Illumination is from the upper right as shown.
888 C.J. Hansen et al. / Icarus 225 (2013) 881–897

(Ls = 16–30) and fade slowly as the season progresses (also termed‘‘rings,’’ described in Kereszturi et al., 2010). These do not appear tobe related to the morphology of the underlying surface. It may bethat this is a particle-size effect, as discussed in the companion pa-per by Portyankina et al. (2013). It has been shown that differentparticle sizes will settle out at different distances from the sourcevent, and that the distribution depends on both slope and ambientwind (Fig. 16 in Thomas et al. (2011a)).
2.7. Non-dune terrain
In the north we have looked at regions suggested as likely sitesof translucent ice (Piqueux and Christensen, 2008), to search forchannels carved in the surface, similar to the araneiform terrainobserved in the southern hemisphere (Piqueux et al., 2003; Hansenet al., 2010). We have not imaged (in the small sample of the sur-face imaged by HiRISE) any araneiform terrain.
In general, regions without dunes show very little sign of sea-sonal activity. Fig. 18 shows one exception, an example of a fanin the north in a region with no dunes. Fans in this region tendto be bright at blue wavelengths, indicative of frost condensingfrom gas rather than transport of fine dark surface material. It islikely that decompression and adiabatic cooling of pressurizedgas being released from below the ice causes condensation of frost,which shows up as a fresh bright streak (Titus et al., 2007; Thomaset al., 2010). If basal sublimation is active then the nature of thesurface apparently makes entrainment of surface material unlikelyhere.
3. Seasonal processes
3.1. Sublimation-driven mass wasting vs. salt brines
As the spring season progresses slope streaks/sand flows oftenlengthen. Fig. 19a–c show a temporal series of images of the same
location. This may appear to lend credence to the Kereszturihypothesis of salt brine liquid flow (Kereszturi et al., 2010) butthere are a few inconsistencies that lead us to the conclusion thisis dry mass wasting. The offset of one streak from the slipfacedownslope direction is consistent with wind carrying material;and the detached dark spots at the bottom show material that ap-pears to have skipped across the surface.
Temperature, however, is the biggest issue for the salt brinesmodel. This scene is covered with CO2 ice at a temperature of!145 K. The liquid will be in contact with the ice, if not at its sourcethen all the way downslope to the bottom. It will also radiate to anatmosphere buffered to the CO2 frost point of!145 K. Although it istheoretically possible to achieve brine eutectic temperatures as lowas 145 K for vanishingly small quantities of liquid (Chevrier andAltheide, 2008; Rivera-Valentin et al., 2012), the minimum con-firmed (measured) temperatures are no lower than 200 K (Chevrierand Altheide, 2008; Möhlmann and Thomsen, 2011).
3.2. Application of the Kieffer model to the dunes of the north polar erg
Most seasonal activity imaged by HiRISE can be explained bythe Kieffer model, which features basal sublimation of the seasonalice layer. The key tenets of the Kieffer model are that ice is trans-lucent and impermeable at times during the spring. Sunlight pene-trating the ice warms the darker ground below, causingsublimation from the bottom of the ice layer (Kieffer et al., 2006;Kieffer, 2007; Pilorget et al., 2011). Models show that only 10% ofincoming solar radiation is required to be absorbed in the surfaceto get basal sublimation started. The subsequent buildup of pres-sure of trapped gas will cause the ice to rupture at a weak spotor cause polygonal cracking (Piqueux and Christensen, 2008;Portyankina et al., 2011). It is clear from the overlying thicknessof the seasonal ice layer (Table 2) that something is needed to pro-pel dune material up and out on top of the seasonal ice layer.Analogous to the southern hemisphere, when a rupture occurs in
Fig. 10. (a) Outbreaks form early in the spring along the dune-substrate interface, as illustrated in ESP_016111_2600, taken at Ls 32.5. (b) More material has emerged, frommore outbreaks, at Ls 54.5, ESP_016744_2600. (c and d) When all seasonal ice has sublimated small furrows in the dune are visible, shown in (d), ESP_018445_2600, taken atLs 113.2. Comparison of the outbreaks in ESP_016111_2600 (c), to ESP_018445_2600 (d) shows the correlation of the outbreak sites to the furrows.
C.J. Hansen et al. / Icarus 225 (2013) 881–897 889
the seasonal ice layer the pressurized gas will entrain surfacematerial and carry it to the opening. After reaching the upper sur-face of the ice the material is carried away downwind and/ordownslope.
Fig. 20 shows a cartoon of the model as envisioned for the dunesin the north. In HiRISE images we see three predominant weakspots: the crest, polygonal cracks on the stoss slope, and aroundthe dune interface with the substrate.
Fig. 11. Four different latitudes show cases of polygonal cracks forming in the overlying seasonal layer of ice: (a) ESP_024860_2525, acquired at 72.29N/311.75E, Ls 30; (b)ESP_024265_2535, acquired at 73.35N/355.1E, Ls 8; (c) ESP_024428_2605, acquired at 80.22N/217.1E, Ls 14; (d) ESP_024699_2650, acquired at 84.7N/0.7E, Ls 24. Cracksgenerally occur on the stoss side of the dune as shown for the barchan dunes on the right. They also occur in flatter regions of transverse dunes, shown on the left. Timing oftheir appearance varies widely. Sometimes (top right, arrow) just gas emerges from the crack, forming a bright line of re-condensed frost (contrast enhanced). More typicallydust or sand from the dune is propelled out the crack to the top of the seasonal ice.
Fig. 12. (a) An example of polygonal cracks in the seasonal ice is shown from a sub-image of ESP_026050_2605, acquired at 80.22N/217E at Ls 71. (b) When the seasonal ice isgone polygonal cracks are no longer discernible, as shown in this sub-image of ESP_026551_2605, taken at Ls 88, confirming that the cracks are in the ice, not on the dunes.
890 C.J. Hansen et al. / Icarus 225 (2013) 881–897

3.2.1. Ice layer weak spotsThe images show that the crest of the dunes is a weak spot – the
ice there thins and cracks early in spring. In our hypothesizedapplication of the Kieffer model to the northern dunes, seasonalfrost sinters into competent ice sheets on the stoss and lee sidesof the dune. A component of the weight of these sheets acts inthe downhill direction (away from the crest and brink of the dune).Usually this downhill shear stress is balanced by friction with theunderlying sand; however, if basal sublimation is occurring thenthe coefficient of friction may be reduced (or even eliminated) bypressure from the produced gas layer. At the top of the dune theweight of the ice acts downhill in diverging directions, which setsup tensional stresses in the ice at this location. These tensionalstresses can widen and lengthen preexisting cracks creating a nat-ural area for outgassing, which in turn mobilizes loose sand thatgets ejected and deposited on top of the surrounding ice. Loosegranular material on top of sublimating ice is rapidly fluidized(Cedillo-Flores et al., 2011) and flows easily down the slipface.Smaller particles are blown downwind from the opening at thecrest.
More difficult to explain are the weak spots at the interface be-tween the dune and the substrate. Perhaps differences in the mate-rial of the dune and the substrate lead to differential thermalexpansion and contraction as the CO2 is deposited, that disruptsthe sintering process.
As discussed in Section 2.2 shallow furrows on barchan duneslead to the dune-substrate interface (and occasionally to the crest)and can be correlated with locations of outbreaks of surface mate-rial. This may be the most analogous phenomenon in the north to
the formation of the araneiform terrain in the south: gas funneledto a weak spot erodes and entrains surface material. Modeling indi-cates that sub-ice gas flow can reach 10 m/s, adequate to entrain400 lm particles (Thomas et al., in preparation). The differencein the north is that the dune surface is only weakly consolidatedand furrows may be erased by eolian sediment transport (Bourke,submitted for publication) rather than eroding more permanentchannels.
3.2.2. Gas flowFig. 21 shows a typical example of fine material in fan-shaped
deposits oriented in numerous directions. The similar directionsof the numerous fans at different sources are consistent with thedeposition direction of sand and dust being determined by windsthat change direction over the duration of the gas release. This im-plies that (a) most of the vents open at the same time, and (b) theystay open or seal and re-open multiple times (Thomas et al., 2010).Fluid dynamics models show that it is possible to maintain gasflow after the vent has opened with adequate pressure to entrainsurface material, leading to new fans pointed in different orienta-tions as the wind direction varies (Thomas et al., 2011a). Steadystate flow can produce fans that are 5–25 m in length (Thomaset al., 2011b).
3.3. Frost budgets and timing of activity
It seems clear that much of the activity described is being dri-ven by CO2 frost and its removal. We would therefore like tounderstand better when seasonal frost exists on dune slopes (bothstoss and lee). Insolation, and by extension seasonal frost budgets,depends on terrain slope and aspect (defined to increase to the eastwith north as zero). This dependence becomes more sensitive asone approaches the pole. Fig. 22 illustrates the variability in totalannual insolation incident on surfaces of a given slope and aspect.In the mid-latitudes, pole- and equator-facing slopes generally re-ceive less or more insolation than adjacent flat terrain respectively,whereas at the pole itself any sloping surface receives more insola-tion than flat terrain. In regions close to the pole, this behavior be-comes more complex. In the latitude range of interest (80–85"N),most slopes receive more insolation than flat terrain. However,some counter-intuitive peculiarities exist, for example a north-facing lee slope of a dune (34") at 85"N receives approximatelythe same amount of sunlight as adjacent flat terrain when totaledover the whole year (Fig. 22). The seasonal distribution of whenthis energy arrives though is quite different. Fig. 23 breaks outsome parts of the year within the defrosting season for closerinspection. Although terrain aspect matters little after Ls 20, ithas a dominant effect within the crucial defrosting season fromLs 350–20.
Fig. 13. This sequence acquired at 84N/233.2E (‘‘Buzzel’’) shows the progression from the initial cracks along the crestline to sandfalls along the entire slipface. From left toright the images are ESP_025126_2640 at Ls 39.5, ESP_025416_2640 at Ls 49.6, ESP_025561_2640 at Ls 54.6, and ESP_025851_2640 at Ls 64.5. Sub-images a and d have beenbrightened relative to normal RGB processing.
Fig. 14. Sand flows and a small cloud of dust (arrow) kicked up by falling materialare captured in this sub-image of PSP_007962_2635, acquired at 83.5N/118.6E(‘‘Tleilax’’), at Ls 55.7. The dune with the dust cloud is !40 m high, and the angle ofthe slipface is !26". North is up in this figure, illumination is from the lower left,and the entire image is !1.3 km wide. The slipfaces are primarily oriented sunward.
C.J. Hansen et al. / Icarus 225 (2013) 881–897 891

Fig. 15. These three images taken at 84N/233.2E (‘‘Buzzel’’) depict the before and after morphology of a dune in one Mars year, and show association of seasonal activity withthe new alcoves. The top image was taken first, in the martian summer when the dunes were free of seasonal ice. The middle image was acquired in the spring and showstypical seasonal activity at the location of the new alcoves. The bottom image shows the new alcoves and their debris aprons. New ripples have already started to form on thenew debris aprons. This particular image set does not show when in the intervening year the gullies formed.
Fig. 16. An alcove several meters deep, indicated by the arrow, at 84N/233.2E (‘‘Buzzel’’) has been erased in less than 2 Mars years. The MY29 sub-image is fromPSP_007905_2640, taken at Ls 54. The alcove is barely discernible in the MY30 sub-image of ESP_016779_2640, taken at Ls 56. The alcove is gone in the MY31 sub-image ofESP_025561_2640, taken at Ls 55.
892 C.J. Hansen et al. / Icarus 225 (2013) 881–897

We examine the seasonal behavior of the frost in these high lat-itude locations by simulating the surface temperature with a stan-dard thermal diffusion model similar to that employed by Dundasand Byrne (2010) and based on a long line of such models (e.g.Kieffer et al., 1977). We balance incoming shortwave radiation,longwave atmospheric emission (assumed to be 4% of the noon-time shortwave flux (Aharonson and Schorghofer, 2006; Haberleand Jakosky, 1991); but reduced by cos2(slope/2) for sloping sur-faces, which see less sky), conductive exchange with subsurfacelayers and outgoing emitted longwave radiation. Incoming short-wave radiation is calculated for each slope and aspect of interest.Self-shadowing of the terrain may occur, but the model is onlyone-dimensional and shadows cast from nearby topography areneglected. We run the model first to simulate the temperature, al-bedo and emissivity (all of which change as frost comes and goes)of flat terrain with constraints described below. We use this flatterrain history to calculate scattered shortwave radiation andemitted longwave radiation incident on the sloping surfaces fromsurrounding terrain. To do this we assume that these slopes aresurrounded by an infinite flat plane that behaves like our simulatedflat terrain and scatters like a Lambert surface, i.e. the slopes re-ceive a flux of p sin2(slope/2) times the radiance leaving eachsquare meter of flat terrain.
If surface temperature falls below the frost point at that season(determined from a scaled version of the Viking lander pressurecurve) then we hold the surface temperature constant at that valueand allow CO2 ice to accumulate or ablate in response to energybalance at the surface and conducted heat from below. We utilizethermophysical parameters common to porous basaltic sandy sur-faces on Mars i.e. albedo 0.15, emissivity 0.95, thermal inertia220 J m#2 K#1 S#0.5, density 1650 kg m#3 and heat capacity of837 J kg#1 and keep these parameters constant with depth. Varia-tion of these parameters within reasonable bounds does not affectthe results on peak frost depth and timing in a significant way. Pre-vious suggestions of anomalously low thermal inertias in theOlympia Undae (Paige et al., 1994) appear explainable by the pres-ence of buried ice (Putzig et al., 2010). The depth of this ice de-pends on the slope and aspect of the terrain (Schorghofer andAharonson, 2005; Aharonson and Schorghofer, 2006) and atmo-spheric water vapor content, so inclusion of its effects in a self-con-sistent way requires a broader modeling effort than undertakenhere. We do not include any buried ice in the following simula-tions, which would make our frost budgets erroneously large. Inthe following paragraph we explain how we compensate for this.Finally, layer thickness, maximum depth, and timestep in the mod-
Fig. 17. Bright–dark–bright sublimation patterns are illustrated in this sub-imageof ESP_025042_2650, acquired at 84.7N/0.7E (‘‘Kolhar’’), Ls 36.6. Bright–dark–brightbanding in this location can be seen on the crest of the dune, at the dune-substrateinterface, and even surrounding the cracks on the stoss side of the dunes.
Fig. 18. This sub-image of PSP_007181_2655, acquired at 85.4N/180.5E, Ls 28.4shows a bright fan.
Fig. 19. (a) Evidence that slope streaks are caused by mass-wasting. In general the fines flow downhill guided by the dune morphology, but one streak jutting out to the sidewas apparently directed by the wind (green arrow). Detached dark spots at the bottom of the slope streaks show that material appears to have skipped across the surface(black arrow). This is a sub-image of PSP_007193_2640, taken at 84.0N/233.2E, Ls 28.8. The bright–dark–bright banding is common, as discussed in Section 2.6. (b)PSP_007404_2640, acquired at Ls 36, shows lengthening streaks. (c) PSP_007905_2640, acquired at Ls 53.8. Contrast between the frost-covered surface and the slope streakmaterial from the sand dune is beginning to fade. Some new bright frost appears to have condensed around the distal end of the uppermost streak, which has lengthened andbranched. (For interpretation of the references to color in this figure legend, the reader is referred to the web version of this article.)
C.J. Hansen et al. / Icarus 225 (2013) 881–897 893

el were chosen to fully resolve the diurnal and annual thermalwave and maintain numerical stability through a Courant criterion.
The peak frost mass and timing is most sensitive to the com-bined effects of frost albedo and emissivity. We take observations
of peak frost mass from the GRS results reported by Kelly et al.(2006) and adjust frost emissivity to 0.65 to reproduce this for flatterrain within our model. This emissivity is anomalously low; theactual physical reason for the low frost budgets is the buriedground ice that we neglected. Thus, we use frost emissivity toapproximate the effects of buried ground ice (as GCM models didbefore ground ice was included in their calculations (Haberleet al., 2008)). We then varied frost albedo until our modeled flatterrain at 80"N defrosted at the correct season. Arrakis (80"N/122.5"E) still has visible frost at Ls 82, while another observationat that latitude (but at 217"E) shows bare ground at Ls 88. We pickthe mid-point (Ls 85) to be the defrosting season at that latitude.The frost albedo, which yields this defrosting date is found to0.72 and we employ this value in all the following runs. In reality,frost albedo and emissivity are not constant with season or loca-tion (Byrne et al., 2008; Titus et al., 2001). For the purposes of com-paring differently sloped surfaces to each other we have neglectedthis variation. We examine time-variable frost albedo in a compan-ion paper (Portyankina et al., 2013).
We defer to future work a full treatment of additional effectssuch as buried ground ice and time-variable frost albedo. The re-sults reported here are intended to facilitate comparison betweendifferently sloped terrains rather than be the most accurate possi-ble representation of Mars itself.
Fig. 24 illustrates the seasonal frost expected to accumulate onthe lee (at the angle of repose, 34") and stoss (slopes of 5–10") sidesof a dune at 80"N as a function of aspect. As expected from the pre-ceding discussion, aspect plays a crucial role in determining frostbehavior. In a scene with dunes of many orientations we shouldexpect a great variety of frost-driven activity. We find that flat ter-rain here has a peak frost mass of 708 kg m#2 at Ls 10 (tuned viafrost emissivity to approximately match the GRS results of Kellyet al. (2006)). The sloping dune faces accumulate more and defrostlater when north-facing and vice versa when south-facing. A 10"stoss slope may accumulate anywhere between 598 and810 kg m#2 depending on its aspect and have its peak frost loadanytime between Ls 357 and 17. This behavior becomes even moreextreme for the steeper lee slopes (34"). Steep south-facing leefaces accumulate only 491 kg m#2 and start losing frost as earlyas Ls 339 (such is the quantity of the heat they absorbed duringthe previous summer), whereas steep north-facing lee faces accu-mulate 773 kg m#2 and do not start to lose frost until Ls 18.
The season in which final defrosting is expected follows similartrends to peak frost timing (Fig. 25). All modeled slopes defrostedby Ls 91. Lee slopes are expected to lose their frost coveringbetween Ls 43 and 86 while frost on 10" stoss slopes disappears
Fig. 20. Ice (gray bars) thins and cracks at the crest of the dune, exposing sand anddust, which is mobilized by the gas flow (blue arrows) from under the ice layer.Material cascades down the slip face and/or is blown out over the stoss side of thedune (black arrows). Large flat expanses of sand (such as the stoss) covered by iceare susceptible to polygonal cracking as the pressure of the gas from basalsublimation builds. (For interpretation of the references to color in this figurelegend, the reader is referred to the web version of this article.)
Fig. 21. This sub-image of ESP_016032_2600, acquired in Arrakis (Fig. 2b) at 80N/122.5E, Ls 29.7, shows multiple streaks from individual sources with similardirectional patterns, and with the same relative sizes.
Fig. 22. Total annual insolation for a sloping surface at 80"N (left) and 85"N (right). Insolation has been normalized to the total incident at flat terrain at these latitudes. Thewhite contour has a value of 1.0 i.e. equivalent to the flat terrain insolation. Slope is the radial coordinate and aspect the azimuthal.
894 C.J. Hansen et al. / Icarus 225 (2013) 881–897

between Ls 76 and 91. In contrast, flat terrain defrosts at Ls 85 (aswe forced it to in order to agree with observations). Fig. 25 showsthat defrosting dates vary most between slopes when they aresouth-facing; in contrast, north-facing slopes all defrost in a nar-row seasonal range. It is interesting to note though that pole-facingstoss slopes collect more frost than pole-facing lee slopes (Fig. 24)even though they defrost at approximately the same time.
3.4. Examples of spring defrosting
Inspection of Fig. 25 shows several trends that should be appar-ent in the images. Consider a dune that has a south-facing slipface(slope aspect of 180 for a 34" slope). The slipfaces oriented to thesouth will lose their cover of seasonal ice much earlier (as earlyas Ls 50) than the north-facing gradually-sloping stoss side of thesame dunes. In contrast, a dune with a north-facing slipface willlose the seasonal ice cover across the entire dunefield at closer tothe same time: Ls 80 for the south-facing stoss side, Ls 90 for theslipface.
Fig. 26 illustrates the spring defrosting sequence of a dune fieldat 81N/156E. At Ls 0.4 the entire dune field is covered with its layerof seasonal CO2. As spring progresses cracks and fans appear. Themore southward-facing gradually-sloping stoss side of the duneshas begun to defrost around Ls 70. At Ls 85 only the steep north-ward-facing slopes retain their frost cover.
Consistent with predictions, Fig. 8 shows for south-facing slip-faces, that the upper part of the slipface is ice-free at Ls = 57 whileshallower slopes are defrosting at Ls = 71. Flatter ground is still
frosted, as expected. By Ls = 88 (Fig. 11b) the entire dunefield isice-free.
4. Summary and comparison to southern seasonal phenomena
In the north, as in the south, spring sublimation of the seasonalCO2 polar cap is a dynamic process. In the north activity is
Fig. 23. Integrated insolation as a function of slope and aspect (formatted as in Fig. 22) in three seasonal slices (left to right, Ls 350–360, 0–10, 10–20) with common colorscale.
Fig. 24. Peak frost mass (left) and timing (right) as a function of slope aspect. Stoss sides have slopes 5–10" and lee sides !34". Flat terrain behavior shown for comparison.
Fig. 25. Final defrosting season as a function of slope aspect, formatted as in Fig. 24.
C.J. Hansen et al. / Icarus 225 (2013) 881–897 895

concentrated on the dunes. Dune stoss and lee slopes play a majorrole in the way that spring activity progresses.
We find that the Kieffer basal sublimation model, well-devel-oped to explain southern sublimation processes, is consistent withand provides a good explanation for the activity imaged in thenorth. Fans of dark surface material (dune sand in the north) pro-pelled to the top of the ice layer by escaping gas are deposited indirections determined by the prevailing wind and/or slope. Brightfans form in the north also, and like in the south form only in lim-ited time intervals, apparently when conditions are just right.
Three main weak spots are identified for gas escape on thedunes: the crest, the dune-ground interface, and polygonal crackson the stoss. Polygonal cracking is also seen in the southern hemi-sphere. The physics at the crest of the dune are likely the same as atthe channel edges in southern araneiform terrain: an inherentweakness due to underlying topography and the early exposureto sunlight. There are no southern counterparts to the outbreakswe see at the dune-substrate interface, or the bright–dark banding.
Furrows on dunes in the north are probably the counterpart tothe araneiform channels in the south, moving trapped gas to thenearest opening; however, unlike in the south they are not perma-nently carved into the surface.
Sand flows from the dune crests are attributed to the release ofgas from basal sublimation through cracks in the ice along thedune crest. This cover of sand may provide the mantle requiredfor CO2 fluidization after burial, which might in turn be the causeof the large new alcoves. More work remains to validate that theconditions for CO2 fluidization can be met. Large (meters deep) al-coves can be erased in <3 Mars years.
All the different dune slopes add a complexity that can be mod-eled, for insolation distribution on a variety of aspect angles. Thesepredictions can be used to predict peak frost and Ls of final sublima-tion of the frost. The more complex model we have envisioned for thefuture will in turn be compared to observations to derive frost prop-erties such as albedo and emissivity, and distribution of ground ice.
Landscape evolution is occurring on Mars today, in the currentclimate, driven by sublimation of the seasonal CO2 polar cap.
Acknowledgments
We were fortunate to have Hugh Kieffer (originator of the ‘‘Kief-fer Model’’ described herein, and a mentor to several of us) as one
of our reviewers. We are very appreciative of his time, and espe-cially his effort to replicate our results, which led to substantialimprovements to this paper. We also thank an anonymous re-viewer for their positive comments. This work was supported bythe Mars Reconnaissance Orbiter mission at the Jet Propulsion Lab-oratory, California Institute of Technology, under contracts withthe National Aeronautics and Space Administration.
References
Aharonson, O., Schorghofer, N., 2006. Subsurface ice on Mars with roughtopography. J. Geophys. Res. 111, 11007. http://dx.doi.org/10.1029/2005JE002636.
Aharonson, O., Zuber, M.T., Smith, D.E., Neumann, G.A., Feldman, W.C., Prettyman,T.H., 2004. Depth, distribution and density of CO2 deposition on Mars. J.Geophys. Res. 109, E05004. http://dx.doi.org/10.1029/2003JE002223.
Appere, T. et al., 2011. Winter and spring evolution of the northern seasonaldeposits on Mars from OMEGA on Mars Express. J. Geophys. Res. 116, E05001.http://dx.doi.org/10.1029/2010JE003762.
Bourke, M.C., submitted for publication. Seasonal formation of furrows on martianpolar dunes.
Bourke, M.C., Balme, M., Beyer, R.A., Williams, K.K., Zimbelman, J., 2006. Acomparison of methods used to estimate the height of sand dunes on Mars.Geomorphology 81, 440–452.
Boynton, W.V. et al., 2003. Constraints on the distribution of hydrogen in the polarregions of Mars and implications for ice formation processes. AGU. AbstractP32-B05.
Byrne, S., Murray, B.C., 2002. North polar stratigraphy and the paleo-erg of Mars. J.Geophys. Res. 107. http://dx.doi.org/10.1029/2001JE001615, 11-1.
Byrne, S., Zuber, M.T., Neumann, G.A., 2008. Interannual and seasonal behavior ofmartian residual ice-cap albedo. Planet. Space Sci. 56, 194–211.
Cedillo-Flores, Y., Treiman, A.H., Lasue, J., Clifford, S.M., 2011. CO2 gas fluidization inthe initiation and formation of martian polar gullies. Geophys. Res. Lett. 38,L21202. http://dx.doi.org/10.1029/2011GL049403.
Chevrier, V.F., Altheide, T.S., 2008. Low temperature aqueous ferric sulfate on thesurface of Mars. Geophys. Res. Lett. 35, L22101. http://dx.doi.org/10.1029/2008GL035489.
Clancy, R.T. et al., 2000. An intercomparison of ground-based millimeter, MGS, TES,and Viking atmospheric temperature measurements: Seasonal and interannualvariability of temperatures and dust loading in the global Mars atmosphere. J.Geophys. Res. 105, 9553–9571.
Coleman, S.J., Hayward, R.K., 2011. A higher resolution update to Viking-basedmartian north polar dune slipface analyses. Lunar Planet. Sci. 42. Abstract#1436.
Cutts, J.A., Blasius, K.R., Briggs, G.A., Carr, M.H., Masursky, H., Greeley, R., 1976.North polar region of Mars – Imaging results from Viking 2. Science 194, 1329–1337.
Delamere, W.A. et al., 2010. Color imaging of Mars by the High Resolution ImagingScience Experiment (HiRISE). Icarus, 205, 38–52.
Diniega, S., Byrne, S., Bridges, N.T., Dundas, C.M., McEwen, A.S., 2010. Seasonality ofpresent-day martian dune gully activity. Geology 38, 1047–1050.
Fig. 26. The sub-images shown here are 1.3 km across, from the dune field known informally as ‘‘Zanovar,’’ at 81.0N/156.0E. They are, from left to right, upper row,ESP_024061_2610, ESP_024984_2610, ESP_025406_2610, lower row, ESP_025973_2610, ESP_026105_2610, and ESP_026461_2610.
896 C.J. Hansen et al. / Icarus 225 (2013) 881–897

Dundas, C., Byrne, S., 2010. Modeling sublimation of ice exposed by new impacts inthe martian mid-latitudes. Icarus 206, 716–728.
Farmer, C.B., Doms, P.E., 1979. Global and seasonal variation of water vapor on Marsand the implications for permafrost. J. Geophys. Res. 84, 2881–2888.
Garvin, J.B., Frawley, J.J., Sakimoto, S.E.H., 1999. North polar dunes on Mars: MOLAmeasurements and implications for sediment volumes. Lunar Planet. Sci. 30.Abstract #1721.
Haberle, R.M., Jakosky, B.M., 1991. Atmospheric effects on the remotedetermination of thermal inertia on Mars. Icarus 90, 187–204.
Haberle, R.M. et al., 2008. The effect of ground ice on the martian seasonal CO2 cycle.Planet. Space Sci. 56, 251–255.
Hansen, C.J., Thomas, N., Portyankina, G., McEwen, A.S., Becker, T., Byrne, S.,Herkenhoff, K., Kieffer, H., Mellon, M., 2010. HiRISE observations of gassublimation-driven activity in Mars’ southern polar regions: I. Erosion of thesurface. Icarus 205, 283–295.
Hansen, C.J. et al., 2011. Seasonal erosion and restoration of Mars’ northern polardunes. Science 331, 575–578.
Hayward, R.K. et al., 2008. Mars global digital dune database: Distribution in northpolar region and comparison to equatorial region. Lunar Planet. Sci. 39. Abstract#1208.
Hayward, R.K., Fenton, L.K., Tanaka, K.L., Titus, T.N., Colaprete, A., Christensen, P.R.,2010. Mars Global Digital Dune Database; MC1: U.S. Geological Survey Open-File Report 2010-1170. <http://pubs.usgs.gov/of/2010/1170/>.
Hoffman, N., 2002. Active polar gullies on Mars and the role of carbon dioxide.Astrobiology 2, 313–323. http://dx.doi.org/10.1089/153110702762027899.
Horgan, B.H.N., Bell, J.F., 2012. Seasonally active slipface avalanches in the northpolar sand sea of Mars: Evidence for a wind-related origin. Geophys. Res. Lett.39, L09201.
Kelly, N.J. et al., 2006. Seasonal polar carbon dioxide frost on Mars: CO2 mass andcolumnar thickness distribution. J. Geophys. Res. 111, E03S07. http://dx.doi.org/10.1029/2006JE002678.
Kereszturi, A. et al., 2009. Recent rheologic processes on dark polar dunes of Mars:Driven by interfacial water? Icarus 201, 492–503.
Kereszturi, A., Möhlmann, D., Berczi, Sz., Ganti, T., Horvath, A., Kuti, A., Sik, A.,Szathmary, E., 2010. Indications of brine related local seepage phenomena onthe northern hemisphere of Mars. Icarus 207, 149–164.
Kieffer, H.H., 2000. Annual punctuated CO2 slab-ice and jets on Mars. LPIContribution #1057.
Kieffer, H., 2007. Cold jets in the martian polar caps. J. Geophys. Res. 112, E08005.Kieffer, H.H., Titus, T.N., 2001. TES mapping of Mars’ north seasonal cap. Icarus 154,
162–180.Kieffer, H.H., Martin, T.Z., Peterfreund, A.R., Jakosky, B.M., Miner, E.D., Palluconi, F.D.,
1977. Thermal and albedo mapping of Mars during the Viking primary mission.J. Geophys. Res. 82, 4249–4291.
Kieffer, H.H., Christensen, P.R., Titus, T.N., 2006. CO2 jets formed by sublimationbeneath translucent slab ice in Mars’ seasonal south polar ice cap. Nature 442,793–796.
Lancaster, N., Greeley, R., 1990. Sediment volume in the north polar sand seas ofMars. J. Geophys. Res. 95, 10921–10927.
Langevin, Y. et al., 2007. Evolution of the seasonal caps of Mars observed byOMEGA on Mars Express. In: Seventh International Conference on Mars, LPI 1353.p. 3246.
Leighton, R.B., Murray, B.C., 1966. Behavior of carbon dioxide and other volatiles onMars. Science 153, 136–144.
Litvak, M.L. et al., 2007. Long-term observations of southern winters on Mars:Estimations of column thickness, mass, and volume density of the seasonal CO2
deposit from HEND/Odyssey data. J. Geophys. Res. 112, E03S13.Malin, M.C., Edgett, K.S., 2000. Frosting and defrosting of martian polar dunes. Lunar
Planet. Sci. XXXI. Abstract #1056.Malin, M.C., Edgett, K.S., 2001. Mars Global Surveyor Mars orbiter camera:
Interplanetary cruise through primary mission. J. Geophys. Res. 106, 23429–23570.
Malin, M.C. et al., 1998. Early views of the martian surface from the Mars OrbiterCamera of Mars Global Surveyor. Science 279, 1681–1685.
Massé, M., Bourgeois, O., Le Mouelic, S., Verpoorter, C., Le Deit, L., Bibring, J.-P., 2010.Martian polar and circum-polar sulfate-bearing deposits: Sublimation tillsderived from the North Polar Cap. Icarus 209, 434–451.
Massé, M., Bourgeois, O., Le Mouelic, S., Verpoorter, C., Spiga, A., Le Deit, L., 2012.Wide distribution and glacial origin of polar gypsum on Mars. Earth Planet. Sci.Lett. 317–318, 44–55.
Matsuo, K., Heki, K., 2009. Seasonal and interannual changes of volume density ofmartian CO2 snow from time-variable elevation and gravity. Icarus 202, 90–94.
McEwen, A. et al., 2007. MRO’s High Resolution Imaging Science Experiment(HiRISE). J. Geophys. Res. 112, http://dx.doi.org/10.1029/2005JE002605.
McEwen, A. et al., 2010. The High Resolution Imaging Science Experiment (HiRISE)during MRO’s Primary Science Phase (PSP). Icarus 205, 2–37.
Möhlmann, D.T.F., 2008. The influence of van der Waals forces on the state of waterin the shallow subsurface of Mars. Icarus 195, 131–139.
Möhlmann, D., Thomsen, K., 2011. Properties of cryobrines on Mars. Icarus 212,123–130.
Paige, D.A., Bachman, J.E., Keegan, K.D., 1994. Thermal and albedo mapping of thepolar regions of Mars using Viking thermal mapper observations, 1, north polarregion. J. Geophys. Res. 99, 25959–25992.
Pilorget, C., Forget, F., Millour, E., Vincendon, M., Madeleine, J.B., 2011. Dark spotsand cold jets in the polar regions of Mars: New clues from a thermal model ofsurface CO2 ice. Icarus 213, 131–149.
Piqueux, S., Christensen, P.R., 2008. North and south sub-ice gas flow and venting ofthe seasonal caps of Mars: A major geomorphological agent. J. Geophys. Res.113, E06005. http://dx.doi.org/10.1029/2007JE003009.
Piqueux, S., Byrne, S., Richardson, M., 2003. The sublimation of Mars’ southernseasonal CO2 ice cap and the formation of spiders. J. Geophys. Res. 108 (E8), 3-1.
Pommerol, A. et al., 2011. Evolution of south seasonal cap during martian spring:Insights from high-resolution observations by HiRISE and CRISM on MarsReconnaissance Orbiter. J. Geophys. Res. 116, E08007. http://dx.doi.org/10.1029/2010JE003790.
Portyankina, G., Markiewicz, W.J., Hansen, C.J., Thomas, N., 2010. HiRISEobservations of gas sublimation-driven activity in Mars’ southern polarregions: III. Models of processes involving translucent ice. Icarus 205, 311–320.
Portyankina, G., Pommerol, A., Aye, K.-M., Hansen, C.J., Thomas, N., 2011. Polygonalcracks in the seasonal semi-translucent CO2 ice layer in martian polar areas. J.Geophys. Res. 117, E02006.
Pommerol, A. et al., 2013. Observations of the northern seasonal polar cap on MarsIII: CRISM/HiRISE observations of spring sublimation. Icarus. 225, 911–922.
Portyankina, G. et al., 2013. Observations of the northern seasonal polar cap on MarsII: HiRISE photometric analysis of evolution of northern polar dunes in spring.Icarus. 225, 898–910.
Putzig, N.E., Mellon, M.T., Herkenhoff, K.E., Phillips, R.J., Davis, B.J., Ewer, K.J., 2010.Thermal anomaly in martian north polar erg likely due to near-surface ice. LPIContribution #1552.
Rivera-Valentin, E.G., Chevrier, V.F., Ulrich, R., Roe, L., 2012. Effects of freezing pointdepression on martian paleolake stability. Lunar Planet. Sci. 42. #1074.
Schorghofer, N., Aharonson, O., 2005. Stability and exchange of subsurface ice onMars. J. Geophys. Res. 110, E05003.
Smith, D.E., Zuber, M.T., Neumann, G.A., 2001. Seasonal variations of snow depth onMars. Science 294, 2141–2146.
Tanaka, K.L., Hayward, R.K., 2008. Mars-north circumpolar dunes: Distribution,sources, and migration history. LPI Dunes Workshop. Abstract #7012.
Thomas, N., Hansen, C.J., Portyankina, G., Russell, P.S., 2010. HiRISE observations ofgas sublimation-driven activity in Mars’ southern polar regions: II. Surficialdeposits and their origins. Icarus 205, 296–310.
Thomas, N., Portyankina, G., Hansen, C.J., Pommerol, A., 2011a. HiRISE observationsof gas sublimation-driven activity in Mars’ southern polar regions: IV. Fluiddynamics models of CO2 jets. Icarus 212, 66–85.
Thomas, N., Portyankina, G., Hansen, C.J., Pommerol, A., 2011b. Sub-surface CO2 gasflow in Mars’ polar regions: Gas transport under constant production rateconditions. Geophys. Res. Lett. 38 (8), CiteID L08203.
Titus, T.N., Kieffer, H.H., Mullins, K.F., Chrisensen, P.R., 2001. TES premapping data:Slab ice and snow flurries in the martian north polar night. J. Geophys. Res. 106,23181–23196.
Titus T., Kieffer, H.H., Langevin, Y., Murchie, S., Seelos, F., Vincendon, M., 2007. Brightfans in Mars’ cryptic region caused by adiabatic cooling of CO2 gas jets. AGU FM.Abstract #P24A-05.
Tsoar, H., Greeley, R., Peterfreund, A.R., 1979. Mars: The north polar sand sea andrelated wind patterns. J. Geophys. Res. 84, 8167–8180.
Wagstaff, K.L., Titus, T.N., Ivanov, A.B., Castano, R., Bandfield, J.L., 2008. Observationsof the north polar water ice annulus on Mars using THEMIS and TES. Planet.Space Sci. 56, 256–265.
Ward, A.W., Doyle, K.B., 1983. Speculation on martian north polar wind circulationand the resultant orientations of polar sand dunes. Icarus 55, 420–431.
C.J. Hansen et al. / Icarus 225 (2013) 881–897 897