naval postgraduate school monterey, … postgraduate school monterey, california [ f t copy ln...
TRANSCRIPT

NAVAL POSTGRADUATE SCHOOLMonterey, California
[ f t COPY
Ln
i21990~THESIS
COMPARISON OF THE DYNAMICS OF A LAND VS.
OCEANIC EXPLOSIVE CYCLONE.
by
Michael E. Kreyenhagen
December 1989
Thesis Advisor W. A. Nuss
Approved ror public release; distribution is unlimited.

Unclassifiedsecurit% classification of this pxaze
REIPORT DOC U.\ENTATION PAGE] a Rerort Security Classification Lilassified bRsrcieMrig2a SecuritN Clissification Authority 3 Distribution Availability of Report
2b Declassification Downgrading Schedule Approved for public release: distribution is unlimited.-1 Performirz Or-anization Report Numberts) 5 Nloniiornn Organization Report Numberl,
ta Name of Performing Organization 6b Office Symbol 7a Name of Monitoring OrganizationNaval Postgraduate School (if applicable) 35 Naval Postgzraduate Schooloc Address f ci ' y, stare. and ZIP code) 7b Address (cin', state, and ZIP code)Monterev, CA 93943-5000 Monterey. CA 93943-5000Sa Name of Funding Sponsoring Organization 8b Office Symbol 9 Procurement Instrument Identification Number
\c Address (city, state, and ZIP code) 10 Source of Funding Numbers
_____________________________________________Program Element N o IProject N o Task N o \ork L nt Accession N o
I I T!!;e include seciuritS asi2ain COMPIARISON OF THE DYNAMICS OF A LAND VS. OCEANIC EXPLOSIVECYCLONE.__________ ___
12 Persona! Minrt' .Jacl L. Krevenhaeen13 a 1 ~pe oi Report 13b l ime Covered 14 Date of Report iy-ear. rnonr/r, das,' t i Page CountMaster's Thesis From To December 19S9lb SupplernentarY Notatron 'Ih vies expressed in this thesis are those of the author and do not reflect the official pol-icy or po-sition of the Department of Defense or the U.S. Government.
i-Cosa*,l crdc 18 S ubjec: Tc; ms ( continue on reverse if necesar - and identtify N block nuiter)* Fied irnup Suizroun Meteorology. N iattitude, Explosive Development, ) ~ <7,
19 b.~at f(on'r: ruec ( reverse , nc.,cssarx aid":"i by Hiock iiunil~cr,Twexplosively developing cyclones aeanalvized and compared using asimilar diaiznoslic apprah otnna
cy-clone- developed over the Ul.S .. 1-ws during '14- 1 - November 19SS and was analy7ed -using, NNIC Nesled Grid -.iodel)analysis fields and GOES IR imagen%' A maritime cyclone rapidly developed over the western North Atlantic Ocean during03-0i January 1981). TIhe NNMC Spectral Model and GOES imagery are employed to describe the development of this storm.Uper-levelI vorticity. divergence and jet streak placement are examined along with low-level thermal advection. boundarylayer heat'ie and static stability for each storm.
Results indicate that the land and ocean storms have similar magnitude upper-lev el divergence associated withi 300 mh jetstrea.ks, however. they evolve differently. At low-levels, there are equal contributions from advection and suiace hecatingduring rapid development in the ocean case while advection w~as the piimary contribution in the land case. The initial staticstability was lwfor both cyclones, however, the ocean case maintained low static stability and tiuK appeares to be a majorfactor in determaining the depth and speed of rapid cyclone devclopment.(~ /
Dib.inA% ,labLhtv ofA.\stract 21 A\bs'Tact Sccuri:\ Clasi','cation
-- \zi'e ;;1 e;xo dylx ~Ie'crllorc b'i '.1 rt. cde! .. c OP"..": S\Mhot l
I tscki''ificd

Approved for public release; distribution is unlimited.
Comparison of the Dynamics of a Land vs.
Oceanic Explosive Cyclone.
by
Michael E. KreyenhagenLieutenant Commander, United States Navy
B.S., United States Naval Academy, 1979
Submitted in partial fulfillment of therequirements for the degree of
MASTER OF SCIENCE IN METEOROLOGY AND OCEANOGRAPHY
from the
NAVAL POSTGRADUATE SCHOOL-December 19S9
Author:
Michael E. K -enl en
Approved by:-%/~ 4
I .A . 'ushesi, Advisor
C. H-1. Wash, Second Reader
/l'obcrt J. Renard, Chairman,
Department of Meteorology

ABSTRACT.
Two explosively developing cyclones are analyized and compared using a similar
diagnostic approach. A continental cyclone developed over the U.S. Mid-west during
14-17 November 1988 and was analyzed using NMC Nested Grid model analysis fields
and GOES IR imagery. A maritime cyclone rapidly developed over the western North
Atlantic Ocean during 03-05 January 1989. The NMC Spectral Model and GOES im-
agery are employed to describe the development of this storm. Upper-level vorticitv. di-
vergence and jet streak placLment are examined along with low-level thermal advection,
boundary laver heating and static stability for each storm.
Results indicate that the land and ocean storms have similar magnitude upper-level
divergence associated with 300 nib jet streaks, however, they evolve difl'erentlh. At low-
levels, there are equal contributions from advection and surface heating during rapid
development in the ocean case while advection was the primary contribution in the land
case. The initial static stability was low for both cyclones, however, the ocean case
maintained low static stability and this appeares to be a major factor in determrining the
depth and speed of rapid cyclone development.
Accessinnr For
I i3 T'.VT il
A1-
:/o"
111>

TABLE OF CONTENTS
1. INTRODUCTION .............................................. IA. BACKGROUND ............................................ IB. DESCRIPTION OF DATA ..................................... 3
11. 14-17 NOVE.MBER 1988 SYNOPTIC ANALYSIS...................... 4
A. OVERVIEW ................................................ 4
B. LEE CYCLOGENESIS STAGE .................................. 4
C. RAPID DEEPENING STAGE .................................. 6D. THE FILLING STAGE ........................................ 7
E. SU.MMARY ................................................ S8
111. 03-05 JANUARY 1989 SYNOPTIC ANALYSIS ....................... 2)3
A. OVERVIEW ............................................... 2 3
B. PRE-CYCLOGENETIC STAGE ................................ 23
C. EXPLOSIVE DEVELOPMENT STAGE ........................... 2)4
D. THlE FILLING STAGE ...................................... 25
L. SLUM 1\I1A RY............................................... 26
IV. COM I',A-RISON OF DYNAM ICAL FORCING ...................... 42
A. UPPER-LEVEL PROCESSES ................................. .42
B. SURFACE LOW LEVEL FORCING ............................. 431
C. STATIC STABILITY.. ...................................... 46
D. SUMMIARY ............................................... 47
V. CONCLUSIONS .............................................. 60
LIST OF REFERENCES ........................................... 62
INITIAL DISTRIBUTION LIST.....................................64

LIST OF FIGURES
Fig. 1. Time Series of Land Cyclone Central Pressure........................ 9
Fig. 2. 1200 UTC 14 November 1988 Sea Level Analysis.................... 10
Fio. 3. 1200 UTC 14 November 198S 300 mb Analysis......................I I
Fi2. 4. 0000 UTC 15 November 1988 Sea Level Analysis....................12
Fig. 5. 1200 UTC 15 November 1988 Sea Level Analysis.................... 13
Flig. 6. 1200 UTC 15 November 19S8 300 mib Analysis...................... 14
Fig. 7. 1200 UTC 15 November 19SS Vertical Cross Section .................. 15
Fig. S. ISOI IJTC 15 November 19S8 GOES IR Imagery.................... 16
Fie 9. 0000 UTC 16 November 19SS 1000 mib Analysis..................... 17
Fig. 10. 0000 UTC 16 November 19SS 300 mib Analysis...................... Is
Fisz. 11. 0000 UTC 16 November 19SS Vecrtical Cross Section .................. 19
F; 2. 12. 0501 UTC 16 November 19SS GOES IR Imagery ..................... 20
Fie. 13. 1200 UTC 16 November 19SS Sea Level Analysis.................... 21
LI-q. 14. 1200 UTC 16 November 1988 300 mib Analysis...................... 22
Fig. 15. Time Series of Ocean Cyclone Central Pressure...................... 2S
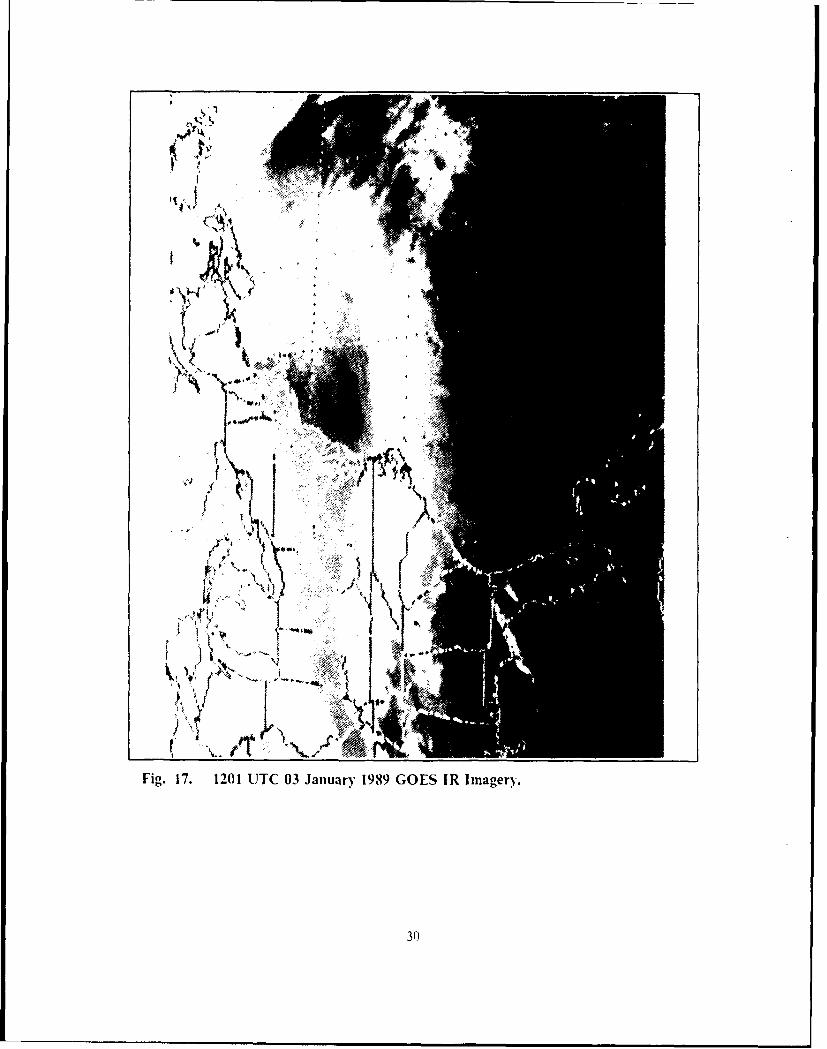
Fig. 16. 1200 LIC 03) January 1989 Seat Level Analysis ...................... 2(FLie. 17. 1201 UTC 03 January 1989 GOES IR Imagery.. .....................
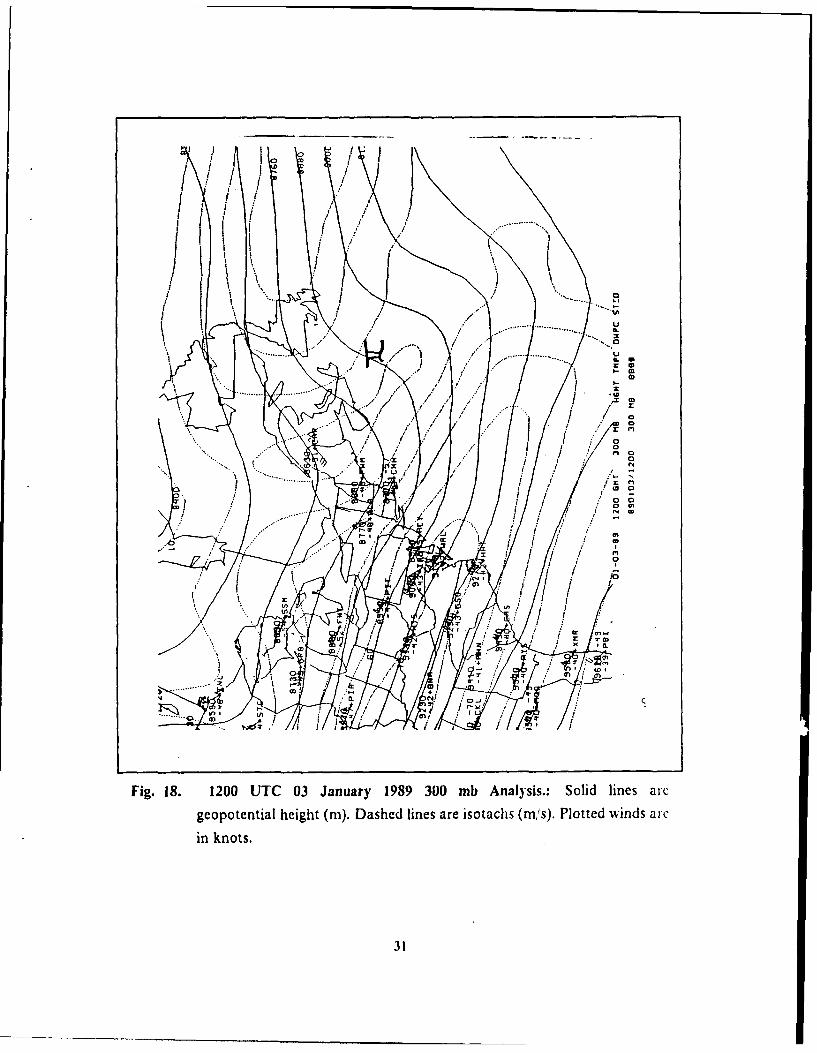
Fig. 1S. 1200 LTC 03 January 19S9 3100 mib Aiialvsis ........................ 31
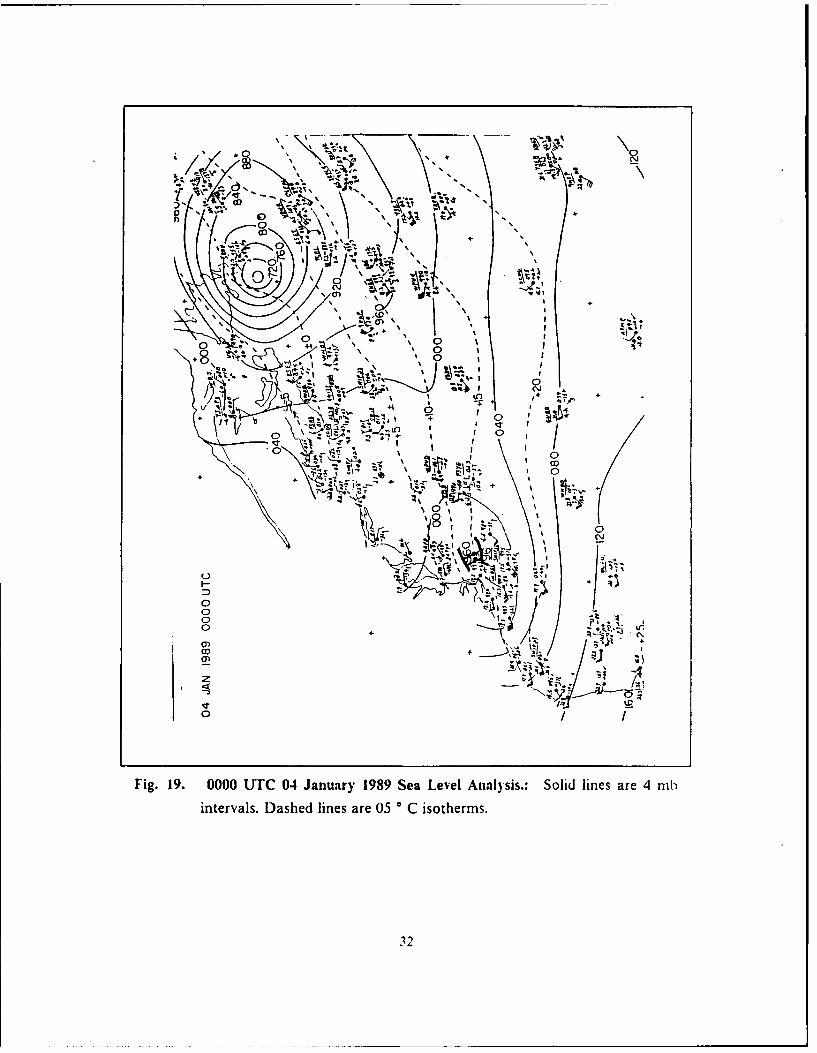
Ilg. 19. 0000) ITC 04 January 1989 Sea Level Analysis.......................
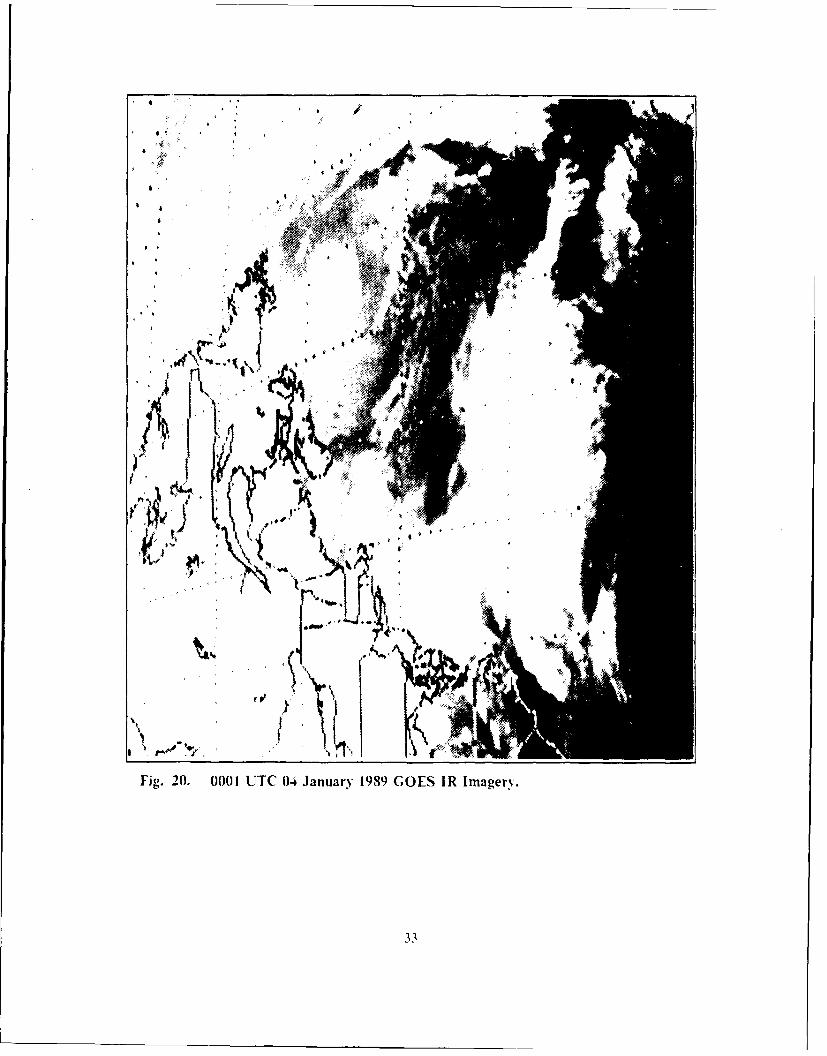
1ie 20. 0001() UTC 04 Januark I 989 GOES IR limaierv ........ 3......
I. 21 000 ITC 04 January 1989 300 mh Analysis ..................... 34
Lie.22. 0000 LIC 04 .lanuany 1989 Vertical Cross Sectionl......... ........... 5
lu. 231. 0600 UTC 04 January 1989 Sea Level Analy-sis ....................... 316
L -ic. 24. 12001 UTC 0.4 January 19S9 Sea Level Analysis ............. ......... 371i7 25. 1201 UTC 0.4 January 19S9 GOES JR Imazerv................
Lie. 26. 1200 U'TC 04 January 1989 300 nb Analysis ........................ 39
Lie f. 2 7. 0000) ITC 05 January 19S9 Sea Level Analysis ....................... 40
YVie. 2S. 0000 UTC 05 January 19S9 300 mb Analysis ........................ 41
Vie1. 29. 0000 L"I C 16 November 19SS 300 nib Divergence....................4()
Vi12. 30. 12001 L"TC 04 January 1989 300 nib Di'VerEence...................... 50
IFig. 31, . 18'" 1-"IC 03 J anuary 19S9 1000 nib 0 L ocal Change.................~ I
Fig. 32. 0000 UTC 04 January 1989 Temperature Advection Profile ........... 52Fig. 33. 0600 UTC 04 January 1989 1000 mb 0 Local Change ............... 53Fig. 34. 1200 UTC 04 January 1989 Temperature Advection Profile ........... 54Fig. 35. ISO UTC 15 November 1988 1000 mb 0 Local Change .............. 55Fig. 36. 1200 UTC 15 November 1988 Static StabilityFig. 37. 1200 UTC 16 November 1988 Static Stability......................57Fig. 3S. 0000 UTC 04 January 1989 Static Stabilit . ................
Fig. 39. 0000 UTC 05 January 1989 Static Stability ....................... 59
Fig. 39. 0000 UTC 05 Januar3" 1989 ~ ~~ Sa iS bity . . . . . . . . . . .. 5
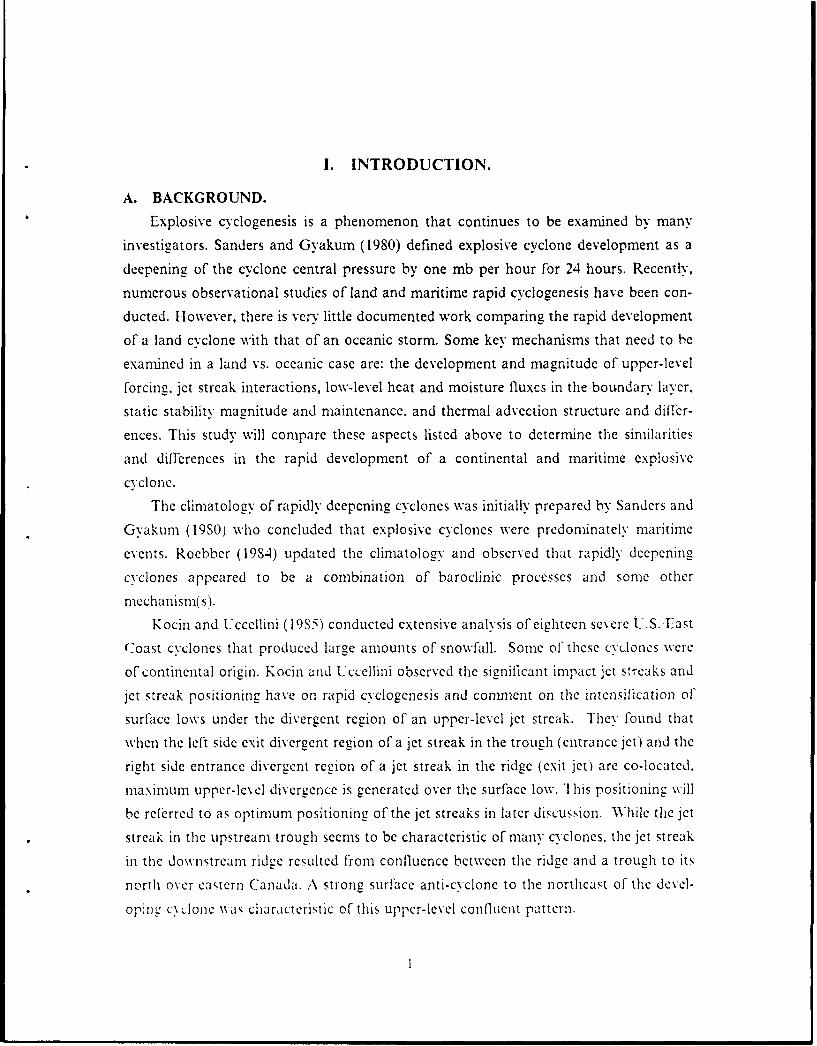
1. INTRODUCTION.
A. BACKGROUND.Explosive cyclogenesis is a phenomenon that continues to be examined by many
investigators. Sanders and Gyakum (1980) defined explosive cyclone development as a
deepening of the cyclone central pressure by one mb per hour for 24 hours. Recently.
numerous observational studies of land and maritime rapid cyclogenesis have been con-
ducted. However, there is very little documented work comparing the rapid development
of a land cyclone with that of an oceanic storm. Some key mechanisms that need to be
examined in a land vs. oceanic case arc: the development and magnitude of upper-level
forcing. jet streak interactions, low-level heat and moisture fluxes in theboundarv layer,
static stability magnitude and maintenance, and thermal advection structure and differ-
ences. This study will compare these aspects listed above to determine the sinilarities
and diflerences in the rapid development of a continental and maritime explosive
cyclone.
The climatology of rapidly deepening cyclones was initially prepared by Sanders and
Gvakum (19S0) who concluded that explosive cyclones were predoniinately maritime
events. Roebbcr (19S4) updated the climatology and observed that rapidly deepening
cyclones appeared to be a combination of baroclinic processes and some other
mechanism(s).
Kocin and Uccellini (1985) conducted extensive analysis of eighteen severe U.S.,Last
Coast cyclones that produced large amounts of snowfall. Some of thCsc cyclones were
of continental origin. Kocin and Uccellini observed the significant impact jet st-reaks and
jet streak positioning have on rapid cyclogenesis and comment on the intensification of
surface lows under the divergent region of an upper-level jet streak. They found that
when the left side exit divergent region of a jet streak in the trough (entrance jet) and the
right side entrance divergent region of a jet streak in the ridge (exit jet) are co-located,
maximum upper-level divergence is generated over the surface low. 'I is positioning will
be referred to as optimum positioning of the jet streaks in later discussion. While the jet
streak in the upstream trough seems to be characteristic of many cyclones, the jet streak
in the do\vntream ridge resulted from confluence between the ridge and a trouch to its
north over eastern Canada. A strong surface anti-cyclone to the northeast of the devel-
oping cyclone wa, characteristic of this upper-level confluent pattern.
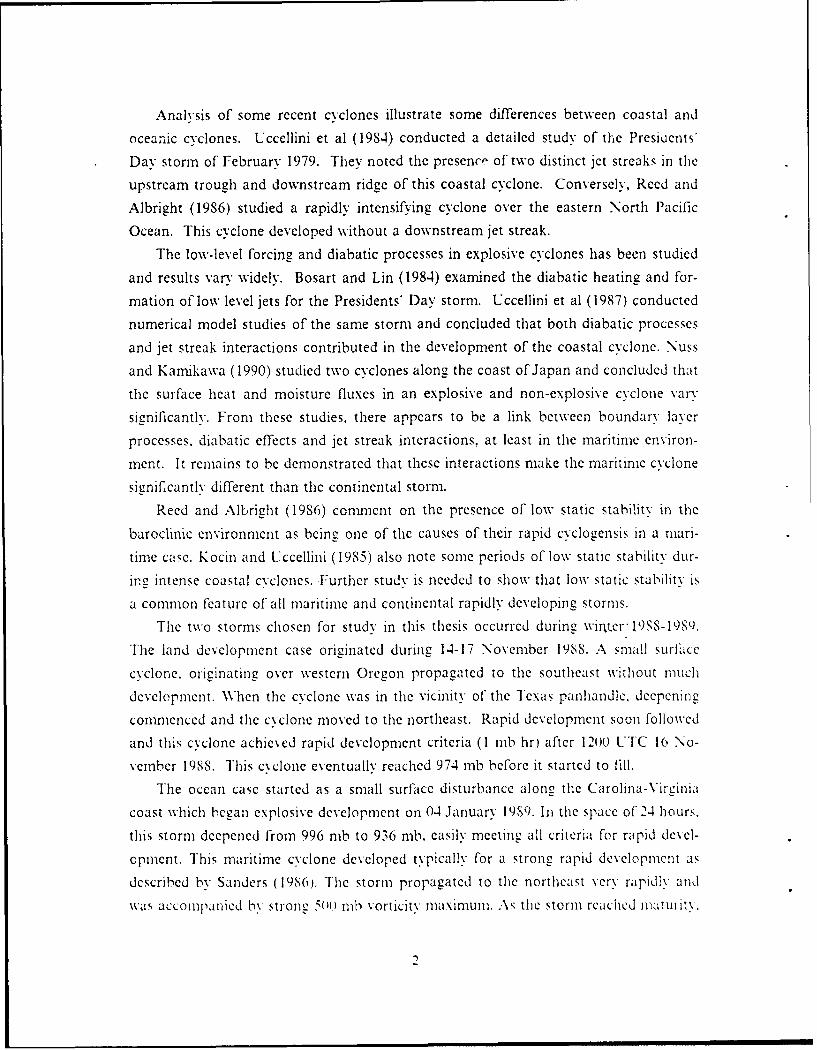
Analysis of some recent cyclones illustrate some differences between coastal and
oceanic cyclones. Uccellini et al (1984) conducted a detailed study of the Presioents'
Day storm of February 1979. They noted the presence of two distinct jet streaks in the
upstream trough and downstream ridge of this coastal cyclone. Conversely, Reed and
Albright (1986) studied a rapidly intensifying cyclone over the eastern North Pacific
Ocean. This cyclone developed without a downstream jet streak.
The low-level forcing and diabatic processes in explosive cyclones has been studied
and results vary widely. Bosart and Lin (1984) examined the diabatic heating and for-
mation of low level jets for the Presidents' Day storm. Uccellini et al (1987) conducted
numerical model studies of the same storm and concluded that both diabatic processes
and jet streak interactions contributed in the development of the coastal cyclone. Nuss
and Kamikawa (1990) studied two cyclones along the coast of Japan and concluded that
the surface heat and moisture fluxes in an explosive and non-explosive cyclone vary
significantly. From these studies. there appears to be a link between boundary layer
processes. diabatic effects and jet streak interactions, at least in the maritime environ-
ment. It remains to be demonstrated that these interactions make the maritime cyclone
signiflcantlv different than the continental storm.
Reed and Albright (19S6) conmment on the presence of low static stability in the
baroclinic environment as being one of the causes of their rapid cyclogensis in a mari-
time case. Kocin and Uccellini (1985) also note some periods of low static stability dur-
ini2 intense coastal cyclones. Further study is needed to show that low static stability is
a common feature of all maritime and continental rapidly developing storms.
The two storms chosen for study in this thesis occurred during winter19SS-198.
The land development case originated during 14-17 November 1988. A small surltce
cvclone. originating over western Oregon propagated to the southeast without much
development. When the cyclone was in the vicinity of the Texas panhandle, deepening
commenced and the cxclone moved to the northeast. Rapid development soon followed
and this cyclone achieved rapid development criteria (I mb hr) after 1200 UTC 16 No-
vember 1988. This cyclone eventually reached 974 nib before it started to fill.
The ocean case started as a small surface disturbance along the Carolina-Virginia
coast which began explosive development on 04 January 1989. In the space of 24 hours.
this storm deepened from 996 mb to 936 mb. easily meeting all criteria for rapid devel-
opment. This maritime cyclone developed typically for a strong rapid development as
described by Sanders (1986). The storm propagated to the northeast very rapidly and
was accompanied b- strong 5(0i) mb vorticity maximum. As the storm reached natUuitN.
2
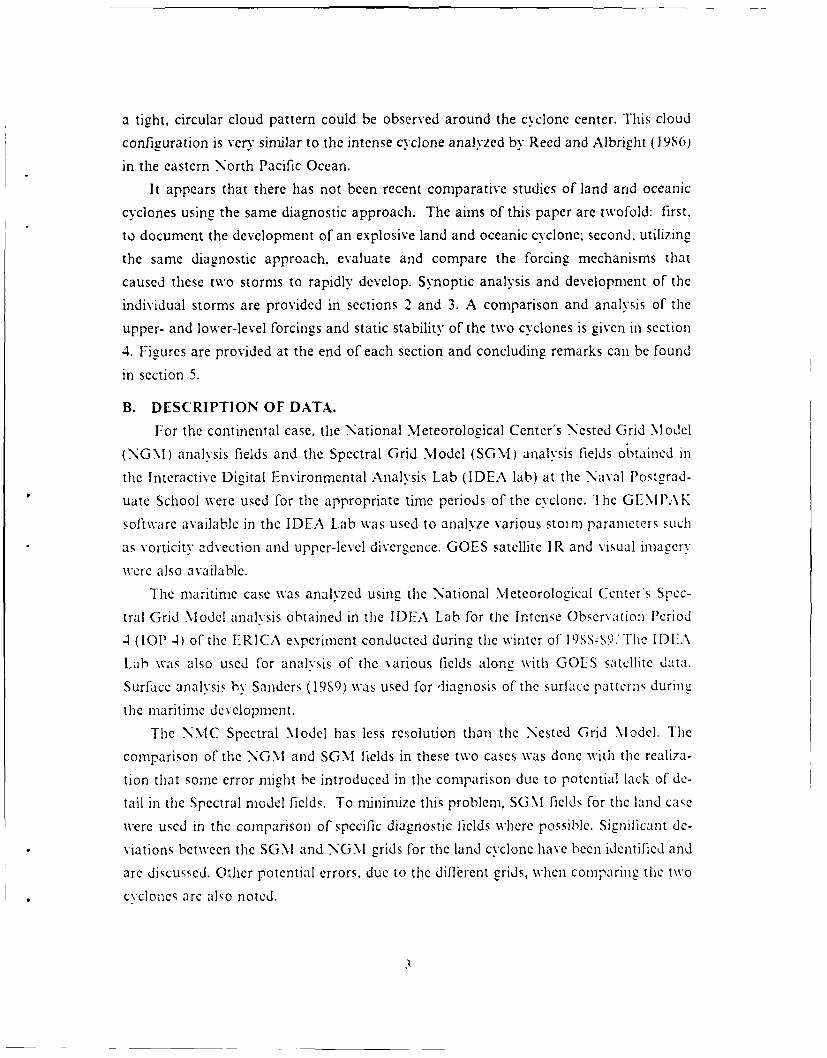
a tight, circular cloud pattern could be observed around the cyclone center. This cloud
configuration is very similar to the intense cyclone analyzed bv Reed and Albright (I 9S6)
in the eastern North Pacific Ocean.
It appears that there has not been recent comparative studies of land and oceanic
cyclones using the same diagnostic approach. The aims of this paper are twofold: first.
to document the development of an explosive land and oceanic cyclone; second. utilizing
the same diagnostic approach. evaluate and compare the forcing mechanisms that
caused these two storms to rapidly develop. Synoptic analysis and development of the
individual storms are provided in sections 2 and 3. A comparison and analysis of the
upper- and lower-level forcings and static stability of the two cyclones is given in section
4. Figures are provided at the end of each section and concluding remarks can be found
in section 5.
B. DESCRIPTION OF DATA.
For the continental case, the National Meteorological Center's Nested Grid Model
(NGNI) analysis fields and the Spectral Grid Model (SGM) analysis fields obtained in
the Interactive Digital Environmental Analysis Lab (IDEA lab) at the Naval Postgrad-
uate School were used for the appropriate time periods of the cyclone. The GE.MPAK
software available in the IDEA Lab was used to analyze various stoi rn parameters such
as vorticitv advection and upper-level divergence. GOES satellite IR and visual imagery
were also available.
The maritime case was analyzed using the National Meteorological Center's Spec-
tral Grid Model analysis obtained in the IDEA Lab for the Intense Observation Period
-4 (lOP 4) of the ERICA experiment conducted during the winter of 19SSS.- The IDEA
Lab was also used for analysis of the various fields alonE with GOES satcllitc data.
Surface analysis by Sanders (19S9) was used for iiagnosis of the surf ace patterns during
the maritime development.
The NMC Spectral Model has less resolution than the Nested Grid Model. The
comparison of the NGM and SGM fields in these two cases was done with the realiza-
tion that some error might be introduced in the comparison due to potential lack of de-
tail in the Spectral model fields. To minimize this problem, SGM fields for the land case
were used in the comparison of specific diagnostic fields where possible. Significant de-
viations between the SGM and NGM grids for the land cyclone have been identified and
are discussed. Other potential errors. due to the different grids, when comparing the two
cyclones are also noted.
3
I1. 14-17 NOVEMBER 1988 SYNOPTIC ANALYSIS.
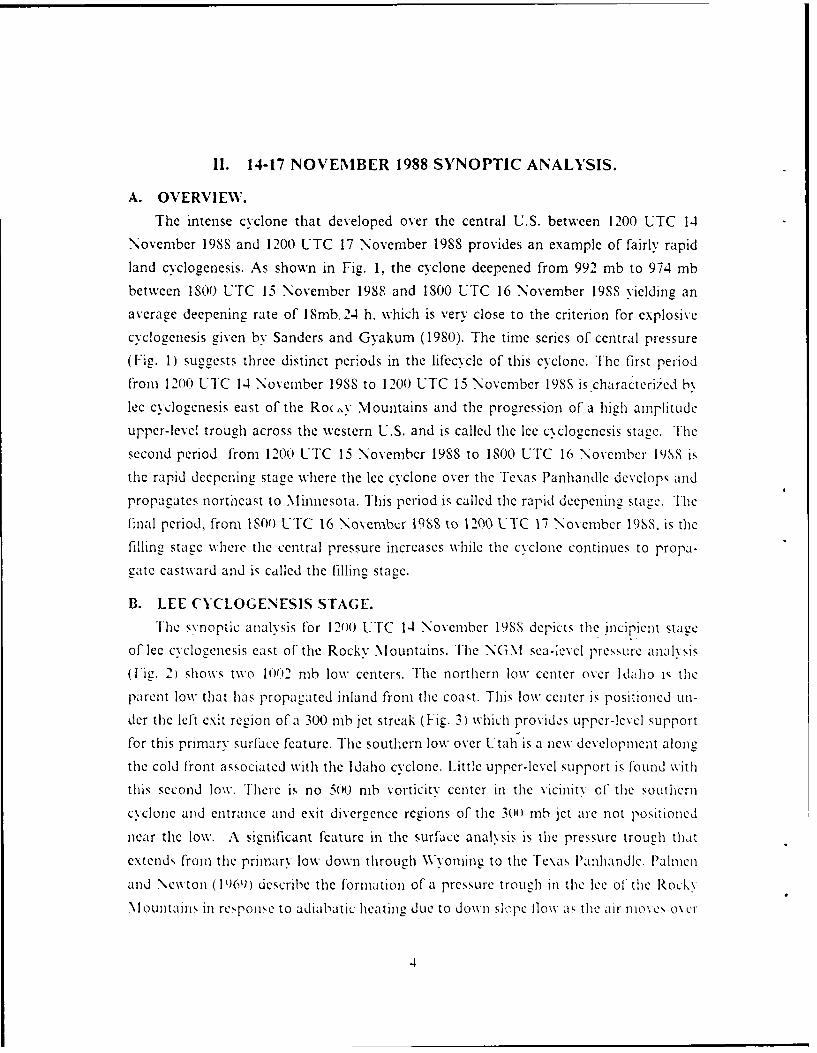
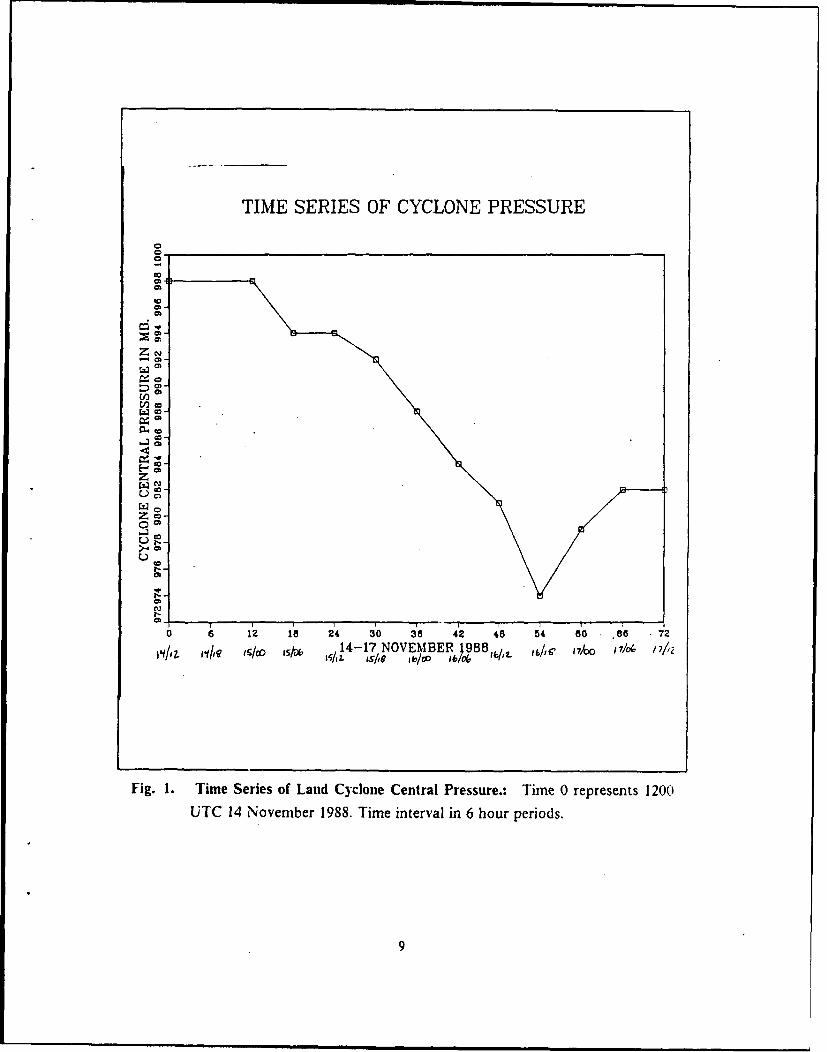
A. OVERVIEW.The intense cyclone that developed over the central U.S. between 1200 UTC 1-4
November 198S and 1200 UTC 17 November 1988 provides an example of fairly rapid
land cyclogenesis. As shown in Fig. 1, the cyclone deepened from 992 mb to 974 mb
between ISO UTC 15 November 1988 and 1800 UTC 16 November 19SS yielding an
average deepening rate of 18mb, 24 h, which is very close to the criterion for explosive
cyclogenesis given by Sanders and Gyakum (1980). The time series of central pressure
(Fig. 1) suggests three distinct periods in the lifecycle of this cyclone. The first period
from 1200 UC 14 November 198S to 1200 UTC 15 November 1988 is charactcrized by
lee cyclogenesis east of the Ro(,v Mountains and the progression of a high amplitude
upper-level trough across the western U.S, and is called the lee cyclogenesis stage. The
second period fiom 1200 UTC 15 November 1988 to 1800 UTC 16 November 19S8 is
the rapid deepening stage where the lee cyclone over the Texas Panhandle develops and
propagates nortieast to Minnesota. This period is called the rapid deepening stage. Tlhe
final period, from 1800 UTC 16 Novembzv 1988 to 1200 1TC 17 .November 1988. is the
fillin2 stage where the central pressure increases while the cyclone continues to propa-
gate eastward and is called the filling staCe.
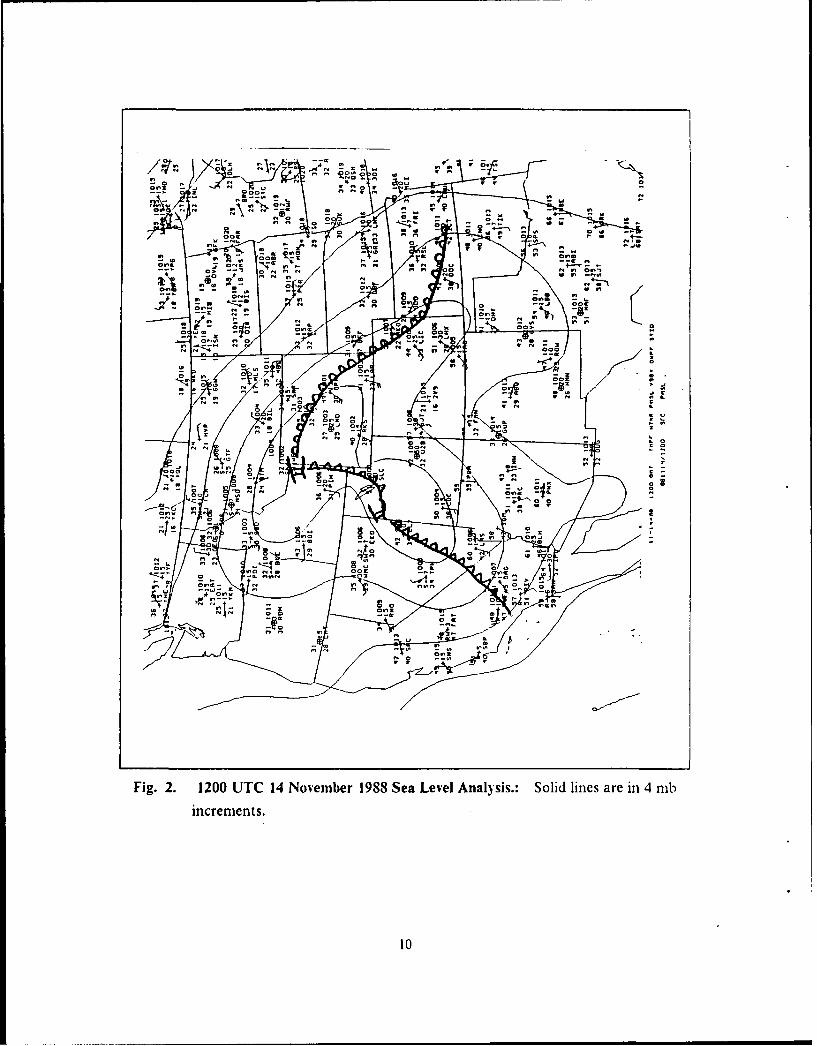
B. LEE CYCLOGENESIS STAGE.The synoptic analysis for 1200 UTC 14 November 1988 depicts the incipient stage
of lee cyclogenesis east of the Rocky Mountains. The NGM sea-level pressure analysis
(Fig. 2) shows two 1002 mb low centers. The northern low center over Idaho is the
parent low that has propagated inland from the coast. This low center is positioned un-
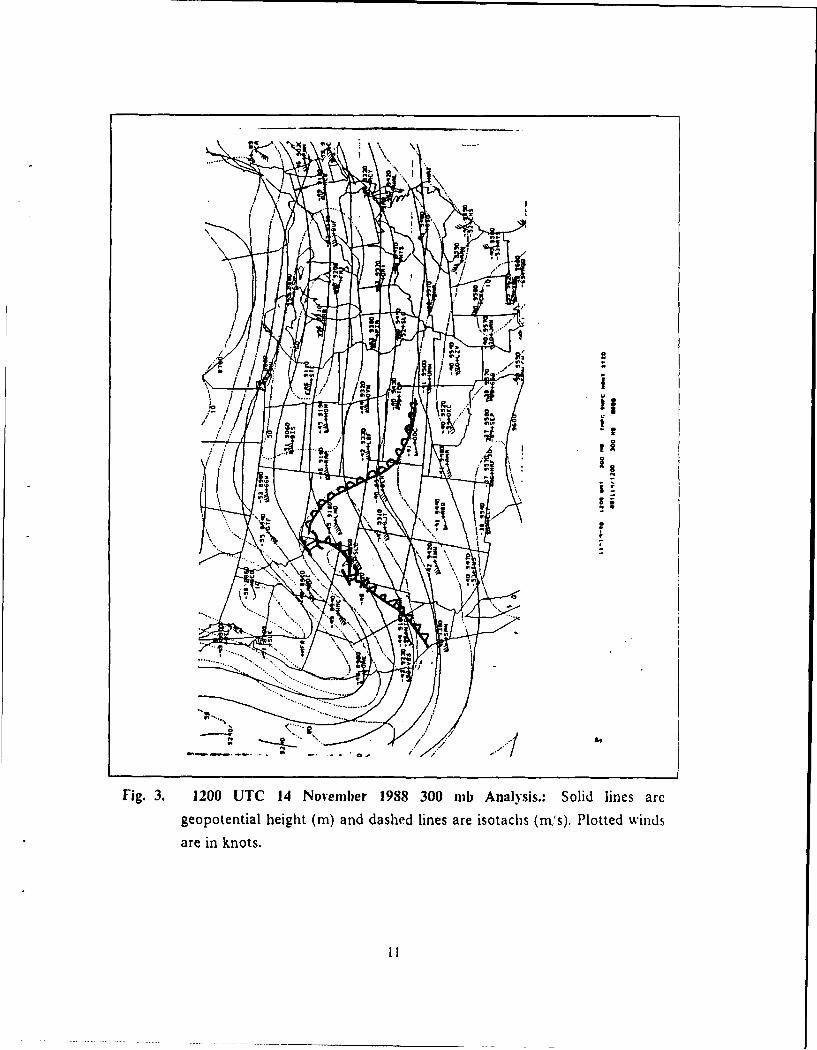
der the left exit region of a 300 mb jet streak (Fig. 3) which provides upper-level support
for this primary surface feature. -he southern low over Utah is a new development along
the cold front associated with the Idaho cyclone. Little upper-level support is Fbund with
this second low. There is no 500 mb voiticity center in the vicinity of the southerncyclone apd entrance and exit divergence regions of the 30 nmb jt are not positioned
near the low. A significant feature in the surface analysis is the pressure trough that
extcnds from the primary low down through Wyoming to the Texas i'anhandlc. Palmen
and Ncwton (1196) describe the formation of a pressure trough in the lee of the Rocky
\l ountairs in response to adiabatic heatine to to down slc~pc flow as the air moves o\ cr
the mountains and onto the plain. Warm advection to the east of the trough and con-
tinued down slope flow widen the pressure trough. Orographically-caused pressure fails
will be further enhanced when positive vorticitv advection (from the propagation of the
upper-level trough eastward over the mountains) contributes to cyclonic development.
In this cyclone, the pressure trough appears to develop as described by Palmen and
Newton and forms the warm frontal boundary associated with the parent low. Strong
warm advection at S50 nib (not shown) east of the trough supports this interpretation
of lee cyclogenesis. The lee trough is primarily a low-level feature and occurs under
anticyclonically curved flow and convergence aloft (Fig. 3).
During the next 12 )'ours, the sea-level pressure pattern evolved significantly. A
single low formed over northern Colorado while the lee trough intensified to the south
and a weaker inverted trough formed to the north (Fig. ,). A strong warm front has
developed and propagated north from Kansas to the Kansas-Nebraskaborder. A 20 'F
temperature difference is found across the warm front. There appears to b,: very little
upper-level forcing associated with the surface cyclone. The 500 nb positive vorticitv
advection is located in Arizona. southwest of the surface cyclone. Again. there is also
very little upper-level divergence in the vicinity of the low.
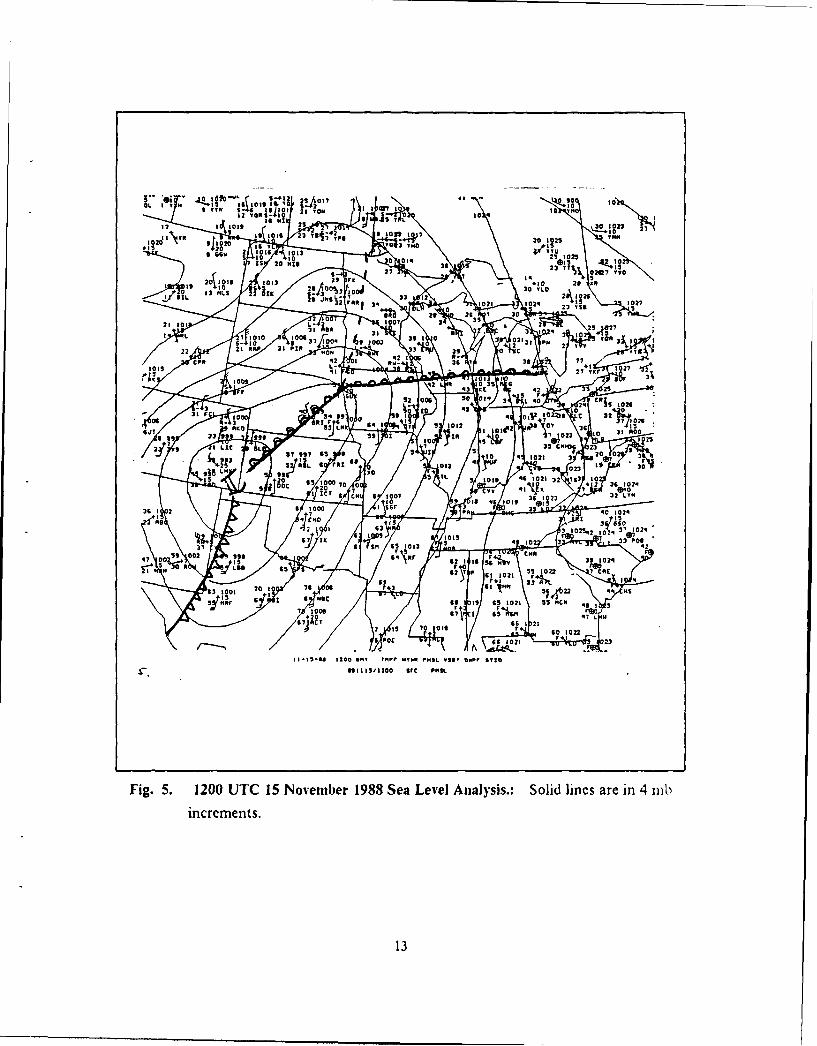
Analysis of surface reports during the next 12 hours shows that the cxclone propa-
cates from northern Colorado into east-central Colorado and to the Texas-Oklahoma
Panhandle by 12()0 UTC 15 November 19SS (Fiv. 5). This southward propagation of the
s ur11ce cyclone is consistent with the eastward advance of the strong upper-le' cl forcing
over Ari/ona. With this southward movement, the inverted trough and warm frontal
boundary have rnereed. A strone low-level warm front is found across Kansas. Nebraska
Iowa. Illinois and Michigan.
There is now favorable phase relationship between the 993 mb surlace cyclone and
the 300 mb trough. lhe deep trough previously over Arizona has moved eastward rap-
idly and is directly upstream in relation to the surface cyclone. The vorticitv advection
from the upper-level trough (not shown) is now placed directly over the surface low
givinc a favorable westward tilt between the 310 mb trouph and the surface cyclone. This
indicates that this system is baroclinicallv unstable and should develop. lhe strong 300(
mb vorticitv advection results from a 96 kt jet (Fig. 6) which is located in the base of the
upper-level trough. Additionally, a strong short wave at 50 mb has propagated down
over southwestern Canada.
Ahead of the warm front, an 84 kt jc' has developed and is dowvii tream from the
strong 3(1() nib short, wave previously mcntioned. -he I R im;igery ho,s a cirru, cloud
edge along the axis of the northern jet streak. This streak is providing strong shear
vorticitv for the upper short wave in southern Canada. The right side entrance diver-
gence region of the northern jet is located over the South Dakota - Iowa- Minnesota
border area. The strong upper wave over Canada and the deep trough behind the
cyclone create a region of confluence over South Dakota. This area will later become
very important to the rapid development of the cyclone.
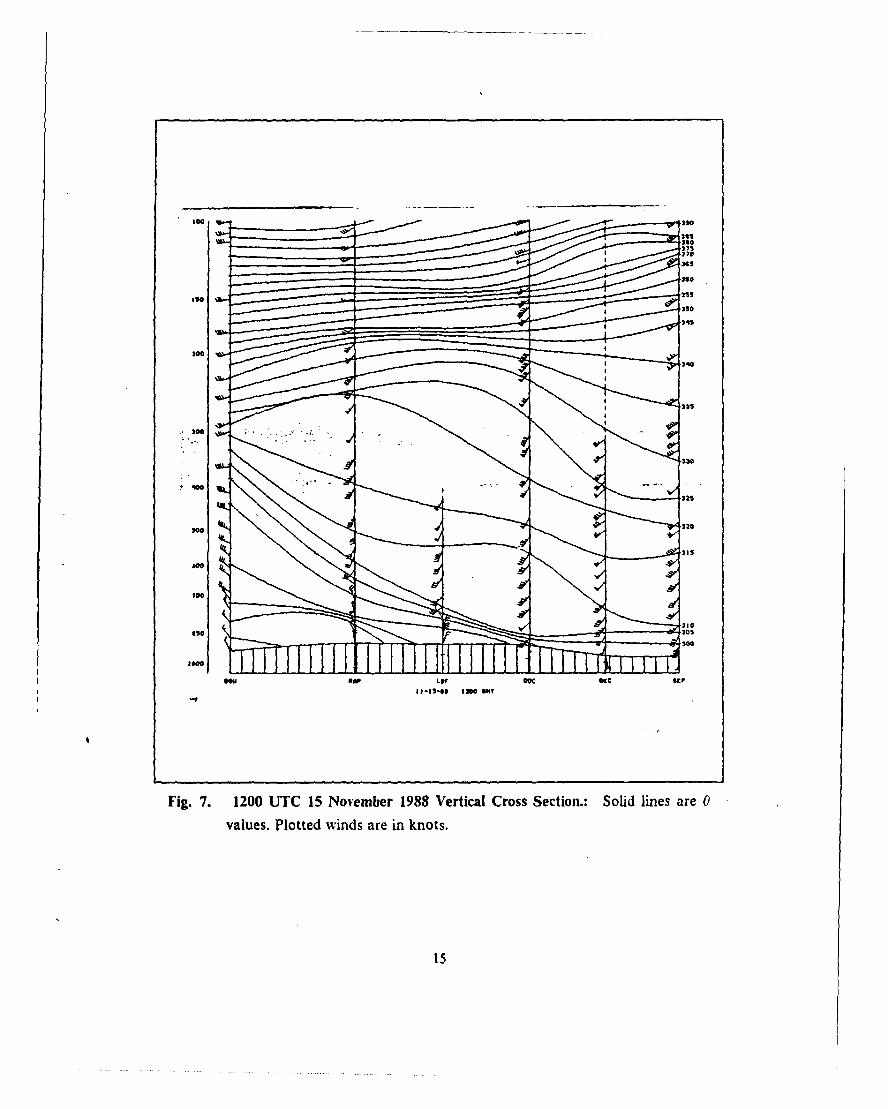
Fig. 7 presents a vertical cross section ahead of the surface cyclone. (Stations can
be located on Fig. 6). Evidence of the downstream jet is located along the RAP station
profile between the 300-200 mb levels. The upstream jet is above DDC with a 120 kt
maximum wind indicated. This cross section confirms the presence of both an up-and
downstream jet streak in the vicinity of the cyclone. The warm front is also clearly de-
picted between LBF and DDC.
C. RAPID DEEPENING STAGE.
At 150) UTC 15 November 1988, the cyclone had a pressure of 992 mb and had
conmmenced movement to the northeast, apparently tracking along the warm front. The
IS1 UTC 15 November 1988 IR imagery (Fig. S) gives a good depiction of the cyclone's
cloud patterns over the Kansas-Oklahoma border. The inner circulation of the cyclone
appears to be relatively small and well-organized. with strong convection along the dis-
tinct cold front that extends southward through central Oklahoma. The warm front is
associated with the edge of the deeper clouds through Minnesota and Wisconsin. Byo000 UITC 16 November 198S. the cyclone central pressure dropped to 98S mb and is
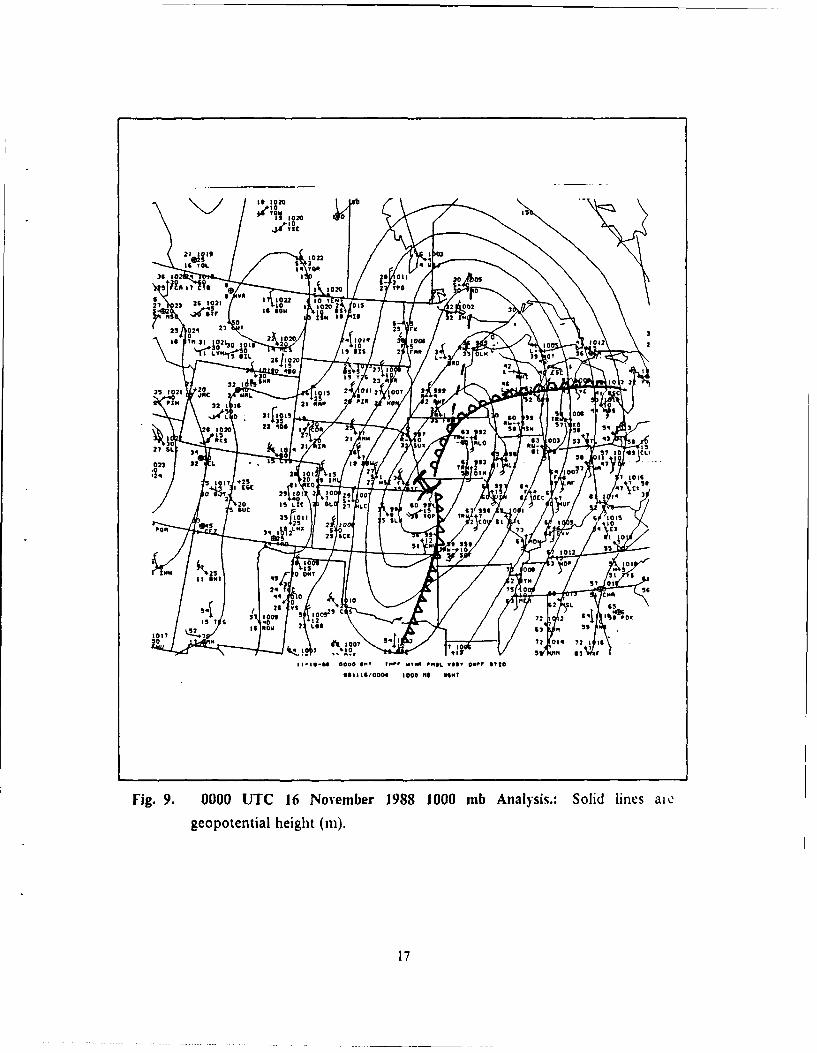
located in southern Iowa. The cold front extends through Arkansas and Texas (Fig. 9)
while a warm front curves through Michigan and across the Great Lakes. IFrom surface
reports. a strong cold surge (20 kt surface wind from the north) is evident over the
Dakotas and Nebraska.
The upper-level forcine has also intensified during the past twelve hours. The 500
mb analysis (not shown) shows further amplification of the upper wave. The short wave
trough in Canada has also deepened. Strong vorticity values and PVA continue to sug-
gest upper-level divergence over the cyclone. At 3100 mb (Flig. 10). the left side exit di-
vergence region of the entrance jet and the right side entrance divergence recion of the
exit jet are aligned over lowa suggesting an intense. localized region of upper-level di-
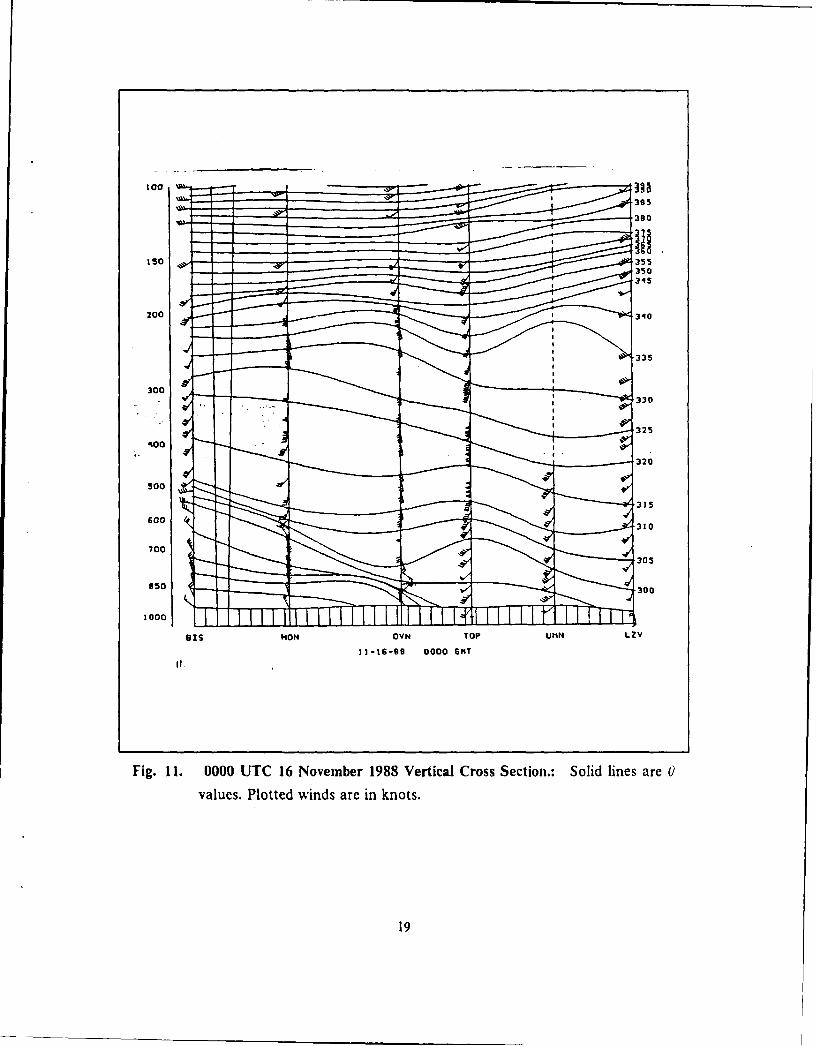
vergence directly over the surface cyclone. Fig. 11 is a vertical cross section (stations
found on Fig. 10) ahead of the surfiace cyclone. The exit jet between liON and OVN is
centered at between 3(0 -200 nib with an 95 kt maximum. The entrance jet is at TO1P
6

with 120 kt maximum around 400 mb. This cross section shows a dual entrance-exit jet
configuration quite similar to those described by Kocin and Uccellini (1985). Addi-
tionally, the velocity of the exit jet has increased presumably as a result of a warm front
temperature gradient increase which is not well reflected in the sparse surface data.
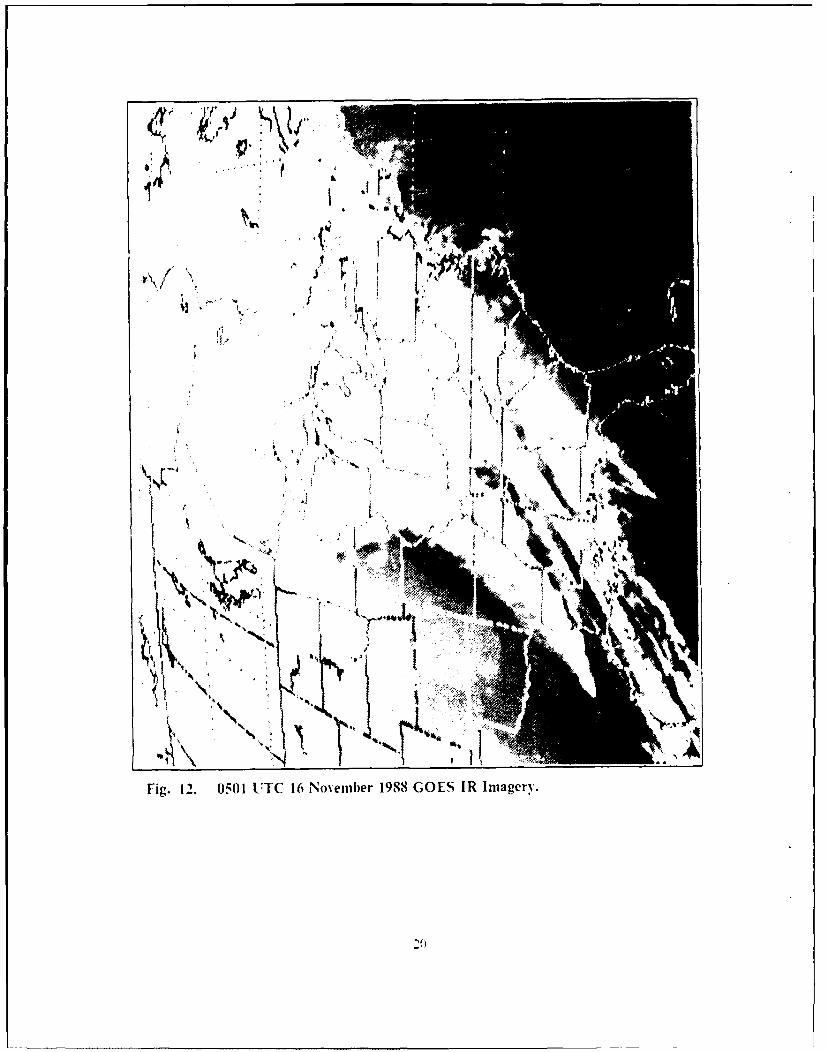
During the next few hours, the cyclone tracks along the warm front. At 0300 UTC
16 November 19S8. the central pressure drops to 987 mb. The 0501 UTC 16 November
1988 JR image shows the cyclone near the Minnesota-Iowa border (Fig. 12) The cyclone
has grown significantly in size since 1801 UTC 15 November 1988. The cloud band
along the cold front has doubled in length with heavy convection along its entirety. The
cloud shield associated with this cyclone now extends from southern Canada to Texas.
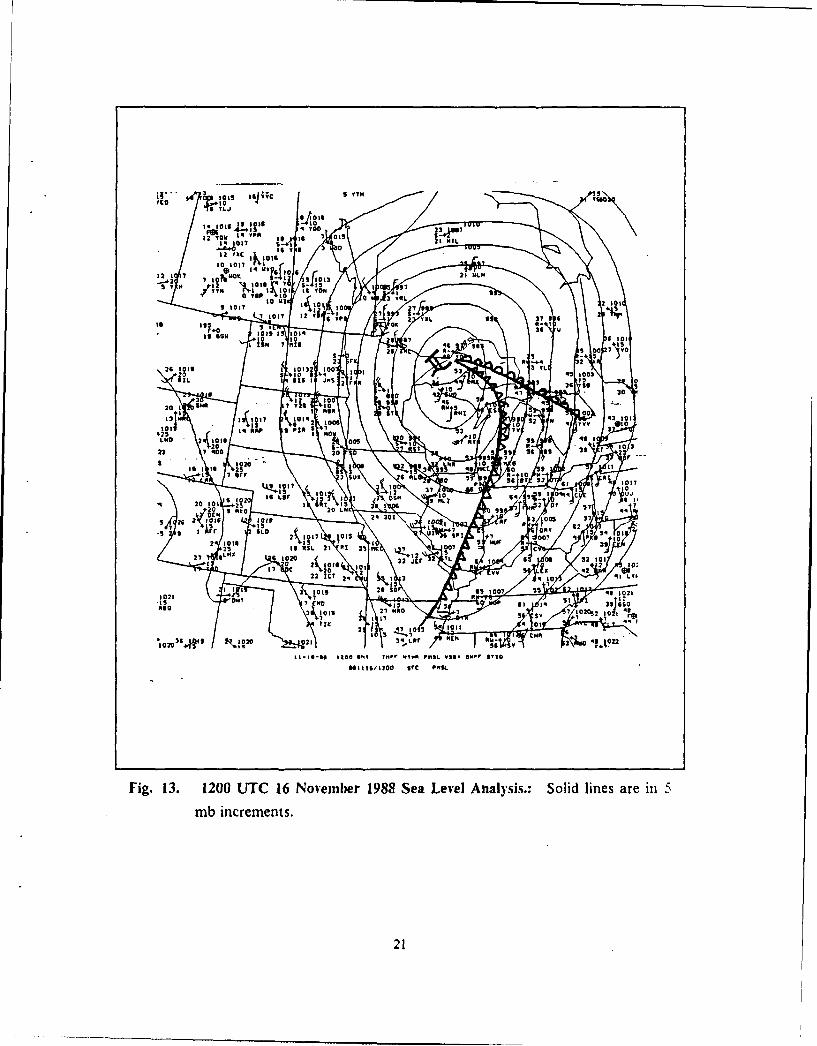
By 1200 UTC 16 November 198S. the cyclone central pressure has now lowered to 979
nib and is located over Lake Superior (Fig. 13. ). The warm front continues to extend
northward over the Ontario region. The cold front curves through Michigan, Indiana,
Illinois. Missouri and across into Texas.
Extremely strong upper-level forcing coincided with the deepening cyclone. The 500
mb trough and short wave have combined into a deep wave behind the cyclone with the
upper wave amplitude continuing to be large. The exit jet has intensified to 108 kt (not
shown) while the entrance side jet streak has a velocity of 120 kt (Fig. 14.). The diver-
cent regions of both jets continue to be aligned and generally over the surface cyclone.
In the next few hours, the cyclone continues to deepen and move north-northeast.
At 1500 UTC 16 November 19S8. the central pressure reaches 976 rob. The 1601 UTC
16 November 19SS IR image clearly shows the cyclone. which appears to be occluded.
I lowever. the strong upper-level vorticity and divergence continue to deepen the cXclonc.
The lowest central storm pressure. 974 mb. was attained at 1800 UTC 16 November
19SS.
D. THE FILLING STAGE.
The cyclone fills during the next 24 hours, reaching 979 nb by 0000 UI C 17 No-
vember 19SS while located north of Lake Superior. lie 500 mb low is almost directly
over the surface low, indicating occlusion. Loss of baroclinic tilt is an indicator of
cyclone dissipation. At 300 rob, the exit jet has propagated over the ridge and is no
longer in optimal position to increase divergence over the cyclone. The entrance jet re-
mains strong. but the left side exit divergence region is not favorably located over the
low. The 0 lvl UTC 17 Nov ember 1YSS IR imacery shows the cy clone continuing to
occlude. lhe cold front has moved to the east and is no longer associated with the

cyclone. The warm front and some associated jet streak cirrus are visible over the
Hudson Bay region. Strong PVA is still present aloft but it is located well ahead of the
surface cvcone. Also, cold thermal advcction at the cyclone center is serving to raise
sea-level pressure.
E. SUMMARY.
In summary, this cyclone shows three distinct stages of development. The first stage
involved lee cyciogenesis in association with a weak low that had propagated over
southern Wyoming. The main feature of this parent cyclone was a lee pressure trough
and warm front extending to the southeast. The presence of low-level warm southerly
advection east of the cyclone and the proximity of the pressure trough to the Rocky
.Mountains confirms that this lee cyclone was principally a low-level feature. Also, there
was an inverted trough north of the warm front. There was little upper-level forcing as-
sociated with this cyclone during this stage as lee cyclogenesis processes dominated.
The rapid development occurred in the second stage of the cyclone. The initial lee
cyclone propagated southeast over the Texas Panhandle while a strong 300 and 500 mb
trough moved eastward upstream of the cyclone position. A 96 kt jet streak at 300 nib
was embedded in the trough and suggests there is upper-level divergence over the surface
low. The low propagated to the northeast and began development. Meanwhile. a strong
exit jet developed in response to the thermal gradient found along the cyclone warm
front and the eastward advance of a shortwave over southern Canada. Interaction of
the entrance and exit jet streaks suggests large upper-level divergence va'luc.z to deepen
the cyclone. The cyclone reached its lowest pressure while under strong upper-level
forcing.
The final stage occurred when the upper-level forcing of the cyclone ended. Thc
cyclone began to fill as it lost baroclinic energy and upper-level support. The jet streaks
propagated out of position and no longer enhanced divergence. Additionally. the posi-
tive vorticitv advection was not in best position to produce divergence over the surface
low. The cyclone slowly filled and propagatcd to the east.
TIME SERIES OF CYCLONE PRESSURE
0
CA
0.
0
ZN
0
-
m-
W0
t.o
N
co -0
0 6 1'2 18 24 3'0 38 42 48 54 6'0 .8 72I / f/, , / ,sre 14-17 NOVEMBER 1988,/, 17/,0 1o MCI- /7/2
Fig. 1. Time Series of Land Cyclone Central Pressure.: Time 0 represents 1200
UTC 14 November 1988. Time interval in 6 hour periods.
9
ou
"Dogo I we0 a
I a 0
Tno Goo
u 4-. . . 00
4-
2*0
G-I 0.0;0
1
. 00.Cox
0-
coo
0
4!- 4,
'M
x0 10-
.0. c
0 o
L4 0 w jlr
OOK
2nzG
5 2rA -
Fig. 2. 1200 UTC 14 November 1988 Sea Level Analysis.: Solid lines are in 4 nib
increments.
10
.. .... .........
Fig. 3. 1200 UTC 14 November 1988 300 nib Analysis.: Solid lines aregeopotential height (in) and dashed lines are isotachis (m,'s). Plotted winds
are in knots.

IV 110.6 10 TxL
of.. 521 2STo 21 to* 1020
1 21 1011GLI 43 lot I I YOL lefole'40
Pat 29 -tam 34 1. 23 22RS is 41 2!.4*tq 25
+)Sm 30 1 is IV rc SY23 1?4 to 2 lot$ I I Gem -ovL2. F. ",6-
n. p jr
-o- 32 is Sir 26 1 Z4 OLI4
A a 10 j 22 TICH
+ a T 31 16 "SO 27 21 2 3 j"S 2 If. so
1. 4 31 OLS ae. 6 28 25 2 2 it"10 31HT 20 to 32
O*P .01 Sao 20 elm mLs 0925 12 27 S15C 3,36 1017 32
32 0 4-W W4 10 26 1 26 Roll 35 65 33 RD" 8 lool; 1011 30 Am11 OTH ols ZWE Y 39 007 "It 39
10 5 1:111 333 19 qi 01 0 4 WRL
3 0 3 TO jACCEC 31 1, , looq 1 1002q- 1010 30 rim '30 3 DID 35 A0
Imf 20 Lm 5G 1 34 A 36 u 32
ACv 0 *4410 is Aid 0 36 got 0 so 9.9 qS q$At 0* 1 0 06 - 'to LB 10" 1 5 6
3 lots 4 - GAIqq L." 45+ OleD 3 gas 0ANO 12.
so loot . p 9,941, .0 5 j1509
5 :2 11 10" 1
T "!0033 U2R 3 OC" 68
30 jxv59 1000 3 FRI D2 q ,q 14.4 1012 5 IjGj ! -Cz, :isLo,
35 'So DO 20 TO 30 1009 Rmv 94 1 01 1 002 6 IOG5 2 6130 11% 101 3 CDC 14 3 lei i 1 5 1 15 6 mu
3 may as 3 111 DOC I ICT It39 FAT 20 30 93 10 34
Pon so 71. 5-to I lot 3 3 roll.gap .1 S
f I , too)
30 50 S 1 1008
2'5' 16 r : J00" T 5 'Z,Cold 3 is I sj TIK
I OOR 2 25. 2 w
IoI3 0 Ipqw GNTto 20 1 PAC 009 00,qO RIv 0 0
all p4s; 33 6 : DOS 291i $73 1007 26 017 5 76 loosA 7 PHIC 59 1011
09 6 7 C72 20 "am
71 ioos 4 All 1. 101220
55 mar 73 iolo 93YC5T
10 7
2 1 D:,1,
fall I ,
91-13-88 oooo 4"T f.-r T.A P"Ill. so, D.pr INTID
941113,0DOO sic P"SL
Fig. 4. 0000 UTC 15 November 1988 Sea Level Analysis.: Solid lines are in 2 nib
increments.
12
OL y VTK I I C07 I12 Yom 21 Tom
12 1 1019I I I is 23 TBJ; 2,, 0 012 IQJ7
10 T 30 1025#15 10020 16 V TO Two
66" 12 lots V " 1, ,0 1013 21 011
IS 20 18 a olq 36 _2. 110
27 23 OM7 YWO
2 ON 1012 29 14
30+10 29 X4
TLD13 01,02 IS 111: 1
sz; 33 2Si ".4 go 1027
He 3i 34 OR a 1021 102q 2 5104a at 263, T 30
100721 1 V 2 2 5A2731 W 5RL It 3 3 0 5.1 lul. 1.0937 1 00q 4, 003 39 to 0 2131 PH
22 621 KOAP 31 pip ON 3 - 33 3 0 2 C 2 T
CPR -I! I q2 1 9 77L ! 27 -e2L Ow
'jiA01 -11 27"yKr Ime S Roos
2 It 3 2-3 &r -13 VIC 4 2S 52 cog So ) , 51. 'Of 2, E Rig 1029
IG 43 H, -- to 'k - -31 Fc so 54 99 1 1 JZ 710240 c 32 , ,11- 3 GRIS 0 0 a t S 0 026
$JT 0 9*0 Im 1 0 6 10 31 nois 23 to 0 , 94 1 T 1 1012 0102 '?-t, , 23 3 5 1010 1
I LIC OL 17 9,97 95 1 5 23 94 1021 3" 20 0
k21 I IRE 'a 012 "0945 L" 0" "15 2 5 TL 1019 610 .21. 32 Ts3 to0 1000 70 4:-.Jo *12 3 Oq
ICT G 7 V,CH 6 1007
1 0 1 1 1. " to 19 339 1 2 6 1000 1 ser 37 OR qo 102q
me 4 END 5 3 rq.2 1 37010241
71 j4;O25,2 102R97 1 '1015 q9 10 3 33 Poe
,2
or 5 CHO4, a go 002 $99 0 4 Rr :21 pie 9 1024
0 aH 5 it Lose Its 2 T IJI 1022 1 COE21
0 1 r+&"" 53 An
70 10 99 So t22 q I HS 41
63 Cos 10 76 Do r 3r/29 "VE go 2 33 "C"
7 so 11 61 El S!N.0
2 70 01 66 1 21r r 60 1022
6 PT 66 1021 F 5 23
11-IS-40 1200 a., f-If WI.A P.91. -291 UPPI ST20
ggtiiVt2oO %rc PmtL
Fig. 5. 1200 UTC 15 November 1983 Sea Level Analysis.: Solid lines are in 4 mb
increments.
13

toA
T ... 1.. . .... ...
Fig. 6. 1200 UTC 15 Novemiber 1988 300 nib Analysis.: Solid lines are
geopotential height (in) and dashed lines are isotaclis (rns). Plotted winds
are in knots.
14
I111
2000
5005
7000
*500
153

*ZVI
Fig 8.1801 UTC 15 Novemnber 1988 GOES IR Iniagerv.
16
to 11SZO
1020h
1022 03/_t 4 u
16 VOL 14 vast36 to 1 26 ot 1 -36- 1 20 0
30 0 S.5 rCA 17 CTS 0 1 1020 2 yps 0
27 23 26 1021 * va 17 11022 1 to I0 1020 2 O's 2 002as I Is $am SS 3
IleV, 10
0 IS" Is re 32 H
25 02R 27 7 29 rKa 2k.,- 4 3
Is '" 31 102,30 lots lolq 3 to 2012 29 $is 10 r, :a 3 OLM-I OIL 2(11,020 r 3NOT
A2
30 'ING L 1
C20 32 IdSt'"A .4
35 1021 JAC Mak lots 2 9-12 1007 2 sty CC0 25 7 2 -1
PIM 32 1 16 21 map 2 "a 3, as3.f1G.5 A 3 0
F to 92 To22 -100 1 2 63 992 - 31 sq
g 1020 7
1 7
5
.. 21 - 63 1 43 8LO *M_
27 SL 21 IA 6 is
31 0 t 10 462 CLI
.023 L '93 A q7Y.24 2 lot is 27 OTH 4 100
9 1, 7 lots3 1017 +25 20 Ar so
C6E 23fol'o 1 "2 10 It G. 4 -07
7 2, 00 cc
2 "a S. 's cc, 9 a 14
I10 Is LIC I OL 2 LC so 9Out: is 1 4 996 0 1 Y-rI "St'lo,
A'OP TO 7 6 lots@95 21 1 v 2 C 0 f; I L 0
PGA 3,0161P" 0 9 73 v q
5 29 OCK 12 Y-1 09*9 6to 35s 012
10 OP 101IMM 111.25 0 ONT 0 5
qs
24 3 2 Y" S? at
44' 0 10 7s a CHO
VS9 c 1 .46
00, 100929s 12 72 2 1 8 PDK
1. ow 2 Lee 93 a 5972 014 72
h .: .007 941. 7,110 , to
1 5 93 r
11-40-041 0000 9.V I-If -1-4 P"SL 1991 O-If OTtO
stills/0000 1000 No PONT
Fig. 9. 0000 UTC 16 November 1988 1000 nib Analysis.: Solid lines aic
geopotential, height (in).
17
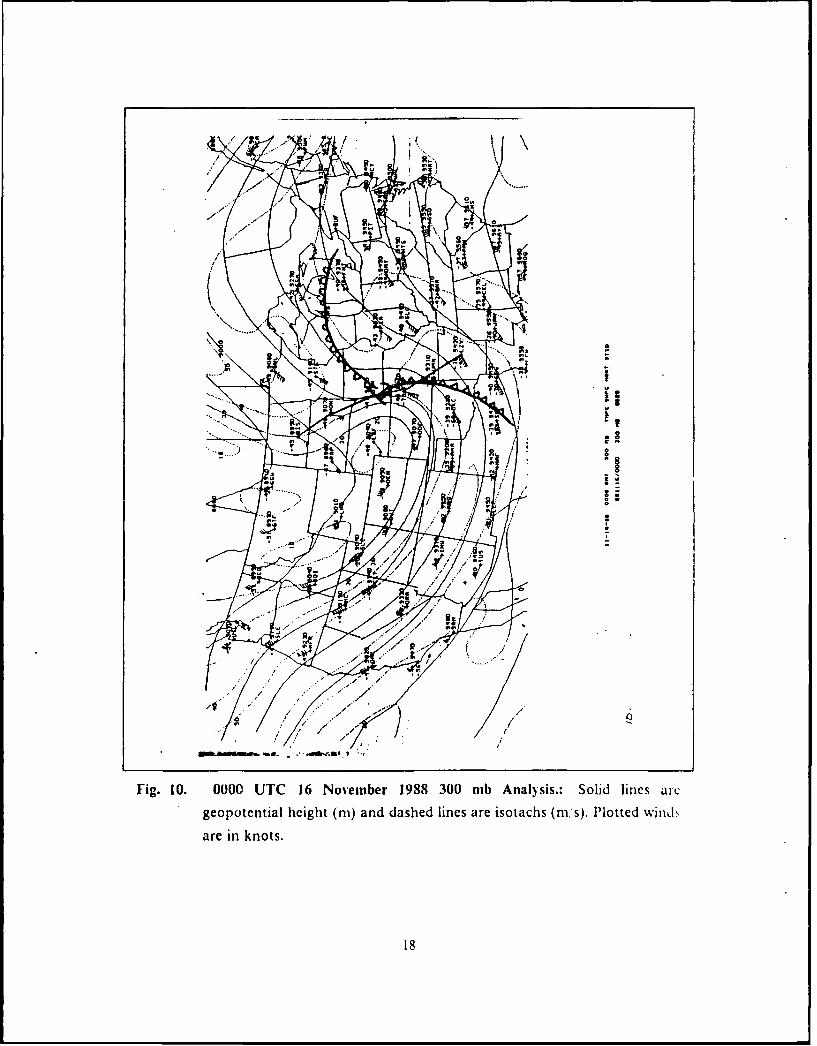
Fig. 10. 0000 UTC 16 Novemnber 1988 300 nib Analysis.: Solid lines aic
geopotential height (mn) and dashed lines are isotachs (ni's). Plotted winds
are in knots.
3000
L5035
6050
20034
I335
3000
191
4~wt
IN 44 0rig. 12. 0501 LTlC 16 Novembier 1988 GOES JR Imagery.
161 ;;c
A- 5 4 TOO 7raw is is O's k WTLs- 1
112 Y x C lKloir 6 T
to 1017 F. 1
12 1 7 7 0 mot K. 0, 21 ULM
- 3 nh 1 191to ul 1 10% 11L 2 lot
1 1 7 12 171017 2 4 1 37 9 6
1: 2 1,111,to 5 Y OK A- I
1014 36 U
Is 0614 to lotI ism 7 His -I! 96 0 7
3 - I TO2 r
-'q0", DO 3 IL26 53
IL I @Is I J.S 2 r R
6 0 9 47 30
20 1 $MR 7 Y24 0as
3 1 1 1 1., It 00 -13 101-lk-w 1: 3 2 M q VV 610
,,25 14 pop FIN 1 40 TV 3I.110 ois 0 #10
,Wf*jO q@
0 00-3 'Wf of 0 123 7 qD4 5 99 St 23 39 r 110"'s LM
Is I is 10. r a 91 7 0 3 A? to
Lj?'1017 3 0 37 1017-- m 01
to ter 2 ,
A lot '0 25" A 0,20
I OEM 9 a 0 20 LN 24 301 99oft
Is or 3 1005
0 92I r OLD 7 I
lots 11 G SPI I , S, Olol 4 1 10
2q lots 7RI Mur 1021 23
25 If RSL 001 C27 qLMX 1020 32 j 2 TL 9 DO 52 101
1, C 102, VV 3 L Ito 4222 10, 3 q -11 L"
I At 2 lot 20 so' 95 :7 55 44 10211021 It 51.1 11,125 047 No 3 61 IR GSOPilo 1 410 7 to
1 17 5 7 2032 46IV 71 7
TIC 2 10 3 loll 0 1
39 It"
02" 9 021 3 4, L or HE"O"J' I *" '4.! 0 51- SY 2 49 ?22
It-III-40 1200 O"T fmr .... P.SL V29, O.'r 9,10
"Ills/1200 Irc omit
Fig. 13. 1200 UTC 16 Noveniber 1988 Sea Level Analysis.: Solid lines are in 5
mb increments.
21

- ~,'** :
Fig 14 120 UC 6 Niemer 98 30 mbAnaysi.:Sold lncsaFgeopotential~~~~... hegh..... ddshdlie.ae.s.....,s. lttdwid
are inknots
..... .. ... .. 2 2

!11. 03-05 JANUARY 1989 SYNOPTIC ANALYSIS.
A. OVERVIEW.
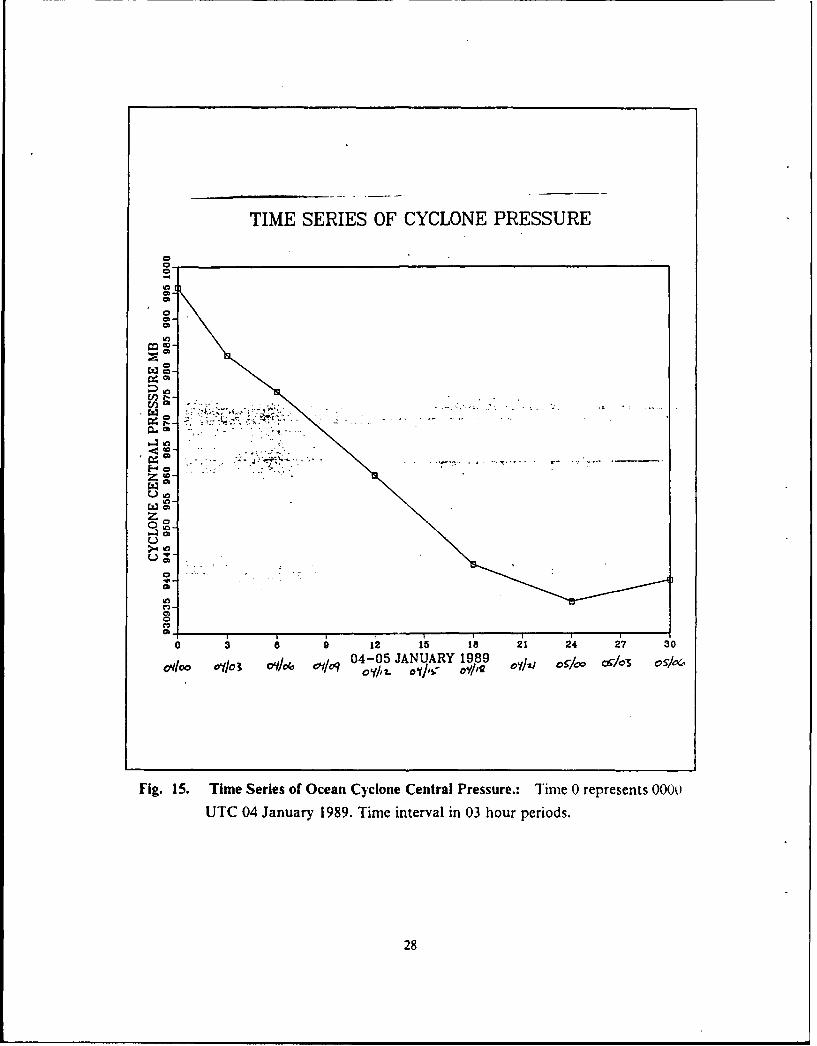
An explosive cyclone developed off of the U.S. East Coast between 0000 UTC 04
January 1989 and 0000 UTC 05 January 1989. This cyclone rapidly deepened from 996
mb to 936 mb in 24 hours. This corresponds to a development rate of 2.5 mb'hr, easily
satisfying the criterion for explosive cyclogenesis! The central pressure trace of rapid
cyclone development is given in Fig. 15. There appears to be three stages in the life of
this cyclone. The first stage from 1200 UTC 03 January 1989 to 0000 UIC 04 January
1989 is the pre-cyclogenetic stage (not shown in Fig. 15) with a strong upper-level jet
streak positioned over the Carolina-Virginia coast and a strong vorticit" center over the
Great Lakes region. The second phase; of this cyclone, from 0000 UTC 04 January 1989
to 0000 UTC 05 January 1989, is called the explosive development stage and commences
when the upper-level jet streak mentioned above produces a small 996 mb surface low
by 0000 UTC 04 January 19S9. Rapid deepening commenced when the strong vorticity
center previously mentioned propagated immediately upstream of the surface low. In-
tense deepening occurred as the cyclone propagated to the northeast. A dual entry-exit
jet streak configuration formed to enhance upper-level divergence and allowed for fur-
ther development. The final stage occurred when the cyclone moved from the relatively
low static stability environment and commenced to fill after 0000 UTC 05 January 19S9
and is referred to as the filling stage. The following sections will examine these staces in
detail.
B. PRE-CYCLOGENETIC STAGE.The 1200 UTC 03 January 1989 synoptic analysis characterizes the pre-cyclogenetic
environment of this very intense cyclone. The surface analysis (Fig. 16) shows cold
northwesterly flow dominating the western North Atlantic Ocean in the wake of a fairly
strong cyclone now situated to the southeast of Nova Scotia. The cold air has not
propagated very far to the south over the coastal waters off of the middle East Coast
as shown by the surface isotherms in Fig. 16. Of particular note is the deep band of
clouds that extends from the Ohio valley well out into the western North Atlantic Ocean.
(Fig. 17). This band indicates substantial moisture and vertical motion throughout the
troposphere and has anticyclonic curvature over Kentucky and Virginia. The NMC
Spectral 300 nib analysis (Fig. 18) shows a strong 1-14 kt jet streak over Kentucky and
23

Virginia that extends out into the western North Atlantic. When comparing the IR
imagery and the 300 mb isotach analysis, it appears that the analysis did not extend the
core of the jet streak far enough into the western Atlantic. The strong convection ex-
tending from the Virginia Coast, as depicted in Fig. 17, provides evidence of the presence
of a jet streak over the water. The jet streak would provide strong cyclonic shear
vorticity advection and upper-level divergence which would enhance the convective ac-
tivity. The strong upper-level vorticity center and 500 mb trough (not shown) located
over Lake Michigan subsequently influences cyclone development.
During the next 12 hours, warm surface advection (not shown) from the south can
been found along southeastern coast of the U.S., replacing the northwesterly flow by
1800 UTC 03 January, 1989. A strong band of convection continues to extend from the
western Carolinas into the North Atlantic ocean.
C. EXPLOSIVE DEVELOPMENT STAGE.
By 0000 UTC 04 January 1989, a new 996 mb sea-level low has developed over the
mouth of the Chesapeake Bay (Fig. 19.). This low develops very rapidly during the next
24 hours to become a 936 mb low at 0000 UTC 05 January 1989. Warm surface
advection along the southern East Coast has increased dramatically, with a 45 kt low-
level jet at the surface being reported off the North Carolina coast. The 0001 UTC 04
January 1989 IR image (Fig. 20) still shows the deep cloud band extending out from the
coast of the Carolinas associated with the incipient cyclone.
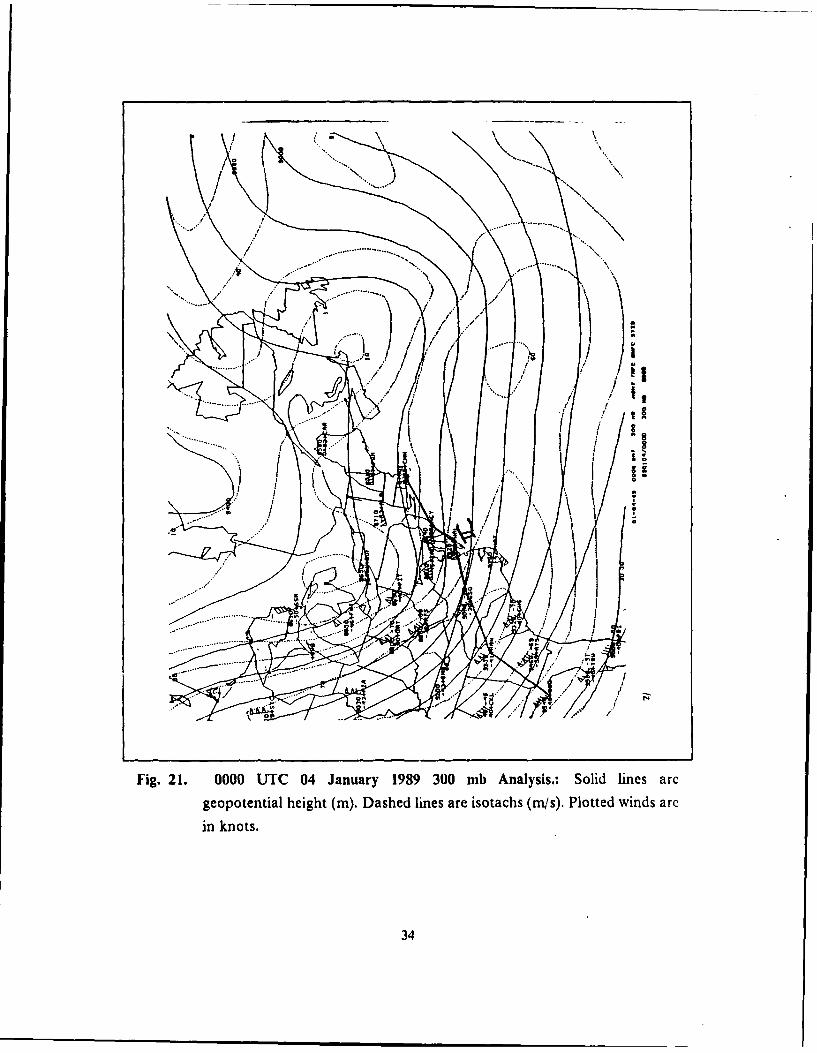
At the upper levels, a very strong 500 mb trough has developed from the trough
previously over Michigan, in the area to the west of the weak cyclone. This strong
trough suggests strong vorticity advection located directly west of thg wcak surthce
cyclone. The strong vorticitv is a result of an intense 160 kt 300 mb jet streak (Flig. 21).
T he left side exit divergence region of this upstream jet is located directly over the weak
surface cyclone. A vertical cross section along selected east coast stations (Fig. 22) shows
the 155 kt jet is visible over GSO (stations listed in Fig. 21). A strong upper-level front
is also visible on this cross section. A weak ridge has formed 500 nmi east of the
Carolina coast with a portion of the previously mentioned jet streak embedded. The
static stability over the water is low (not shown).
By 0300 UTC 04 January 1989, the central pressure of the new cyclone is 983 mb.
The 0301 UTC 04 January 1989 1R image (not shown) begins to show the typical
comma shaped pattern of a mid-latitude cyclone. At 0600 UTC 04 January 1989 (rig.
23.). the cyclone central pressure is 976 mb and is located approximately 150 nmi east
24
of Delaware. The surface temperature gradient across both the warm and cold fronts is
small. A large cloud shield is also visible over the cyclone and to the north and east.
By 1200 UTC 04 January 1989, the central pressure has reached 960 mb (Fig. 24).
The surface temperature gradient across the cold front of the cyclone remains small.
However, there is some significant deformation of the isotherms near the cyclone center.
This isotherm deformation is a good indicator of intensification of a strong temperature
gradient, which implies that baroclinic energy is available for continued cyclone devel-
opment. Low level winds of 50 kt from the northwest are being reported behind the cold
front while 60 to 70 kt winds from the southwest are reported in the warm sector ahead
of the cold front. There appears to be very strong convergence generated by these winds
along the cold front. Static stability values were determined by subtracting the 1000
mb 0 value from the 500 mb 0 and dividing by the vertical change in pressure. The static
stability value (not shown) remains very low in the general cyclone vicinity. The 1201
UTC 04 January 1989 IR image (Fig. 25) shows a well developed and intense cyclone.
Heavy convection is located along the cold front southeast of the cyclone. Heavv
cloudiness along the warm front to the north and east of the cyclone gives a good indi-
cation of the strong warm advection taking place. A strong cold surge from the north-
west behind cyclone is present as evidenced by the 20 to 30 kt northwest wind and
freezing temperatures being reported along the U.S. east coast.
At 500 mb. a deep trough has amplified from the previous time. Strong vorticitv
and intense PVA are available to provide upper-level forcing. The 300 mb analysis (Fig.
26) now reflects this forcing and shows a dual jet streak configuration. The upstream
entrance side jet streak has a speed of 144 kt. Tlhe left side exit divergcnce rdgion of this
jet is in the vicinity of the cyclone and is enhancing the upper-level divergence over the
cyclone. The broad area of 100 kt wind downstream from the cyclone suggests the
presence of an exit jet streak (Fig. 26). This broad exit jet may also enhance the
upper-level divergence over the cyclone. It is possible that a more intense core is em-
bedded inside this large jet structure.
D. THE FILLING STAGE.
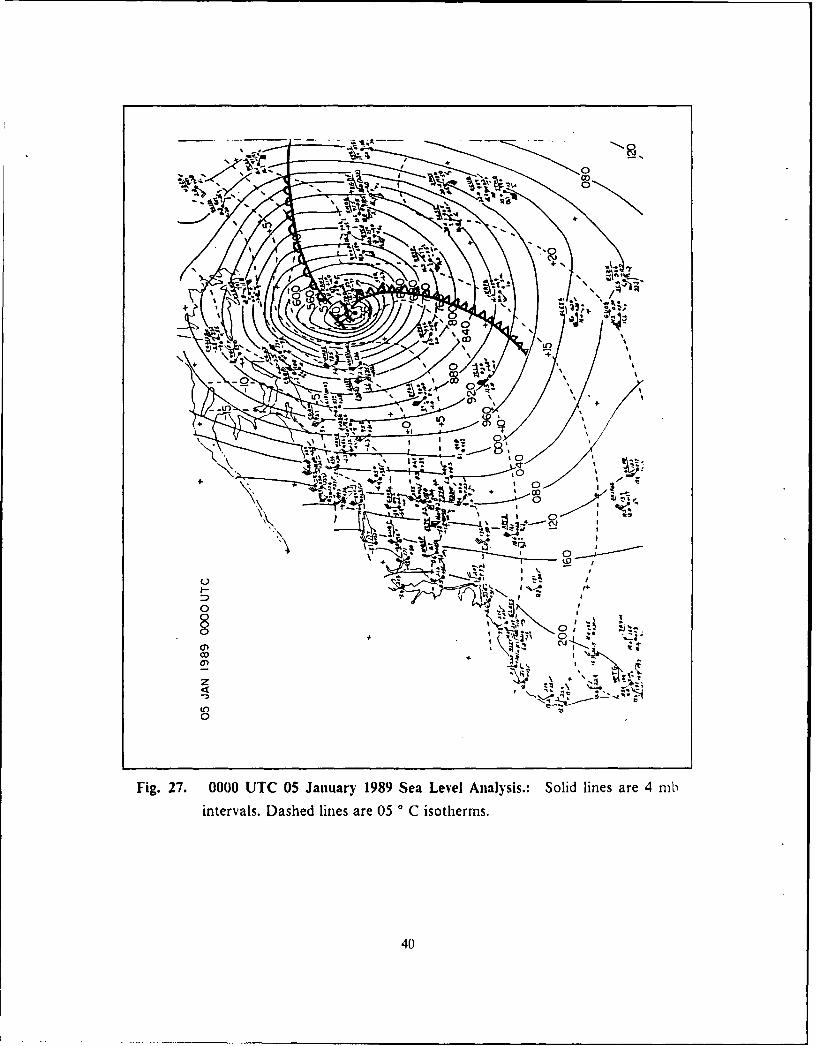
At 0000 LTC 05 January 1989, the cyclone central pressure has reached 936 mb
(Fig. 27.) and fills from this point on. From the 00ol UTC 05 January 19S9 IR image
(not shown) the cyclone cloud pattern looks less organized at this time. The center of
the cyclone has lost the tight spiral appearance it had eight hours earlier and the cold
front has increased in width and is not as sharply defined on the I R image. I lowever. the
25
cold front structure appears relatively unchanged with strong convergence still reflected
by the surface wind reports along the cold front. A very strong warm front gradient has
developed to the east of the cyclone. This increase in temperature gradient is also re-
flected at the upper-levels by an increase in jet streak speed to 116 kt from 100 kt 12
hours earlier.
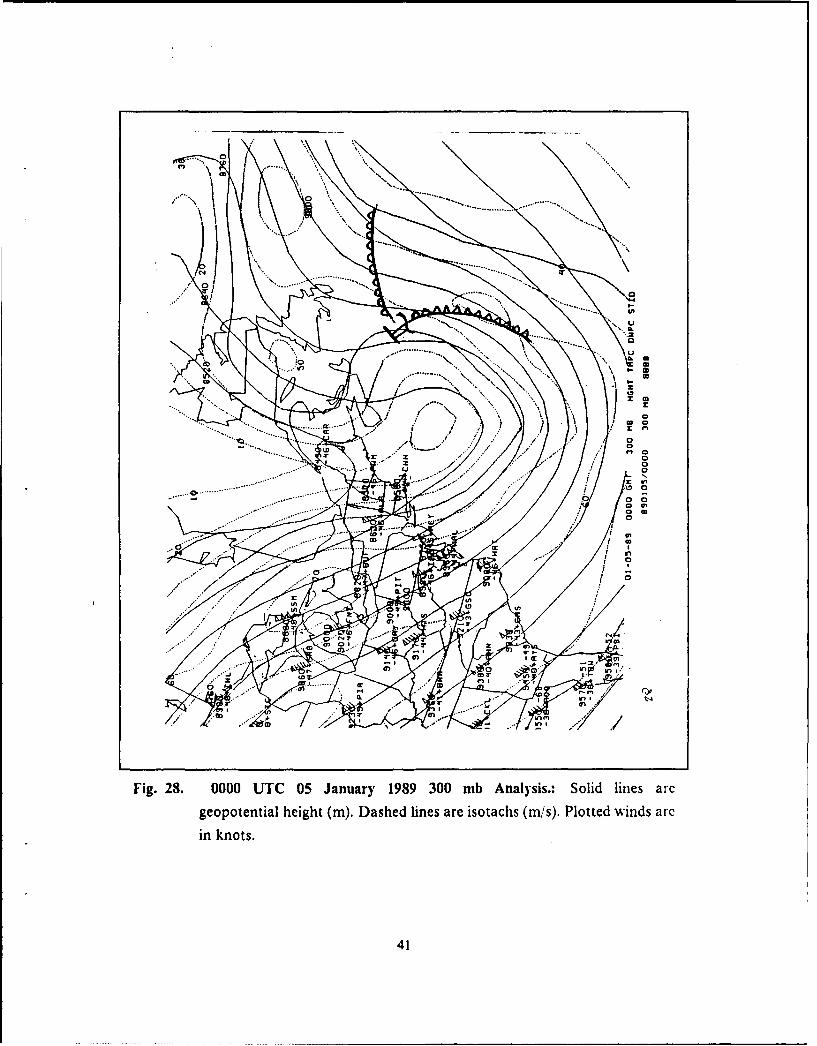
The 500 mb wave has become more distorted, forming a closed upper-low over the
Canadian Maritime provinces. The 500 mb trough is deep with very tight spacing of the
pressure surfaces indicative of strong amplification aloft. Strong PVA is still located
upstream from the surface cyclone. The 300 mb upstream jet stream has diminished in
speed to 128 kt (Fig. 28). This indicates that the temperature gradient has decreased,
possibly at the mid-levels. The jet streak has propagated around the 300 mb trough,
however, the left side exit divergence region still has positioning to enhance upper-level
divergence over the surface cyclone. The right side entrance divergence region of the
downstream jet remains in the vicinity of the cyclone to apparently enhance upper-level
divergence. This entrance-exit jet streak positioning appears to be very important to ex-
plosive cyclogenesis.
Even in the face of strong upper-level forcing, the surface cyclone continues to fill.
The static stability around the cyclone has become significantly greater as the cyclone
propagates over the cooler waters of the Labrador current. The static stability value at
1200 UTC 05 January 1989 in the cyclone center is approximately two times as great as
the 1200 UTC 04 January 1989 value. This loss of low static stability will be explored in
the discussion chapter.
E. SUMMARY.
In summarx, this cyclone was generated from an area of pre-cyclogenetic upper-level
divergence (provided by jet streak positioning) just off the coast of southern Virginia.
An area of strong upper-level vorticity was positioned over Michigan. As the upper
v orticity propagated over the small surface low, it intensified explosively, producing the
second development phase of this cyclone. As the cyclone rapidly propagated to the
northeast and over the warm Atlantic waters, upper-level forcing continued to be avail-
able in the form of strong PVA. A dual entrance-exit jet streak configuration was ap-
parent during the rapid intensification of this storm. This jet streak positioning was also
noted during the intensification of the continental storm, described in the previous
chapter. The static stability was very low over the general area of the cyclone develop-
nent.
26

In the final stage of this cyclone, the upper-level forcing remained very strong.
however the static stability increased dramatically as this cyclone propagated over the
cooler waters of the Labrador current. This increase in static stability apparently con-
tributed to the filling of the cyclone.
27
TIME SERIES OF CYCLONE PRESSURE
a
M No
: ,
co I
a
U,
q
;,,,,,,Oy/ .. .... - .. .. ./ ....
a -*
I I
, 6 9 2 15 8 21 24 27 30o/ 04-05 JANUARY 1989 c ] o cg/03 os}c,
Fig. 15. Time Series of Ocean Cyclone Central Pressure.: Time 0 represents 0000
UTC 04 January 1989. Time interval in 03 hour periods.
28

INhpTY-~
0 ' ~0
5 '4-W ..
Z\ \\ 11 % . N
+
I ~ 0
' +
inevas Dahdlie r 0 sohrs
29I
I- *to
Fi.1. 10 T 3Jnar 99G E RIaey
1 30
.. .... IL
.. %
0 Inf I
I .I 4L
.............................................. 0
Fig. 18. 1200 UTC 03 January 1989 300 nib Analysis.: Solid lines arc
geopotential height (mn). Dashed lines are isotachis (m,'s). Plotted winds arc
in knots.
31
OD
!No 4-1'-\
. ~ 4~ s.a ... X.A. , I
-x I L4 pi,
0
0)U~
0- 0
+ + -- a/ ' -'
ig. 19. 0000 UTC 04 January 1989 Sea Level Analysis.: Solid lines are 4 mb
intervals. Dashed lines are 05 * C isotherms.
32
At
1N
Fig. 20. 0001 UTC 04# January 1989 GOES IR Iniagery.
33
................
..... .... f
..... ....
...... /.....
Fig. 21. 0000 UTTC 04 January 1989 300 nib Analysis. Solid lines arc
geopotential height (in). Dashed lines are isotachs (mi/s). Plotted winds arc
in knots.
34

t100\1138
1507
3007
150 A -6
6000
200
e350
3000 44L_______
CNN AC ALOOAN C
232
350

NP
va Xr; ~- C"0
*IN -
% 0
S ~ 0
Fig. 23. 0600 T 04 January1989 Sea Leve Anlss:Sdlns are4.0t
inevas Dahe line ar 5*Ciohrs
36I

00
0/0
III 2+
~'00
IOU
+ ~ . I
+ - 0
0 C6
Fig. 24. 1200 UTC 04 January 1989 Sea Level Analysis.: Solid lines are 4 nib
intervals. Dashed lines are 05 *C isotherms.
37
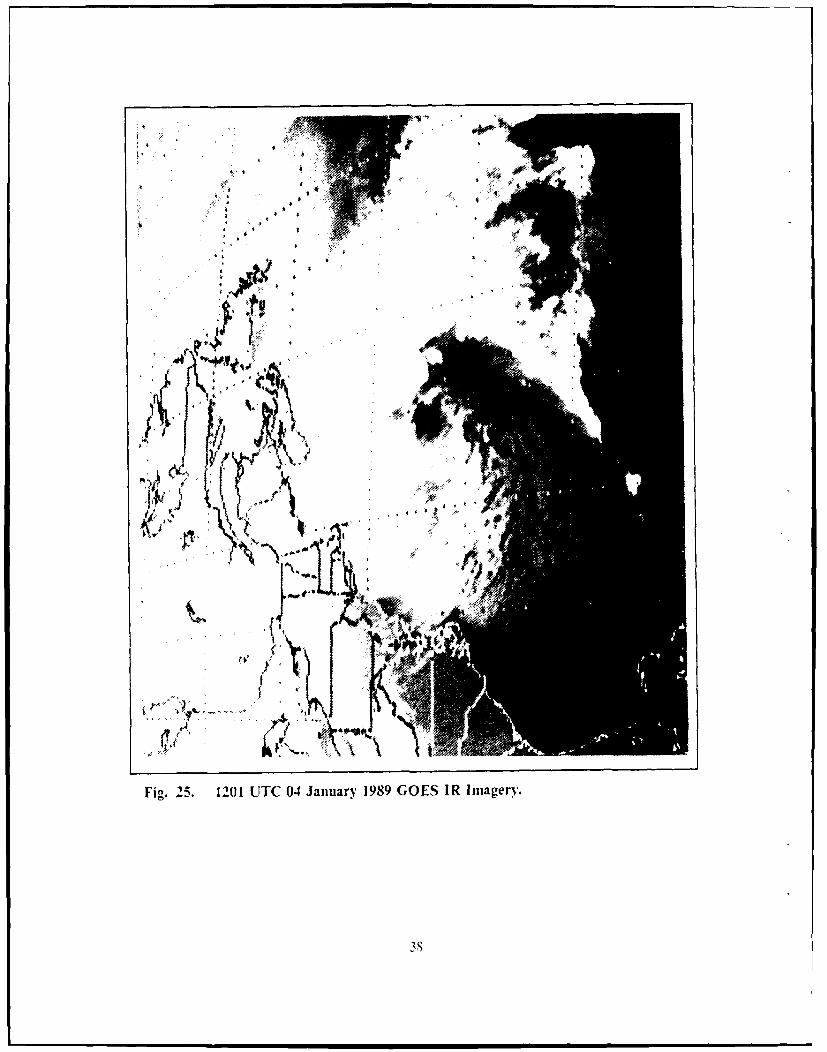
Fig. 2 5. 1201 UTC 04 January 1989 GOES IR Imagery.
3S

r--
- Ip
IL
0. .. .... ... I...... .. a
in knots
39..... ..
___ .j a-
04.o
(0
I f.
O~~C) 0 .'
N, %4 LO-
00
Fig.~-ZT 27 00UC0 aur 18 e ee nlss. oi ie r
40
0 .................................. .-
........ .......................;...... , . _........ ,""
"~ ~ ~ ~ ~ ~ ~~~~~. ............................. ° .°...........
.............. 0'U....... ....
.......
.. ...... ........ ... ,..-n
Fig .......... 00 .... .5 J a u r 19 9 3 0 m n l s s. oi i eg e o p t e n .....ig h... . D a h e li e0r s t c s ( / ) l t e i d r
.... ........s .
...... ........ ..1
IV. COMPARISON OF DYNAMICAL FORCING.
A. UPPER-LEVEL PROCESSES.
As suggested by many other studies [e.g. Sanders (1986), Uccellini et al (1984)],
upper-level baroclinic processes are important factors in rapid c clone development.
Both the maritime and continental cyclones in this study had strong upper-level forcing.
The land cyclone did not start to rapidly develop until the upper-level forcing was posi-
tioned over the surface low. The maritime cyclone formed in response to strong upper-
level forcing over the North Carolina coast.
The upper-level forcing for the continental cyclone remained uncoupled from the
surface low for about 24 hours. When the upper- level forcing "overran" the surface
cyclone, rapid cyclogenesis began to occur. In the maritime case, the upper-level forcing
was responsible for the formation of a weak surface low off the Carolina coast. The
upper-lev-1 forcing was present throughout the development of the maritime cyclone and
contributed to explosive development of the cyclone.
During the development of the land cyclone, an upstream entrance-downstream exit
dual jet streak pattern formed for this cyclone. The downstream jet developed to the
north of the cyclone prior to the cyclone moving into that region. This jet became ex-
tremely important because it interacted with the entrance streak to produce large
upper-level divergence values. The left side entrance jet exit region and the right side exit
jet entrance region were aligned by 0000 UTC 16 November 1988 (Fig. 10). Notice the
strong and vcry localized 300 mb divergence value over Iowa in Fig. 29. Spectral modcl
analysis show a similar evolution of the jet streaks and produced divergence values
nearly as large as those in Fig. 29. Within the limits of the 12 h analysis, this time period
had the highest values of divergence. The alignment of the jet streak divergence region
provided very favorable upper-level divergence over the surface cyclone and rapid de-
velopment resulted.
The maritime cyclone (03.06 January 1989) was located in the left exit region of a
strong jet streak from the onset. The land downstream jet was present before the rapid
development stage of the that cyclone and formed in response to confluence with the
upstream short wave trough and the downstream ridge. ltowever, a dual entrance-exit
confwuration does not develop in the ocean case until 1200 UTC 04 January 19S9
(within the constraints of 12-hour analysis periods). The downstream exit jet apparently
42
does not form earlier because the younger cyclone has developed so rapidly that the
wavelength is too short between the new cyclone and older cyclone to the northeast.
This short wavelength prevents the formation of a downstream ridge and no confluent
upper-level flow develops. After the older cyclone propagated to the northeast, a very
weak ridge developed (downstream of the developing cyclone) and an exit jet formed by
1200 UTC 04 January 1989 in response to cyclogenesis and warm front baroclinic proc-
esses. At this time, the divergence regions of both jets are aligned to enhance upper-level
divergence. The 300 mb divergence (Fig. 30.) gives a good depiction of the strong, lo-
calized divergence present with these jet streaks. The maritime divergence values are
quite similar to the land case values, however, the maritime area of divergence appears
to be two to three times as large. This divergence size difference may be a reflection of
the different NMC grids used. The ocean case employed the Spectral model with less
resolution than the Nested Grid used in the land case. The divergence in the land case
also tended to be less concentrated in the Spectral model analysis. Consequently, there
may be finer structure in the maritime divergence field that is lost due to resolution of
the Spectral model.
There appear to be subtle differences in the upper-level forcing between these con-
tinental and maritime cases. Over the land, the cyclone did not become "explosive" until
the upper-level divergence caused by both the entrance and exit jet streaks was posi-
tioned over the cyclone center. On the other hand, the maritime cyclone was rapidly
developing under the forcing of only the entrance jet before the dual jet pattern devel-
oped. This difference may only reflect the difference in the upper-level only.(land) forc-
ing and the deeper baroclinic forcing in the ocean case. The presence of a jet streak in
the upper-level wave provided significant forcing to the surface cyclone in both cases.
The shear vorticity generated by the streaks enhanced the curvature vorticitv found in
the upper trough. The divergence generated by the streaks allowed for increased lower-
level convergence, greater vertical motion. and rapid development of the cyclone.
B. SURFACE/LOW LEVEL FORCING.
As is evident in the Petterssen Development equation (Petterssen, 1956), low-level
thermal advection plays an equally important role in forcing cyclogenesis. Strong ther-
mal advection greatly enhances the vertical motion in a developing cyclone. In addition,
frontozenesis enhances the thermal gradient and jet intensity which results in strong lo-
cal regions of divcrgence.
43

As previously mentioned in the continental cyclone synoptic discussion, there was
a 12 * C'50 nmi surface temperature difference across the cold front in the early stagesof cyclone development. The warm front also displayed a pronounced temperature dif-
ference of 10 C.'50 nmi during the developing and mature stages of the cyclone. Incontrast, the maritime cyclone had much weaker surface temperature differences across
the cold and warm front boundaries (2 * C/100 nmi for both fronts) but had significant
temperature differences between the warm and cold sectors. It appears that the landcyclone in this study had stronger surface warm and cold fronts. However, the maritime
cyclone appears to have greater total baroclinicity as evidenced by comparing the land
vertical cross section (Fig. 11) with the ocean vertical cross section (Fig. 22).
The advection of cold air over warm water has a significant impact on cyclogenesis.
The sensible heating of the cooler air reduces static stability and aids vertical motions
and convection. It is important to e.amine the heat and moisture fluxes in the boundary
layer to gain an insight to the potential affect each may have on cyclogensis.Nuss and Kamikawa (1990) examined the interaction of surface heat and moisture
fluxes in the boundary laver and their effects on explosive cyclogenesis. By studying tile
boundary layer equivalent potential temperature budgets, Nuss and Kamikawa were able
to separate the increase in equivalent potential temperature into local and advcctiveparts. This study conducted a similar examination, except that the dry potential tem-
perature 0 is used. The GE.MPAK software available in the Interactive Digital Envi-
ronmental Lab at the Naval Postgraduate School was utilized for this study. In keeping
within the limits of the 12-hour analysis periods and the GEM PAK system, an analysis
of the change in 0 with time (ultimately heating) was attempted. The time averagcd
advection of 0 by the observed wind (using advection values at the start and end of' the
12-h period) was subtracted from the local time derivative of 0 to give a residual localchance in 0. which represents the contributions of local heating. vertical advection and
any errors in the analysis. The local change in 0 due to vertical advection was ignored
due to its presumed small size at 1000 nib and inaccessibility through the gridded data
set and so the residual is assumed to represent primarily surface heating. The majordrawback encountered in this calculation was that it is not possible to determine the
accuracy of the difference between advection and the time derivative. The equation forcalculating 0 changes from gridded data uses time averaged 0 advection data combinedwith 12-hour changes in 0 and vertical advection is neglected. consequently significant
errors are possible. Assuning typical values for the variations of' the terms in thethermodynamic equation. it is conceivable that errors are as large as 50 ,.
44

During the early formation of the maritime cyclone over the Virginia-Carolina coast.
weak warm advection from the south can be observed. Fig. 31 shows the residual 1000
mb local 0 change from 1200 UTC 03 January 1989 to 0000 UTC 04 January 1989.
Acknowledging that the error in this analysis method may be as great as 50 %, the above
figure shows almost no local heating to the east of the cyclone. It appears that almost
all the low level heating resulted from advection. This appears to be consistent with
previous observations noted in the synoptic discussions. The cold air has not penetrated
south over the water to a great extent during this time frame. There should be little
surface heating and large advective changes.
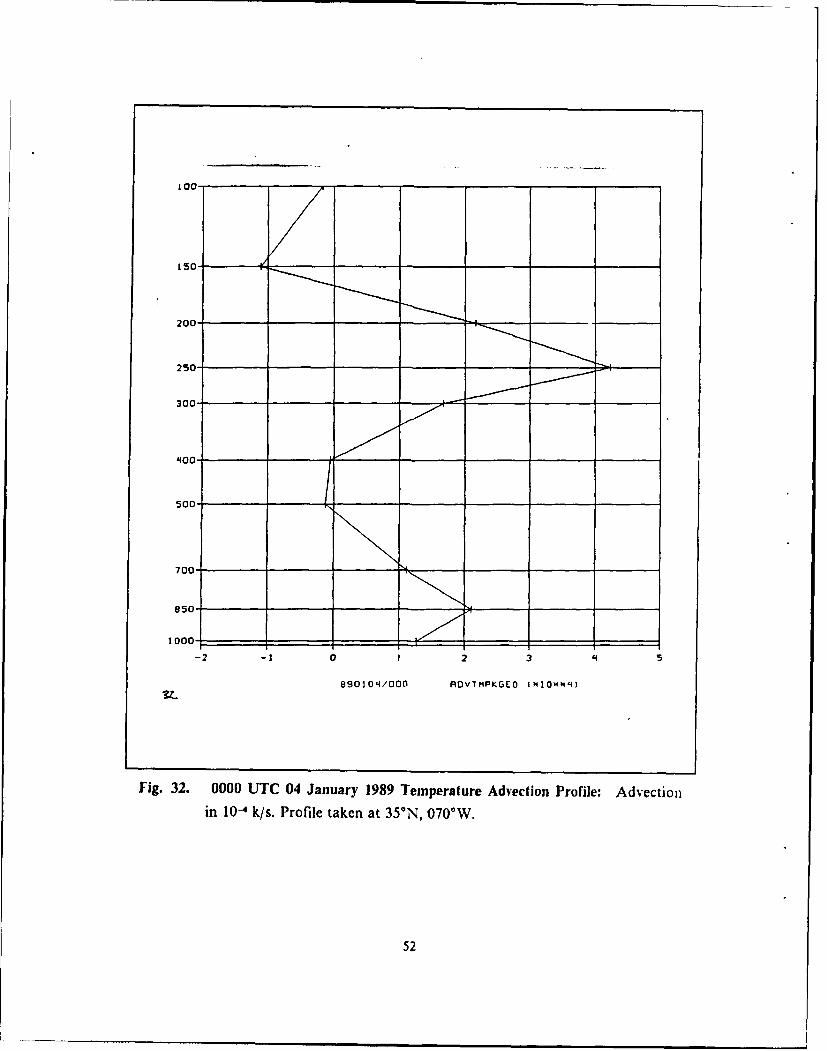
A profile of thermal advection by the geostrophic wind is provided in Fig. 32 for a
point about 150 nmi east of the 0000 UTC 04 January 1989 cyclone position. This point
was selected as it lies on the track of the cyclone as it developed and propagated to the
east. The profile shows warm advection from the surface to 850 mb, then a region of
slight cold mid-level advection near 500 nib. This advection pattern reduces the static
stability of the air mass ahead of the cyclone in the 850-500 mb layer. It would appear
that any effect of surface heating would be to destabilize the layer below 850 mb also.
The next 12 hour period (0000-1200 UTC 04 January 1989) is of particular interest.
At 1200 UTC 04 January 1989 the cyclone is located about 300 nrni east of Norfolk.
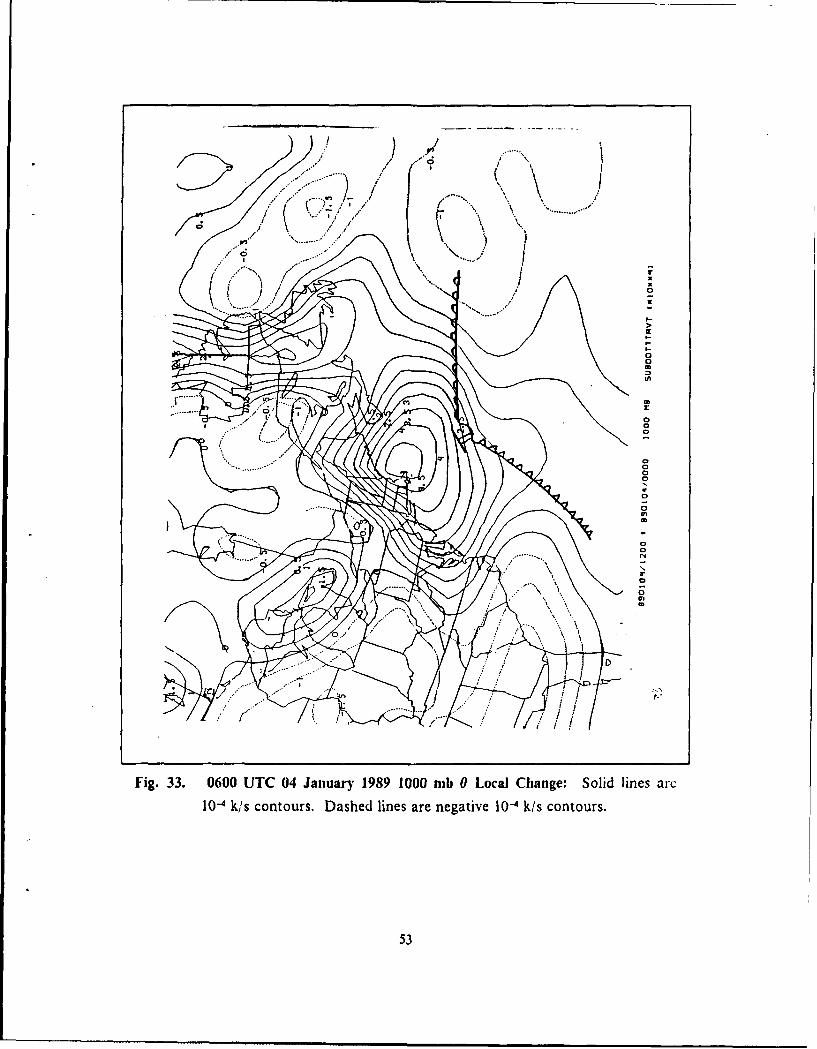
Fig. 33 shows the residual 1000 mb local 0 change. Notice the strong local heating in
advance of the rapidly developing cyclone.
During the rapid development of the maritime cyclone, the total change in 0 is
equally divided between advection and local heating. This division of the 0 change
agrees quite closely to the findings of Nuss and Kamikawa (1990). who also observed a
roughly equal split between local heating 0 changes and advection.
An advection profile was obtained (Fig. 31) for another point about 100 nnii down
the cyclone track. The warm advcction decreases fiom the surface to 700 nib, which
again tends to reduce the stability ahead of the surface cyclone.
Similar 0 calculations for the land case were attempted. However, the data fields
necessary to calculate the 0 change were limited to the NIC Spectral model analysis
fields for 1200 UTC 15 November 1988 to 0000 UIC 16 November 19SS. The results
were markedly different from the maritime case. At 1000 rob, almost the entire residual
0 change was from advection. There was apparently little or no boundary layer heating
associated with this time period. Fig. 35 displays the residual 1000 mb local change in 0
The low values of local 0 suggecst that there is little local heating occurring with this
cyclone.
45

C. STATIC STABILITY.
As is evident in the Pettcrssen Development equation (Petterssen 1956), or the
omega equation. static stability can greatly modify the response to forcing by vorticity
or thermal advection. A low stability environment is favorable for a large response
(rapid development). However, the static stability changes with time due to thermal
advection and surface heating processes. The stability may not remain favorably low for
extended periods of time. Maintenance of a low static stabiltiv environment can occur
in several ways; low level heating which may be due to the surface heat flux or strong
upper level cooling due to cold advection aloft. Nuss (1989), suggests that surface heat
flux influences on static stability are confined to the boundary layer. The static stability
was generally low during the entire maritime evolution, indicating some mechanism for
maintaining this situation (see Figs. 38 and 39). The continental cyclone exhibited
strong static stability except for one brief period at the onset of development which in-
dicates little or no mechanism for maintenance.
The static stability for the continental cyclone started at low values and increased
with time. At 1200 UTC 15 November 19S8, the surface cyclone was located over the
Texas-Oklahoma panhandle border. Fig. 36 shows some low stability in the inmediate
cyclone vicinity. TIhis period is interesting as it was the onset of strong coupling with the
upper-level forcing and marked the start of the rapid intensification phase of the storm.
After this time period, the land cyclone displayed increased stability along the frontal
zones and in the vicinity of the cyclone center. Fig. 37 gives a good example of the high
stability encountered at 1200 UTC 16 November 19SS. The surface cyclone was located
over Lake Superior and w'as continuing to intensify. Notice the high stability values
along the warm and cold frontal zones. Similar values were obtained using the Spectral
model analysis for this case so the NGM data are taken as representative. Comparison
of 0 changes due to advection at 1000 and 500 mb revealed that the low-level warm
advection should have reduced the static stability ahead of the cyclone. lowever. since
the static stability increased from 1200 UTC 15 November 1988 to 1200 UTC 16 No-
vember 198S. other factors must have offset the low-level advection. Convection and
latent heat release coupled with warm advection at the mid-lcvels may have provided the
stabilizing influence.
The maritime static stability was lower than the continental stability. The presence
of warm water underlying a cold air mass implies low-level heating. as previously dis-
cussed. It is interesting to examine the differences in static stability for a couple of time
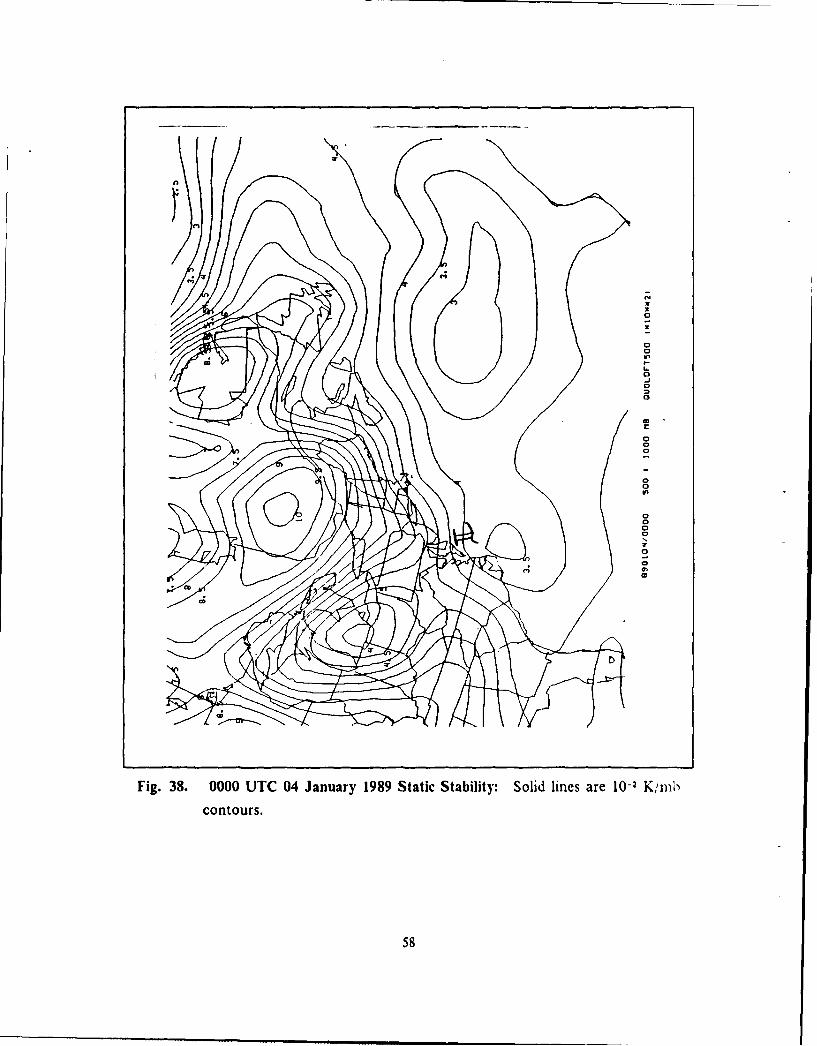
periods during the maritime storm. Fig. 38 depicts the stability for Ut O I C H- January
46
1989. The overall stability appears to be low near the cyclone center, about 4 units.
During the next 24 hours, the stability increases in the vicinity of the cyclone center to
about 4.5 units (Fig. 39).
Several factors contribute to the reduction of static stability over the water. As
mentioned previously, the boundary layer sensible heating from the warmer surface wa-
ter destabilizes the boundary layer. The differential advection at mid levels also enhances
the instability. The air mass immediately ahead of the cyclone had cold advection at the
700 mb level. This profile is unstable and would support convection quite well. Strong
convection was encountered near the cyclone, along the cold front and in the cold ai:
behind the front. However, convection acts to re-stabilize the environment through la-
tent heat distribution and may explain the slowly increasing static stability mentioned
previously.
D. SUMMARY.
The continental and maritime cyclones demonstrated some differences in the evolu-
tion of the upper-level forcing. The land case developed two strong jets early in the
cyclone development, with the downstream jet resulting from upper-level confluence.
The ocean case did not develop a dual jet streak until the cyclone was already rapidly
developing because of the presence of the older cyclone to the northeast. When the
downstream streak did develop, it was in response to cyclogenesis. In both cases. strong
embedded jet streaks provided good shear vorticity and greatly enhanced upper-level di-
vergence. It was interesting to note that in both cyclones, a dual entry-exit jet streak
pattern develops with optimum positioning of the divergence regions. Additionally,
strong positive vorticity advection was available, not only from the curvature in the up-
per trough, but from shear, generated by the jet streaks. The upper- level forcing in the
land case was responsible for the onset of rapid cyclone development. Further. the con-
tinental cyclone probably would not have developed in the absence of this forcing. The
upper forcing also produced the upper-level divergence that allowed for development of
the surface depression that rapidly developed into the intense maritime cyclone.
At the lower levels, there was some discernable differences in the temperature gra-
dient across warm and cold fronts between the land and ocean cases. The land cyclone
had very strong temperature gradients while the ocean case had little gradient, spread
over a large area. There was some difference in thermal advection between the two
cases. Both cases had dillcrential advection. The land case had some strong lowcr-levcl
warm advection with w eakcr warm advection at the mid-levels. Ilhe oceanic case had
47

strong low-level warm advection and weak cold advection at the mid-levels. This
advection profile proved to be a destabilizing influence on the oceanic air mass. Whhe
advection seemed to be the primary mechanism for heating and cooling of the land
cyclone, the oceanic case had several instances where the warm southerly advection was
significantly enhanced by local heating, probably by the warmer North Atlantic surface
water.
Initially the static stability was low for the continental case and rapidly increased
during the cyclone development. Low-level warm advection appears to have been
countered by mid-level warming from convection and advection. In contrast, the
oceanic static stability was universally quite low. The warmer water underlying the cold
air produced a continued low-level heat source that was not well balanced by mid-level
convection. The maritime environment also appears to maintain low static stability for
significant periods of time. Additionally, the differential advection with cooler advection
at the mid-layers, also helped to destabilize the air mass. The absence of static stability
proved to be a key feature in the explosive development of the maritime storm. Both the
land and ocean storms had strong upper-level forcing. yet the oceanic storm developed
much faster and to a greater extent. The low static stability of the maritime case allowed
for greatly enhanced vertical motion, which in turn, enhances upper-level divergence.
allows for deepening of the surface low, provides for increased convection and additional
release of latent heat. The extra heating further increases vertical motion, and a strong
positive fiedback loop is established.
4S

881116/0000 300 me DIVOSS (NIONN51
Fig. 29. 0000 UTC 16 November 1988 300 mb Divergence: Solid lines are 10Is-I
contours.
49

C;,
0
0
500

r1! \
0000
C;00
D
Fig.31. 800UTC 3 Jauar 198 100 mb0 Loal Cang: Soid ie r
posiive10- kos cotous. ashd lies re egaive 0-4/s onturs
510
L50 - .__.................
200-
500_____
300-
-2 -10I2 3 '
89010'4/000 ADVIMPKGEO INI0O4m')
Fig. 32. 0000 UTC 04 January 1989 Temperature Advection Profile: Advectiolnin 10-4 k/s. Profile taken at 35*N, 070*W,
52
......-. ~........../...
C;V
..........
..... ..... .....
.........-
C50. .. . ......
......... ..
.........
D
Fig.33.0600UTC04 anuay 189 000 ib Loal Cang: Slid ine ar
10-4ilsconturs Dased ine arenegtive10-k/s ontur 0
530

t0o-
L50-
200-
250- -
300-
1400-
500
700-
850 _____
1000,
- 2 3 45 6
89 10'./1200 RDVTMPKGEO Iw2ONNl'
Fig. 34. 1200 UTC 04 January 1989 Temperature Advection Profile: Advection
in 10- k/s. Profile taken at 37°N, 061°W.
54

881116/0000 1 081115/L200 2000 me SUODOTITAVT (mIommNI
Fig. 35. 1800 UJTC 15 November 1988 1000 nib 0 Local Change: Solid lines arc
positive 10-4 k/'s contours. Dashed lines are negative 10-4 k,s contours.
55
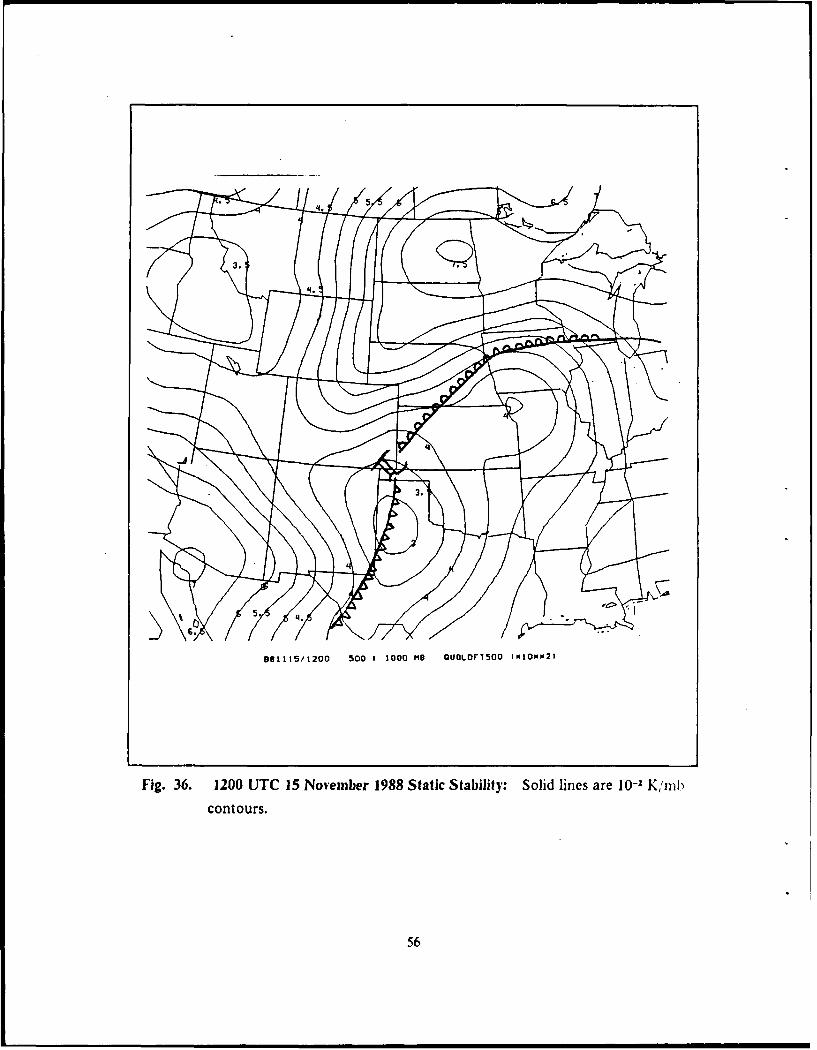
861 115/t200 500 S1000 MB QUOLDF7500 ImIONm2I
Fig. 36. 1200 UTC 15 November 1988 Static Stability: Solid lines are 10-2 K,'mb
contours.
56
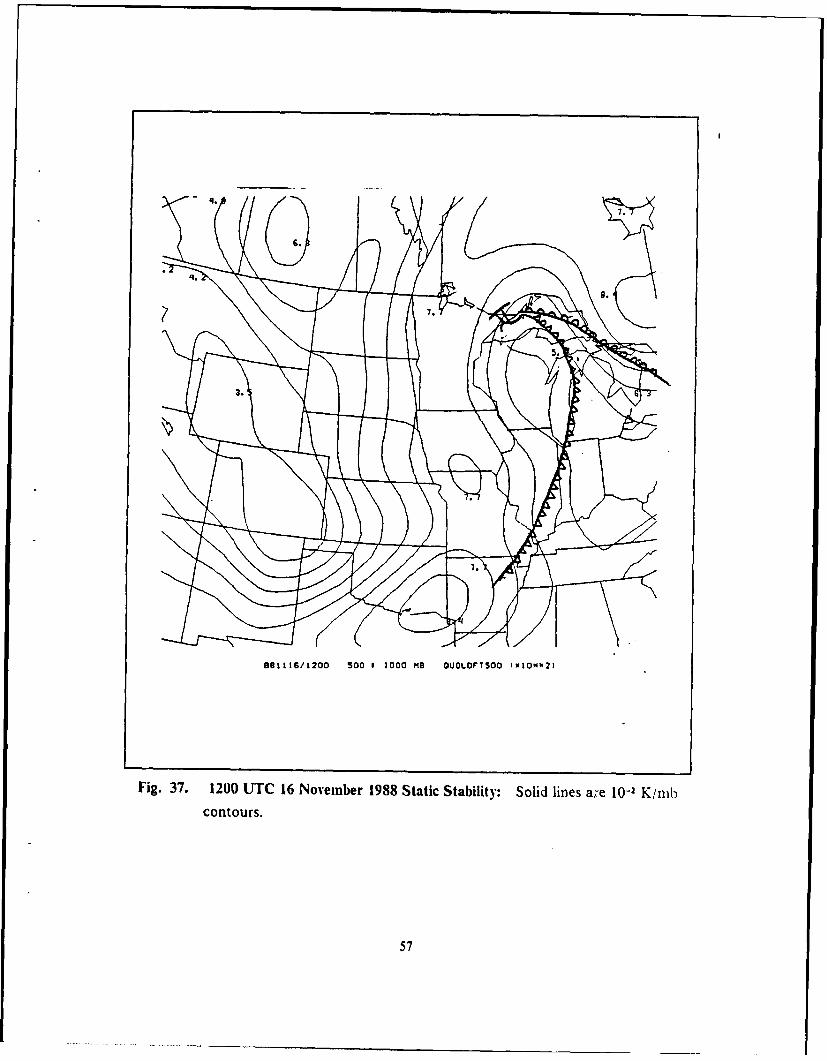
57.
7
YE,Ia
a0
I..0-I0
a
Uraaa
a0
00aa7aa0~U
Fig. 38. 0000 UTC 04 January 1989 Static Stability: Solid lines are lO~ K,'rnhcontours.
58

IL
0
0
C
0
0
01
Fig. 39. 0000 UTC 05 January 1989 Static Stability: Solid lines are 10-1 K,'Imb
contours.
59
V. CONCLUSIONS.
The analysis of a rapidly developing land and oceanic cyclone has shown that:
1. The upper-level forcing of the two cyclones appears to be quite similar during
the mature stage of development. In particular, a dual entrance-exit jet configuration
was observed for both cyclones. This dual jet structure evolved from quite different ini-
tial configurations. In the land cyclon!, the dual jet streaks formed early and the down-
stream jet formed in response to confluence at upper-levels. The maritime dual jet
pattern formed relatively late with the downstream streak forming in response to
cyclogenesis and strong baroclinic warm front processes.
2. When the left side exit region of the upstream streak and the right side entrance
region of the downstream jet are aligned, maximum upper-level divergence and surface
development are observed. In the land case, this strong divergence results from the
interaction of two pre-existing jet streaks. In the ocean case. strong divergence already
existed due to the strong upstream jet. As baroclinic processes of the warni front devel-
oped the downLream jet, divergence over the surface cyclone was further enhanced.
3. Although both cyclones displayed strong low-level thermal advection. the
processes that created this strong advection are different. At 1000 rnb, the total change
in potential temperature 0 is mostly from advection for the land case. Over the water,
the 1000 mb 0 change appears to be divided between advection and local boundary laver
heating. This indicates an active role of the surface heat fluxes in the oceanic cvclonc.
4. Initially, both cyclones had low static stability. Ilowever. the static stability
evolved very differently in the continental and maritime cyclones. Over the land, static
stability increased due to convection and weak warm advection at mid-levcls. especially
in the vicinity of' the frontal zones of the cyclone. In contrast, static stability remained
low in the oceanic cyclone due to strong surface heating and cold advection at the upper-
levels.
The oceanic cyclone developed much more rapidly and to a far greater extent than
did the land cyclone. Assuming equal contribution by the similar upper-level forcinis
(nearly equal divergence values) in these cases, the difference in cyclone intensity must
be attributed to low-level processes and static stability diflerences. Some specific rec-
onmmendations for further study include: I ). Detailed analysis of' the ocean case uin
[RI CA data to better resolve jet streak warm fiont interaction. 2i. A surface
60
flux'planetary boundary layer analysis to provide more definite evaluation of the surface
heating contribution in the ocean cyclone. 3). Detailed analysis of the jet interaction in
the land cyclone, possibly through model studies. 4). Complete analysis of the static
stability evolution in both cases to better understand why low static stability is main-
tained in the oceanic case and not the land case.
61
LIST OF REFERENCES
Bosart, L. F. and S. C. Lin, 1984: A diagnostic analysis of the Presidents' Day storm of
February 1979. Mon. Wea. Rev., 112, 2148-2177.
Kocin, P. J., and L. W. Uccellini, 1985: A survey of major East Coast snowstorms,
1960-1983. Part 1: Summar- of surface and upper-level characteristics. NASA
Technical .M1emorandumn 86196, NASA,' Goddard Space Flight Center, Greenbelt
MD, 20771.
Nuss. W. A., 1989: Air-sea interaction influences on the structure and intensification of
an idealized marine cyclone. Mon. Wea. Rev., 117, 351-369.
----, and S. 1. Kan- ikawa, 1990: Dynamics and boundary layer processes in two Asian
Cyclones. Mon. WVea. Rev., In Press.
Palmen, E., and C. W. Newton. 1969: Atmospheric Circulation Systemns. Academic Press,
603 pp.
Petterssen. S., 1956: Weather Analysis and Forecasting, Vol. 1. McGraw-ltill, 428 pp.
Reed. R. J. and M. D. Albright, 1986: A case study of explosive cyclogeiesis in theeastern Pacific. Mon. l'ea. Rev., 114, 2297-2319.
Roebber, P. J., 1984: Statistical analysis and updated climatology of explosive cyclones.Mon. ll'ea. Rev., 112, 1577-1589.
Sanders. F. 1986: Explosive cyclogenesis in the west central North Atlantic ocean,
19S1-1984. Part 1: Composite structure and mean behaviour. .11m. lfca. Rev., 114,
1781-1794.
-.... -1989: A series 0fsuifacc maps for ERICsl lOP =-#5. July 1989, Marblehead, MA,
01945.
62

-----, and J. R. Gyakum, 1980: Synoptic dynamic climatology of the bomb. Mon. 11'ea.
Rev., 108, 1589-1606.
Uccellini, L. W., P. J. Kocin, R. A. Petersen, C. H. Wash, and K. F. Brill, 1984: The
Presidents' Day cyclone of 18-19 February 1979: Synoptic overview and analysis
of the subvtropical jet streak influencing the pre-cyclogenetic period. Mon. IVea.
Rev., 112, 31-55.
------, R. A. Petersen, K. F. Brill. P. J. Kocin, and J. J. Tuccillo. 1987: Synergistic
interactions between upper-level jet streak and diabatic processes that influence the
development of a low-level jet and a secondary coastal cyclone. Mon. 11ea. Rev.,
115, 2227-2261.
63
INITIAL DISTRIBUTION LIST
No. Copies
1. Defense Technical Information Center 2Cameron StationAlexandria, VA 22304-6145
2. Library, Code 0142 2Naval Postgraduate SchoolMonterey, CA 93943-5002
3. Chairman (Code 63Rd)Department of MeteorologyNaval Postgraduate SchoolMonterey. CA 93943-5000
4. Chairman (Code 6SCo)Department of OceanographyNaval Postgraduate SchoolMonterey. CA 93943-5000
5. Professor Wendell A. Nuss (Code 63Nu) 2Department of MeteorologyNaval Postgraduate SchoolMonterey, CA 93943-5000
6. Professor Carlyle 11. Wash (Code 63Wa)Department of MeteorologyNaval Postgraduate SchoolMonterev. CA 93943-5000
7. LCDR. Michael E. Kreyenhagen. USN2CO.MCRUDESGRU 2[PO .Miami. FL 34099-4701
8. Director Naval Oceanography DivisionNaval Observatory34th and Massachusetts Avenue NWWashington, DC 20390
9. Commander Naval Oceanography CommandStennis Space Center. MS 39529-5000
10. Commanding OfficerNaval Occanographic OfficeStennis Space Center, M1S 39522-5001
64
11. Commanding OfficerFleet Numerical Oceanography CenterMonterey, CA 93943
12. Commanding OfficerNaval Oceanographic and Atmospheric Research LaboratoryStennis Space Center, MS 39522-5005
13. Commanding OfficerNaval Oceanographic and Atmospheric Research LaboratoryMonterey, CA 93943-5006
14. Chairman. Oceanography DepartmentU.S. Naval AcademAnnapolis, MD 21402
15. Chief of Naval Research800 North Quincy StreetArlington. VA 22217
16. Office of Naval Research (Code 420)Naval Ocean Research and Development ActivityS0 North Quincy StreetArlington, VA 22217
17. Library AcquisitionsNational Center for Atmospheric ResearchP.O. Box 300Boulder, CO 80307
65