interim financial statements for the three … financial statements for the three months ended march...
TRANSCRIPT

INTERIM FINANCIAL STATEMENTS
For the three months ended March 31, 2016

2
GROUP BANK
For the three months ended March 31, 2016 2015 Change 2016 2015 Change
Rs.'000 Rs.'000 % Rs.'000 Rs.'000 %
Gross income 21,326,295 18,380,892 16.02 21,208,403 18,291,881 15.94
Interest income 18,141,147 15,701,187 15.54 18,049,683 15,634,438 15.45
Less : Interest expenses 9,967,868 8,415,222 18.45 9,936,758 8,401,751 18.27
Net interest income 8,173,279 7,285,965 12.18 8,112,925 7,232,687 12.17
Fees and commission income 1,756,092 1,466,526 19.75 1,753,018 1,464,870 19.67
Less: Fees and commission expenses 293,109 208,432 40.63 293,109 208,432 40.63
Net fees and commission income 1,462,983 1,258,094 16.29 1,459,909 1,256,438 16.19
Net gains/(losses) from trading 1,018,658 (647,685) 257.28 1,018,658 (647,685) 257.28
Net gains/(losses) from financial instruments designated at fair value
through profit or loss- - - - - -
Net gains/(losses) from financial investments 50,248 33,795 48.68 50,248 33,795 48.68
Other income (net) 360,150 1,827,069 (80.29) 336,796 1,806,463 (81.36)
Total operating income 11,065,318 9,757,238 13.41 10,978,536 9,681,698 13.39
Less :Impairment charges for loans and other losses 1,000,341 1,334,222 (25.02) 995,075 1,329,692 (25.17)
Individual impairment (142,763) 210,453 (167.84) (142,763) 210,453 (167.84)
Collective impairment 1,139,800 1,123,685 1.43 1,125,433 1,116,554 0.80
Others 3,304 84 3,833.33 12,405 2,685 362.01
Net operating income 10,064,977 8,423,016 19.49 9,983,461 8,352,006 19.53
Less: Expenses 4,628,452 4,166,650 11.08 4,606,725 4,147,965 11.06
Personnel expenses 2,728,836 2,465,033 10.70 2,704,875 2,444,751 10.64
Depreciation and amortisation 302,862 287,734 5.26 286,271 271,174 5.57
Other expenses 1,596,754 1,413,883 12.93 1,615,579 1,432,040 12.82
Operating profit before Value Added Tax (VAT) & Nation Building Tax
(NBT) on Financial Services5,436,525 4,256,366 27.73 5,376,736 4,204,041 27.89
Less: Value Added Tax (VAT) & Nation Building Tax (NBT) on financial services 797,263 626,138 27.33 797,263 624,883 27.59
Operating profit after Value Added Tax (VAT) & Nation Building Tax
(NBT) on Financial Services4,639,262 3,630,228 27.80 4,579,473 3,579,158 27.95
Add: Share of profits/(losses) of associates, net of tax 750 2,261 (66.83) - - -
Profit before income tax 4,640,012 3,632,489 27.74 4,579,473 3,579,158 27.95
Less : Income tax expense 1,376,412 1,095,697 25.62 1,345,158 1,070,476 25.66
Profit for the period 3,263,600 2,536,792 28.65 3,234,315 2,508,682 28.92
Profit attributable to:
Equity holders of the Bank 3,262,485 2,535,769 28.66 3,234,315 2,508,682 28.92
Non-controlling interest 1,115 1,023 8.99 - - -
Profit for the period 3,263,600 2,536,792 28.65 3,234,315 2,508,682 28.92
Earnings per share (EPS)
Basic earnings per ordinary share (Rs.) 3.72 2.90 28.28 3.69 2.87 28.57
Diluted earnings per ordinary share (Rs.) 3.72 2.89 28.72 3.69 2.86 29.02
INCOME STATEMENT
3
GROUP BANK
For the three months ended March 31, 2016 2015 Change 2016 2015 Change
Rs.'000 Rs.'000 % Rs.'000 Rs.'000 %
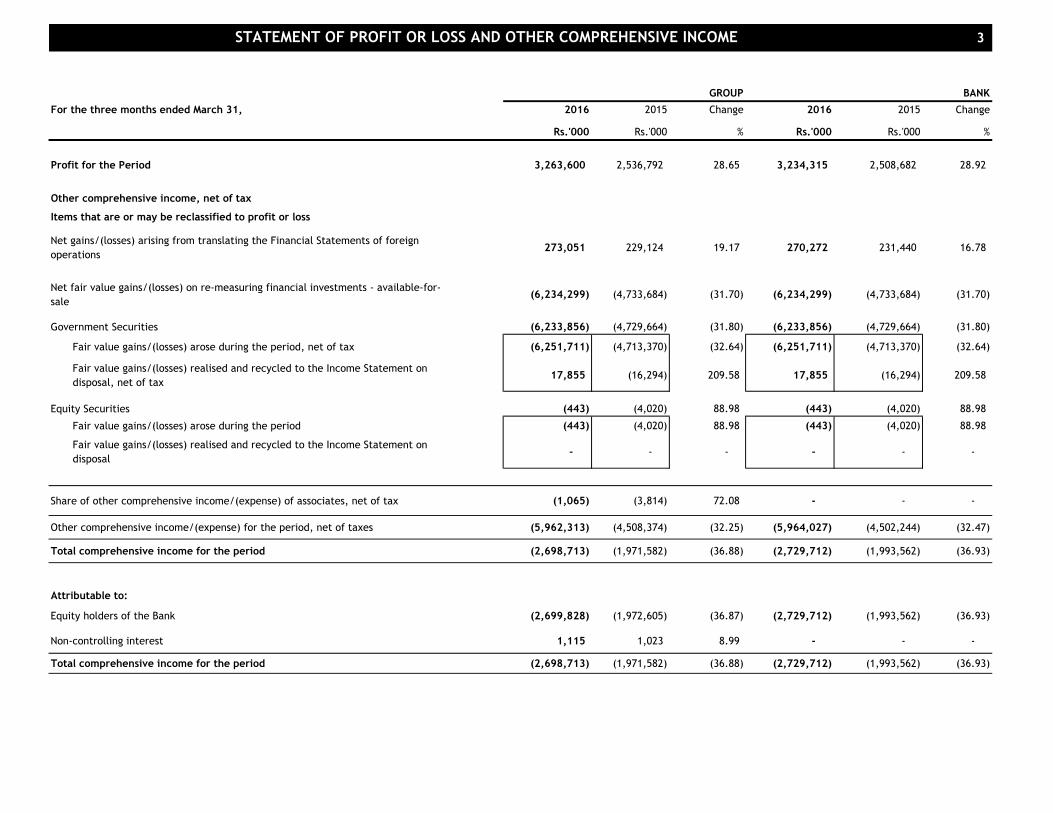
Profit for the Period 3,263,600 2,536,792 28.65 3,234,315 2,508,682 28.92
Other comprehensive income, net of tax
Items that are or may be reclassified to profit or loss
Net gains/(losses) arising from translating the Financial Statements of foreign
operations273,051 229,124 19.17 270,272 231,440 16.78
Net fair value gains/(losses) on re-measuring financial investments - available-for-
sale(6,234,299) (4,733,684) (31.70) (6,234,299) (4,733,684) (31.70)
Government Securities (6,233,856) (4,729,664) (31.80) (6,233,856) (4,729,664) (31.80)
Fair value gains/(losses) arose during the period, net of tax (6,251,711) (4,713,370) (32.64) (6,251,711) (4,713,370) (32.64)
Fair value gains/(losses) realised and recycled to the Income Statement on
disposal, net of tax17,855 (16,294) 209.58 17,855 (16,294) 209.58
Equity Securities (443) (4,020) 88.98 (443) (4,020) 88.98
Fair value gains/(losses) arose during the period (443) (4,020) 88.98 (443) (4,020) 88.98
Fair value gains/(losses) realised and recycled to the Income Statement on
disposal- - - - - -
Share of other comprehensive income/(expense) of associates, net of tax (1,065) (3,814) 72.08 - - -
Other comprehensive income/(expense) for the period, net of taxes (5,962,313) (4,508,374) (32.25) (5,964,027) (4,502,244) (32.47)
Total comprehensive income for the period (2,698,713) (1,971,582) (36.88) (2,729,712) (1,993,562) (36.93)
Attributable to:
Equity holders of the Bank (2,699,828) (1,972,605) (36.87) (2,729,712) (1,993,562) (36.93)
Non-controlling interest 1,115 1,023 8.99 - - -
Total comprehensive income for the period (2,698,713) (1,971,582) (36.88) (2,729,712) (1,993,562) (36.93)
STATEMENT OF PROFIT OR LOSS AND OTHER COMPREHENSIVE INCOME
4
Group Bank
As at 31.03.2016 31.12.2015 Change 31.03.2016 31.12.2015 Change
( Audited ) ( Audited )
Rs.'000 Rs.'000 % Rs.'000 Rs.'000 %
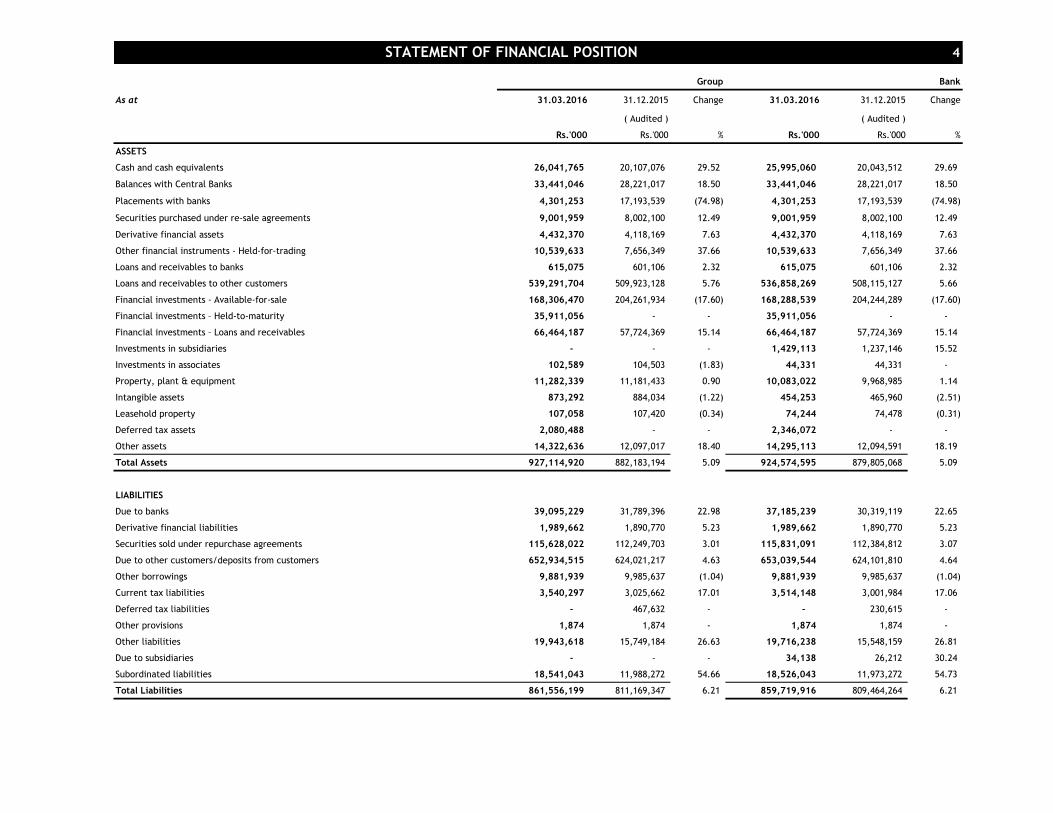
ASSETS
Cash and cash equivalents 26,041,765 20,107,076 29.52 25,995,060 20,043,512 29.69
Balances with Central Banks 33,441,046 28,221,017 18.50 33,441,046 28,221,017 18.50
Placements with banks 4,301,253 17,193,539 (74.98) 4,301,253 17,193,539 (74.98)
Securities purchased under re-sale agreements 9,001,959 8,002,100 12.49 9,001,959 8,002,100 12.49
Derivative financial assets 4,432,370 4,118,169 7.63 4,432,370 4,118,169 7.63
Other financial instruments - Held-for-trading 10,539,633 7,656,349 37.66 10,539,633 7,656,349 37.66
Loans and receivables to banks 615,075 601,106 2.32 615,075 601,106 2.32
Loans and receivables to other customers 539,291,704 509,923,128 5.76 536,858,269 508,115,127 5.66
Financial investments - Available-for-sale 168,306,470 204,261,934 (17.60) 168,288,539 204,244,289 (17.60)
Financial investments – Held-to-maturity 35,911,056 - - 35,911,056 - -
Financial investments – Loans and receivables 66,464,187 57,724,369 15.14 66,464,187 57,724,369 15.14
Investments in subsidiaries - - - 1,429,113 1,237,146 15.52
Investments in associates 102,589 104,503 (1.83) 44,331 44,331 -
Property, plant & equipment 11,282,339 11,181,433 0.90 10,083,022 9,968,985 1.14
Intangible assets 873,292 884,034 (1.22) 454,253 465,960 (2.51)
Leasehold property 107,058 107,420 (0.34) 74,244 74,478 (0.31)
Deferred tax assets 2,080,488 - - 2,346,072 - -
Other assets 14,322,636 12,097,017 18.40 14,295,113 12,094,591 18.19
Total Assets 927,114,920 882,183,194 5.09 924,574,595 879,805,068 5.09
LIABILITIES
Due to banks 39,095,229 31,789,396 22.98 37,185,239 30,319,119 22.65
Derivative financial liabilities 1,989,662 1,890,770 5.23 1,989,662 1,890,770 5.23
Securities sold under repurchase agreements 115,628,022 112,249,703 3.01 115,831,091 112,384,812 3.07
Due to other customers/deposits from customers 652,934,515 624,021,217 4.63 653,039,544 624,101,810 4.64
Other borrowings 9,881,939 9,985,637 (1.04) 9,881,939 9,985,637 (1.04)
Current tax liabilities 3,540,297 3,025,662 17.01 3,514,148 3,001,984 17.06
Deferred tax liabilities - 467,632 - - 230,615 -
Other provisions 1,874 1,874 - 1,874 1,874 -
Other liabilities 19,943,618 15,749,184 26.63 19,716,238 15,548,159 26.81
Due to subsidiaries - - - 34,138 26,212 30.24
Subordinated liabilities 18,541,043 11,988,272 54.66 18,526,043 11,973,272 54.73
Total Liabilities 861,556,199 811,169,347 6.21 859,719,916 809,464,264 6.21
STATEMENT OF FINANCIAL POSITION

5
Group Bank
As at 31.03.2016 31.12.2015 Change 31.03.2016 31.12.2015 Change
( Audited ) ( Audited )
Rs.'000 Rs.'000 % Rs.'000 Rs.'000 %
EQUITY
Stated capital 24,848,775 23,254,605 6.86 24,848,775 23,254,605 6.86
Statutory reserves 4,922,368 4,922,367 - 4,922,265 4,922,264 0.00
Retained earnings 3,344,242 4,467,807 (25.15) 3,238,197 4,388,867 (26.22)
Other reserves 32,392,013 38,318,860 (15.47) 31,845,442 37,775,068 (15.70)
Total equity attributable to equity holders of the Group/Bank 65,507,398 70,963,639 (7.69) 64,854,679 70,340,804 (7.80)
Non-controlling Interest 51,323 50,208 2.22 - - -
Total Equity 65,558,721 71,013,847 (7.68) 64,854,679 70,340,804 (7.80)
Total Liabilities and Equity 927,114,920 882,183,194 5.09 924,574,595 879,805,068 5.09
Contingent Liabilities and Commitments 494,580,467 521,232,320 (5.11) 494,580,467 521,232,320 (5.11)
Net Assets Value per Ordinary Share (Rs.) 73.63 80.93 (9.02) 72.89 80.22 (9.14)
Memorandum Information
Number of Employees 4,937 4,951
Number of Customer Service Centers 269 264
CERTIFICATION :
(Sgd.) K.D.N. Buddhipala
Chief Financial Officer
(Sgd.) K.G.D.D Dheerasinghe (Sgd.) J.Durairatnam
Chairman Managing Director/Chief Executive Officer
May 11, 2016
Colombo
These Financial Statements have been prepared in compliance with requirements of the Companies Act No.07 of 2007.
(b) the information contained in these financial statements have been extracted from the unaudited Financial Statements of the Group & the Bank, unless indicated
as audited.
(a) the above financial statements have been prepared in compliance with the formats and definitions prescribed by the Central Bank of Sri Lanka,
We, the undersigned, being the Chairman and the Managing Director/Chief Executive Officer of the Commercial Bank of Ceylon PLC, certify jointly that:
STATEMENT OF FINANCIAL POSITION
6
Statutory Reserve
Fund
Primary Dealer
Special Risk
Reserve
Revaluation
Reserve
Available-for-Sale
Reserve
Foreign Currency
Translation
Reserve
General Reserve Employee Share
Option Reserve
Shareholders'
Funds
Non-Controlling
Interest
Total Equity
Rs.'000 Rs.'000 Rs.'000 Rs.'000 Rs.'000 Rs.'000 Rs.'000 Rs.'000 Rs.'000 Rs.'000 Rs.'000 Rs.'000
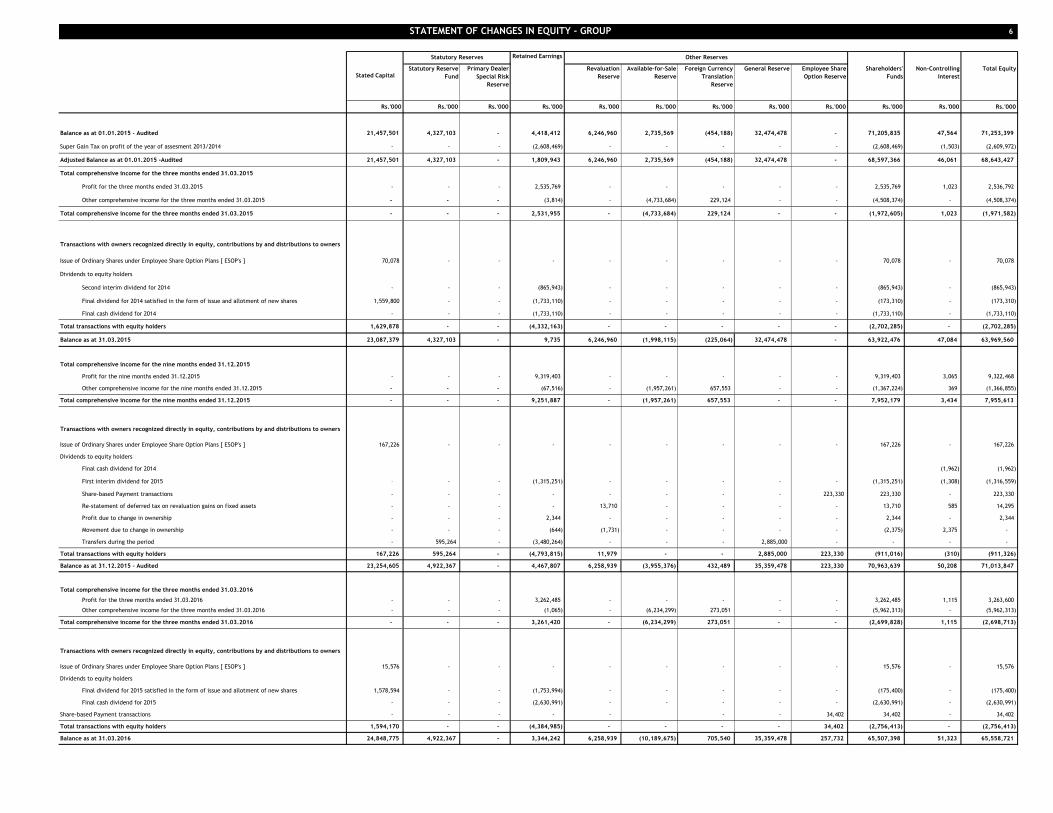
Balance as at 01.01.2015 - Audited 21,457,501 4,327,103 - 4,418,412 6,246,960 2,735,569 (454,188) 32,474,478 - 71,205,835 47,564 71,253,399
Super Gain Tax on profit of the year of assesment 2013/2014 - - - (2,608,469) - - - - - (2,608,469) (1,503) (2,609,972)
Adjusted Balance as at 01.01.2015 -Audited 21,457,501 4,327,103 - 1,809,943 6,246,960 2,735,569 (454,188) 32,474,478 - 68,597,366 46,061 68,643,427
Total comprehensive income for the three months ended 31.03.2015
Profit for the three months ended 31.03.2015 - - - 2,535,769 - - - - - 2,535,769 1,023 2,536,792
Other comprehensive income for the three months ended 31.03.2015 - - - (3,814) - (4,733,684) 229,124 - - (4,508,374) - (4,508,374)
Total comprehensive income for the three months ended 31.03.2015 - - - 2,531,955 - (4,733,684) 229,124 - - (1,972,605) 1,023 (1,971,582)
Transactions with owners recognized directly in equity, contributions by and distributions to owners
Issue of Ordinary Shares under Employee Share Option Plans [ ESOP's ] 70,078 - - - - - - - - 70,078 - 70,078
Dividends to equity holders
Second interim dividend for 2014 - - - (865,943) - - - - - (865,943) - (865,943)
Final dividend for 2014 satisfied in the form of issue and allotment of new shares 1,559,800 - - (1,733,110) - - - - - (173,310) - (173,310)
Final cash dividend for 2014 - - - (1,733,110) - - - - - (1,733,110) - (1,733,110)
Total transactions with equity holders 1,629,878 - - (4,332,163) - - - - - (2,702,285) - (2,702,285)
Balance as at 31.03.2015 23,087,379 4,327,103 - 9,735 6,246,960 (1,998,115) (225,064) 32,474,478 - 63,922,476 47,084 63,969,560
Total comprehensive income for the nine months ended 31.12.2015
Profit for the nine months ended 31.12.2015 - - - 9,319,403 - - - - - 9,319,403 3,065 9,322,468
Other comprehensive income for the nine months ended 31.12.2015 - - - (67,516) - (1,957,261) 657,553 - - (1,367,224) 369 (1,366,855)
Total comprehensive income for the nine months ended 31.12.2015 - - - 9,251,887 - (1,957,261) 657,553 - - 7,952,179 3,434 7,955,613
Transactions with owners recognized directly in equity, contributions by and distributions to owners
Issue of Ordinary Shares under Employee Share Option Plans [ ESOP's ] 167,226 - - - - - - - - 167,226 - 167,226
Dividends to equity holders
Final cash dividend for 2014 (1,962) (1,962)
First interim dividend for 2015 - - - (1,315,251) - - - - - (1,315,251) (1,308) (1,316,559)
Share-based Payment transactions - - - - - - - - 223,330 223,330 - 223,330
Re-statement of deferred tax on revaluation gains on fixed assets - - - - 13,710 - - - - 13,710 585 14,295
Profit due to change in ownership - - - 2,344 - - - - - 2,344 - 2,344
Movement due to change in ownership - - - (644) (1,731) - - - - (2,375) 2,375 -
Transfers during the period - 595,264 - (3,480,264) - - - 2,885,000 - - - -
Total transactions with equity holders 167,226 595,264 - (4,793,815) 11,979 - - 2,885,000 223,330 (911,016) (310) (911,326)
Balance as at 31.12.2015 - Audited 23,254,605 4,922,367 - 4,467,807 6,258,939 (3,955,376) 432,489 35,359,478 223,330 70,963,639 50,208 71,013,847
Total comprehensive income for the three months ended 31.03.2016
Profit for the three months ended 31.03.2016 - - - 3,262,485 - - - - - 3,262,485 1,115 3,263,600
Other comprehensive income for the three months ended 31.03.2016 - - - (1,065) - (6,234,299) 273,051 - - (5,962,313) - (5,962,313)
Total comprehensive income for the three months ended 31.03.2016 - - - 3,261,420 - (6,234,299) 273,051 - - (2,699,828) 1,115 (2,698,713)
Transactions with owners recognized directly in equity, contributions by and distributions to owners
Issue of Ordinary Shares under Employee Share Option Plans [ ESOP's ] 15,576 - - - - - - - - 15,576 - 15,576
Dividends to equity holders
Final dividend for 2015 satisfied in the form of issue and allotment of new shares 1,578,594 - - (1,753,994) - - - - - (175,400) - (175,400)
Final cash dividend for 2015 - - - (2,630,991) - - - - - (2,630,991) - (2,630,991)
Share-based Payment transactions - - - - - - - 34,402 34,402 - 34,402
Total transactions with equity holders 1,594,170 - - (4,384,985) - - - - 34,402 (2,756,413) - (2,756,413)
Balance as at 31.03.2016 24,848,775 4,922,367 - 3,344,242 6,258,939 (10,189,675) 705,540 35,359,478 257,732 65,507,398 51,323 65,558,721
STATEMENT OF CHANGES IN EQUITY - GROUP
Statutory Reserves Other ReservesRetained Earnings
Stated Capital

7
Statutory Reserve
Fund
Primary Dealer
Special Risk
Reserve
Revaluation
Reserve
Available-for-Sale
Reserve
Foreign Currency
Translation
Reserve
General Reserve Employee Share
Option Reserve
Shareholders'
Funds
Non-Controlling
Interest
Total Equity
Rs.'000 Rs.'000 Rs.'000 Rs.'000 Rs.'000 Rs.'000 Rs.'000 Rs.'000 Rs.'000 Rs.'000 Rs.'000 Rs.'000
Balance as at 01.01.2015 - Audited 21,457,501 4,327,103 - 4,258,287 5,722,859 2,735,578 (464,076) 32,474,478 - 70,511,730 - 70,511,730
Super Gain Tax on profit of the year of assessment 2013/2014 (2,576,355) (2,576,355) (2,576,355)
Balance as at 01.01.2015 - Audited 21,457,501 4,327,103 - 1,681,932 5,722,859 2,735,578 (464,076) 32,474,478 - 67,935,375 - 67,935,375
Total comprehensive income for the three months ended 31.03.2015
Profit for the three months ended 31.03.2015 - - - 2,508,682 - - - - - 2,508,682 - 2,508,682
Other comprehensive income for the three months ended 31.03.2015 - - - - - (4,733,684) 231,440 - - (4,502,244) - (4,502,244)
Total comprehensive income for the three months ended 31.03.2015 - - - 2,508,682 - (4,733,684) 231,440 - - (1,993,562) - (1,993,562)
Transactions with owners recognized directly in equity, contributions by and distributions to owners
Issue of Ordinary Shares under Employee Share Option Plans [ ESOP's ] 70,078 - - - - - - - - 70,078 - 70,078
Dividends to equity holders
Second interim dividend for 2014 - - - (865,943) - - - - - (865,943) - (865,943)
Final dividend for 2014 satisfied in the form of issue and allotment of new shares 1,559,800 - - (1,733,110) - - - - - (173,310) - (173,310)
Final cash dividend for 2014 - - - (1,733,110) - - - - - (1,733,110) - (1,733,110)
Transfers during the period - - - - - - - - - - - -
Total transactions with equity holders 1,629,878 - - (4,332,163) - - - - - (2,702,285) - (2,702,285)
Balance as at 31.03.2015 23,087,379 4,327,103 - (141,549) 5,722,859 (1,998,106) (232,636) 32,474,478 - 63,239,528 - 63,239,528
Total comprehensive income for the nine months ended 31.12.2015
Profit for the nine months ended 31.12.2015 - - - 9,394,542 - - - - - 9,394,542 - 9,394,542
Other comprehensive income for the nine months ended 31.12.2015 - - - (68,714) - (1,957,261) 657,404 - - (1,368,571) - (1,368,571)
Total comprehensive income for the nine months ended 31.12.2015 - - - 9,325,828 - (1,957,261) 657,404 - - 8,025,971 - 8,025,971
Transactions with owners recognized directly in equity, contributions by and distributions to owners
Issue of Ordinary Shares under Employee Share Option Plans [ ESOP's ] 167,226 - - - - - - - - 167,226 - 167,226
Dividends to equity holders
First interim dividend for 2015 - - - (1,315,251) - - - - - (1,315,251) - (1,315,251)
Share-based Payment transactions - - - - - - - - 223,330 223,330 - 223,330
Transfers during the period - 595,161 - (3,480,161) - - - 2,885,000 - - - -
Total transactions with equity holders 167,226 595,161 - (4,795,412) - - - 2,885,000 223,330 (924,695) - (924,695)
Balance as at 31.12.2015 - Audited 23,254,605 4,922,264 - 4,388,867 5,722,859 (3,955,367) 424,768 35,359,478 223,330 70,340,804 - 70,340,804
Total comprehensive income for the three months ended 31.03.2016
Profit for the three months ended 31.03.2016 - - - 3,234,315 - - - - - 3,234,315 - 3,234,315
Other comprehensive income for the three months ended 31.03.2016 - - - - - (6,234,299) 270,272 - - (5,964,027) - (5,964,027)
Total comprehensive income for the three months ended 31.03.2016 - - - 3,234,315 - (6,234,299) 270,272 - - (2,729,712) - (2,729,712)
Transactions with owners recognized directly in equity, contributions by and distributions to owners
Issue of Ordinary Shares under Employee Share Option Plans [ ESOP's ] 15,576 - - - - - - - - 15,576 - 15,576
Dividends to equity holders
Final dividend for 2015 satisfied in the form of issue and allotment of new shares 1,578,594 - - (1,753,994) - - - - - (175,400) - (175,400)
Final cash dividend for 2015 - - - (2,630,991) - - - - - (2,630,991) - (2,630,991)
Share-based Payment transactions - - - - - - - - 34,402 34,402 - 34,402
Total transactions with equity holders 1,594,170 - - (4,384,985) - - - - 34,402 (2,756,413) - (2,756,413)
Balance as at 31.03.2016 24,848,775 4,922,264 - 3,238,197 5,722,859 (10,189,666) 695,040 35,359,478 257,732 64,854,679 - 64,854,679
STATEMENT OF CHANGES IN EQUITY - BANK
Statutory Reserves Retained Earnings Other Reserves
Stated Capital
8
Group Bank
For the three months ended March 31, 2016 2015 2016 2015
Rs.'000 Rs.'000 Rs.'000 Rs.'000
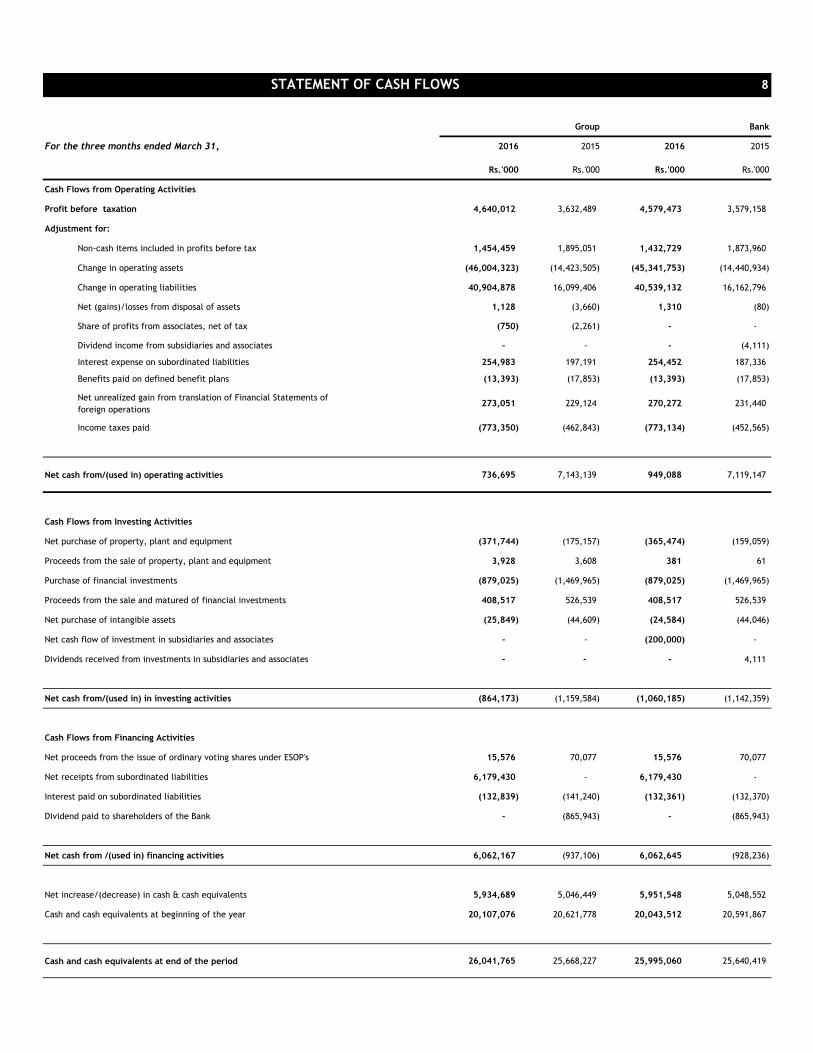
Cash Flows from Operating Activities
Profit before taxation 4,640,012 3,632,489 4,579,473 3,579,158
Adjustment for:
Non-cash items included in profits before tax 1,454,459 1,895,051 1,432,729 1,873,960
Change in operating assets (46,004,323) (14,423,505) (45,341,753) (14,440,934)
Change in operating liabilities 40,904,878 16,099,406 40,539,132 16,162,796
Net (gains)/losses from disposal of assets 1,128 (3,660) 1,310 (80)
Share of profits from associates, net of tax (750) (2,261) - -
Dividend income from subsidiaries and associates - - - (4,111)
Interest expense on subordinated liabilities 254,983 197,191 254,452 187,336
Benefits paid on defined benefit plans (13,393) (17,853) (13,393) (17,853)
Net unrealized gain from translation of Financial Statements of
foreign operations273,051 229,124 270,272 231,440
Income taxes paid (773,350) (462,843) (773,134) (452,565)
Net cash from/(used in) operating activities 736,695 7,143,139 949,088 7,119,147
Cash Flows from Investing Activities
Net purchase of property, plant and equipment (371,744) (175,157) (365,474) (159,059)
Proceeds from the sale of property, plant and equipment 3,928 3,608 381 61
Purchase of financial investments (879,025) (1,469,965) (879,025) (1,469,965)
Proceeds from the sale and matured of financial investments 408,517 526,539 408,517 526,539
Net purchase of intangible assets (25,849) (44,609) (24,584) (44,046)
Net cash flow of investment in subsidiaries and associates - - (200,000) -
Dividends received from investments in subsidiaries and associates - - - 4,111
Net cash from/(used in) in investing activities (864,173) (1,159,584) (1,060,185) (1,142,359)
Cash Flows from Financing Activities
Net proceeds from the issue of ordinary voting shares under ESOP's 15,576 70,077 15,576 70,077
Net receipts from subordinated liabilities 6,179,430 - 6,179,430 -
Interest paid on subordinated liabilities (132,839) (141,240) (132,361) (132,370)
Dividend paid to shareholders of the Bank - (865,943) - (865,943)
Net cash from /(used in) financing activities 6,062,167 (937,106) 6,062,645 (928,236)
Net increase/(decrease) in cash & cash equivalents 5,934,689 5,046,449 5,951,548 5,048,552
Cash and cash equivalents at beginning of the year 20,107,076 20,621,778 20,043,512 20,591,867
Cash and cash equivalents at end of the period 26,041,765 25,668,227 25,995,060 25,640,419
STATEMENT OF CASH FLOWS
9
Held for Trading
(HFT)
Held to Maturity
(HTM)
Loans & Receivables
(L & R)
Available for Sale
(AFS)
Other Amortised
CostTotal
Rs.'000 Rs.'000 Rs.'000 Rs.'000 Rs.'000 Rs.'000
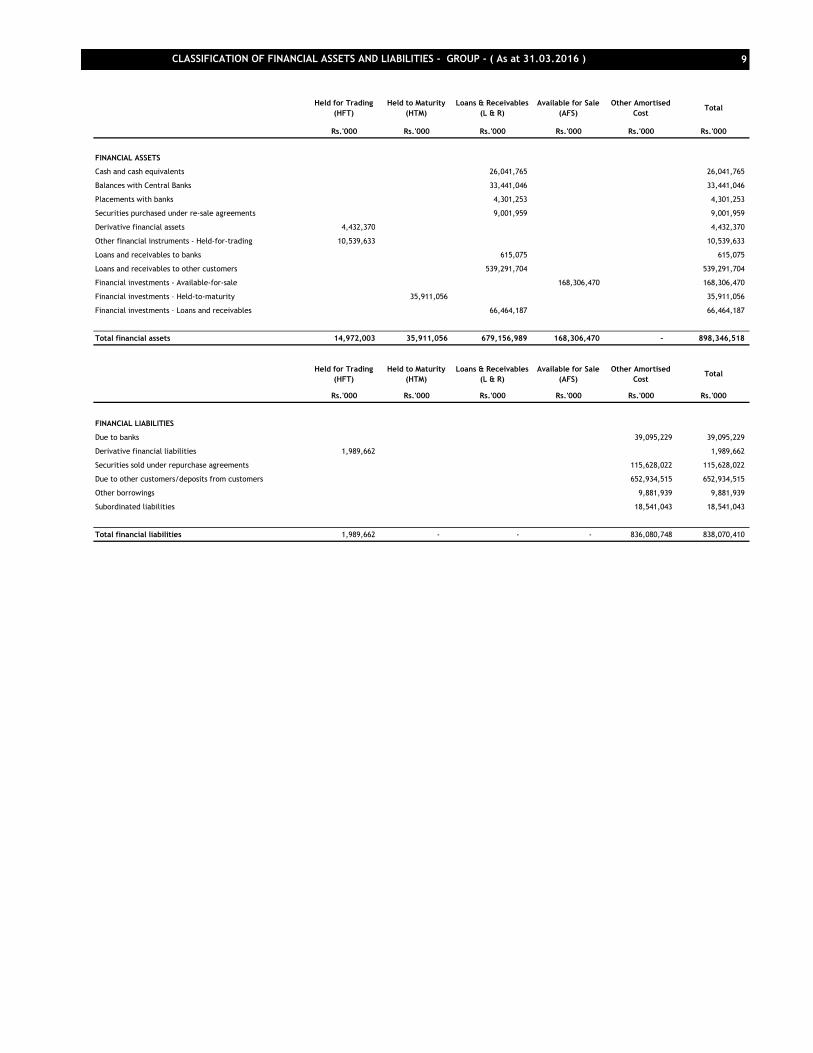
FINANCIAL ASSETS
Cash and cash equivalents 26,041,765 26,041,765
Balances with Central Banks 33,441,046 33,441,046
Placements with banks 4,301,253 4,301,253
Securities purchased under re-sale agreements 9,001,959 9,001,959
Derivative financial assets 4,432,370 4,432,370
Other financial instruments - Held-for-trading 10,539,633 10,539,633
Loans and receivables to banks 615,075 615,075
Loans and receivables to other customers 539,291,704 539,291,704
Financial investments - Available-for-sale 168,306,470 168,306,470
Financial investments – Held-to-maturity 35,911,056 35,911,056
Financial investments – Loans and receivables 66,464,187 66,464,187
Total financial assets 14,972,003 35,911,056 679,156,989 168,306,470 - 898,346,518
Held for Trading
(HFT)
Held to Maturity
(HTM)
Loans & Receivables
(L & R)
Available for Sale
(AFS)
Other Amortised
CostTotal
Rs.'000 Rs.'000 Rs.'000 Rs.'000 Rs.'000 Rs.'000
FINANCIAL LIABILITIES
Due to banks 39,095,229 39,095,229
Derivative financial liabilities 1,989,662 1,989,662
Securities sold under repurchase agreements 115,628,022 115,628,022
Due to other customers/deposits from customers 652,934,515 652,934,515
Other borrowings 9,881,939 9,881,939
Subordinated liabilities 18,541,043 18,541,043
Total financial liabilities 1,989,662 - - - 836,080,748 838,070,410
CLASSIFICATION OF FINANCIAL ASSETS AND LIABILITIES - GROUP - ( As at 31.03.2016 )
10
Held for Trading
(HFT)
Held to Maturity
(HTM)
Loans & Receivables
(L & R)
Available for Sale
(AFS)
Other Amortised
CostTotal
Rs.'000 Rs.'000 Rs.'000 Rs.'000 Rs.'000 Rs.'000
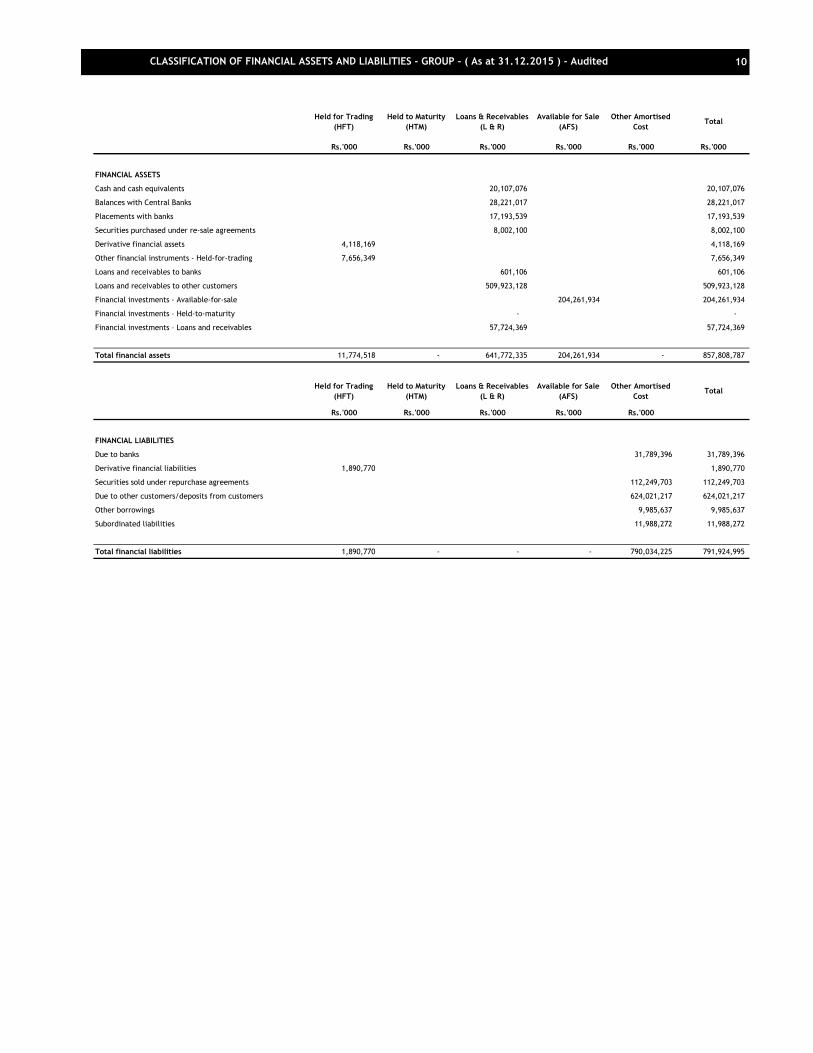
FINANCIAL ASSETS
Cash and cash equivalents 20,107,076 20,107,076
Balances with Central Banks 28,221,017 28,221,017
Placements with banks 17,193,539 17,193,539
Securities purchased under re-sale agreements 8,002,100 8,002,100
Derivative financial assets 4,118,169 4,118,169
Other financial instruments - Held-for-trading 7,656,349 7,656,349
Loans and receivables to banks 601,106 601,106
Loans and receivables to other customers 509,923,128 509,923,128
Financial investments - Available-for-sale 204,261,934 204,261,934
Financial investments – Held-to-maturity - -
Financial investments – Loans and receivables 57,724,369 57,724,369
Total financial assets 11,774,518 - 641,772,335 204,261,934 - 857,808,787
Held for Trading
(HFT)
Held to Maturity
(HTM)
Loans & Receivables
(L & R)
Available for Sale
(AFS)
Other Amortised
CostTotal
Rs.'000 Rs.'000 Rs.'000 Rs.'000 Rs.'000
FINANCIAL LIABILITIES
Due to banks 31,789,396 31,789,396
Derivative financial liabilities 1,890,770 1,890,770
Securities sold under repurchase agreements 112,249,703 112,249,703
Due to other customers/deposits from customers 624,021,217 624,021,217
Other borrowings 9,985,637 9,985,637
Subordinated liabilities 11,988,272 11,988,272
Total financial liabilities 1,890,770 - - - 790,034,225 791,924,995
CLASSIFICATION OF FINANCIAL ASSETS AND LIABILITIES - GROUP - ( As at 31.12.2015 ) - Audited

11
Held for Trading
(HFT)
Held to Maturity
(HTM)
Loans & Receivables
(L & R)
Available for Sale
(AFS)
Other Amortised
CostTotal
Rs.'000 Rs.'000 Rs.'000 Rs.'000 Rs.'000 Rs.'000
FINANCIAL ASSETS
Cash and cash equivalents 25,995,060 25,995,060
Balances with Central Banks 33,441,046 33,441,046
Placements with banks 4,301,253 4,301,253
Securities purchased under re-sale agreements 9,001,959 9,001,959
Derivative financial assets 4,432,370 4,432,370
Other financial instruments - Held-for-trading 10,539,633 10,539,633
Loans and receivables to banks 615,075 615,075
Loans and receivables to other customers 536,858,269 536,858,269
Financial investments - Available-for-sale 168,288,539 168,288,539
Financial investments – Held-to-maturity 35,911,056 35,911,056
Financial investments – Loans and receivables 66,464,187 66,464,187
Total financial assets 14,972,003 35,911,056 676,676,849 168,288,539 - 895,848,447
Held for Trading
(HFT)
Held to Maturity
(HTM)
Loans & Receivables
(L & R)
Available for Sale
(AFS)
Other Amortised
CostTotal
Rs.'000 Rs.'000 Rs.'000 Rs.'000 Rs.'000 Rs.'000
FINANCIAL LIABILITIES
Due to banks 37,185,239 37,185,239
Derivative financial liabilities 1,989,662 1,989,662
Securities sold under repurchase agreements 115,831,091 115,831,091
Due to other customers/deposits from customers 653,039,544 653,039,544
Other borrowings 9,881,939 9,881,939
Subordinated liabilities 18,526,043 18,526,043
Total financial liabilities 1,989,662 - - - 834,463,856 836,453,518
CLASSIFICATION OF FINANCIAL ASSETS AND LIABILITIES - BANK - ( As at 31.03.2016 )

12
Held for Trading
(HFT)
Held to Maturity
(HTM)
Loans & Receivables
(L & R)
Available for Sale
(AFS)
Other Amortised
CostTotal
Rs.'000 Rs.'000 Rs.'000 Rs.'000 Rs.'000 Rs.'000
FINANCIAL ASSETS
Cash and cash equivalents 20,043,512 20,043,512
Balances with Central Banks 28,221,017 28,221,017
Placements with banks 17,193,539 17,193,539
Securities purchased under re-sale agreements 8,002,100 8,002,100
Derivative financial assets 4,118,169 4,118,169
Other financial instruments - Held-for-trading 7,656,349 7,656,349
Loans and receivables to banks 601,106 601,106
Loans and receivables to other customers 508,115,127 508,115,127
Financial investments - Available-for-sale 204,244,289 204,244,289
Financial investments – Held-to-maturity - -
Financial investments – Loans and receivables 57,724,369 57,724,369
Total financial assets 11,774,518 - 639,900,770 204,244,289 - 855,919,577
Held for Trading
(HFT)
Held to Maturity
(HTM)
Loans & Receivables
(L & R)
Available for Sale
(AFS)
Other Amortised
CostTotal
Rs.'000 Rs.'000 Rs.'000 Rs.'000 Rs.'000
FINANCIAL LIABILITIES
Due to banks 30,319,119 30,319,119
Derivative financial liabilities 1,890,770 1,890,770
Securities sold under repurchase agreements 112,384,812 112,384,812
Due to other customers/deposits from customers 624,101,810 624,101,810
Other borrowings 9,985,637 9,985,637
Subordinated liabilities 11,973,272 11,973,272
Total financial liabilities 1,890,770 - - - 788,764,650 790,655,420
CLASSIFICATION OF FINANCIAL ASSETS AND LIABILITIES - BANK - ( As at 31.12.2015 ) - Audited
13
Bank Group
As at As at As at As at
31.03.2016 31.12.2015 31.03.2016 31.12.2015
(Audited) (Audited)
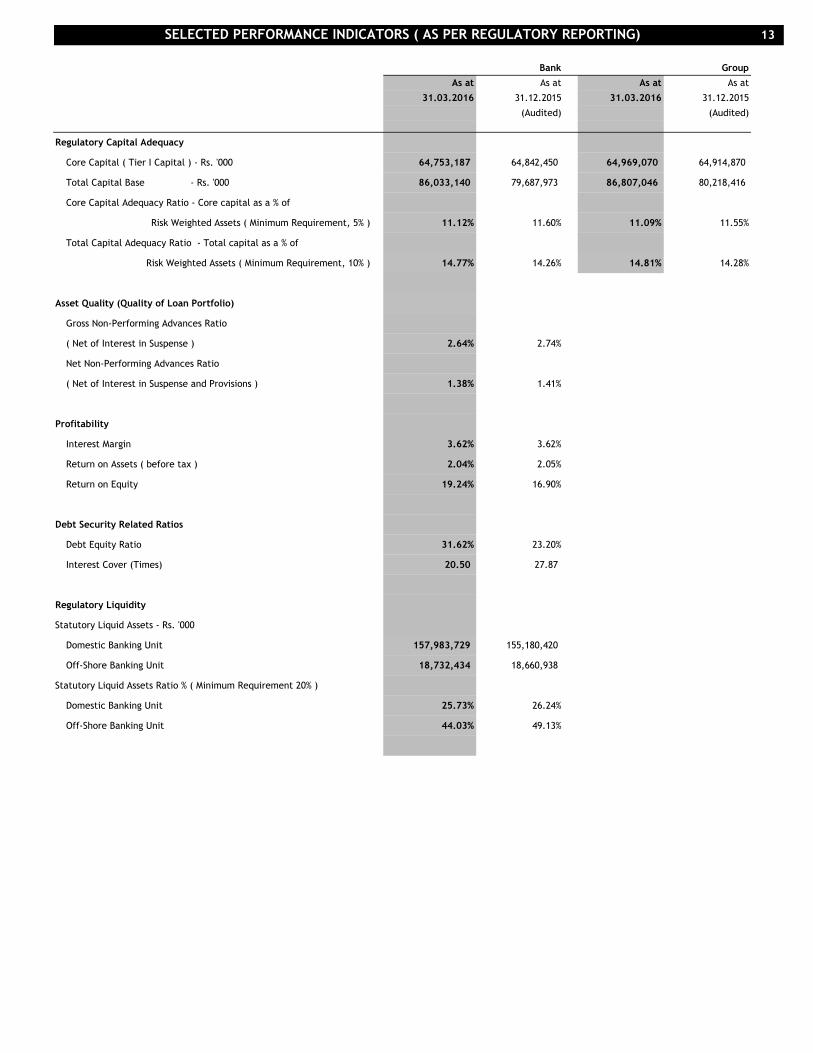
Regulatory Capital Adequacy
Core Capital ( Tier I Capital ) - Rs. '000 64,753,187 64,842,450 64,969,070 64,914,870
Total Capital Base - Rs. '000 86,033,140 79,687,973 86,807,046 80,218,416
Core Capital Adequacy Ratio - Core capital as a % of
Risk Weighted Assets ( Minimum Requirement, 5% ) 11.12% 11.60% 11.09% 11.55%
Total Capital Adequacy Ratio - Total capital as a % of
Risk Weighted Assets ( Minimum Requirement, 10% ) 14.77% 14.26% 14.81% 14.28%
Asset Quality (Quality of Loan Portfolio)
Gross Non-Performing Advances Ratio
( Net of Interest in Suspense ) 2.64% 2.74%
Net Non-Performing Advances Ratio
( Net of Interest in Suspense and Provisions ) 1.38% 1.41%
Profitability
Interest Margin 3.62% 3.62%
Return on Assets ( before tax ) 2.04% 2.05%
Return on Equity 19.24% 16.90%
Debt Security Related Ratios
Debt Equity Ratio 31.62% 23.20%
Interest Cover (Times) 20.50 27.87
Regulatory Liquidity
Statutory Liquid Assets - Rs. '000
Domestic Banking Unit 157,983,729 155,180,420
Off-Shore Banking Unit 18,732,434 18,660,938
Statutory Liquid Assets Ratio % ( Minimum Requirement 20% )
Domestic Banking Unit 25.73% 26.24%
Off-Shore Banking Unit 44.03% 49.13%
SELECTED PERFORMANCE INDICATORS ( AS PER REGULATORY REPORTING)

14
For the three months ended March 31, 2016 2015 2016 2015 2016 2015 2016 2015 2016 2015 2016 2015
Rs.'000 Rs.'000 Rs.'000 Rs.'000 Rs.'000 Rs.'000 Rs.'000 Rs.'000 Rs.'000 Rs.'000 Rs.'000 Rs.'000
External Operating income :
Net interest income 5,705,640 5,276,544 1,447,033 1,384,637 800,429 702,558 115,717 81,050 104,460 (158,824) 8,173,279 7,285,965
Foreign exchange profit 82,550 15,571 385,859 184,753 112,144 113,693 - - 573,099 162,015 1,153,652 476,032
Net fees and commission income 963,218 758,602 370,375 356,312 127,624 137,243 250 3,600 1,516 2,337 1,462,983 1,258,094
Other income 245,516 585,624 35,530 33,220 29,496 29,047 (43,395) (6,348) (74,345) 14,526 192,802 656,069
Eliminations/unallocated 82,602 81,078
Total Operating income 6,996,924 6,636,341 2,238,797 1,958,922 1,069,693 982,541 72,572 78,302 604,730 20,054 11,065,318 9,757,238
Credit loss expenses (908,334) (1,197,729) (43,758) (56,838) (48,249) (79,655) - - - - (1,000,341) (1,334,222)
Net Operating income 6,088,590 5,438,612 2,195,039 1,902,084 1,021,444 902,886 72,572 78,302 604,730 20,054 10,064,977 8,423,016
Segment result 2,732,319 2,073,011 955,377 950,682 796,578 676,811 40,352 37,512 114,636 (107,788) 4,639,262 3,630,228
Profit from operations 4,639,262 3,630,228
Share of profit of Associates, net of tax 750 2,261
Income tax expense (1,376,412) (1,095,697)
Non Controlling Interest (1,115) (1,023)
Net profit for the period, attributable to Equity holders of the Bank 3,262,485 2,535,769
As at March 31, 2016 2015 2016 2015 2016 2015 2016 2015 2016 2015 2016 2015
Rs.'000 Rs.'000 Rs.'000 Rs.'000 Rs.'000 Rs.'000 Rs.'000 Rs.'000 Rs.'000 Rs.'000 Rs.'000 Rs.'000
Other information
Segment assets 302,741,726 238,533,952 223,126,822 184,139,549 86,057,432 73,742,302 13,150,939 11,384,978 252,091,564 269,031,136 877,168,483 776,831,917
Investment in associates - - - - - - 102,584 99,130 - - 102,584 99,130
Unallocated Assets - - - - - - - - - - 49,843,853 32,542,502
Total assets 302,741,726 238,533,952 223,126,822 184,139,549 86,057,432 73,742,302 13,253,523 11,484,108 252,091,564 269,031,136 927,114,920 809,473,549
Segment liabilities 526,215,833 443,561,817 120,799,317 92,516,176 75,943,166 65,157,992 13,253,523 11,484,108 121,804,063 126,686,753 858,015,902 739,406,846
Unallocated liabilities - - - - - - - - - - 3,540,297 3,487,172
Total liabilities 526,215,833 443,561,817 120,799,317 92,516,176 75,943,166 65,157,992 13,253,523 11,484,108 121,804,063 126,686,753 861,556,199 742,894,018
For the three months ended March 31, 2016 2015 2016 2015 2016 2015 2016 2015 2016 2015 2016 2015
Rs.'000 Rs.'000 Rs.'000 Rs.'000 Rs.'000 Rs.'000 Rs.'000 Rs.'000 Rs.'000 Rs.'000 Rs.'000 Rs.'000
Information on cash flows
Cash flows from operating activities 12,680,283 14,291,529 1,733,988 (71,620) (387,508) (2,245,717) 772,656 363,146 (14,062,724) (5,194,199) 736,695 7,143,139
Cash flows from investing activities - - - - - - (470,508) (943,426) (470,508) (943,426)
Cash flows from financing activities - - - - - - - - 6,046,591 (141,240) 6,046,591 (141,240)
Capital expenditure -
Property,Plant & Equipment (367,816) (171,549)
Intangible assets (25,849) (44,609)
Eliminations/unallocated 15,576 (795,866)
Net cash flow generated during the period 5,934,689 5,046,449
OPERATING SEGMENTS
Personal Banking Corporate Banking International Operations Investment Banking Dealing/Treasury Total/Consolidated

15
Twenty largest voting shareholders as as at March 31, 2016
Name of the Shareholder No. of Shares %
DFCC Bank A/C 1 122,747,994 14.74
Mr.Y.S. H. I. Silva 82,560,993 9.92
Employees Provident Fund 80,741,135 9.70
Sri Lanka Insurance Corporation Ltd. - Life Fund 41,854,996 5.03
CB NY S/A International Finance Corporation 37,206,040 4.47
Sri Lanka Insurance Corporation Ltd. - General Fund 35,989,537 4.32
Melstacorp Limited 24,895,305 2.99
HSBC Intl. Nominees Ltd. - JPMLU- Franklin Templeton Investment Funds 23,525,866 2.83
Mrs. L. E. M. Yaseen 15,603,339 1.87
HSBC Intl. Nominees Ltd. - SSBT-Morgan Stanley Institutional Fund, Inc. - Frontier Emerging Markets Portfolio 13,627,634 1.64
HSBC Intl. Nominees Ltd. - SSBT-Morgan Stanley Asset Management SA Acting on behalf of Morgan Stanley Galaxy Fund 12,565,008 1.51
HSBC Intl. Nominees Ltd. - BPSS LUX -Aberdeen Global Asia Pacific Equity Fund 11,172,854 1.34
Mercantile Investments and Finance PLC 10,661,077 1.28
HSBC Intl. Nominees Ltd. - BPSS LUX -Aberdeen Global - Asian Smaller Companies Fund 10,468,066 1.26
The Bank of New York Mellon SA/NV-CF Ruffer Total Return Fund 8,399,814 1.01
HSBC Intl. Nominees Ltd. - SSBT - Aberdeen Institutional Commingled Funds,LLC 8,368,934 1.01
HSBC Intl. Nominees Ltd. - SSBT -Wasatch Frontier Emerging Small Countries Fund 8,300,242 1.00
HSBC Intl. Nominees Ltd. - SSBT-National Westminster Bank Plc as Depositary of First State Indian Subcontinent 7,931,655 0.95
Employees Trust Fund Board 7,814,254 0.94
HSBC Intl. Nominees Ltd. - BPSS - BMO Invetments 11 (Ireland) Public Limited Company 7,312,763 0.88
Sub total 571,747,506 68.68
Other Shareholders 260,767,753 31.32
Total 832,515,259 100.00
Percentage of public holding as as at March 31, 2016 - 99.63%
Number of shareholders representing public holding as as at March 31, 2016 - 9,768
Twenty largest non-voting shareholders as as at March 31, 2016
Name of the Shareholder No. of Shares %
Employees Trust Fund Board 4,167,636 7.28
HSBC Intl. Nominees Ltd. - JPMLU- Franklin Templeton Investment Funds 3,309,627 5.78
CITY Bank NY S/A Forward International Dividend Fund 1,802,572 3.15
GF Capital Global Limited 1,591,203 2.78
HINL - JPMCB - Butterfield Trust (Bermuda) Ltd. 1,419,594 2.48
CITY Bank Newyork S/A Norges Bank Account No.02 1,286,146 2.25
Mr. J. D. Bandaranayake 1,102,959 1.93
Waldock Mackenzie Ltd / Mr. S.N.P. Palihena and Mrs. A.S. Palihena 1,016,216 1.78
M.J.F.Exports Ltd. 978,724 1.71
Mr. M. F. Hashim 800,417 1.40
Saboor Chatoor (Pvt) Ltd 780,454 1.36
Beta Holdings Limited 740,792 1.29
Mrs. L. V. C. Samarasinha 617,624 1.08
Union Assurance PLC - A/C 01AC 581,706 1.02
Akbar Brothers (Pvt) Ltd. A/C No.01 576,809 1.01
Dr. A. K. A. Jayawardena 505,035 0.88
Mr. G. R. Mallawaaratchy & Mrs. B. G. P. Mallawaaratchy (Joint) 479,764 0.84
Mr. J. G. de Mel 467,539 0.82
Mr. W.R.H. Perera 452,051 0.79
Alpex Marine (Pvt) Ltd 430,605 0.75
Sub total 23,107,473 40.39
Other Shareholders 34,105,180 59.61
Total 57,212,653 100.00
Percentage of public holding as as at March 31, 2016 - 99.79%
Number of shareholders representing public holding as as at March 31, 2016 - 4,223
Directors' holding in shares as as at March 31, 2016
Name of Director
Voting Non-voting
Mr.K.G.D.D. Dheerasinghe - Chairman 21,159 -
Mr.M.P. Jayawardena - Deputy Chairman - -
Mr.J. Durairatnam - Managing Director/Chief Executive Officer 417,989 -
Mr.S. Renganathan 194,699 10,488
Mr.S. Swarnajothi - 8,738
Mr.H.J. Wilson - -
Prof. A.K.W. Jayawardane - -
Mr. K. Dharmasiri - -
SHAREHOLDERS' INFORMATION
No. of Shares
16
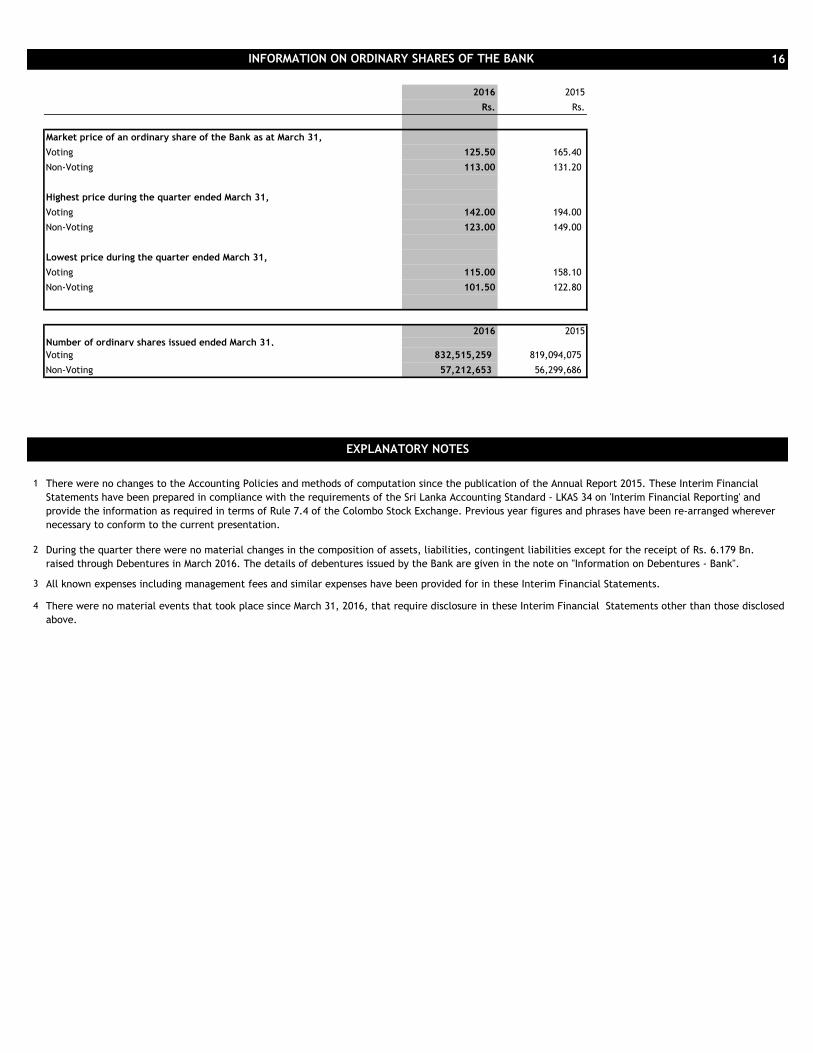
2016 2015
Rs. Rs.
Market price of an ordinary share of the Bank as at March 31,
Voting 125.50 165.40
Non-Voting 113.00 131.20
Highest price during the quarter ended March 31,
Voting 142.00 194.00
Non-Voting 123.00 149.00
Lowest price during the quarter ended March 31,
Voting 115.00 158.10
Non-Voting 101.50 122.80
2016 2015
Number of ordinary shares issued ended March 31,
Voting 832,515,259 819,094,075
Non-Voting 57,212,653 56,299,686
1
2
3
4 There were no material events that took place since March 31, 2016, that require disclosure in these Interim Financial Statements other than those disclosed
above.
INFORMATION ON ORDINARY SHARES OF THE BANK
There were no changes to the Accounting Policies and methods of computation since the publication of the Annual Report 2015. These Interim Financial
Statements have been prepared in compliance with the requirements of the Sri Lanka Accounting Standard - LKAS 34 on 'Interim Financial Reporting' and
provide the information as required in terms of Rule 7.4 of the Colombo Stock Exchange. Previous year figures and phrases have been re-arranged wherever
necessary to conform to the current presentation.
All known expenses including management fees and similar expenses have been provided for in these Interim Financial Statements.
During the quarter there were no material changes in the composition of assets, liabilities, contingent liabilities except for the receipt of Rs. 6.179 Bn.
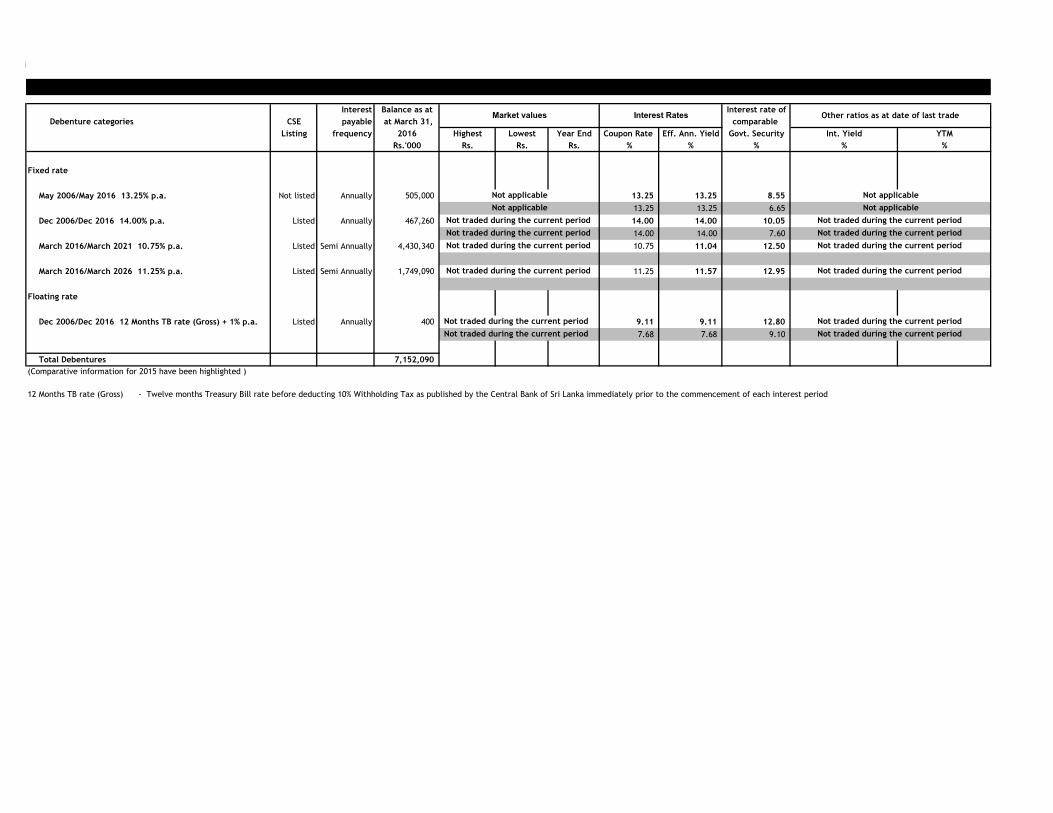
raised through Debentures in March 2016. The details of debentures issued by the Bank are given in the note on "Information on Debentures - Bank".
EXPLANATORY NOTES
17
Interest Balance as at Interest rate of
Debenture categories CSE payable at March 31, comparable
Listing frequency 2016 Highest Lowest Year End Coupon Rate Eff. Ann. Yield Govt. Security Int. Yield YTM
Rs.'000 Rs. Rs. Rs. % % % % %
Fixed rate
May 2006/May 2016 13.25% p.a. Not listed Annually 505,000 13.25 13.25 8.55
13.25 13.25 6.65
Dec 2006/Dec 2016 14.00% p.a. Listed Annually 467,260 14.00 14.00 10.05
14.00 14.00 7.60
March 2016/March 2021 10.75% p.a. Listed Semi Annually 4,430,340 10.75 11.04 12.50
March 2016/March 2026 11.25% p.a. Listed Semi Annually 1,749,090 11.25 11.57 12.95
Floating rate
Dec 2006/Dec 2016 12 Months TB rate (Gross) + 1% p.a. Listed Annually 400 9.11 9.11 12.80
7.68 7.68 9.10
Total Debentures 7,152,090
(Comparative information for 2015 have been highlighted )
12 Months TB rate (Gross) - Twelve months Treasury Bill rate before deducting 10% Withholding Tax as published by the Central Bank of Sri Lanka immediately prior to the commencement of each interest period
Not applicable
Not applicable
INFORMATION ON DEBENTURES - BANK
Market values Interest Rates Other ratios as at date of last trade
Not applicable
Not applicable
Not traded during the current period Not traded during the current period
Not traded during the current period Not traded during the current period
Not traded during the current period Not traded during the current period
Not traded during the current period Not traded during the current period
Not traded during the current period
Not traded during the current period
Not traded during the current period
Not traded during the current period
18
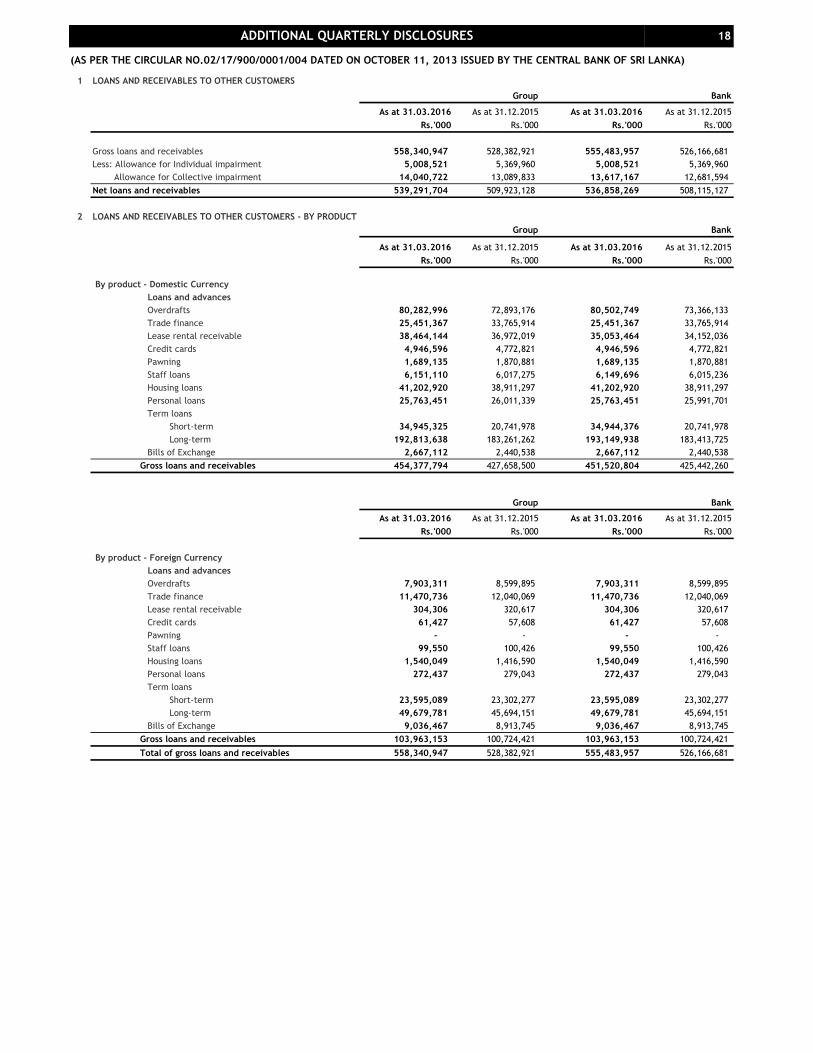
(AS PER THE CIRCULAR NO.02/17/900/0001/004 DATED ON OCTOBER 11, 2013 ISSUED BY THE CENTRAL BANK OF SRI LANKA)
1 LOANS AND RECEIVABLES TO OTHER CUSTOMERS - -
Group Bank
As at 31.03.2016 As at 31.12.2015 As at 31.03.2016 As at 31.12.2015
Rs.'000 Rs.'000 Rs.'000 Rs.'000
Gross loans and receivables 558,340,947 528,382,921 555,483,957 526,166,681
Less: Allowance for Individual impairment 5,008,521 5,369,960 5,008,521 5,369,960
Allowance for Collective impairment 14,040,722 13,089,833 13,617,167 12,681,594
Net loans and receivables 539,291,704 509,923,128 536,858,269 508,115,127
2 LOANS AND RECEIVABLES TO OTHER CUSTOMERS - BY PRODUCT
Group Bank
As at 31.03.2016 As at 31.12.2015 As at 31.03.2016 As at 31.12.2015
Rs.'000 Rs.'000 Rs.'000 Rs.'000
By product - Domestic Currency
Loans and advances
OD Overdrafts 80,282,996 72,893,176 80,502,749 73,366,133
Category2 Trade finance 25,451,367 33,765,914 25,451,367 33,765,914
Category8 Lease rental receivable 38,464,144 36,972,019 35,053,464 34,152,036
Credit cards 4,946,596 4,772,821 4,946,596 4,772,821
Category4 Pawning 1,689,135 1,870,881 1,689,135 1,870,881
Category6 Staff loans 6,151,110 6,017,275 6,149,696 6,015,236
Category5 Housing loans 41,202,920 38,911,297 41,202,920 38,911,297
Category3 Personal loans 25,763,451 26,011,339 25,763,451 25,991,701
Term loans
Category9 Short-term 34,945,325 20,741,978 34,944,376 20,741,978
Category10 Long-term 192,813,638 183,261,262 193,149,938 183,413,725
Bills of Exchange 2,667,112 2,440,538 2,667,112 2,440,538
Gross loans and receivables 454,377,794 427,658,500 451,520,804 425,442,260
Group Bank
As at 31.03.2016 As at 31.12.2015 As at 31.03.2016 As at 31.12.2015
Rs.'000 Rs.'000 Rs.'000 Rs.'000
By product - Foreign Currency
Loans and advances
OD Overdrafts 7,903,311 8,599,895 7,903,311 8,599,895
Category2 Trade finance 11,470,736 12,040,069 11,470,736 12,040,069
Category8 Lease rental receivable 304,306 320,617 304,306 320,617
Credit cards 61,427 57,608 61,427 57,608
Pawning - - - -
Category6 Staff loans 99,550 100,426 99,550 100,426
Category5 Housing loans 1,540,049 1,416,590 1,540,049 1,416,590
Category3 Personal loans 272,437 279,043 272,437 279,043
Term loans
Category9 Short-term 23,595,089 23,302,277 23,595,089 23,302,277
Category10 Long-term 49,679,781 45,694,151 49,679,781 45,694,151
Bills of Exchange 9,036,467 8,913,745 9,036,467 8,913,745
Gross loans and receivables 103,963,153 100,724,421 103,963,153 100,724,421
Total of gross loans and receivables 558,340,947 528,382,921 555,483,957 526,166,681
ADDITIONAL QUARTERLY DISCLOSURES
19
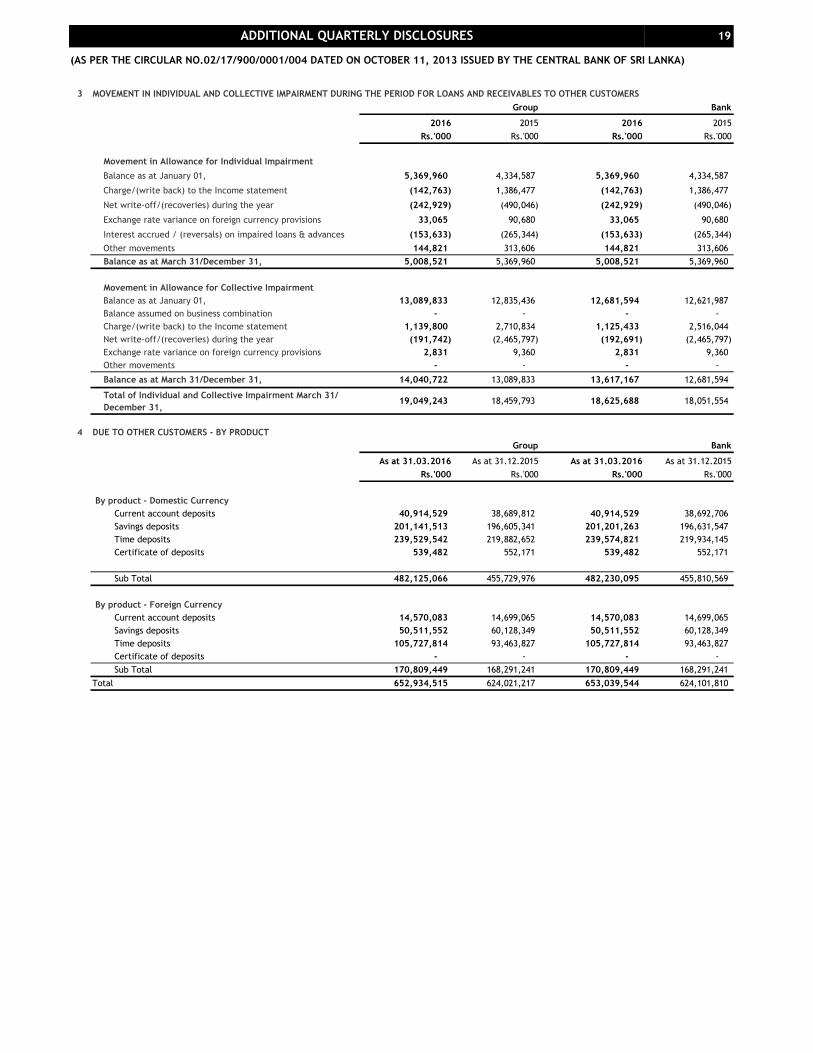
(AS PER THE CIRCULAR NO.02/17/900/0001/004 DATED ON OCTOBER 11, 2013 ISSUED BY THE CENTRAL BANK OF SRI LANKA)
3 MOVEMENT IN INDIVIDUAL AND COLLECTIVE IMPAIRMENT DURING THE PERIOD FOR LOANS AND RECEIVABLES TO OTHER CUSTOMERS
Group Bank
2016 2015 2016 2015
Rs.'000 Rs.'000 Rs.'000 Rs.'000
Movement in Allowance for Individual Impairment
Balance as at January 01, 5,369,960 4,334,587 5,369,960 4,334,587
Charge/(write back) to the Income statement (142,763) 1,386,477 (142,763) 1,386,477
Net write-off/(recoveries) during the year (242,929) (490,046) (242,929) (490,046)
Exchange rate variance on foreign currency provisions 33,065 90,680 33,065 90,680
Interest accrued / (reversals) on impaired loans & advances (153,633) (265,344) (153,633) (265,344)
Other movements 144,821 313,606 144,821 313,606
Balance as at March 31/December 31, 5,008,521 5,369,960 5,008,521 5,369,960
Movement in Allowance for Collective Impairment
Balance as at January 01, 13,089,833 12,835,436 12,681,594 12,621,987
Balance assumed on business combination - - - -
Charge/(write back) to the Income statement 1,139,800 2,710,834 1,125,433 2,516,044
Net write-off/(recoveries) during the year (191,742) (2,465,797) (192,691) (2,465,797)
Exchange rate variance on foreign currency provisions 2,831 9,360 2,831 9,360
Other movements - - - -
Balance as at March 31/December 31, 14,040,722 13,089,833 13,617,167 12,681,594
Total of Individual and Collective Impairment March 31/
December 31,19,049,243 18,459,793 18,625,688 18,051,554
4 DUE TO OTHER CUSTOMERS - BY PRODUCT
Group Bank
As at 31.03.2016 As at 31.12.2015 As at 31.03.2016 As at 31.12.2015
Rs.'000 Rs.'000 Rs.'000 Rs.'000
By product - Domestic Currency
Current account deposits 40,914,529 38,689,812 40,914,529 38,692,706
Savings deposits 201,141,513 196,605,341 201,201,263 196,631,547
Time deposits 239,529,542 219,882,652 239,574,821 219,934,145
Certificate of deposits 539,482 552,171 539,482 552,171
Sub Total 482,125,066 455,729,976 482,230,095 455,810,569
By product - Foreign Currency
Current account deposits 14,570,083 14,699,065 14,570,083 14,699,065
Savings deposits 50,511,552 60,128,349 50,511,552 60,128,349
Time deposits 105,727,814 93,463,827 105,727,814 93,463,827
Certificate of deposits - - - -
Sub Total 170,809,449 168,291,241 170,809,449 168,291,241
Total 652,934,515 624,021,217 653,039,544 624,101,810
ADDITIONAL QUARTERLY DISCLOSURES
20
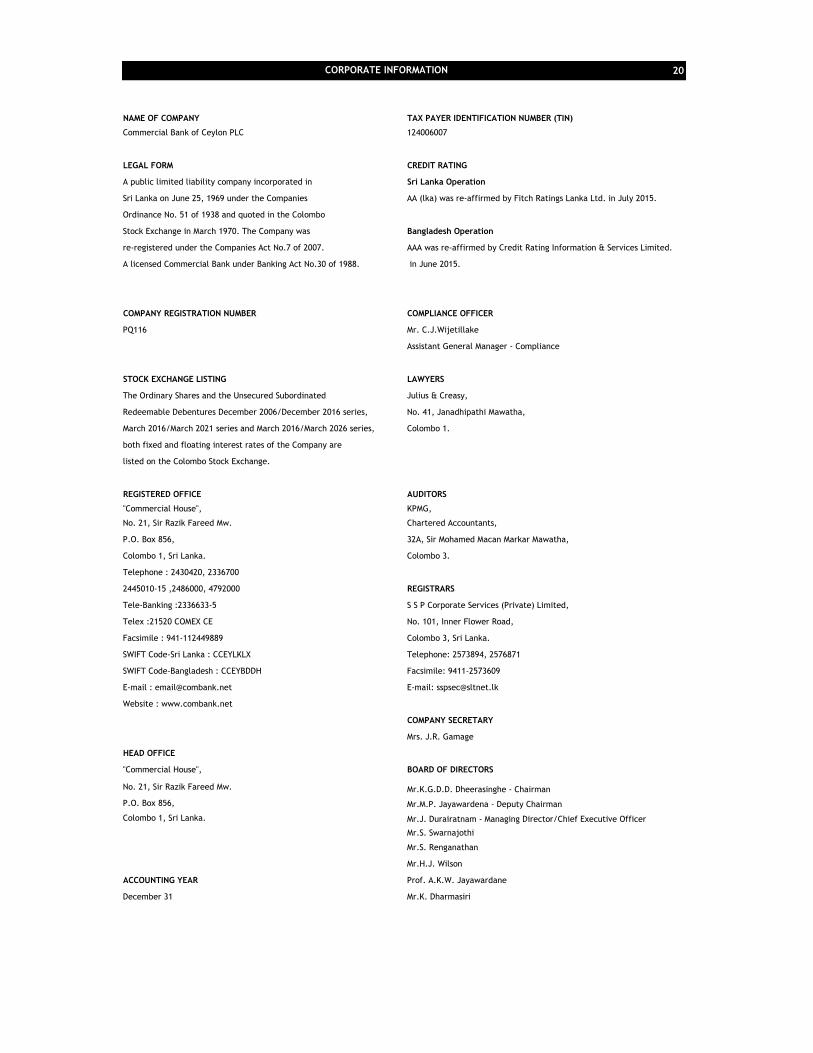
NAME OF COMPANY TAX PAYER IDENTIFICATION NUMBER (TIN)
Commercial Bank of Ceylon PLC 124006007
LEGAL FORM CREDIT RATING
A public limited liability company incorporated in Sri Lanka Operation
Sri Lanka on June 25, 1969 under the Companies AA (lka) was re-affirmed by Fitch Ratings Lanka Ltd. in July 2015.
Ordinance No. 51 of 1938 and quoted in the Colombo
Stock Exchange in March 1970. The Company was Bangladesh Operation
re-registered under the Companies Act No.7 of 2007. AAA was re-affirmed by Credit Rating Information & Services Limited.
A licensed Commercial Bank under Banking Act No.30 of 1988. in June 2015.
COMPANY REGISTRATION NUMBER COMPLIANCE OFFICER
PQ116 Mr. C.J.Wijetillake
Assistant General Manager - Compliance
STOCK EXCHANGE LISTING LAWYERS
The Ordinary Shares and the Unsecured Subordinated Julius & Creasy,
Redeemable Debentures December 2006/December 2016 series, No. 41, Janadhipathi Mawatha,
March 2016/March 2021 series and March 2016/March 2026 series, Colombo 1.
both fixed and floating interest rates of the Company are
listed on the Colombo Stock Exchange.
REGISTERED OFFICE AUDITORS
"Commercial House", KPMG,
No. 21, Sir Razik Fareed Mw. Chartered Accountants,
P.O. Box 856, 32A, Sir Mohamed Macan Markar Mawatha,
Colombo 1, Sri Lanka. Colombo 3.
Telephone : 2430420, 2336700
2445010-15 ,2486000, 4792000 REGISTRARS
Tele-Banking :2336633-5 S S P Corporate Services (Private) Limited,
Telex :21520 COMEX CE No. 101, Inner Flower Road,
Facsimile : 941-112449889 Colombo 3, Sri Lanka.
SWIFT Code-Sri Lanka : CCEYLKLX Telephone: 2573894, 2576871
SWIFT Code-Bangladesh : CCEYBDDH Facsimile: 9411-2573609
E-mail : [email protected] E-mail: [email protected]
Website : www.combank.net
COMPANY SECRETARY
Mrs. J.R. Gamage
HEAD OFFICE
"Commercial House", BOARD OF DIRECTORS
No. 21, Sir Razik Fareed Mw. Mr.K.G.D.D. Dheerasinghe - Chairman
P.O. Box 856, Mr.M.P. Jayawardena - Deputy Chairman
Colombo 1, Sri Lanka. Mr.J. Durairatnam - Managing Director/Chief Executive Officer
Mr.S. Swarnajothi
Mr.S. Renganathan
Mr.H.J. Wilson
ACCOUNTING YEAR Prof. A.K.W. Jayawardane
December 31 Mr.K. Dharmasiri
CORPORATE INFORMATION