improving engine utilization on dp drilling...
TRANSCRIPT
Author’s Name Name of the Paper Session
DYNAMIC POSITIONING CONFERENCE September 16-17, 2003
Power Plant
Improving Engine Utilization on DP Drilling Vessels
John J. May, PE
Transocean Offshore Deepwater Drilling Inc. (Houston)
John J. May, PE, Transocean Improving Engine Utilization on DP Drilling Vessels
DP Conference Houston September 16-17, 2003 Page 1
Improving Engine Utilization on DP Drilling Vessels
1. Introduction A system has been developed in conjunction with the thruster drive supplier to phase back the thruster drive current in 300 to 500 milliseconds by sensing the system frequency. This customized modification is referred to as a frequency dependent power phase back, and commonly referred to as frequency spillover, (FSO). For a sudden loss of an on-line engine, this software solution can reduce system load fast enough to avoid blackout. This “buys time” to start and synchronize the next standby generator set. Initially thruster power is reduced below the DP command, but when additional generation is added (normal time is 20 to 35 seconds) the desired vessel position can be regained. Most of the existing DP drilling vessels today do not have features in their power management system for the fast (in less than 1.5 seconds) reductions of load to prevent system blackouts. To compensate additional engines must be on-line for the unexpected loss of an engine/generator set. Of course the additional on-line engine, decreases the engine utilization rate. The installation of a frequency sensitive, thruster fast phase-back system was installed and tested on the three “Enterprise Class” dynamically positioned drillships. Results of these installations produced very dramatic results; i.e., improved engine utilization, reduced total engine hours, reduced overall fuel usage, and provided some reductions in engine emissions. As a by-product of the fast phase-back modification, several of the existing power management system parameters were altered for compatibility as detailed below. • Modifications to the load dependent start tables, • An additional algorithm was added for the load dependent start table to handle different
size engines for two engine operations, • Addition of a low pass filter in the PMS which is active on the DP thruster speed
commands only when synchronizing, and • Engine load ramp times coordinated with availability of power to the DP system. For the 11 kV switchboard bus tie circuit breakers, instantaneous over current relays from each main ac generator, were installed and connected to trip either the Port or Starboard tie circuit breakers. This enables opening the ties in less than 160 milliseconds for any 11 kV three phase or phase to phase fault. This feature will electrically separate the Port and Starboard switchboards before the thruster shutdown. This allows operation with closed bus ties, yet retains the continuity feature of operating with an open tie breakers for three phase and phase to phase faults on the 11 kV system. System operation with closed tie breakers has the additional advantage of doubling the capacity of the on-line system which makes the system more robust and capable of handling and/or riding through system faults. All the above alteration/modifications contribute to making the power system more robust, blackout resistant, and conducive to improved engine utilization.
John J. May, PE, Transocean Improving Engine Utilization on DP Drilling Vessels
DP Conference Houston September 16-17, 2003 Page 2
Table Of Contents
1. INTRODUCTION............................................................................................................................. 1
2. POWER MANAGEMENT SYSTEM ................................................................................................ 3 2.1. CAUSES OF BLACKOUTS.............................................................................................................. 3 2.2. AVOIDING BLACKOUTS - FAST PHASE BACK SYSTEM ..................................................................... 5
3. APPLYING A FREQUENCY SENSITIVE - FAST PHASE BACK SYSTEM (FPBS)...................... 6
4. THRUSTER FREQUENCY SPILLOVER DESIGN.......................................................................... 8
5. APPLICATION OF THE FREQUENCY SENSITIVE - FAST PHASE BACK SYSTEM .................. 8 5.1. LOAD ANALYSIS.......................................................................................................................... 9 5.2. AVOIDING BLACKOUTS AND EFFECTS OF MULTIPLE ENGINES ........................................................10 5.3. LOAD DEPENDENT START TABLE ................................................................................................11
6. FREQUENCY SPILLOVER – TEST TRENDS...............................................................................14
7. ADVANTAGES - FREQUENCY SPILLOVER AND RELATED PMS MODIFICATIONS...............19 7.1. REDUCE ENGINE HOURS............................................................................................................19 7.2. WARTSILA EMISSION REPORT.....................................................................................................20
8. CONCLUSIONS AND FUTURE PROJECTS ................................................................................21
John J. May, PE, Transocean Improving Engine Utilization on DP Drilling Vessels
DP Conference Houston September 16-17, 2003 Page 3
2. Power Management System Power Management is defined as control of the power generation and distribution system to assure adequate and reliable electrical power is continuously available for the thrusters, drilling, marine, and hotel loads. The power management system starts/stops, and synchronizes the main generator sets in response to the system loading with the objective of preventing blackouts while minimizing the number of on-line generator sets. The fast phase back or “frequency spillover” should be an integral part of the PMS in any newly designed system. Proper operation of the power management system on a dynamic positioned vessel is essential to keeping the dynamic positioned vessel on location without disconnect and to assure the safe, reliable, and economical operation of the power plant. For these reasons, the power management system on such vessel must be understandable, reliable, and effective for operators, crew, and supervisors. The power management system must keep operations personnel informed about the condition of the electrical power system and should act promptly and effectively to prevent or correct situations which may lead to an electrical blackout. To prevent blackouts, it is important to understand how they may occur.
2.1. Causes of Blackouts Blackouts in electrical power systems are caused by short circuits and / or overloads. Short circuit protection of the power systems is provided by the proper selection and application of circuit breakers and protective devices. Proper selection and setting of these devices is required to obtain a selective coordinated system, which will isolate the faulty circuit and minimize the damage at the fault point. Overloads occur when electrical demand exceeds electrical capacity. In a DP vessel installation, all electrical power is generated on site (as opposed to depending upon an electrical utility for energy). The operators can control (within limits) both, the electrical supply and demand. So long as the system has been designed with sufficient electrical capacity, (enough generating capacity to meet the anticipated demands), avoiding blackouts due to overloads becomes a matter of assuring the system demands are not allowed to exceed the capacity of the on-line generators. Some blackouts occur because fixed and variable loads increase, unchecked, until the capacity of the on-line engine/generators is exceeded. This type of blackout is a function of electrical demand. As demand increases, the engine/generator sets must supply more power until they reach and/or exceed their capacity. When an engine/generator exceeds its power capacity (kilowatts or kW) or its electrical capacity (amperes or KVA), the engine overheats or the generator produces excessive current. As soon as the first engine shuts down and the resulting circuit breaker trips, a cascade of shutdowns ripples through any other running engine/generator sets as they too become overloaded.
John J. May, PE, Transocean Improving Engine Utilization on DP Drilling Vessels
DP Conference Houston September 16-17, 2003 Page 4
The traditional power management system monitors the total energy demand and compares it to the available supply. The system can automatically start and stop generator sets to coincide with load changes in accordance with the pre-set load dependent start-stop tables. These power management system manages the number of engines on-line and handles most load changes and minor power system disturbances without problems. They also have the ability to reduce the DP requested thrust commands so overall load requests do not exceed the available power. These load reduction systems have lag times ranging from 2 to 7 seconds. The more severe power system disturbance occurs when an engine/generator set is unexpectedly shut down without warning. The total load is transferred to the remaining generator or generators. The consequence is a sudden increase in load to the remaining system. Hence, if the remaining generator or generators are overloaded and no action is immediately taken to reduce the generator load, the power system will experience a blackout. For example, if only two generator sets are operating at 70% load, a generator trip results in remaining generator having a load of 140%. The load must be reduced very quickly to within the capabilities of the engine/generator set to avoid a blackout. Experience has shown for a 5 - 7 megawatt diesel operating at 720 rpm with a load of 140%, the load must be reduced to within the engine capacity in less than 1 - 2 seconds to avoid bogging the engine down with a resulting blackout. For smaller generator sets (4.4 megawatt) operating at a higher speed (900 rpm, less inertia), the time for power reduction is less. The most common types of faults, which cause a generator set to shutdown, are: • fuel system failures (clogged fuel lines, fuel pump failure, water in the fuel), • mechanical failures (loss of oil pressure, over speed), • control system failures (false indication of low lube oil pressure, false oil mist detectors,
crankcase overpressure), or loss of an I/O signal, or • operator / human error - usually occurs in the set-up and synchronizing of generator
sets. These types of shutdowns are much more difficult to avoid than the type caused by the longer term overloading. The unexpected generator trip can require load reduction of the power system in less than 1 second.
John J. May, PE, Transocean Improving Engine Utilization on DP Drilling Vessels
DP Conference Houston September 16-17, 2003 Page 5
2.2. Avoiding Blackouts - Fast Phase Back System The traditional method of avoiding electrical blackouts in non-process industries has been to automatically shed non-essential electrical loads as demand approached capacity. With these systems, entire loads or groups of loads are abruptly taken off-line by simply tripping their supply circuit breaker(s). After the power disturbances have subsided and the power system has been stabilized, the loads are manually reconnected by closing their circuit breakers and re-energizing the loads.
On a DP vessel with a drilling system, the majority of the hotel and marine loads are small and the drilling and propulsion loads vary over such a wide range, no block load shedding is feasible. In general, the loads on the DP drilling vessels consist of:
• Hotel and accommodations 1.5 to 2.5 MW
• Marine auxiliaries .5 to 1.0 MW
• Drilling auxiliaries .5 to 1.5 MW
• Drilling drives 0 to 5.0 MW
• Thruster drives 1.0 to 30 MW
On a large DP vessel operating in a mild Gulf of Mexico environment, the total operating loads vary from a low of 5.5 MW to a high of 9.5 MW. The hotel and accommodations is the largest block of continuous load. This consists primarily of HVAC, galley, lighting and distribution systems. Because of the continuous operation of these hotel and accommodations services, this load is considered essential services and not a candidate for load shedding.
The marine and drilling auxiliaries are made up of many small loads, normally the largest single load being in the 100-hp range or smaller. Because of the load magnitude and quantity, these loads are not good candidates for load shedding.
The thruster and drilling drives on these fifth generation DP vessels are microprocessor controlled and have solid-state power conversion devices. This allows for quick current and power changes.
While the total installed thruster loads may total up to 30 MW, 95% of the time the thruster loads vary between 1.0 to 3.0 MW for a typical Gulf of Mexico environment. The thruster loads do have the capability of making large power swings; therefore, they are the best candidates for the fast phase back to prevent blackout.
The loads on the drilling drives can vary between 0 to a maximum of 5.0 MW depending upon the specific operation with an average of about 2.0 MW. The drilling drives are also used for the fast phase back of loads to prevent blackout.

John J. May, PE, Transocean Improving Engine Utilization on DP Drilling Vessels
DP Conference Houston September 16-17, 2003 Page 6
3. Applying a Frequency Sensitive - Fast Phase Back System (FPBS) The existing DP and PMS systems sense the power system parameters, (amperes, volts, frequency, kW, and KVAR) in the 11 kV switchboards. These signals are hardwired to the PMS process station, (PS). The PMS PS performs computations and transmits this data via Ethernet to the DP Controller. The DP controller calculates the revised thruster speed signals and transmits these via Ethernet to the thruster process stations. The six thruster process stations convert these signals to analogs. These analog signals are hardwired to the Thruster PLC. The time required for the DP and PMS to calculate a thruster load limit and transmit it to the Thruster PLC is 1 to 2 seconds. (See Figure 1 below.) The time it takes a thruster to reduce power from receipt of this decreased speed signal is 2-3 seconds. Testing has shown the systems response varied from 3 to 6 seconds.
Figure 1 - Thruster Load Limit Delay With the frequency sensitive – fast thruster phase back modification, the system frequency is sensed directly by each of the six thruster PLC controllers. (See the schematic in Figure 2 below.) There is no lag time for computations or transmission of data. When the system frequency dips in the 58 to 55 hertz range, the FPBS system is initiated. Testing has shown the power reduction in the thruster motor occurs in 300 to 500 milliseconds after the frequency drops below the 58 hertz threshold.
SwitchboardSwitchboardTransducersTransducers
PMSPMSProcessProcessStationStation
ThrusterThrusterProcessProcessStationStation
Other ThrusterOther ThrusterProcessProcessStationsStations
OperatorOperatorStationStation
ThrusterThrusterControlControl
PPLLCC
Ethernet
AnalogSignals
(Hardwired)Ethernet
Time delay = 1- 2 seconds
AnalogSignal
(Hardwired)
DPCDPC
John J. May, PE, Transocean Improving Engine Utilization on DP Drilling Vessels
DP Conference Houston September 16-17, 2003 Page 7
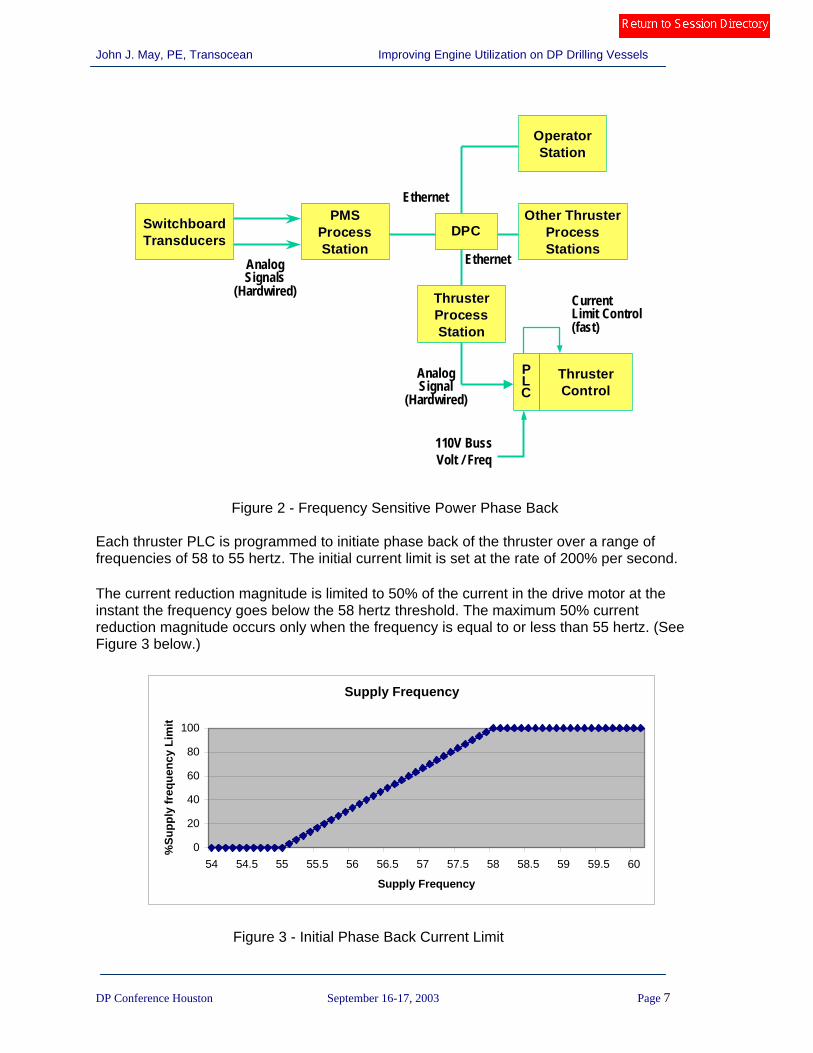
Figure 2 - Frequency Sensitive Power Phase Back Each thruster PLC is programmed to initiate phase back of the thruster over a range of frequencies of 58 to 55 hertz. The initial current limit is set at the rate of 200% per second. The current reduction magnitude is limited to 50% of the current in the drive motor at the instant the frequency goes below the 58 hertz threshold. The maximum 50% current reduction magnitude occurs only when the frequency is equal to or less than 55 hertz. (See Figure 3 below.)
Supply Frequency
0
20
40
60
80
100
54 54.5 55 55.5 56 56.5 57 57.5 58 58.5 59 59.5 60
Supply Frequency
%Su
pply
freq
uenc
y Li
mit
Figure 3 - Initial Phase Back Current Limit
PMSPMSProcessProcessStationStation
Other ThrusterOther ThrusterProcessProcessStationsStations
OperatorOperatorStationStation
ThrusterThrusterControlControl
PPLLCC
Ethernet
Ethernet
CurrentLimit Control(fast)
SwitchboardSwitchboardTransducersTransducers
ThrusterThrusterProcessProcessStationStation
AnalogSignals
(Hardwired)
AnalogSignal
(Hardwired)
110V BussVolt / Freq
DPC
John J. May, PE, Transocean Improving Engine Utilization on DP Drilling Vessels
DP Conference Houston September 16-17, 2003 Page 8
Should the initial frequency only dip to 56.5 hertz, the current limit would be 50% * 50% = 25 % of the initial current when the frequency dips below 58 hertz. The time delay to obtain and process the power management data to the thruster drive is ~1 - 2 seconds. The time for the thruster to process the reduced speed command from the DP controller is ~ 2 - 3 seconds, making the total time for current reduction ~ 3 - 5 seconds. With the thruster FPBS the network frequency can be sensed by the thruster PLC directly so the lag time is minimum. The drive output current will be clamped to this reduced value in 300 to 500 milliseconds. The initial current (power) phase back will be at the rate of 200% per second while the frequency is decreasing. After the frequency starts to increase as detected by the df/dt being positive, power to the thruster drive is allowed to increase. The increase rate is set at 5% per second until it equals 100%, and the spillover turns off or the frequency starts to drop again, as detected by df/dt becoming negative. If the frequency drop does not go below 55 hertz, the power in the drive will be reduced at the rate of 5% per second. Should the frequency drop below 55 hertz, a second major spillover will occur. Current limit will be recalculated based on an even lower value of drive current. The thruster drive manufacturer refers to the frequency sensitive – fast thruster phase back as “frequency spillover”.
4. Thruster Frequency Spillover Design The design of frequency spillover is unique for each different power and control system. After installation, it must be tuned to work in harmony with the major power system components and their response times. The principal influencing parameters for the thruster drive spillover are: • Engine /Generator size and speed • Thruster size and speed/ arrangement – “Z” drive or “Pod” type. • DP and power management system manufacturer • Engine governor system and its response times • Voltage regulation system and its response times After the drive software installation, the system is tested by operating the system with two engines on-line. Usually the hotel and marine loads with addition of thruster loads are used to obtain up to 75% generator set utilization. One engine is tripped off-line and the remaining engine must support the 150% load until the frequency spillover can reduce the overall loads to within one engine’s rating.
5. Application of the Frequency Sensitive - Fast Phase Back System The major power system components of the “Enterprise Class” vessels are:
John J. May, PE, Transocean Improving Engine Utilization on DP Drilling Vessels
DP Conference Houston September 16-17, 2003 Page 9
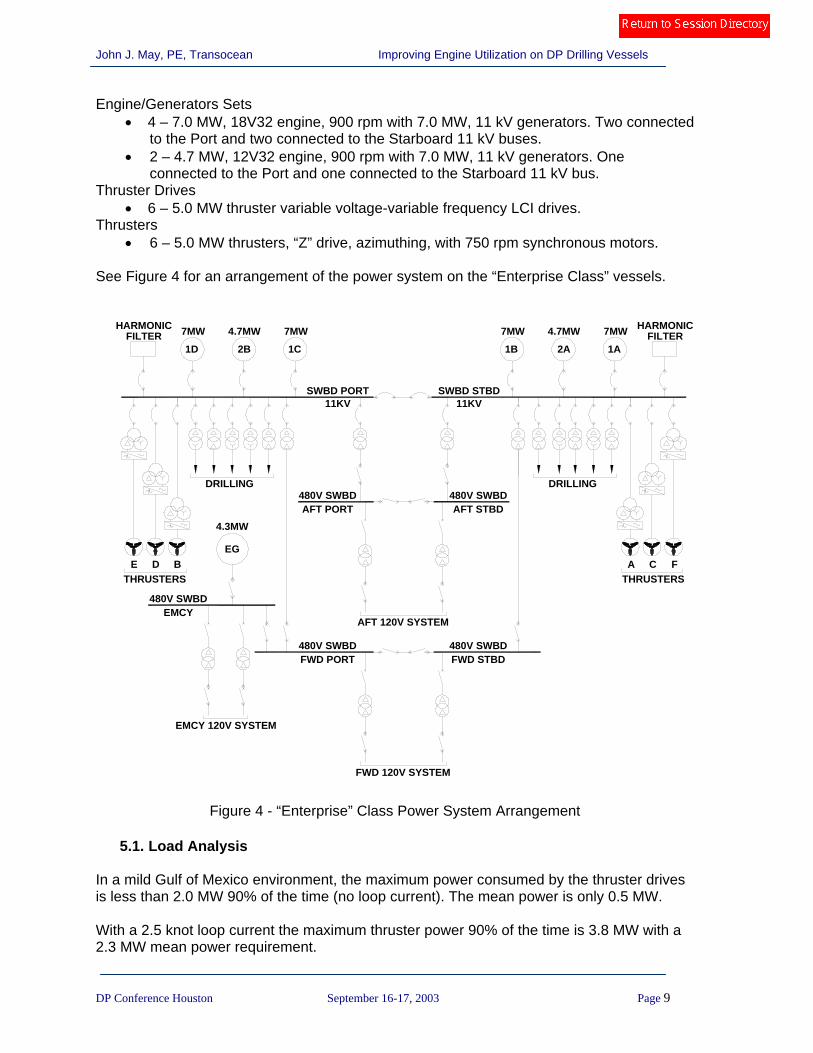
Engine/Generators Sets • 4 – 7.0 MW, 18V32 engine, 900 rpm with 7.0 MW, 11 kV generators. Two connected
to the Port and two connected to the Starboard 11 kV buses. • 2 – 4.7 MW, 12V32 engine, 900 rpm with 7.0 MW, 11 kV generators. One
connected to the Port and one connected to the Starboard 11 kV bus. Thruster Drives
• 6 – 5.0 MW thruster variable voltage-variable frequency LCI drives. Thrusters
• 6 – 5.0 MW thrusters, “Z” drive, azimuthing, with 750 rpm synchronous motors. See Figure 4 for an arrangement of the power system on the “Enterprise Class” vessels.
Figure 4 - “Enterprise” Class Power System Arrangement
5.1. Load Analysis In a mild Gulf of Mexico environment, the maximum power consumed by the thruster drives is less than 2.0 MW 90% of the time (no loop current). The mean power is only 0.5 MW. With a 2.5 knot loop current the maximum thruster power 90% of the time is 3.8 MW with a 2.3 MW mean power requirement.
D B
480V SWBDAFT PORT
SWBD PORT SWBD STBD
THRUSTERS
DRILLING
EG
4.3MW
E
1B 2A
7MW 4.7MW 7MW
1A
11KV 11KV
HARMONICFILTER
DRILLING
AFT STBD480V SWBD
AFT 120V SYSTEM
FWD 120V SYSTEM
480V SWBDFWD STBD
480V SWBDFWD PORT
EMCY 120V SYSTEM
7MW
1D 1C
7MW4.7MW
2BFILTER
HARMONIC
480V SWBDEMCY
FTHRUSTERSA C
John J. May, PE, Transocean Improving Engine Utilization on DP Drilling Vessels
DP Conference Houston September 16-17, 2003 Page 10
Without consideration of loop currents, the typical power requirements are: • Hotel Load 1.5 to 2.0 MW • Marine Auxiliaries 1.0 MW • Drilling Auxiliaries 1.0 MW • Drilling Drives 0 to 4.0 MW • Thruster Drives (mild environment) 0.5 to 2.0MW
This calculates to a 4.0 MW minimum to a maximum of 10 MW. Operating experience has confirmed these loads are correct 90% of the time.
5.2. Avoiding Blackouts and Effects of Multiple Engines As stated earlier, the most severe power system disturbance which causes a system to blackout is the sudden and unexpected loss of an engine under load. To develop a suitable test procedure for verifying a system’s blackout prevention capabilities, the effects of multiple engines operation needs to be understood. The formula for the system load increase with the loss of one engine is:
n/(n-1) = system load increase, where n = number of engine/generator sets on-line.
On these DP vessels, the minimum number of engine/generator sets on-line is 2. The system load increase with 2 engine/generator sets on-line with the loss of one generator set from the formula above is 200%. For 3 engine sets on-line and loss of 1 set the system load increase is 150%. For 4 engine sets on-line and loss of 1 set the system load increase is 133% For 5 engine sets on-line and loss of 1 set the system load increase is 125% From the above it can be deduced the more generator sets on-line, the less the effect of a sudden generator set loss. Therefore; the most severe test is to operate two engines at their maximum load as allowed by the systems load dependent start table and trip one generator set off-line. The DP power limiting system has the ability to limit per cent load based on the number of engines on-line. Theses setting are to be coordinated with 150% overload capabilities or: 2 engines on-line = 75% DP power limit 3 engines on-line = 86% DP power limit 4 engines on-line = 100% DP power limit 5 engines on-line = 100% DP power limit 6 engines on-line = 100% Dp power limit It should also be noted the 5th generation DP drilling vessel have large capacity generator sets, large enough that two or three generators sets can almost always carry the normal mild environmental loads.
John J. May, PE, Transocean Improving Engine Utilization on DP Drilling Vessels
DP Conference Houston September 16-17, 2003 Page 11
5.3. Load Dependent Start Table
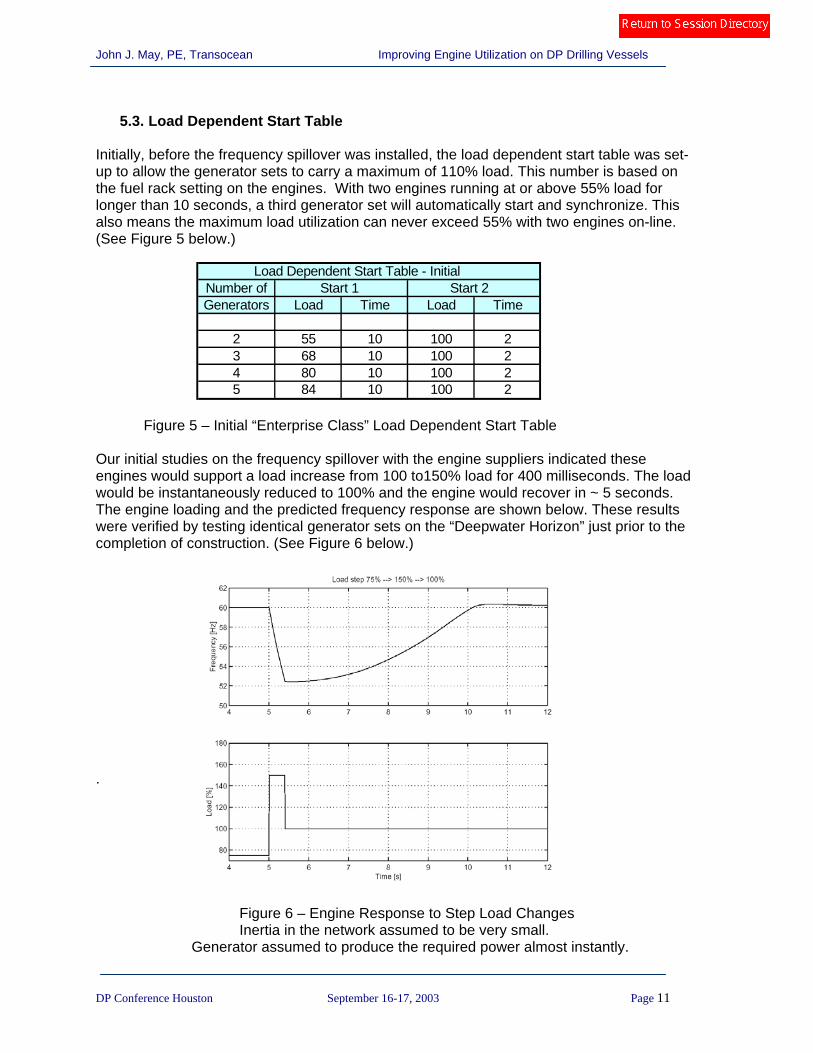
Initially, before the frequency spillover was installed, the load dependent start table was set-up to allow the generator sets to carry a maximum of 110% load. This number is based on the fuel rack setting on the engines. With two engines running at or above 55% load for longer than 10 seconds, a third generator set will automatically start and synchronize. This also means the maximum load utilization can never exceed 55% with two engines on-line. (See Figure 5 below.)
Figure 5 – Initial “Enterprise Class” Load Dependent Start Table
Our initial studies on the frequency spillover with the engine suppliers indicated these engines would support a load increase from 100 to150% load for 400 milliseconds. The load would be instantaneously reduced to 100% and the engine would recover in ~ 5 seconds. The engine loading and the predicted frequency response are shown below. These results were verified by testing identical generator sets on the “Deepwater Horizon” just prior to the completion of construction. (See Figure 6 below.) .
Figure 6 – Engine Response to Step Load Changes Inertia in the network assumed to be very small.
Generator assumed to produce the required power almost instantly.
Load Dependent Start Table - Initial Number of Start 1 Start 2Generators Load Time Load Time
2 55 10 100 23 68 10 100 24 80 10 100 25 84 10 100 2
John J. May, PE, Transocean Improving Engine Utilization on DP Drilling Vessels
DP Conference Houston September 16-17, 2003 Page 12
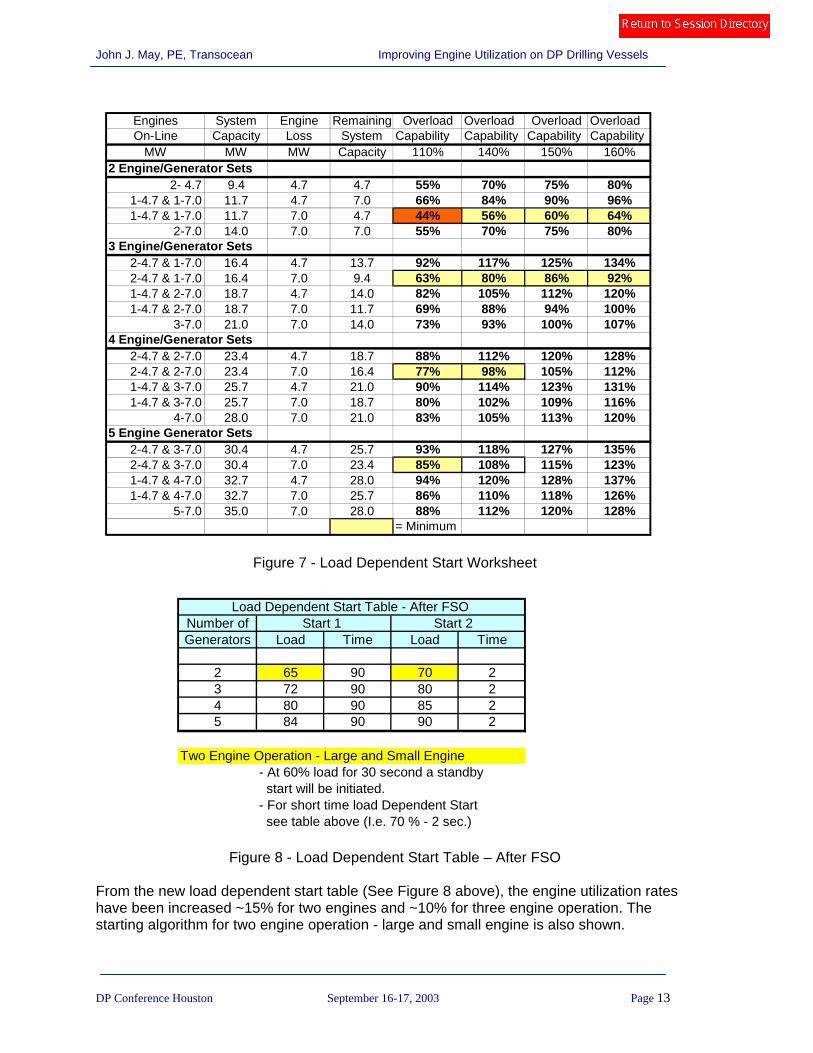
Based on the improved ability of the engines to support additional short time load increases with the FSO modification, a new load dependent start table is needed to define engine starting limits and improve overall engine utilization. A load dependent start “worksheet” was prepared to use as a guide to preparing the new start table. (See Figure 7 on the following page). Based on the engine capability to support the 150% load for 400 milliseconds, a new load dependent start table is prepared. Because the PMS does not have the ability to handle different sizes of engines, a special engine starting algorithm is developed for two engine operation using a large and a small engine. For the two engine operation with a large and small engine one must assume the large engine is lost. With both engines on-line and running, the system capacity is 11.7 MW. With the loss of the 7 MW generator set, the remaining on-line capacity is reduced to 40% of the initial on-line value. Using the 150% capability column, the 4.7 MW engine can sustain a load of 60% times the initial load of 11.7 = 150% of 4.7 MW or 7.05 MW. Based on the use of this worksheet, a revised load dependent start table was prepared to reflect the addition of the frequency spillover. Although tests were carried out at 75% load which supports the 150 % capability column for two generators, we chose to use the 140% column to complete the load dependent start table as a more conservative approach. Starting time for the engines were on the order of 15 seconds. The synchronizing time varied 7 to 20 seconds. Therefore; the total time for a standby engine start to synchronizing on-line was 22 to 35 seconds. These times were consistent on all three vessels.
John J. May, PE, Transocean Improving Engine Utilization on DP Drilling Vessels
DP Conference Houston September 16-17, 2003 Page 13
Figure 7 - Load Dependent Start Worksheet
Figure 8 - Load Dependent Start Table – After FSO
From the new load dependent start table (See Figure 8 above), the engine utilization rates have been increased ~15% for two engines and ~10% for three engine operation. The starting algorithm for two engine operation - large and small engine is also shown.
Load Dependent Start Table - After FSONumber of Start 1 Start 2Generators Load Time Load Time
2 65 90 70 23 72 90 80 24 80 90 85 25 84 90 90 2
Two Engine Operation - Large and Small Engine- At 60% load for 30 second a standby start will be initiated.- For short time load Dependent Start see table above (I.e. 70 % - 2 sec.)
Engines System Engine Remaining Overload Overload Overload OverloadOn-Line Capacity Loss System Capability Capability Capability Capability
MW MW MW Capacity 110% 140% 150% 160%2 Engine/Generator Sets
2- 4.7 9.4 4.7 4.7 55% 70% 75% 80%1-4.7 & 1-7.0 11.7 4.7 7.0 66% 84% 90% 96%1-4.7 & 1-7.0 11.7 7.0 4.7 44% 56% 60% 64%
2-7.0 14.0 7.0 7.0 55% 70% 75% 80%3 Engine/Generator Sets
2-4.7 & 1-7.0 16.4 4.7 13.7 92% 117% 125% 134%2-4.7 & 1-7.0 16.4 7.0 9.4 63% 80% 86% 92%1-4.7 & 2-7.0 18.7 4.7 14.0 82% 105% 112% 120%1-4.7 & 2-7.0 18.7 7.0 11.7 69% 88% 94% 100%
3-7.0 21.0 7.0 14.0 73% 93% 100% 107%4 Engine/Generator Sets
2-4.7 & 2-7.0 23.4 4.7 18.7 88% 112% 120% 128%2-4.7 & 2-7.0 23.4 7.0 16.4 77% 98% 105% 112%1-4.7 & 3-7.0 25.7 4.7 21.0 90% 114% 123% 131%1-4.7 & 3-7.0 25.7 7.0 18.7 80% 102% 109% 116%
4-7.0 28.0 7.0 21.0 83% 105% 113% 120%5 Engine Generator Sets
2-4.7 & 3-7.0 30.4 4.7 25.7 93% 118% 127% 135%2-4.7 & 3-7.0 30.4 7.0 23.4 85% 108% 115% 123%1-4.7 & 4-7.0 32.7 4.7 28.0 94% 120% 128% 137%1-4.7 & 4-7.0 32.7 7.0 25.7 86% 110% 118% 126%
5-7.0 35.0 7.0 28.0 88% 112% 120% 128%= Minimum
John J. May, PE, Transocean Improving Engine Utilization on DP Drilling Vessels
DP Conference Houston September 16-17, 2003 Page 14
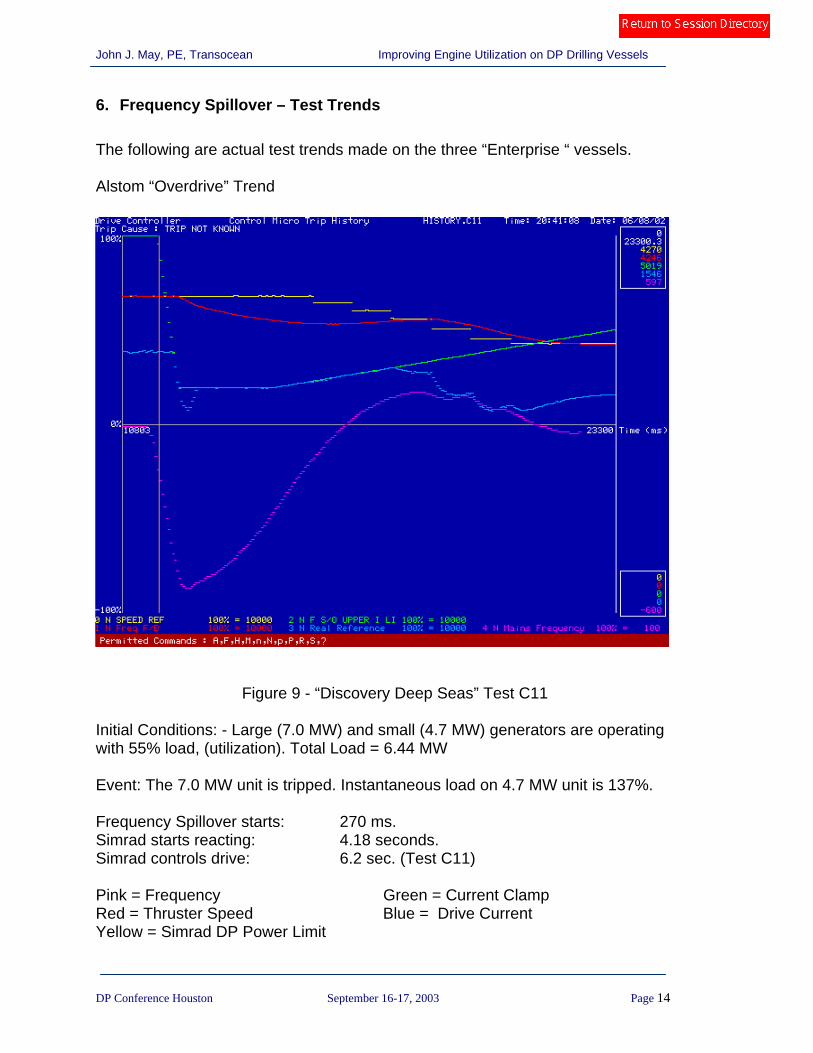
6. Frequency Spillover – Test Trends The following are actual test trends made on the three “Enterprise “ vessels. Alstom “Overdrive” Trend
Figure 9 - “Discovery Deep Seas” Test C11 Initial Conditions: - Large (7.0 MW) and small (4.7 MW) generators are operating with 55% load, (utilization). Total Load = 6.44 MW Event: The 7.0 MW unit is tripped. Instantaneous load on 4.7 MW unit is 137%. Frequency Spillover starts: 270 ms. Simrad starts reacting: 4.18 seconds. Simrad controls drive: 6.2 sec. (Test C11) Pink = Frequency Green = Current Clamp Red = Thruster Speed Blue = Drive Current Yellow = Simrad DP Power Limit
John J. May, PE, Transocean Improving Engine Utilization on DP Drilling Vessels
DP Conference Houston September 16-17, 2003 Page 15
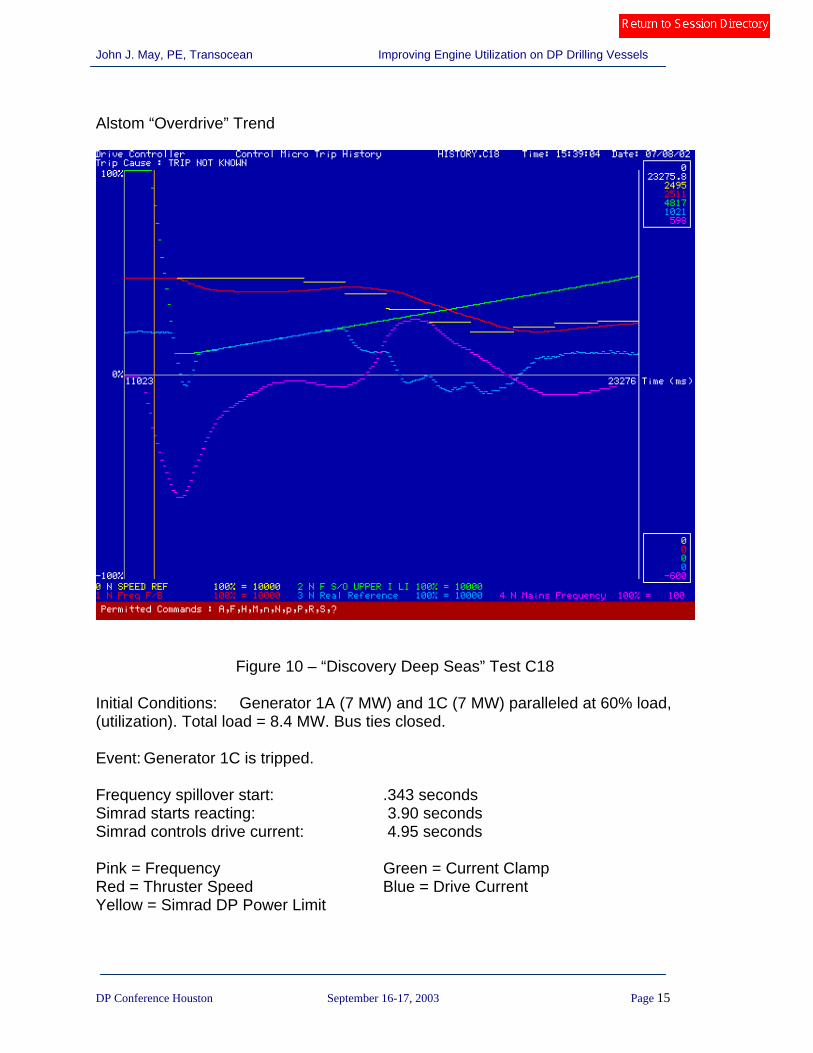
Alstom “Overdrive” Trend
Figure 10 – “Discovery Deep Seas” Test C18 Initial Conditions: Generator 1A (7 MW) and 1C (7 MW) paralleled at 60% load, (utilization). Total load = 8.4 MW. Bus ties closed. Event: Generator 1C is tripped. Frequency spillover start: .343 seconds Simrad starts reacting: 3.90 seconds Simrad controls drive current: 4.95 seconds Pink = Frequency Green = Current Clamp Red = Thruster Speed Blue = Drive Current Yellow = Simrad DP Power Limit
John J. May, PE, Transocean Improving Engine Utilization on DP Drilling Vessels
DP Conference Houston September 16-17, 2003 Page 16
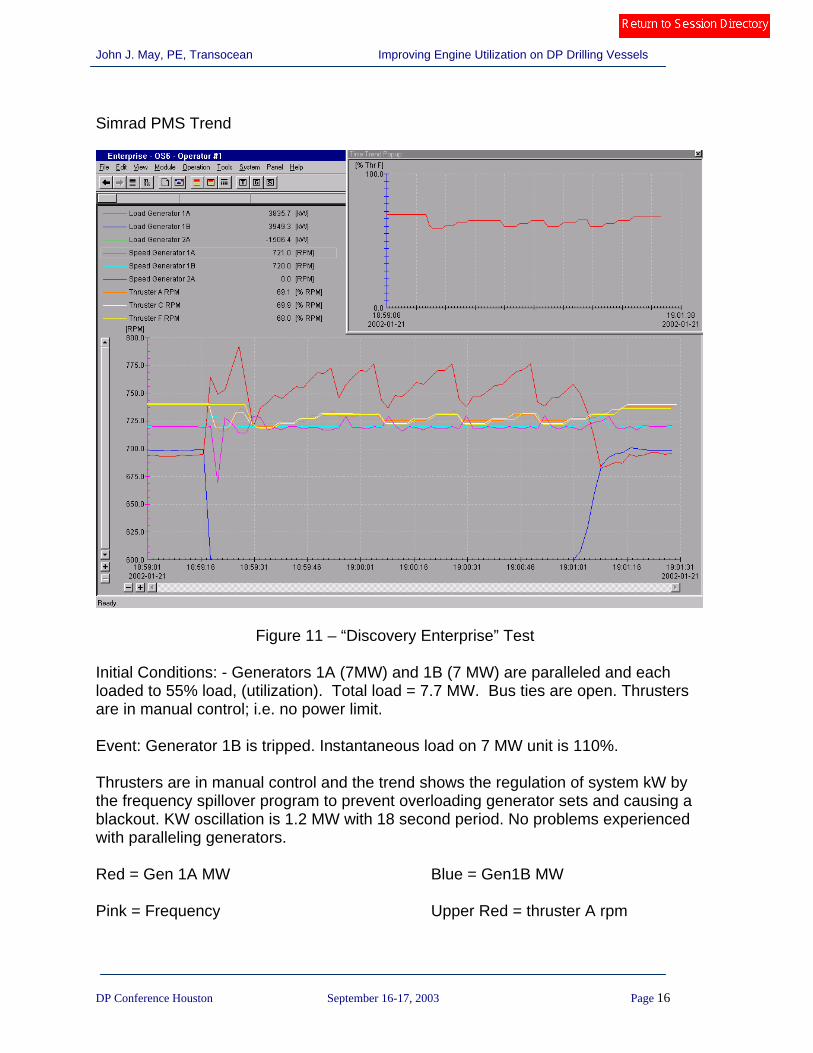
Simrad PMS Trend
Figure 11 – “Discovery Enterprise” Test Initial Conditions: - Generators 1A (7MW) and 1B (7 MW) are paralleled and each loaded to 55% load, (utilization). Total load = 7.7 MW. Bus ties are open. Thrusters are in manual control; i.e. no power limit. Event: Generator 1B is tripped. Instantaneous load on 7 MW unit is 110%. Thrusters are in manual control and the trend shows the regulation of system kW by the frequency spillover program to prevent overloading generator sets and causing a blackout. KW oscillation is 1.2 MW with 18 second period. No problems experienced with paralleling generators. Red = Gen 1A MW Blue = Gen1B MW Pink = Frequency Upper Red = thruster A rpm
John J. May, PE, Transocean Improving Engine Utilization on DP Drilling Vessels
DP Conference Houston September 16-17, 2003 Page 17
Simrad PMS Trend
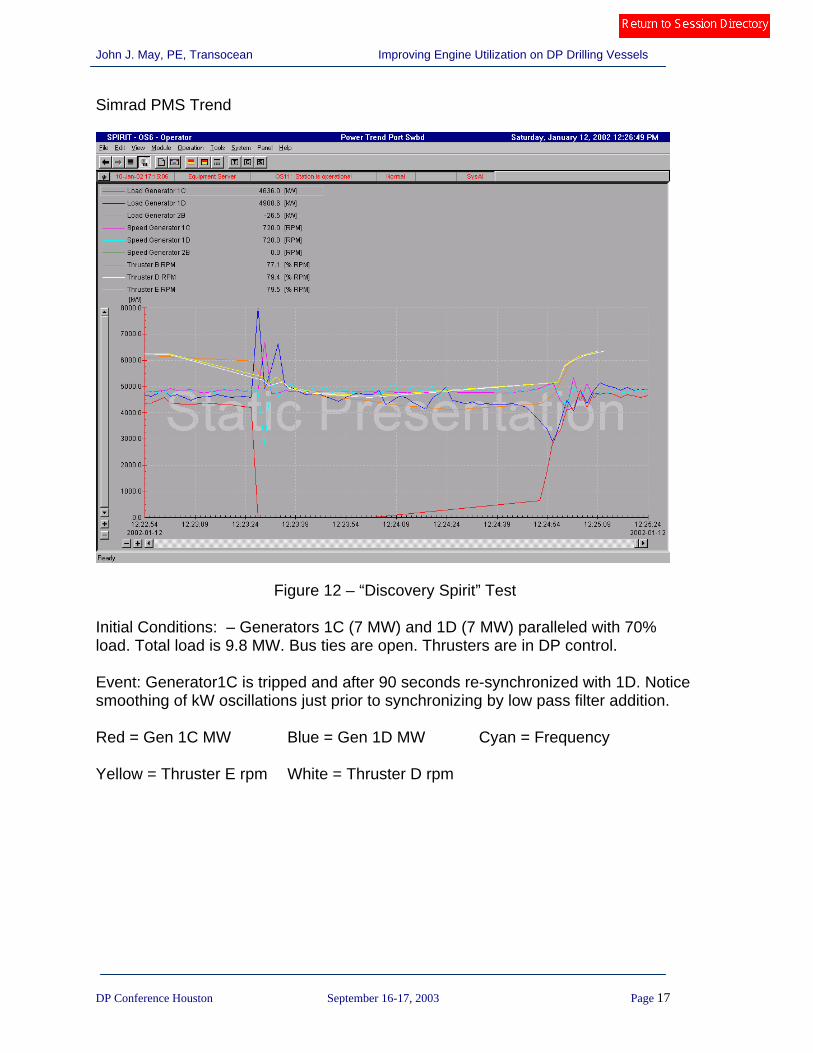
Figure 12 – “Discovery Spirit” Test Initial Conditions: – Generators 1C (7 MW) and 1D (7 MW) paralleled with 70% load. Total load is 9.8 MW. Bus ties are open. Thrusters are in DP control. Event: Generator1C is tripped and after 90 seconds re-synchronized with 1D. Notice smoothing of kW oscillations just prior to synchronizing by low pass filter addition. Red = Gen 1C MW Blue = Gen 1D MW Cyan = Frequency Yellow = Thruster E rpm White = Thruster D rpm
John J. May, PE, Transocean Improving Engine Utilization on DP Drilling Vessels
DP Conference Houston September 16-17, 2003 Page 18
Simrad PMS Trend.
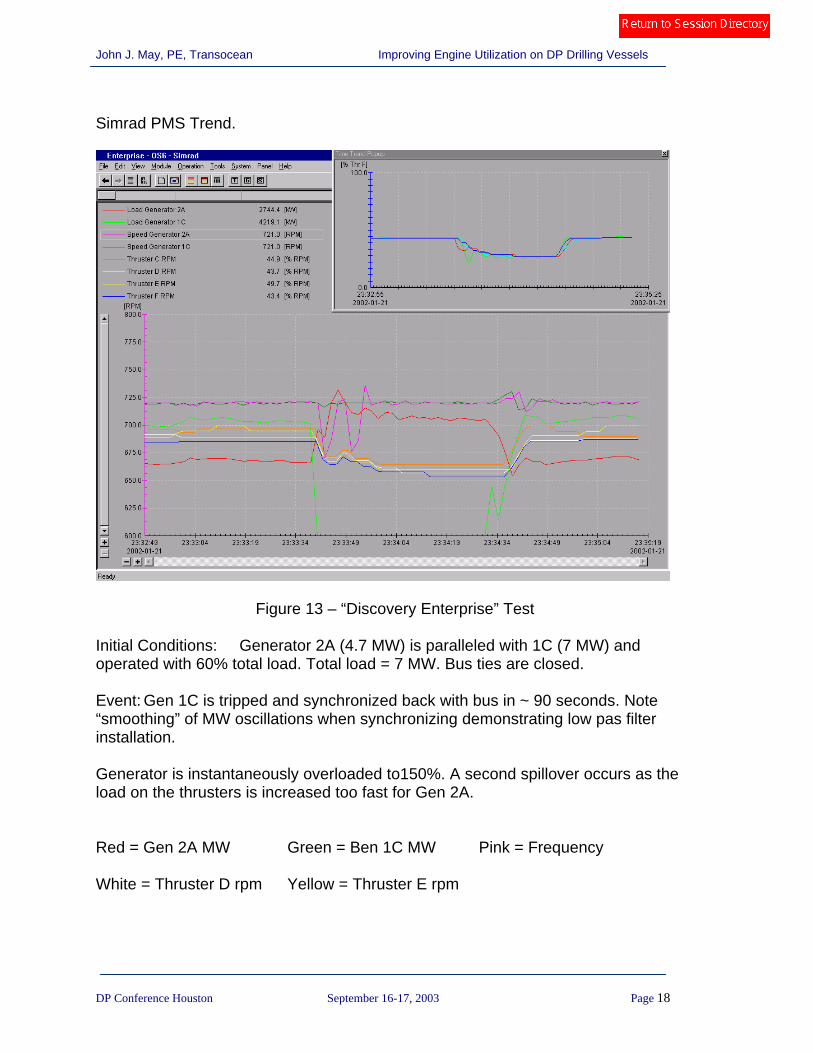
Figure 13 – “Discovery Enterprise” Test
Initial Conditions: Generator 2A (4.7 MW) is paralleled with 1C (7 MW) and operated with 60% total load. Total load = 7 MW. Bus ties are closed. Event: Gen 1C is tripped and synchronized back with bus in ~ 90 seconds. Note “smoothing” of MW oscillations when synchronizing demonstrating low pas filter installation. Generator is instantaneously overloaded to150%. A second spillover occurs as the load on the thrusters is increased too fast for Gen 2A. Red = Gen 2A MW Green = Ben 1C MW Pink = Frequency White = Thruster D rpm Yellow = Thruster E rpm
John J. May, PE, Transocean Improving Engine Utilization on DP Drilling Vessels
DP Conference Houston September 16-17, 2003 Page 19
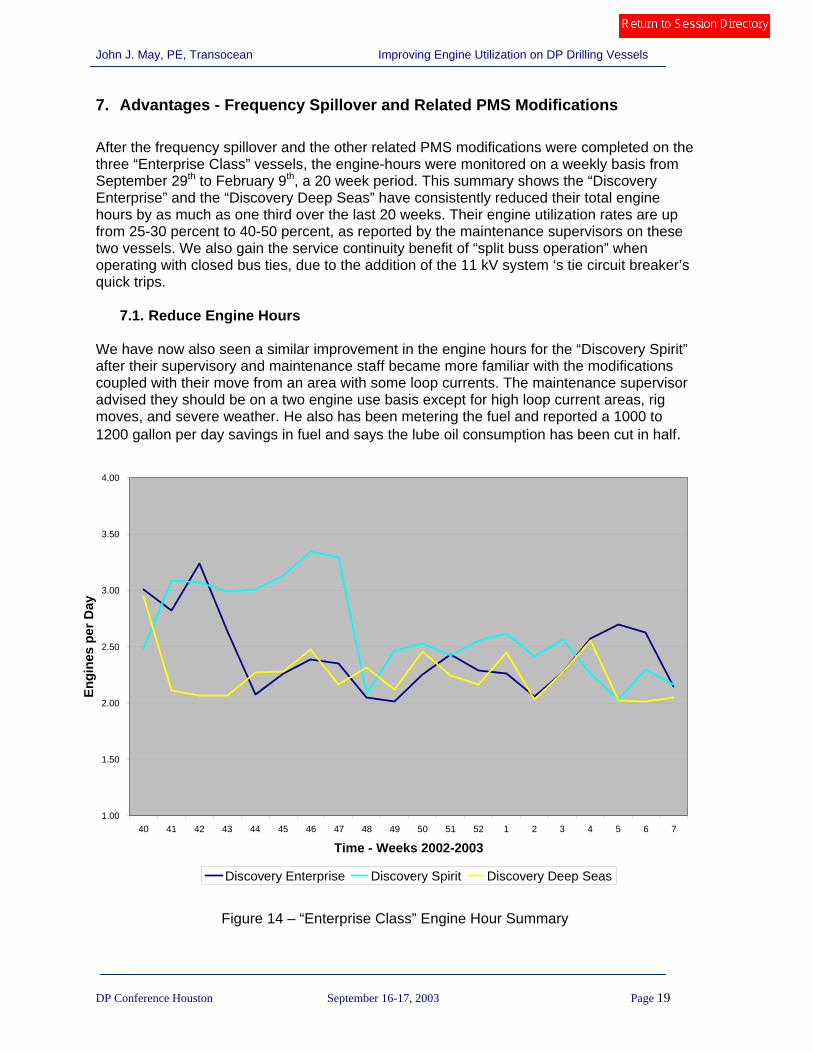
7. Advantages - Frequency Spillover and Related PMS Modifications After the frequency spillover and the other related PMS modifications were completed on the three “Enterprise Class” vessels, the engine-hours were monitored on a weekly basis from September 29th to February 9th, a 20 week period. This summary shows the “Discovery Enterprise” and the “Discovery Deep Seas” have consistently reduced their total engine hours by as much as one third over the last 20 weeks. Their engine utilization rates are up from 25-30 percent to 40-50 percent, as reported by the maintenance supervisors on these two vessels. We also gain the service continuity benefit of “split buss operation” when operating with closed bus ties, due to the addition of the 11 kV system ‘s tie circuit breaker’s quick trips.
7.1. Reduce Engine Hours We have now also seen a similar improvement in the engine hours for the “Discovery Spirit” after their supervisory and maintenance staff became more familiar with the modifications coupled with their move from an area with some loop currents. The maintenance supervisor advised they should be on a two engine use basis except for high loop current areas, rig moves, and severe weather. He also has been metering the fuel and reported a 1000 to 1200 gallon per day savings in fuel and says the lube oil consumption has been cut in half.
Figure 14 – “Enterprise Class” Engine Hour Summary
1.00
1.50
2.00
2.50
3.00
3.50
4.00
40 41 42 43 44 45 46 47 48 49 50 51 52 1 2 3 4 5 6 7
Time - Weeks 2002-2003
Engi
nes
per D
ay
Discovery Enterprise Discovery Spirit Discovery Deep Seas
John J. May, PE, Transocean Improving Engine Utilization on DP Drilling Vessels
DP Conference Houston September 16-17, 2003 Page 20
On these vessels, these modifications allow us to operate more than 90% of the time with two engines on-line instead of three. The engine utilization is now up from ~ 30% to ~ 40% of rated load. Following is a report from Wartsila on their evaluation of emission changes with the following conclusions:
7.2. Wartsila Emission Report
“Operating Two Engines Instead of Three -Total Load of 5600 KW”
The load point is shifting from 30% to 40%, resulting in higher efficiency which in turn results in the following:
1. The CO emissions are reduced by 42 tons/year; a 59% reduction. 2. The CO2 emissions are reduced by 491 tons/year; a 1.5% reduction. 3. The fuel consumption decreased by 246 tons/year; a 2.5% reduction. 4. The particulate matter is reduced by 5 tons/year; a 15% reduction. 5. The THC emissions are reduced by 15 tons/year; a 25% reduction. 6. The SOx emissions are proportional to kW; therefore, they are the same. 7. The NOx emissions are increased to 39 tons/year; an 8% increase. These
emissions are proportional to cylinder operating temperature. It is expected these will increase with engine loading.
Direct benefits are realized by the reduction in scheduled maintenance and overhauls, roughly estimated at $50K per year for overhaul parts alone on each rig. Scheduled and unscheduled maintenance will be monitored to ascertain those gains as well, which have been roughly estimated at $150K per year per vessel. The operator will also benefit form the reduced fuel and lubricant usage and will be able to recognize gains in engine emissions. Over 300,000 gallons of diesel fuel can be saved on each rig every year if this utilization is maintained only 80% of the time. On the fuel consumption note, we have tracked the detailed fuel usage history of all three “Enterprise Class” vessels from January 2001 to June 0f 2003. On this table, the results of switching from a three engine operation to a two engine operation are noted. We estimate the fuel savings to be more on the order of 10% than the 2.5% as calculated by Wartsila. Part of the reason is we rarely use bias with the two engine operation as the utilization rate is 10 to 15% better. In addition the auxiliary load for two engine operation is less than that for a three engine operation. The vessels’ maintenance supervisors and staff, the area technical field support, and headquarters electrical engineering group have worked together on these projects and share in their success. Future goals include application of these principles to other classes of vessels in the fleet.
John J. May, PE, Transocean Improving Engine Utilization on DP Drilling Vessels
DP Conference Houston September 16-17, 2003 Page 21
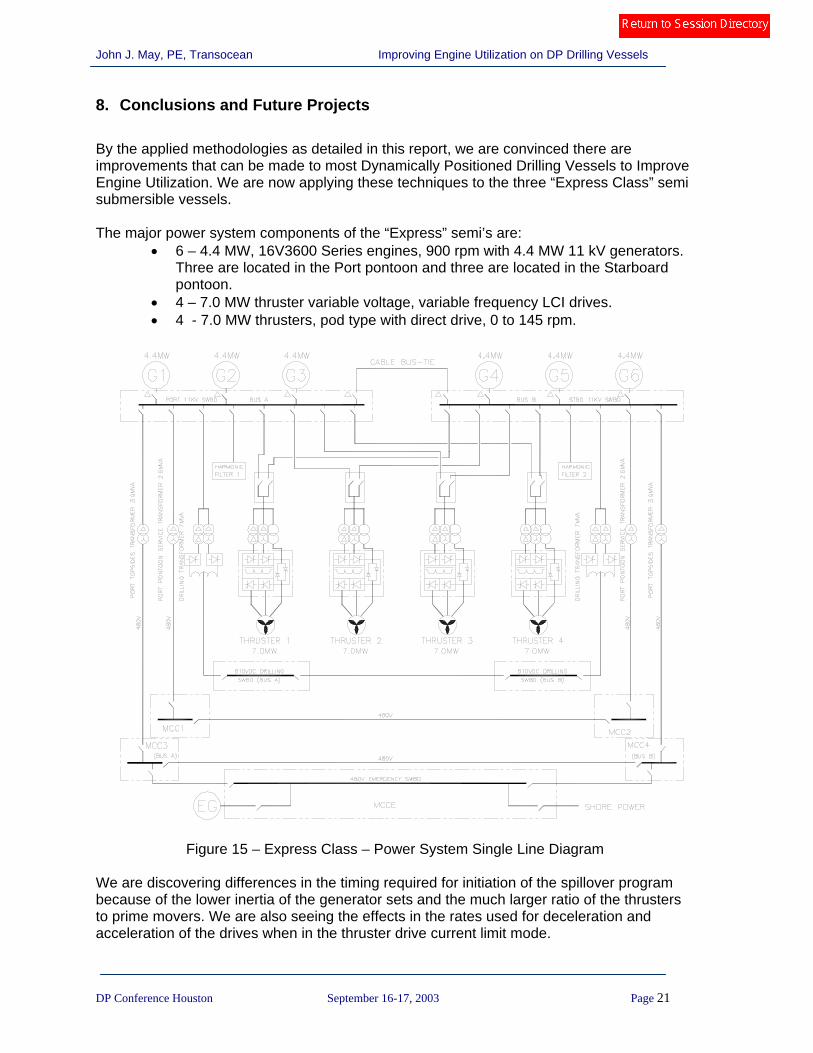
8. Conclusions and Future Projects By the applied methodologies as detailed in this report, we are convinced there are improvements that can be made to most Dynamically Positioned Drilling Vessels to Improve Engine Utilization. We are now applying these techniques to the three “Express Class” semi submersible vessels. The major power system components of the “Express” semi’s are:
• 6 – 4.4 MW, 16V3600 Series engines, 900 rpm with 4.4 MW 11 kV generators. Three are located in the Port pontoon and three are located in the Starboard pontoon.
• 4 – 7.0 MW thruster variable voltage, variable frequency LCI drives. • 4 - 7.0 MW thrusters, pod type with direct drive, 0 to 145 rpm.
Figure 15 – Express Class – Power System Single Line Diagram
We are discovering differences in the timing required for initiation of the spillover program because of the lower inertia of the generator sets and the much larger ratio of the thrusters to prime movers. We are also seeing the effects in the rates used for deceleration and acceleration of the drives when in the thruster drive current limit mode.
John J. May, PE, Transocean Improving Engine Utilization on DP Drilling Vessels
DP Conference Houston September 16-17, 2003 Page 22
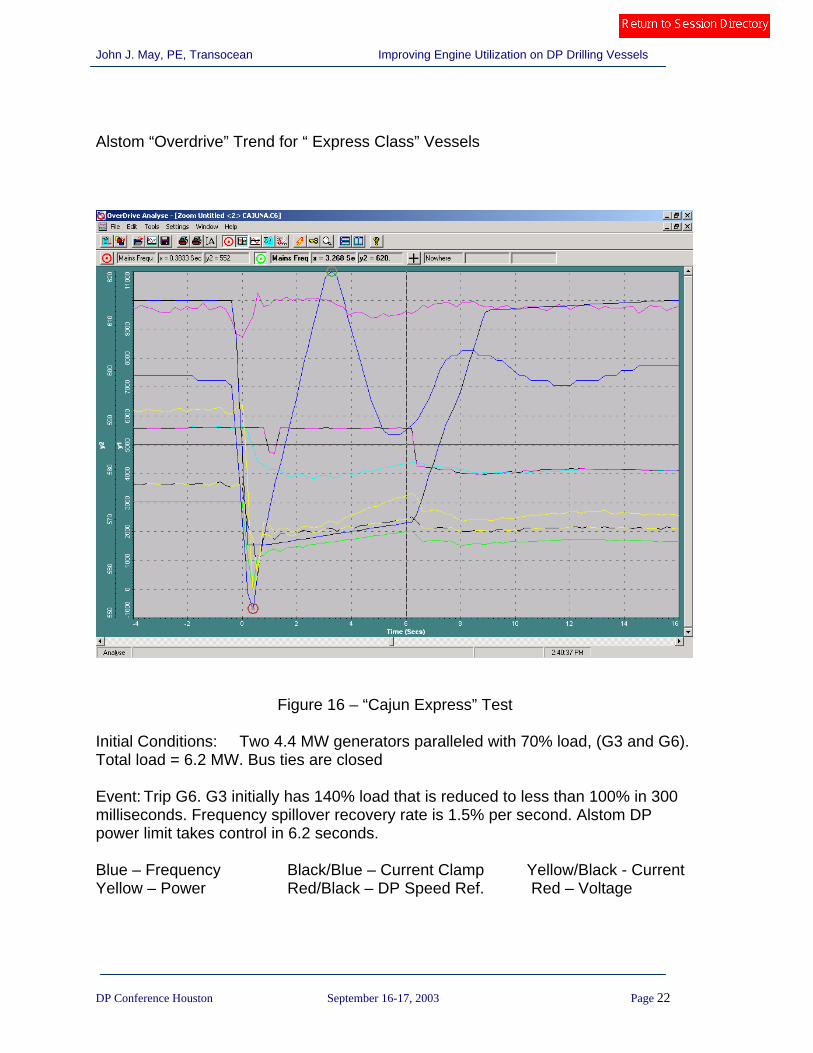
Alstom “Overdrive” Trend for “ Express Class” Vessels
Figure 16 – “Cajun Express” Test Initial Conditions: Two 4.4 MW generators paralleled with 70% load, (G3 and G6). Total load = 6.2 MW. Bus ties are closed Event: Trip G6. G3 initially has 140% load that is reduced to less than 100% in 300 milliseconds. Frequency spillover recovery rate is 1.5% per second. Alstom DP power limit takes control in 6.2 seconds. Blue – Frequency Black/Blue – Current Clamp Yellow/Black - Current Yellow – Power Red/Black – DP Speed Ref. Red – Voltage

John J. May, PE, Transocean Improving Engine Utilization on DP Drilling Vessels
DP Conference Houston September 16-17, 2003 Page 23
Because the vessels receiving these modifications are under contract, it is difficult to find an opportune time to do the installation work and test. We try to schedule the work between contracts or on rig moves. It is a slow and tedious process. The frequency sensitive fast phase back system for both the thrusters and the drilling drives can add major benefits to your power management system, save you some money and improve engine utilization on your drilling DP vessels. John J. May, PE Senior Engineering Manager, Power Systems & Electrical Core Expertise Group Transocean Offshore and Deepwater Drilling Inc.
John J. May, PE, Transocean Improving Engine Utilization on DP Drilling Vessels
DP Conference Houston September 16-17, 2003 Page 24
References
1. Charl van Wyk:
“Thruster Drive Modifications for the Discoverer Deep Seas” Reference: MP10032/CVW/003, Date: 10 April 2002 Alstom Power Conversion, Pittsburgh Office
2. Charl van Wyk: “Thruster Drive Modifications Frequency Dependent Load Shedding” Reference: Frequency Spillover Brief, 15 May 2003 Alstom Power Conversion, Pittsburgh Office
3. Halvard Sagdahl: “DP Command Low Pass Filter & Power Available Delay” Kongsberg Simrad Inc., Houston, Texas, 14 January 2002
4. Jan Simonsen “Developed New Standby Start Algorithm for Large and Small Engine” Kongsberg Simrad Inc., Houston, Texas, 21 August 2002

John J. May, PE, Transocean Improving Engine Utilization on DP Drilling Vessels
DP Conference Houston September 16-17, 2003 Page 25
Bibliography of Presenter
John J. May, PE Senior Engineering Manager, Power Systems & Electrical Core Expertise Group Transocean Offshore and Deepwater Drilling Inc. • BS Electrical Engineering – Texas A & M University • Registered Professional Engineer - State of Texas • 30 Years Reading & Bates / Transocean working as:
• Discipline Engineering Manager • Project Manager – New Construction and Major Modifications • Discipline Engineer
• 5 Years with General Electric Company • Power System Application Engineer • Technical Marketing Training Program
Awards Received Offshore Technology Conference Achievement Award 1988 “Zane Barnes Project” Offshore Technology Conference Achievement Award 1995 “Amoco Liuhua Project”