impact of structural adjustment … of structural adjustment policies on ... is to analyse the...
TRANSCRIPT
i
IMPACT OF STRUCTURAL ADJUSTMENT POLICIES ON WOMEN EXECUTIVE SUMMARY The aim of the study is to analyse the impact of structural adjustment policies on women in Bangladesh. The study focussed on the issues outlined in the TOR and the findings are as follows: o It is found that the SAP design and framework does not adequately address gender issues, which is again due to the focus of SAP on efficiency, growth and stabilization, without considering structural constraints, and without considering inequality, including that between men and women. Gender concerns were incorporated much later along with issues such as institutions, governance and the environment. Even then the approach is sectoral, without looking at the impact of changes in macro policy such as trade and financial liberalization, privatization, budget re-structuring, with withdrawal of food and input subsidies, etc. These macro level changes have again considerably changed the macro and micro setting for women. It is found that in Bangladesh, SAP-led measures such as greater export-orientation of the economy has significantly increased employment of women in the manufacturing sector. Census of Manufacturing Industries (CMI) data show that female employment as percentage of total employment in all industries covered by the CMI increased from 3.04% in 1985-86 to 15.29% in 1991-92. This increase is again due to the growth of the readymade garments industry which currently employs 1.5 million workers, 90% of whom are women. o These new industries however offer lower standards in terms of wages, working conditions, and occupational safety, which have to be weighed against the gains in employment. o The fast growth of the readymade garments (RMG) industry is also attributed to special incentives provided by the government such as back to back letters of credit and bonded warehouse facilities, and under an international trading system for apparels which imposes quotas on imports from Bangladesh's neighbours and gives preferential access to Bangladesh in some markets, such as that of the European Union. o It is anticipated that with further liberalization of the world market for apparels after 2005, the Bangladeshi exporters will face intense competition, and the female labour force in this industry will become more vulnerable to unemployment. o It should also be stated that there was a-significant increase in self-employment of rural women over the SAP period due to interventionist measures taken by Grameen Bank and other NGOs in terms of supply of micro credit. Liberalisation of the financial sector could not on the other hand have any impact on women's access to credit. The same applies to access to other farm inputs, and liberalisation of these markets.
ii
o Women were negatively affected by privatization and trade liberalization policies in a number of sectors such as handlooms, jute, cotton, food and beverage, etc. They either lost their jobs or were affected by job losses of their spouses. A total of 89,971 workers (men and women) lost their jobs in the state owned enterprises (SOEs) till June, 1997. PRA findings also show that women losing their jobs find fewer alternative employment opportunities. o The available wage data show a decline in real wages for women in some sectors such as construction in the 1990s. For the agricultural sector, nominal wages for men and women show very modest gains in the '90s compared to the '80s, with gender differentials in wages being maintained over time, female wages being 40-50 percent of that of male agricultural workers. The earnings of workers thus did not improve over the SAP period. The same applies to the gender differential in wages, though this is somewhat lower in the RMG industry, the average female wage being around 70 percent of the average male wages. The gender differentials reflect structural factors such as gender segregation of the job market by occupations and by skills, and the under-representation of women in higher paying occupations and skill grades, due to economy wide disparities in education and training, women's disadvantaged position within the household etc. The wage data therefore does not support the view that SAP had a significant long term expansionary effect on demand, or that it could sufficiently improve the position of women vis a vis men in the labour market. o The adverse effect of SAP on the social sectors, such as education and health have not been pronounced due to special measures such as free tuition up to class VIII and stipends for girls, and maintenance of public expenditures in these sectors. There were thus some gains in reducing the gender disparities in terms of school enrolment rates, life expectancy at birth, and improvements in the maternal mortality rates, etc. The expenditure on health was however found to be too low at under one percent of GDP. o Bangladesh Bureau of Statistics data on the other hand show that food grains consumption including minor cereals rose from the mid eighties to the end of the decade, but again fell in the first half of the nineties. Food prices show a rising trend in the eighties, by about 73 percent, which continued into the nineties but at a slower rate, the CIPI for food in Dhaka district rising by 45 percent in this decade. The same trend in rising prices is observed for other necessities. o The poverty and nutrition data similarly do not show any significant improvement in the lines of the poor, particularly the "hardcore" poor. This is also supported by the PRA findings, which show a decline in food security compared to the pre-SAP period. A child Nutritional survey conducted by BBS in 1992 show that the prevalence of wasting for girl children aged 6-71 months declined from 9.5 percent in 1985-86 to 6.6 percent in 1992, while the prevalence of stunting declined from 57.6 percent to 47.6 percent over the same period. The nutritional status was also found to be worse in rural areas, and somewhat better for boys compared to girls. o Safety nets such as the Vulnerable Group Development Programme are found currently to be limited in coverage. o The recommendations which follow from this study are: i) to continue the prioritization of social sector spending, with focus on quality and outcomes for men and women, (ii) a proper focus on re-structuring of SOEs to improve their efficiency in operation through modernization of capital equipment, improved supply of raw materials including electricity, better industrial relations and

iii
increased managerial efficiency. It is argued that simply a transfer of ownership from public to private will not achieve these goals, nor simply a rationalization of the workforce. (iii) Additional schemes need to be devised for retrenched women workers who find less job opportunities, and women displaced by technology, changes in crop-mix, etc. (iv) A much better focus has also to be given to improving working conditions in the new export industries which mainly employ female labour such as RMG. (v) The review similarly suggests a change in the stance of macro policy to include goals of equity, as opposed to efficiency, better regulation of markets, and organizational support and interventions in support of women.
1
Impact of Structural Adjustment Policies on Women NASREEN HUNDKER The aim of the study is to analyse the impact of structural adjustment policies on women in Bangladesh. As per the terms of reference provided, the main issues to be looked at are: (i) review the SAP design in order to comprehend whether SAP package has given adequate importance to gender issues; (ii) assess the impact of adjustment measures on women's employment, incomes and conditions of work and validate whether demand constraint has tended to reduce both formal sector employment and wages over the short run; (iii) examine whether gains in women's employment in the exported-oriented sectors are offset by losses in traditional sectors induced by import liberalisation; (iv) explore whether earnings of the women employed in the informal sector have been depressed due to lessening of income-earning opportunities with the decline in formal sector and increase in the number, resulting from formal sector retrenchment; (v) appraise how pricing and exchange rate policies through reduction or abolition of subsidies on food, devaluation leading to price hike of imports and introduction of user charges for public services have impacted women's lives as "managers of household"; (vi) investigate how women "as mothers" have been affected by the public expenditure pruning due to pursuance of demand restraint policies and whether the introduction and increase of user charges in education and health have adversely impacted; and (vii) assess the impact of income and price changes induced by the adjustment policies/programmes on the female headed household member's food consumption, nutrient intake and health status. The following sections discuss these issues. a) The SAP design and framework and gender issues: The key hypothesis here is that the SAP framework does not adequately address gender concerns. The chief goal of SAP is in terms of macroeconomic stabilization and achieving higher levels of growth through greater efficiency in allocation of resources. The latter was again to be addressed through trade liberalization and greater export-orientation of the economy, increased role for the private sector, and various reform measures. The omission in terms of gender is again due to the inadequacy in the SAP design in taking into account distributional issues, including that of gender equality. Thus a World Bank review of the experience with policy reforms in the 1980s (WB 1990a) contains no mention of gender issues. The only distributional issue considered is that of the affordability of farm inputs by small farmers. Gender concerns were incorporated much later, along with the focus on institutions and governance. Even then, the approach is sectoral, and does not look at the impact of macro policy. The Strategy Paper on Women and Development (WB 1990b) for instance identifies the main issues and concerns facing women in Bangladesh, through a situation analysis, and devises a strategy for mainstreaming women into development activities. The paper is based on a correct assessment of the position of women in Bangladesh, especially the structural changes in the economy leading to greater participation of women in wage labour, and their increased involvement in a range of household production based activities. The approach is to identify key sectors such as industry, agriculture, water and sanitation, health, education etc. and identify women's contribution and needs, the gaps in government policies and programmes, and give specific recommendations. It also
2
addresses social issues such as the legal status of women, problems related to dowry, and the overall gender subordination of women. The focus is to increase women's productivity, earnings and status through greater access to productive resources, greater involvement in the decision-making process, and prioritization of women's needs in the social sectors, including education and training. The draft gender strategy paper 1999 similarly identifies the main priority areas in terms of education and training, women's access to gainful employment, health and access to health facilities, women's access to productive resources, violence against women, participation in political processes and decision making structures, legal reforms, governance and institutional mechanisms. This later strategy paper also incorporates a change in approach, in that the priorities for women, as well as key constraints and strategies, are determined through a process of consultation with civil society. The paper in addition contains a brief review of the bank's projects in different sectors since 1995 to assess the extent to which gender issues have been addressed. As mentioned before, the main gap in the approach of the strategy papers and in the SAP design and framework, is in the area of macro policy and how gender concerns can be incorporated into this. This is a serious omission in the context of SAP, since most of the policies undertaken under SAP relate to macro policy, and significantly alters the socioeconomic environment for women. Thus the focus of SAP on growth and efficiency, withdrawal of the state from key areas, focus on private sector development and de-regulation, trade liberalisation, adequacy of safety nets, all need to be evaluated for their impact on women. From a broader perspective, the strategy has to address gender equality and concerns, and the status of this in the pre and post SAP environment, as well as in the transition. Thus trade liberalization and privatization policies have had a significant impact on employment and earnings of women. Greater import penetration of the rural economy has directly affected women producers in the hand-loom and other small-scale sectors, as has privatization policies leading to widespread labour retrenchment. Women have also been indirectly affected by loss of male jobs and reduction in family earnings. In agriculture, women are affected by changes in the system of distribution of inputs such as fertilizer, seeds, and irrigation, as well as agricultural extension advice. Women are traditionally involved in homestead gardening, and have also been increasingly involved in farming in recent years, so that policy changes in agriculture have implications for women. Secondary data and the results of the PRA exercises are used in later sections of this paper to bring out the substance of this impact on women of SAP, in the different dimensions mentioned, as well as the changing opportunities for women in both urban and rural areas. The other significant gap in the strategy papers is in terms of squarely addressing the issue of gender differential in earnings though it is implied by the differential access to productive resources, and differential attainment in terms of education and training, discussed in the strategy papers. The differential however is as much due to market segmentation factors as well as attitudinal variables, restricting women's participation in the economy to certain sex stereo-typed jobs and occupations. These structural constraints have been ignored in designing SAP. b) Effect of SAP on Employment:
3
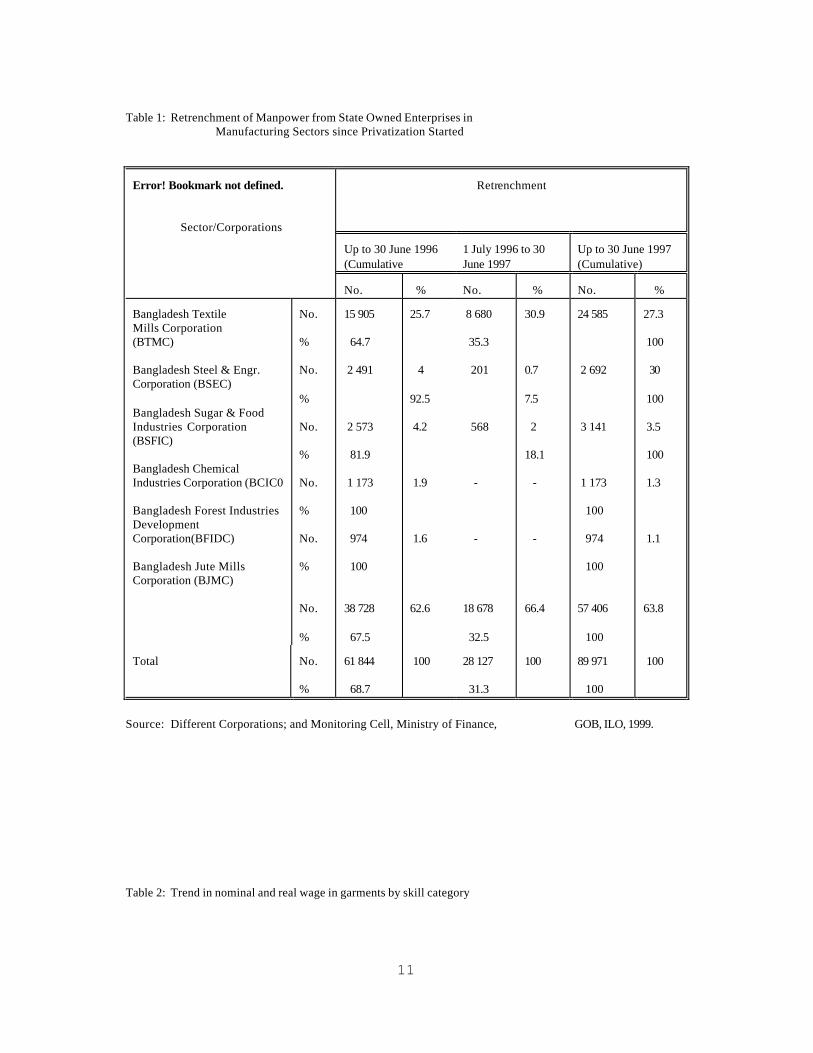
In the case of Bangladesh, structural constraints such as gender segregation of the labour market have limited women's participation in formal manufacturing employment both in extent and type. There is also segmentation by tasks, so that women are relegated to the low-skill low-wage segment within an occupation or industry, including agriculture. Both demand and supply side factors are also important in explaining the limited participation of women, where besides cultural and attitudinal norms, women's disadvantaged status within the household, in terms of education and training, and access to productive resources, all militate against them. The specific impact of SAP on women's employment and earnings are therefore not as much due to policies constraining aggregate demand in the short-run, or as a result of long-run growth, as to re-allocation of resources, mainly to the export-oriented sectors. Women, especially rural women, have also been adversely affected by the import penetration of the economy, due to import liberalization, and policies encouraging privatization of state-owned enterprises (SOEs). Census of Manufacturing Industries (CMI) data for instance show that female employment as percentage of total employment in all industries covered by the CMI increased from 3.04% in 1985-86 to 15.29% in 1991-'92. There has therefore, been a net increase in women's employment in formal manufacturing over the SAP period. As is well known, this increase is again due to the growth of the readymade garments (RMG) and apparels industry, which according to the CMI data accounted for approximately 68% of total female employment in those industries covered by the CMI in 1985-'86, rising to over 69% by 1991-'92. According to BGMEA statistics, the RMG industry employed 1.5 million workers in 1997-98, 90 percent of whom were women. It may however be stated that growth of the readymade garments industry in Bangladesh was due to a world trading system in apparels which imposed quotas on imports from Bangladesh's neighbouring countries which prompted buyers to shift their source to Bangladesh, and also originally encouraged investors such as Daewoo of Korea to enter into collaborative ventures with garments manufacturers in Bangladesh. Most of the enterprises are however domestically owned. Incentives provided by the government such as "back-to-back" letters of credit extended by commercial banks, and bonded warehouse facilities were key factors in promoting the fast growth of this industry. Under the former, the exporters of RMG are able to import fabrics and accessories against export orders, easing the working capital needs of entrepreneurs. Under the latter arrangement, RMG units can access imported inputs at zero-tariff. It is apprehended that the global environment will become intensely competitive for Bangladesh with the abolition of quotas after 2005 and imposition of a more liberal world trade regime. This may negatively affect female employment in the RMG industry in Bangladesh. The CMI data also show the decline in women's employment in hand-loom textiles, from 2,323 in 1985-86 to 2,309 in 1988-89, though there is an upward trend again from 1989-90 to 11,704 workers. The decline has been particularly sharp from 1985-86 to 1987-88. Further gender disaggregated data is needed for retrenched workers in SOEs, particularly jute and cotton textiles, to get a clearer picture of the effect on women's employment. However, women are affected not only through direct loss of jobs but indirectly through loss of jobs and earnings of their husbands. Some estimates by the ILO (1999), collected from different Corporations and Monitoring Cell of the Ministry of Finance, Government of Bangladesh, show that a total of 89,971 workers lost their jobs in the six sector Corporations till 30 June, 1997, and major
4
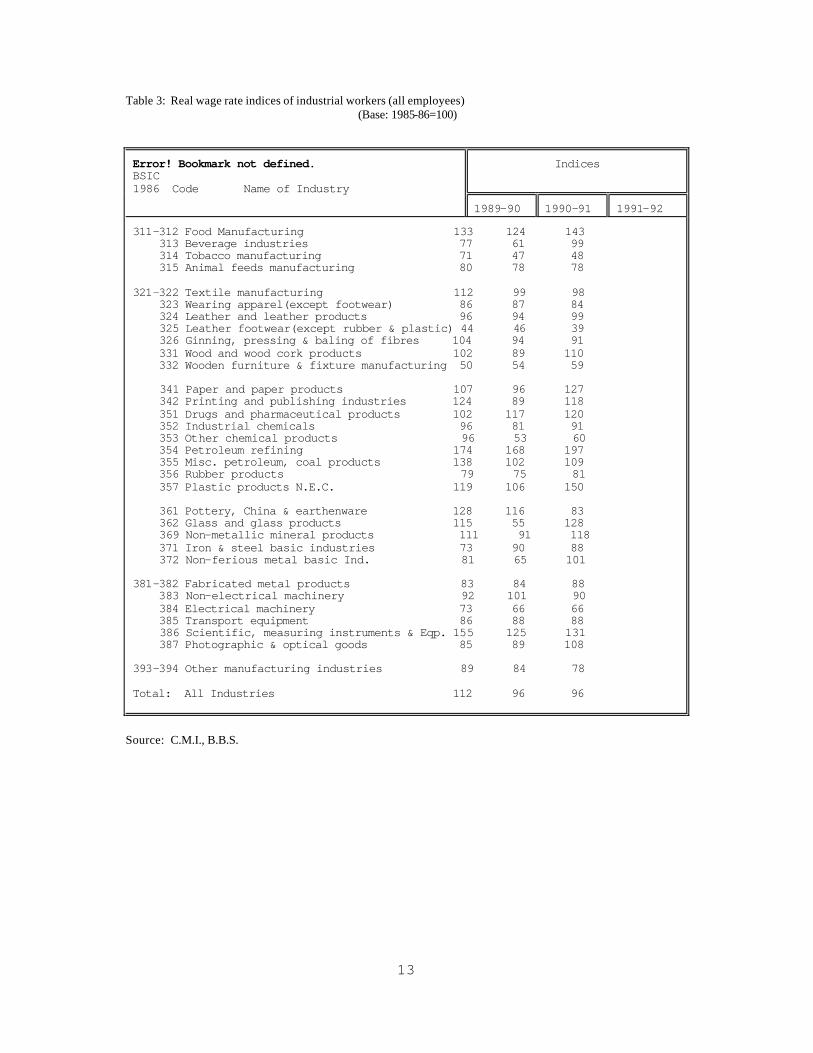
retrenchment occurred during 1991-96 (see Table 1). A further 88,612 workers were also to be retrenched due to privatization in the next two to three years. Among the retrenched workers, 42 percent are skilled, 22.5 percent semi-skilled, and 28 per cent are unskilled, while officers constitute 4.87 to 7.3 per cent of the total. Women directly losing their jobs are likely to be in the unskilled category. A survey of 1,000 workers by the National Wages and Productivity Commission 1998 finds that on average there were 1.2 earners per worker household, so that workers losing their jobs mean a major income loss for their families. Most retrenched workers also find employment in the informal sector or with reduced wages in the private sector. Till now, very few training schemes for alternative employment have been arranged for retrenched workers. The PRA exercises conducted as part of SAPRI show importantly that women face even fewer alternative job opportunities once they lose their formal sector jobs in mills and factories affected by privatization or import liberalization. The PRA findings also show that job loss and reduced family earnings exposed women to a greater degree of violence, abandonment, and led to reduced expenditure on housing, health, and education of children. It should in addition be emphasised that interventionist measures such as provision of credit and other inputs, as well as organisational support, by Grameen Bank and other NGOs have significantly increased self-employment of women, mostly in rural areas in the last two decades. Thus the proportion of the self-employed women in the non-agricultural sector increased from 15.9 percent in 1983-84 to 63.1 percent in 1990-91 (LFS 1983-84, 90-91). This indicates the relative importance of interventionist, as opposed to SAP led market liberalisation measures, in improving the well-being of women. c) Wages and working conditions: The gain in women's employment has however to be evaluated against the age composition of those employed, wages, and job quality. Most of the women employed in the readymade garments industry are young, between 15-24 years of age, and are migrants from rural areas. This new export-oriented industry is also in the non-unionised sector, and offers lower standards in terms of occupational safety and health. Women work long hours, including overtime and night work, sometimes without weekly holidays, and also face other problems such as arrears in terms of payment of wages. A number of fire hazards in this industry have led to loss of lives, highlighting the poor standards in terms of occupational safety, which is again due to the fact that factories are mostly located in the heart of cities and are not functionally built. Most of the category of workers in this industry are trainees or "helpers" earning very low wages. In 1985, the nominal wages for garments workers varied from Taka 300 for helpers, to Taka 500 for semi-skilled workers to Taka 800 for skilled workers (Bhattacharya and Rahman 1999). Over time however, real wages have increased in all categories, the increase being highest for skilled workers (40% from 1980-1997, as against a 24% increase for helpers(see Table 2). These wages are less than in other formal manufacturing industries, and the wages of helpers in particular correspond more to informal sector wages. Bangladesh Bureau of Statistics (BBS) data also show that the real wage index in 1991-92 was only 84 in wearing apparel (1985-86=100), compared to 98 in textile manufacturing, 99 in leather, 127 in paper, 143 in food manufacturing, etc. (see Table 3). Moreover, UNIDO data show
5
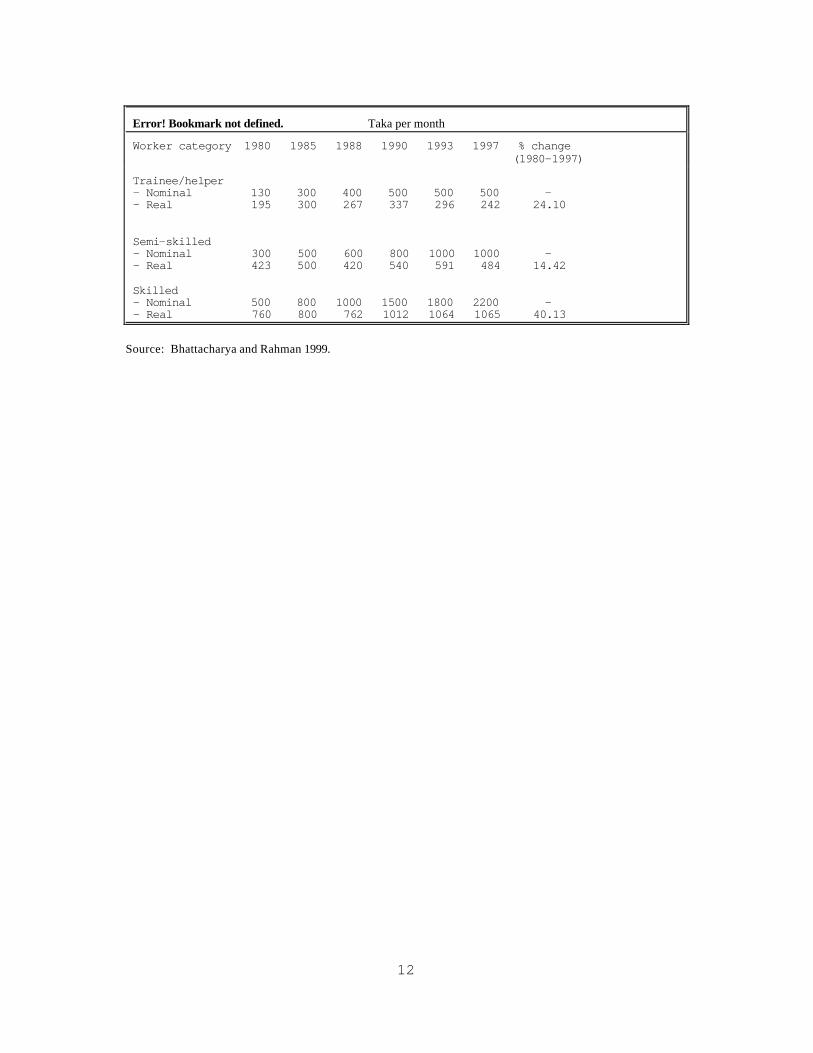
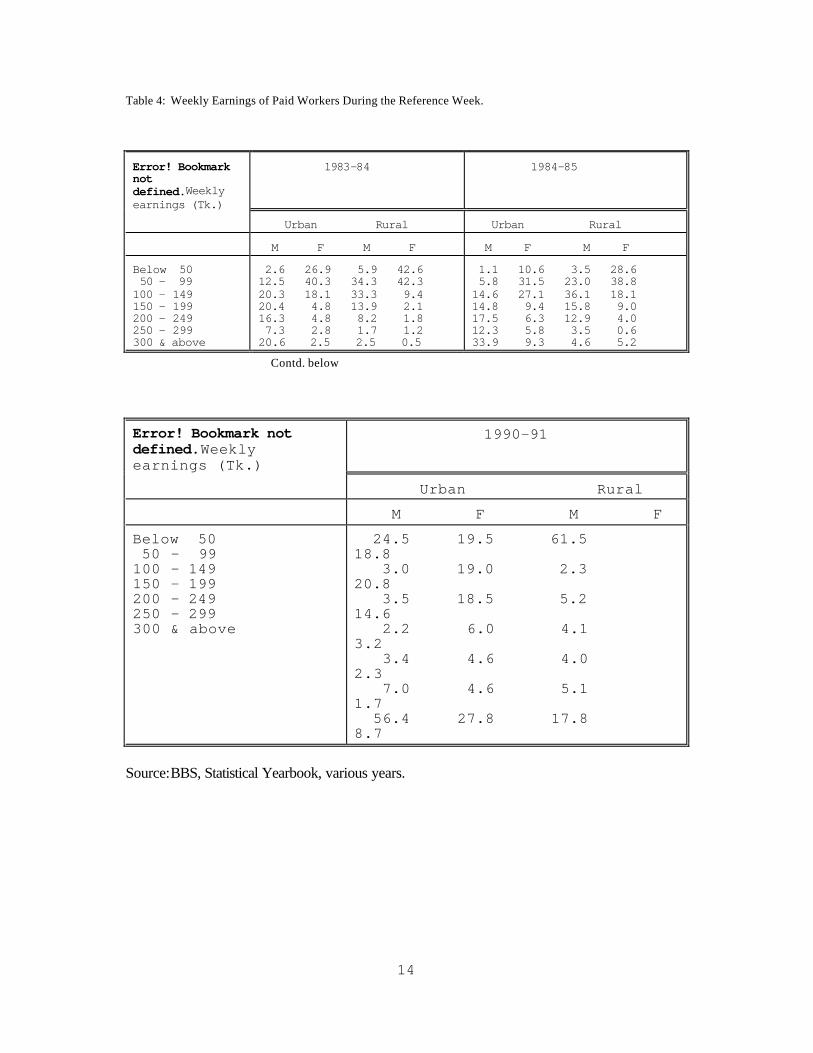
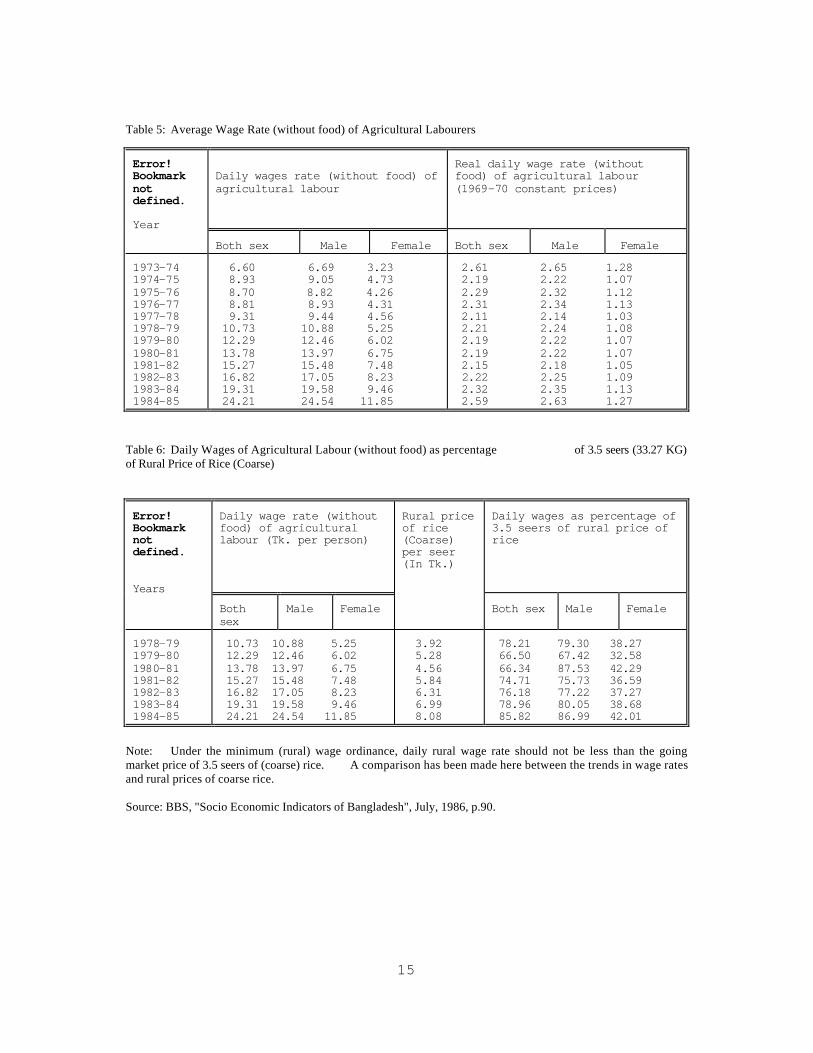
that from 1981 to 1992, labour productivity in the apparel industry increased by around 14 per cent, compared to a wage increase of only 11.5 per cent. The expansion of female employment in the RMG industry has some positive features in that many of the workers were previously unemployed or were in domestic service, where wages are lower and there is less scope for upward mobility. There is also greater scope for inter-generational mobility, many of the workers' mothers being employed in domestic service. It is nevertheless true that wages and working conditions in this industry are worse compared to other formal sector industries. Whether the earnings of different categories of women workers similarly declined due to structural adjustment policies, particularly because of import penetration and fall in domestic demand, is an issue of concern. Table 4 shows that between 1983-84 to 1990-91, in both urban and rural areas, the percentage of paid women workers earning less than Taka 150 per week declined, so that any adverse effect of SAP were probably not pronounced. Similar data on earnings of small producers is however needed to validate these findings. As mentioned before, self-employed hand-loom workers may have been badly affected due to import penetration as well as technological displacement in recent years. There is data (BBS) on looms which are not operational, but these are not gender disaggregated by ownership. Also, we need data on earnings. In the agricultural sector, BBS data show a very slight increase in wages(19 per cent) till the mid 80's. Real daily wage rate (without food) rising from 1.07 in 1980-81 to 1.27 in 1984-85 for female agricultural labourers (Table 5). The daily wage rate for women agricultural workers was also 36.59% of 3.5 seers of rice in 1981-82 rising to 42.01% in 1984-85 (Table 6). The wage rates for women are also seen to be 40-50 per cent of those of men. The nominal wage rates for both sexes of agricultural labourers rose from 13.97 Taka/day in 1980-81 to 31.15 Taka/day in 1988-89 and 31.19 in 1990-91. In 1996-97, it rose to Taka 38.04/day. Thus in the 90's nominal wages rose by 22 per cent. In the 80's nominal wages rose by 123 per cent. We can expect that gender differentials in wages have been maintained, and this is validated by the PRA findings. One important informal sector occupation for women is in construction, especially brick breaking. The real wage rate indices in construction declined from 120 in 1988-89 to 114 in 1997-98. The data thus show very modest gain in wages of women workers over the SAP period, with a decline in real wages in some sectors. The PRA findings give some additional insight on the changes in rural areas. It has shown that female wage employment has increased only marginally. This only slight increase in demand for female labour was due to the change in crop mix away from crops for which there was a significant demand for female labour (processing of aus paddy and jute), and a general decline in labour demand due to mechanization. Female labour market participation was also found to be fairly low.
6
In terms of homestead gardening, a traditionally women's activity, there has been some increase, but again as a result of NGO and Department of Agricultural Extension (DAE) activities. The range of problems identified for increased participation in this activity was inadequate land and scarcity of good quality seeds, which it seemed the market had failed to provide, affecting productivity. The PRA findings similarly show an increase in poverty-focussed activities which include gathering fuel, collecting water, constructing/repairing house in the study villages for both men and women. The findings also show an increased workload for women in terms of participation in traditional household, market-related and expenditure saving activities. The PRA findings thus suggest the socioeconomic environment for poor women to have changed in important ways in rural areas over the SAP period, some of which could be attributed to SAP related measures such as more intensive irrigation due to liberalisation of imports of irrigation equipment, and change in cropping mix and intensity, and others due to NGO interventions. While the capabilities of poor women were enhanced in terms of greater income earning opportunities, more involvement in decision making at the household and farm level, there may have been a decline in overall well-being due to the increased workload and accompanied stress. d) Effect on education and health of women: One of the effects of SAP in most countries is the adverse impact on public services, including education and health. This is both due to demand restraint policies and introduction of user charges on these services. In the case of Bangladesh, a trend growth rate of 4.8% was maintained throughout the period 1981-1995 for primary school enrolment, 5.7% in secondary education, 10.9% for college education, and 7.7% for University education (Khundker & Kibria 1999). There was remarkable achievement in the growth rate of female enrolment, due to special measures such as free tuition up to Class VIII and stipends, and introduction of a non-formal primary education program in collaboration with NGOs. The primary school enrolment rate in 1996 was 86% for girls and 90% for boys. However, drop-out rates are still fairly high, and student-teacher ratios have steadily increased, affecting the quality of education. In the Bangladesh case, education is almost entirely publicly provided, and the share of private contribution in the form of fees as percentage of total expenditure is very negligible, and lower for tertiary compared to primary education. Thus the impact of introduction of user fees and charges is not very relevant. Public expenditure on education varied from 12-17% of the recurrent budget over the period 1981-1996, and was in the range of 3% to 9% of the development budget in most years, from 1981-1994(ibid). Thus the negative impact of SAP was not felt in terms of education. Access to health care services is a key issue for the poor, including poor women. Sen 1997 shows that the hardcore poor households in rural Bangladesh, corresponding to the lowest two income deciles, currently spend 7-10% of their income to cover private health expenses. It is well known that the poor are vulnerable to downward movement into destitution due to chronic disease or severe injury.
7
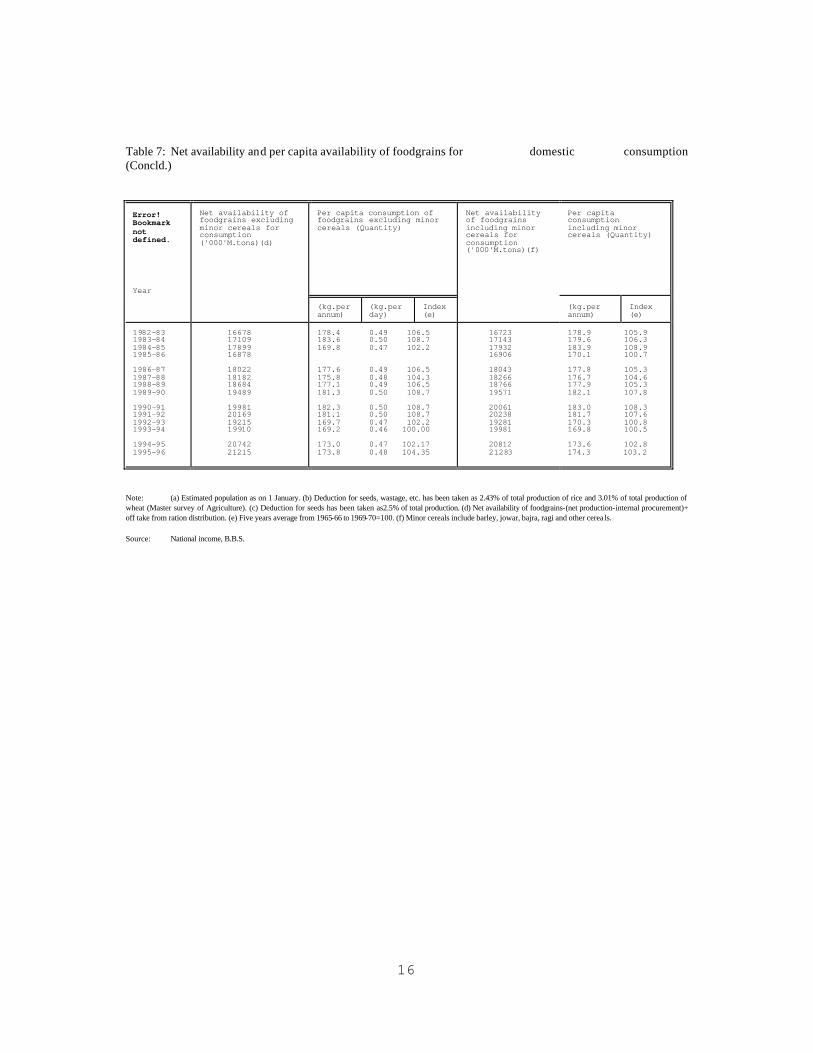
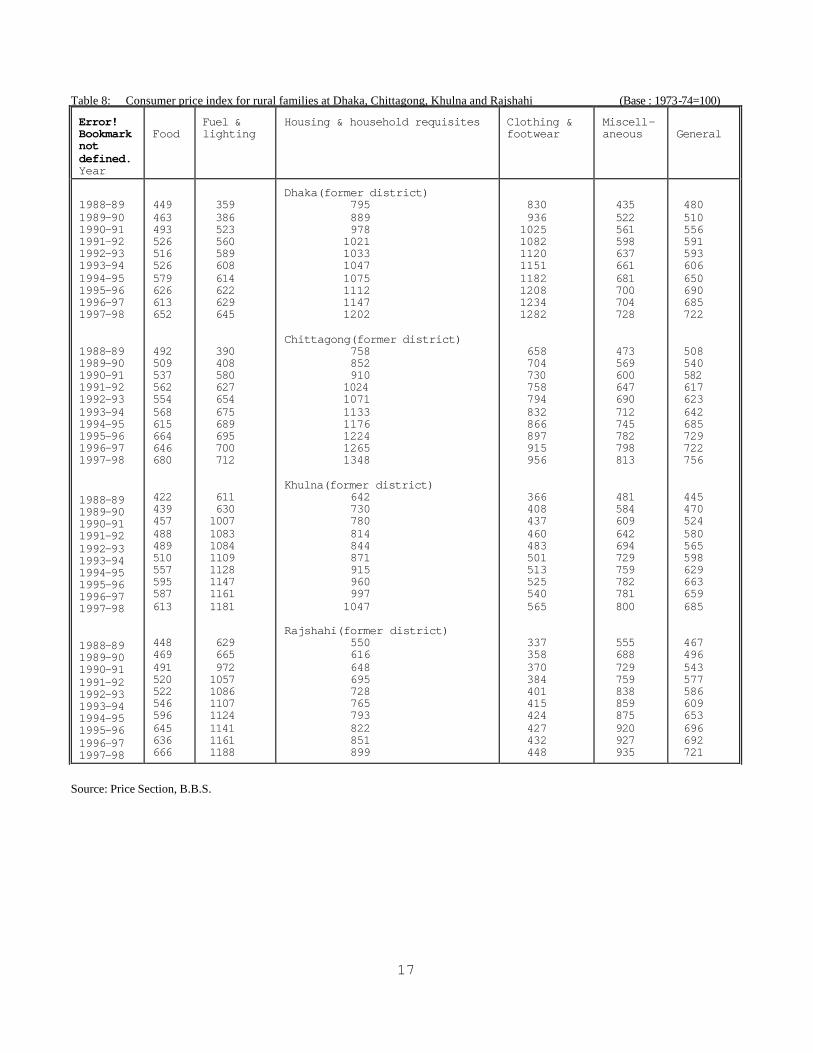
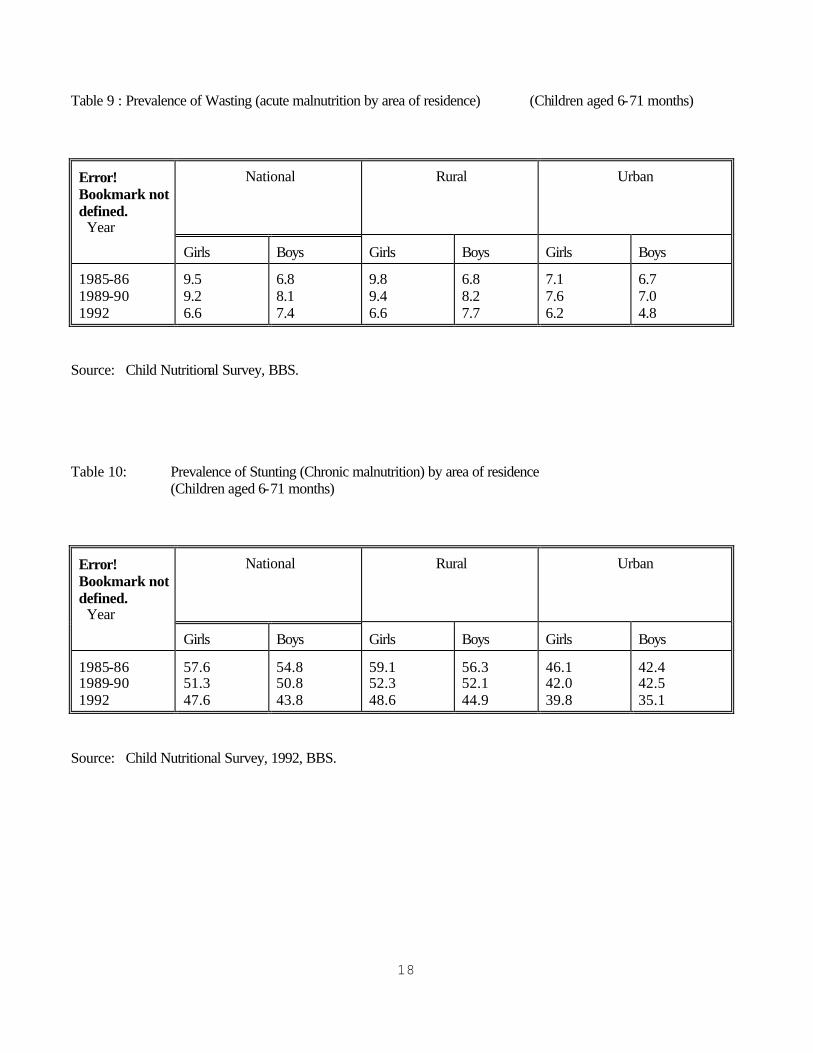
Existing studies (Rahman and Ali 1996; Begum and Sen 1998) show that since 1981-82 to 1992-93, the percentage of GDP spent on health, population control and family planning increased modestly, and has remained at under 1 per cent of GDP. Over the same period, percent of the revenue budget spent on health remained at 6-7 percent, and at around 2 percent of the development budget. Despite these modest increase in expenditure, some improvements were attained in terms of reducing the gender disparity in life expectancy at birth, which increased from 51.6 years for males in 1974 to 56.5 years in 1991, and for females from 49.7 years in 1974 to 55.7 years in 1991. There were similar improvements in the maternal mortality rate and access to safe drinking water and sanitation, the latter due mostly to the contribution of NGOs. Thus demand restraint policies under SAP have not negatively affected the access to social services, mainly due to the prioritization of social sector spending by the government and donors. It is argued elsewhere by the author (Khundker & Kibria 1999) that this was however achieved through cuts in spending on the industrial sector with adverse consequences on employment. e) Food availability, food consumption, and adequacy of safety nets: While there has been a steady decline of food and input subsidies over the SAP period, there has been some provision for safety nets such as the Food for Work and VGD program for poor rural women. The PRA exercise in two villages however find such pro-poor programmes to be very limited in coverage. Thus the combined effect of these have to be evaluated in terms of food prices, expenditure on food and consumption, as well as achievement in terms of nutrition, over the SAP period. BBS data for instance show that the index of per capita food-grains consumption including minor cereals declined from 105.9 in 1982-83 to 100.7 in 1985-86, rising to 107.6 in 1991-92, again falling to 103.2 in 1995-96(Table 7). The district wise CPI for rural families also show a rising trend for food prices. The CPI for food in Dhaka district for instance rose from 449 in 1988-89 to 652 in 1997-98. The general CPI, including food, fuel and lighting, housing and household requisites, clothing and footwear and miscellaneous items also show a similar rising trend (from 480 in 1988-89 to 722 in 1997-98 for Dhaka district). The base year for this CPI is 1973-74 (Table 8). For an earlier period, the CPI for food for rural families in Dhaka district rose from 250 in 1981-82 to 433 in 1987-88, and the general CPI rose from 261 to 454 over the some period. The absolute poverty (head-count ratio) defined to be those who cannot attain 2,122 k cal/day/person declined from 62.6 percent in 1983-84 to 47.5 per cent in 1995-96. The hardcore poor declined from 36.75 percent to 25.1 percent over the same period. A child Nutritional survey conducted by BBS in 1992 show that the prevalence of wasting for girl children aged 6-71 months declined from 9.5 percent in 1985-86 to 6.6 percent in 1992, while the prevalence of stunting declined from 57.6 percent to 47.6 per cent over the same period. The nutritional status was also found to be worse in rural areas, and somewhat better for boys compared to girls (Table 9 & 10).
8
The PRA findings similarly show a decline in food security and very sluggish reduction in the rate of poverty. The available data thus do not indicate any substantial improvement in the position of the poor, including that of poor women over the SAP period. The PRA findings suggest some regional variation in consumption of food and other basic needs. Consumption declined in the intensely irrigated village for both men and women, with gender differentials having been maintained. Women were found to be better off in the moderately irrigated village in terms of consumption of basic needs, particularly clothing and medical services, with gender differentials having narrowed down over time. The main factor appears to have been interventionist measures, such as access to NGO credit and other services. f) Conclusion and Recommendations: Several conclusions can be made about the effect of SAP on women in Bangladesh. It appears from the review that the SAP design and framework did not adequately address gender issues. This is due to the focus of SAP on efficiency, growth, and liberalization of markets, ignoring income and other forms of inequality, including that between men and women. It also ignores structural features and constraints, treating the economy as one undifferentiated market. The gender strategy papers of the World Bank similarly ignore the macroeconomic policies and their impact on women, especially the effects of privatization and liberalization on wages, working conditions, employment, food security and well-being of women. It has been further argued in this paper that SAP-led measures such as greater export-orientation of the economy have increased women's employment in the formal manufacturing sector, particularly in the RMG industry and the export processing zones. Interestingly however, this occurred in the context of a protected global market for apparels and special incentives provided by the government. Further liberalization of this market may in fact jeopardize women's employment in the RMG industry by subjecting the latter to greater international competition. This gain in employment has however to be weighed against lower job quality, wages and occupational safety in the export-led RMG industry. On the other hand, structural adjustment measures have led to widespread retrenchment of workers, including women workers, for whom there has been very little alternative job creation. This welfare aspect was completely ignored in the design of SAP. Women agricultural workers are found to be similarly displaced due to changes in crop-mix, while hand-loom producers have faced greater underemployment and loss of earnings, due to greater import competitiveness of the economy. It is also important to recognize that in the context of Bangladesh, interventionist measures such as the micro-credit program of Grameen Bank and other NGOs have made an important impact in terms of increasing the income opportunities of women through self employment. In terms of social sector expenditures, SAP has not negatively impacted women since public expenditure on education and health were not reduced. The expenditure on health has however been very low, and there is need to focus on quality and outcomes in both the education and health
9
sectors. The social safety nets at present are found to be limited in coverage, and not enough to counterbalance the impact of withdrawal of food and input subsidies. The recommendations which follow from this study are to continue the prioritization in social sector spending, particularly, expenditure on health, and improving the quality and access to education and health care for women. Similarly, industrial restructuring should not focus simply on privatization or rationalising the labour force, but also on modernizing the capital equipment, better supply of raw materials including electricity, improved management practices and better industrial relations to increase productivity and efficiency of the industries concerned. While both men and women workers would stand to gain from such policies, there is need to devise additional schemes for displaced women workers in urban and rural areas. On the other hand, a much better focus has to be given to improving working conditions in the new export industries, mainly employing female labour, such as the RMG industry. In conclusion, it can be stated that an appropriate macro policy regime should be focussed not only on efficiency, but also on equality. Efficiency again does not imply simply a change of ownership i.e. privatization, but a much wider set of measures including better regulation of markets, and organizational support and interventions in support of women.
10
References: Bhattacharya and Rahman (1999), "Female Employment Under Export-Propelled Industrialization, Prospects for Internalizing Global Opportunities in Bangladesh's Apparel Sector", United Nations Research Institute for Social Development, Geneva, 1999. ILO (1999), "Retraining and Redeployment of Workers affected by Privatization in Bangladesh", Draft report, May 1999. Khundker, N. and R. Kibria (1999), Aid and Budget Restructuring in Bangladesh (the 20/20 study), UNICEF, Dhaka (mimeo) LFS, 1982/83, 1991-92, Labour Force Survey, Bangladesh Bureau of Statistics. World Bank (1990 a), Bangladesh: Review of the Experience with Policy Reforms in the 1980s. World Bank, Operation Evaluation Department, World Bank, Washington, D.C., June 29, 1990.
11
Table 1: Retrenchment of Manpower from State Owned Enterprises in Manufacturing Sectors since Privatization Started
Error! Bookmark not defined. Sector/Corporations
Retrenchment
Up to 30 June 1996 (Cumulative
1 July 1996 to 30 June 1997
Up to 30 June 1997 (Cumulative)
No. % No. % No. %
Bangladesh Textile Mills Corporation (BTMC) Bangladesh Steel & Engr. Corporation (BSEC) Bangladesh Sugar & Food Industries Corporation (BSFIC) Bangladesh Chemical Industries Corporation (BCIC0 Bangladesh Forest Industries Development Corporation(BFIDC) Bangladesh Jute Mills Corporation (BJMC)
No. % No. % No. % No. % No. % No. %
15 905 64.7 2 491 2 573 81.9 1 173 100 974 100 38 728 67.5
25.7 4 92.5 4.2 1.9 1.6 62.6
8 680 35.3 201 568 - - 18 678 32.5
30.9 0.7 7.5 2 18.1 - - 66.4
24 585 2 692 3 141 1 173 100 974 100 57 406 100
27.3 100 30 100 3.5 100 1.3 1.1 63.8
Total No. %
61 844 68.7
100 28 127 31.3
100 89 971 100
100
Source: Different Corporations; and Monitoring Cell, Ministry of Finance, GOB, ILO, 1999. Table 2: Trend in nominal and real wage in garments by skill category
12
Error! Bookmark not defined. Taka per month
Worker category 1980 1985 1988 1990 1993 1997 % change (1980-1997)
Trainee/helper - Nominal 130 300 400 500 500 500 - - Real 195 300 267 337 296 242 24.10 Semi-skilled - Nominal 300 500 600 800 1000 1000 - - Real 423 500 420 540 591 484 14.42 Skilled - Nominal 500 800 1000 1500 1800 2200 - - Real 760 800 762 1012 1064 1065 40.13
Source: Bhattacharya and Rahman 1999.
13
Table 3: Real wage rate indices of industrial workers (all employees) (Base: 1985-86=100)
Error! Bookmark not defined. BSIC 1986 Code Name of Industry
Indices
1989-90 1990-91 1991-92
311-312 Food Manufacturing 133 124 143 313 Beverage industries 77 61 99 314 Tobacco manufacturing 71 47 48 315 Animal feeds manufacturing 80 78 78 321-322 Textile manufacturing 112 99 98 323 Wearing apparel(except footwear) 86 87 84 324 Leather and leather products 96 94 99 325 Leather footwear(except rubber & plastic) 44 46 39 326 Ginning, pressing & baling of fibres 104 94 91 331 Wood and wood cork products 102 89 110 332 Wooden furniture & fixture manufacturing 50 54 59 341 Paper and paper products 107 96 127 342 Printing and publishing industries 124 89 118 351 Drugs and pharmaceutical products 102 117 120 352 Industrial chemicals 96 81 91 353 Other chemical products 96 53 60 354 Petroleum refining 174 168 197 355 Misc. petroleum, coal products 138 102 109 356 Rubber products 79 75 81 357 Plastic products N.E.C. 119 106 150 361 Pottery, China & earthenware 128 116 83 362 Glass and glass products 115 55 128 369 Non-metallic mineral products 111 91 118 371 Iron & steel basic industries 73 90 88 372 Non-ferious metal basic Ind. 81 65 101 381-382 Fabricated metal products 83 84 88 383 Non-electrical machinery 92 101 90 384 Electrical machinery 73 66 66 385 Transport equipment 86 88 88 386 Scientific, measuring instruments & Eqp. 155 125 131 387 Photographic & optical goods 85 89 108 393-394 Other manufacturing industries 89 84 78 Total: All Industries 112 96 96
Source: C.M.I., B.B.S.
14
Table 4: Weekly Earnings of Paid Workers During the Reference Week.
Error! Bookmark not defined.Weekly earnings (Tk.)
1983-84 1984-85
Urban Rural Urban Rural
M F M F M F M F
Below 50 50 - 99 100 - 149 150 - 199 200 - 249 250 - 299 300 & above
2.6 26.9 5.9 42.6 12.5 40.3 34.3 42.3 20.3 18.1 33.3 9.4 20.4 4.8 13.9 2.1 16.3 4.8 8.2 1.8 7.3 2.8 1.7 1.2 20.6 2.5 2.5 0.5
1.1 10.6 3.5 28.6 5.8 31.5 23.0 38.8 14.6 27.1 36.1 18.1 14.8 9.4 15.8 9.0 17.5 6.3 12.9 4.0 12.3 5.8 3.5 0.6 33.9 9.3 4.6 5.2
Contd. below
Error! Bookmark not defined.Weekly earnings (Tk.)
1990-91
Urban Rural
M F M F
Below 50 50 - 99 100 - 149 150 - 199 200 - 249 250 - 299 300 & above
24.5 19.5 61.5 18.8 3.0 19.0 2.3 20.8 3.5 18.5 5.2 14.6 2.2 6.0 4.1 3.2 3.4 4.6 4.0 2.3 7.0 4.6 5.1 1.7 56.4 27.8 17.8 8.7
Source: BBS, Statistical Yearbook, various years.
15
Table 5: Average Wage Rate (without food) of Agricultural Labourers
Error! Bookmark not defined. Year
Daily wages rate (without food) of agricultural labour
Real daily wage rate (without food) of agricultural labour (1969-70 constant prices)
Both sex Male Female Both sex Male Female
1973-74 1974-75 1975-76 1976-77 1977-78 1978-79 1979-80 1980-81 1981-82 1982-83 1983-84 1984-85
6.60 6.69 3.23 8.93 9.05 4.73 8.70 8.82 4.26 8.81 8.93 4.31 9.31 9.44 4.56 10.73 10.88 5.25 12.29 12.46 6.02 13.78 13.97 6.75 15.27 15.48 7.48 16.82 17.05 8.23 19.31 19.58 9.46 24.21 24.54 11.85
2.61 2.65 1.28 2.19 2.22 1.07 2.29 2.32 1.12 2.31 2.34 1.13 2.11 2.14 1.03 2.21 2.24 1.08 2.19 2.22 1.07 2.19 2.22 1.07 2.15 2.18 1.05 2.22 2.25 1.09 2.32 2.35 1.13 2.59 2.63 1.27
Table 6: Daily Wages of Agricultural Labour (without food) as percentage of 3.5 seers (33.27 KG) of Rural Price of Rice (Coarse)
Error! Bookmark not defined. Years
Daily wage rate (without food) of agricultural labour (Tk. per person)
Rural price of rice (Coarse) per seer (In Tk.)
Daily wages as percentage of 3.5 seers of rural price of rice
Both sex
Male Female Both sex Male Female
1978-79 1979-80 1980-81 1981-82 1982-83 1983-84 1984-85
10.73 10.88 5.25 12.29 12.46 6.02 13.78 13.97 6.75 15.27 15.48 7.48 16.82 17.05 8.23 19.31 19.58 9.46 24.21 24.54 11.85
3.92 5.28 4.56 5.84 6.31 6.99 8.08
78.21 79.30 38.27 66.50 67.42 32.58 66.34 87.53 42.29 74.71 75.73 36.59 76.18 77.22 37.27 78.96 80.05 38.68 85.82 86.99 42.01
Note: Under the minimum (rural) wage ordinance, daily rural wage rate should not be less than the going market price of 3.5 seers of (coarse) rice. A comparison has been made here between the trends in wage rates and rural prices of coarse rice. Source: BBS, "Socio Economic Indicators of Bangladesh", July, 1986, p.90.
16
Table 7: Net availability and per capita availability of foodgrains for domestic consumption (Concld.)
Error! Bookmark not defined. Year
Net availability of foodgrains excluding minor cereals for consumption ('000'M.tons)(d)
Per capita consumption of foodgrains excluding minor cereals (Quantity)
Net availability of foodgrains including minor cereals for consumption ('000'M.tons)(f)
Per capita consumption including minor cereals (Quantity)
(kg.per annum)
(kg.per day)
Index (e)
(kg.per annum)
Index (e)
1982-83 1983-84 1984-85 1985-86 1986-87 1987-88 1988-89 1989-90 1990-91 1991-92 1992-93 1993-94 1994-95 1995-96
16678 17109 17899 16878 18022 18182 18684 19489 19981 20169 19215 19910 20742 21215
178.4 0.49 106.5 183.6 0.50 108.7 169.8 0.47 102.2 177.6 0.49 106.5 175.8 0.48 104.3 177.1 0.49 106.5 181.3 0.50 108.7 182.3 0.50 108.7 181.1 0.50 108.7 169.7 0.47 102.2 169.2 0.46 100.00 173.0 0.47 102.17 173.8 0.48 104.35
16723 17143 17932 16906 18043 18266 18766 19571 20061 20238 19281 19981 20812 21283
178.9 105.9 179.6 106.3 183.9 108.9 170.1 100.7 177.8 105.3 176.7 104.6 177.9 105.3 182.1 107.8 183.0 108.3 181.7 107.6 170.3 100.8 169.8 100.5 173.6 102.8 174.3 103.2
Note: (a) Estimated population as on 1 January. (b) Deduction for seeds, wastage, etc. has been taken as 2.43% of total production of rice and 3.01% of total production of wheat (Master survey of Agriculture). (c) Deduction for seeds has been taken as 2.5% of total production. (d) Net availability of foodgrains-(net production-internal procurement)+ off take from ration distribution. (e) Five years average from 1965-66 to 1969-70=100. (f) Minor cereals include barley, jowar, bajra, ragi and other cerea ls. Source: National income, B.B.S.
17
Table 8: Consumer price index for rural families at Dhaka, Chittagong, Khulna and Rajshahi (Base : 1973-74=100)
Error! Bookmark not defined. Year
Food
Fuel & lighting
Housing & household requisites Clothing & footwear
Miscell-aneous
General
1988-89 1989-90 1990-91 1991-92 1992-93 1993-94 1994-95 1995-96 1996-97 1997-98 1988-89 1989-90 1990-91 1991-92 1992-93 1993-94 1994-95 1995-96 1996-97 1997-98 1988-89 1989-90 1990-91 1991-92 1992-93 1993-94 1994-95 1995-96 1996-97 1997-98 1988-89 1989-90 1990-91 1991-92 1992-93 1993-94 1994-95 1995-96 1996-97 1997-98
449 463 493 526 516 526 579 626 613 652 492 509 537 562 554 568 615 664 646 680 422 439 457 488 489 510 557 595 587 613 448 469 491 520 522 546 596 645 636 666
359 386 523 560 589 608 614 622 629 645 390 408 580 627 654 675 689 695 700 712 611 630 1007 1083 1084 1109 1128 1147 1161 1181 629 665 972 1057 1086 1107 1124 1141 1161 1188
Dhaka(former district) 795 889 978 1021 1033 1047 1075 1112 1147 1202 Chittagong(former district) 758 852 910 1024 1071 1133 1176 1224 1265 1348 Khulna(former district) 642 730 780 814 844 871 915 960 997 1047 Rajshahi(former district) 550 616 648 695 728 765 793 822 851 899
830 936 1025 1082 1120 1151 1182 1208 1234 1282 658 704 730 758 794 832 866 897 915 956 366 408 437 460 483 501 513 525 540 565 337 358 370 384 401 415 424 427 432 448
435 522 561 598 637 661 681 700 704 728 473 569 600 647 690 712 745 782 798 813 481 584 609 642 694 729 759 782 781 800 555 688 729 759 838 859 875 920 927 935
480 510 556 591 593 606 650 690 685 722 508 540 582 617 623 642 685 729 722 756 445 470 524 580 565 598 629 663 659 685 467 496 543 577 586 609 653 696 692 721
Source: Price Section, B.B.S.
18
Table 9 : Prevalence of Wasting (acute malnutrition by area of residence) (Children aged 6-71 months)
Error! Bookmark not defined. Year
National Rural Urban
Girls Boys Girls Boys Girls Boys
1985-86 1989-90 1992
9.5 9.2 6.6
6.8 8.1 7.4
9.8 9.4 6.6
6.8 8.2 7.7
7.1 7.6 6.2
6.7 7.0 4.8
Source: Child Nutritional Survey, BBS. Table 10: Prevalence of Stunting (Chronic malnutrition) by area of residence (Children aged 6-71 months)
Error! Bookmark not defined. Year
National Rural Urban
Girls Boys Girls Boys Girls Boys
1985-86 1989-90 1992
57.6 51.3 47.6
54.8 50.8 43.8
59.1 52.3 48.6
56.3 52.1 44.9
46.1 42.0 39.8
42.4 42.5 35.1
Source: Child Nutritional Survey, 1992, BBS.