fatigue life of damaged bridge deck panels … life of damaged bridge deck panels strengthened with...
TRANSCRIPT

1
Fatigue Life of Damaged Bridge Deck Panels Strengthened With Carbon Fiber
Sheets
Hongseob Oh, Jongsung Sim, and Christian Meyer
ABSTRACT
To simulate fatigue damage to bridge deck slabs, cyclic loading was applied to test panels, which were
then reinforced with carbon fiber sheets (CFS) using two different methods. Subsequently, the
strengthened panels were tested under cyclic loads. The observed response to fatigue loads differed
markedly from the results of static tests. Isotropic reinforcement was found to be more effective than
unidirectional strengthening. A simple life span prediction method is proposed for bridge decks, based on
cumulative damage theory.
Keywords: bridge deck slab, carbon fiber sheets, fatigue resistance, cumulative damage theory,
strengthening methods
A considerable body of knowledge exists of the response of metal structures to repeated loads.
Microscopic flaws, inclusions, and other stress raisers give rise to an initiating crack, which under
multiple load application grows and propagates to become critical and eventually lead to failure. This
phenomenon is generally known as “fatigue”. 1 The theory is well-established for metals, and modern
metal structures subjected to multiple load applications, such as aircraft structures and railroad bridges are
routinely designed on the basis of this theory.
2
In the case of reinforced concrete structures, the situation is more complicated because of the complex
nature of their response to load. Concrete contains numerous pores and microcracks, even before any load
application. The nature of crack propagation and eventual fracture are subject to numerous influence
factors, such as specific mix design parameters and environmental conditions (e.g. humidity), which
complicate the fatigue behavior and make the development of a general theory a difficult undertaking. It is
known that the failure modes of concrete structures under cyclic or dynamic loads can be different than
under monotonically applied static loads.2-7 This fact needs to be considered when methods to repair or
strengthen damaged structures are contemplated.
Although the behavior of concrete bridge decks has been studied by various authors with respect to
damage accumulation and fatigue failure2, relatively little knowledge exists on how to systematically
strengthen such bridge decks. For monotonically applied static loads an in-depth evaluation of different
strengthening schemes using carbon fiber sheets (CFS) was presented elsewhere. 8 It is the objective of the
current work to present the results of an experimental investigation which was conducted to evaluate
bridge decks strengthened with CFS and subjected to repeated load applications. The other purpose of this
study was to explore the suitability of a simplified cumulative damage theory for RC structural members
Hongseob Oh is a research professor in the Department of Civil & Environmental Engineering at Hanyang University, Ansan,
Korea. He received his Master’s and PhD degree in civil engineering from Hanyang University, Seoul, in 1996 and 2001,
respectively. He has been working for the last several years in strengthening techniques of concrete structures.
ACI Member Jongsung Sim is a professor in the Department of Civil & Environmental Engineering at Hanyang University,
Ansan, Korea. He received his Master’s and Ph D degree from Michigan State University, in 1984 and 1987, respectively. His
recent research interests include fiber reinforced concrete, rehabilitation technique of reinforced concrete structures and recycling
of concrete material.
ACI Fellow Christian Meyer is a professor in the Department of Civil Engineering and Engineering Mechanics at Columbia
University, New York. He is a member of ACI Committees 446, Fracture Mechanics, 447, Finite Element Analysis of Concrete
Structures, 544, Fiber Reinforced Concrete, and he currently chairs ACI Committee 555, Concrete with Recycled Materials. His
research interests are concrete materials science and technology and the utilization of recycled materials.
3
as a tool to decide on strengthening strategies.
RESEARCH SIGNIFICANCE
Concrete bridge decks are strengthened either to restore their decreased load-carrying capacity or to
extend their fatigue life. If the main purpose is an extension of fatigue life and endurance limit, then such
improvement needs to be quantified. At present, methods to determine the remaining life of deteriorated
bridge decks as well as strengthened decks are woefully inadequate. The experimental results reported in
this study provide useful information in this regard and permit a comparison of the effectiveness of two
different strengthening patterns with carbon fiber sheets. A simple theoretical method is proposed to
predict the fatigue life of both deteriorated and strengthened bridge decks.
FATIGUE DAMAGE CONCEPT FOR STRENGTHENING
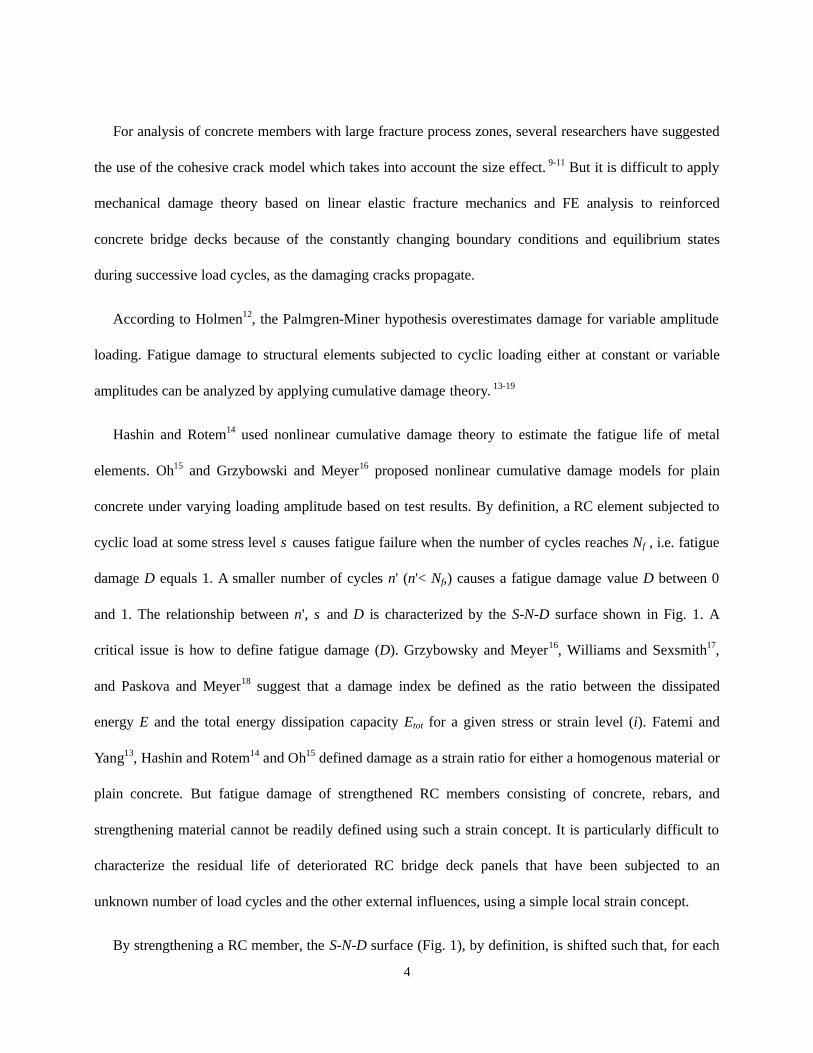
Classical linear fatigue damage theory dates back to the observation by August Wöhler that the number
of load cycles up to failure, N, correlates strongly with the applied stress level, S. In actual structures, the
situation is complicated by the fact that stress amplitudes vary greatly from load cycle to load cycle. The
most commonly held assumption, based on the well-known Palmgren-Miner hypothesis, holds that
damage accumulates linearly, according to the equation,
11
=∑=
k
i i
i
Nn
(1)
where in is the number of applied load cycles causing a certain stress level is , and iN is the
corresponding number of cycles at which stress level is leads to failure.
4
For analysis of concrete members with large fracture process zones, several researchers have suggested
the use of the cohesive crack model which takes into account the size effect. 9-11 But it is difficult to apply
mechanical damage theory based on linear elastic fracture mechanics and FE analysis to reinforced
concrete bridge decks because of the constantly changing boundary conditions and equilibrium states
during successive load cycles, as the damaging cracks propagate.
According to Holmen12, the Palmgren-Miner hypothesis overestimates damage for variable amplitude
loading. Fatigue damage to structural elements subjected to cyclic loading either at constant or variable
amplitudes can be analyzed by applying cumulative damage theory. 13-19
Hashin and Rotem14 used nonlinear cumulative damage theory to estimate the fatigue life of metal
elements. Oh15 and Grzybowski and Meyer16 proposed nonlinear cumulative damage models for plain
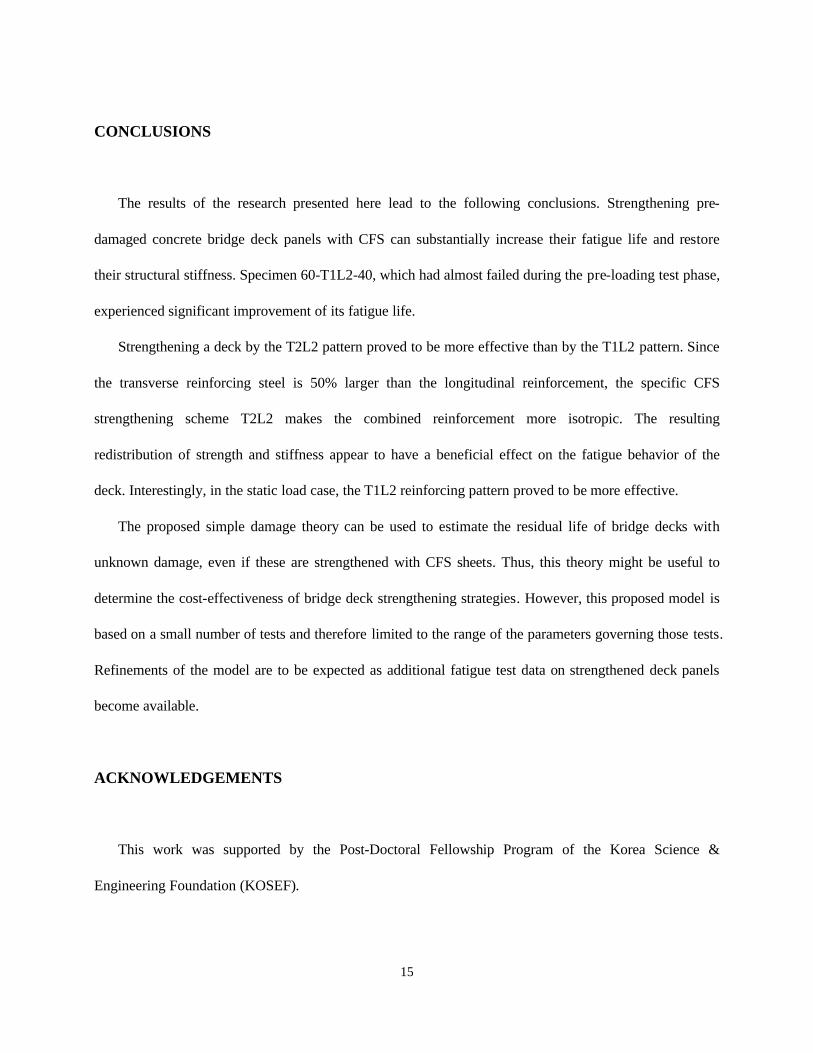
concrete under varying loading amplitude based on test results. By definition, a RC element subjected to
cyclic load at some stress level s causes fatigue failure when the number of cycles reaches Nf , i.e. fatigue
damage D equals 1. A smaller number of cycles n' (n'< Nf,) causes a fatigue damage value D between 0
and 1. The relationship between n', s and D is characterized by the S-N-D surface shown in Fig. 1. A
critical issue is how to define fatigue damage (D). Grzybowsky and Meyer16, Williams and Sexsmith17,
and Paskova and Meyer18 suggest that a damage index be defined as the ratio between the dissipated
energy E and the total energy dissipation capacity Etot for a given stress or strain level (i). Fatemi and
Yang13, Hashin and Rotem14 and Oh15 defined damage as a strain ratio for either a homogenous material or
plain concrete. But fatigue damage of strengthened RC members consisting of concrete, rebars, and
strengthening material cannot be readily defined using such a strain concept. It is particularly difficult to
characterize the residual life of deteriorated RC bridge deck panels that have been subjected to an
unknown number of load cycles and the other external influences, using a simple local strain concept.
By strengthening a RC member, the S-N-D surface (Fig. 1), by definition, is shifted such that, for each
5
combination of stress level and number of load cycles, a smaller damage level is to be expected. However,
whereas the degradation of a member’s load-carrying capacity can be assessed either experimentally or
analytically, it is not straightforward to quantify the effect of strengthening measures taken to improve the
fatigue behavior of a member that has been damaged before being strengthened. In this study, fatigue
damage of deck panels before and after strengthening is evaluated, taking their load-displacement
relationship as representative for overall structural response. Standard composite RC theory as described
in Ref. 8 is used to assess the static load-carrying capacity of unstrengthened and strengthened RC
members.
The authors have previously reported8 that two-directional strengthening with CFS strips is more
effective than any other strengthening scheme, if the load is applied statically. In order to effectively
extend the fatigue life of a bridge deck by strengthening, the fatigue damage experienced prior to
strengthening must be taken into account. For a fatigue damage theory to quantify the enhancement due to
strengthening, all these factors need to be included.
EXPERIMENTAL TEST PROGRAM
Specimens
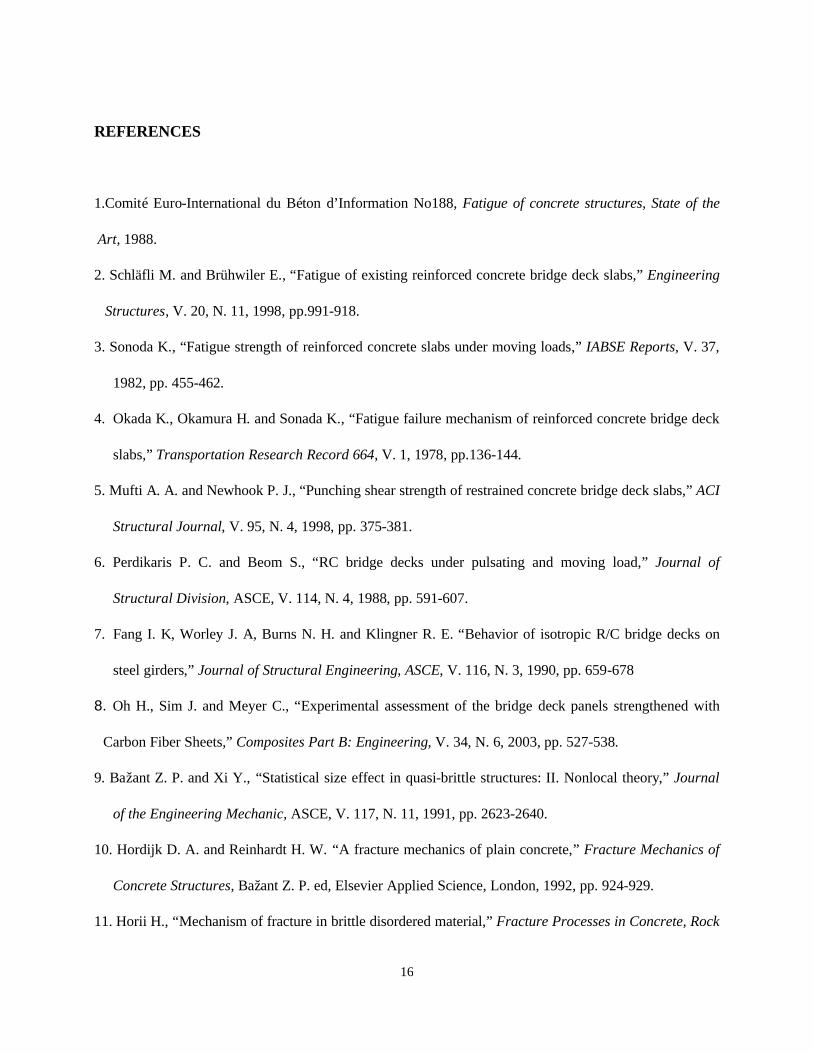
Four two-way RC slab specimens were constructed, Fig. 2. A prototype deck panel of dimensions 160
by 240 cm and 22 cm thickness, supported by two girders was selected to simulate a real bridge deck. In
the transverse direction, the reinforcement ratio was 0.551%, and in the longitudinal direction, it was 67%
of this amount, i.e. 0.367%. The panels, considered to be representative of secondary bridge decks used in
Korea, are designed for traffic loads similar to HS20 trucks.

6
Materials
The concrete used for the specimens consisted of ordinary Portland cement, natural sand, and crushed
coarse aggregate with a maximum size of 25 mm. The mixture had a 28-day cylinder strength of 31 MPa.
Deformed bars 15.9 and 9.35 mm in diameter (D16 and D10) with average yield strength of 300 MPa
were used to reinforce the slab panels and beams. The shear reinforcement of the edge beams consisted of
9.35-mm diameter closed stirrups.
The carbon fiber sheets (CFS) used to strengthen the damaged slabs had an ultimate strength of 3,550
MPa, a Young’s modulus of 2.35×10⁵ MPa, and an ultimate strain of 1.5%. The properties of the materials
used in the specimens are listed in Table 1. The CFS were bonded to the deck panels in an upside-down
position as follows. To remove all laitance and smoothen the surface, the deck area was ground by hand
and cleaned afterwards with compressed air. A resin was applied as a primer by roller and cured for 24
hours with a protective cover to keep it dry. After blending the epoxy adhesive in a suitable container, it
was spread by roller evenly over the bottom surface of the deck. CFS were then attached to the epoxy-
coated surface and further pressed into the epoxy coating with a screw type roller until they were
completely immersed and no air voids between the concrete and the sheets remained. The strengthened
panels were then cured for at least 10 days before testing. For panels with both longitudinal and transverse
CFS strengthening, the CFS in the longitudinal direction were attached first.
Test set-up, test procedures, and measurements
The test set-up is illustrated in Fig. 2b. The specimens were supported by hinge supports. A 250 × 500-
mm rectangular steel plate and rubber pad simulated the contact surface of a truck wheel, and the load was
applied at a rate of 2 Hz by an actuator with a capacity of 500 kN. The rubber pad was inserted to avoid
stress concentrations. Data were recorded by an automated data acquisition system.
7
Linear variable displacement transducers (LVDTs) were used to obtain deflection profiles along the
slab center line. Concrete strain gauges attached in the longitudinal and transverse direction at midspan to
the compressive deck surface measured the concrete strain variations, and electrical resistance strain
gauges were bonded to the main reinforcement and CFS to obtain strain profiles (see Fig. 2a).
Test program
All four test specimens were loaded cyclically such as to incur fatigue damage, before they were
strengthened. The load levels for this part of the test program were selected such that the reinforcing bars
were stressed to either 40% or 60% of their yield strengths, as obtained from previous static test results
and summarized in Table 2. Those panels whose bars were stressed to 40% yield underwent 200,000 load
cycles, whereas those whose bars were stressed to 60% yield were exposed to either 10,000 or 100,000
load cycles (Table 3).
After having been damaged by such “precycling”, the specimens were repaired by injecting epoxy
into the cracks and strengthened with CFS using either the T1L2 or T2L2 schemes shown in Fig. 3. In
both schemes, five 15 cm wide CFS strips were attached in the longitudinal direction (L). In scheme T1L2,
five 15 cm wide T1L2 CFS strips were also attached in the transverse direction (T), whereas in the T2L2
scheme, three 12.5 cm wide strips were attached in the transverse direction. The specimens were allowed
to cure for 14 days before further testing.
Because of the different strengthening patterns, the same applied load caused different stresses in the
reinforcing bars of the two panels. Thus, after strengthening, the two panels that had been precycled to
40% of the rebar yield strength, were loaded cyclically with 122.5 kN. This load, equivalent to an actual
wheel load on a real bridge deck, stressed the steel bars to 70% or 80% of their yield strengths, depending
8
on which strengthening pattern was used (Table 2), e.g. specimen 40-T1L2-70 was precycled with 40% of
the rebar yield load, then strengthened by the T1L2 scheme, and finally subjected to cyclic loads with 70%
of the rebar yield load (Tables 2 and 3). The panels that had been precycled to 60% of the rebar yield
strength were subjected after strengthening to cyclic loads which caused either 40% or 50% of yield in the
rebars (see Table 3), again for the same applied load amplitude.
TEST RESULTS AND DISCUSSION
Crack patterns and failure modes
The crack patterns of test panels caused by monotonic loads in the previous test are depicted in Fig. 4,
while Fig. 5 shows the propagation of the cracks experienced by unstrengthened decks exposed to 60% of
rebar yield loads in the current cyclic load test. The unstrengthened reference panel CON failed in biaxial
bending under monotonic loading. Initially, cracks developed in the longitudinal direction, and as the load
increased, also transverse cracks appeared that propagated from the initial longitudinal cracks up to failure.
The crack propagations in unstrengthened decks under cyclic loads, depicted in Fig. 5, were slightly
different from those of the reference panel CON. The longitudinal cracks in specimens subjected to
fatigue loads were more developed than in the CON specimen. In the unstrengthened panel, two-
directionally developed initial cracks dispersed to the panel edges as load cycling proceeded.
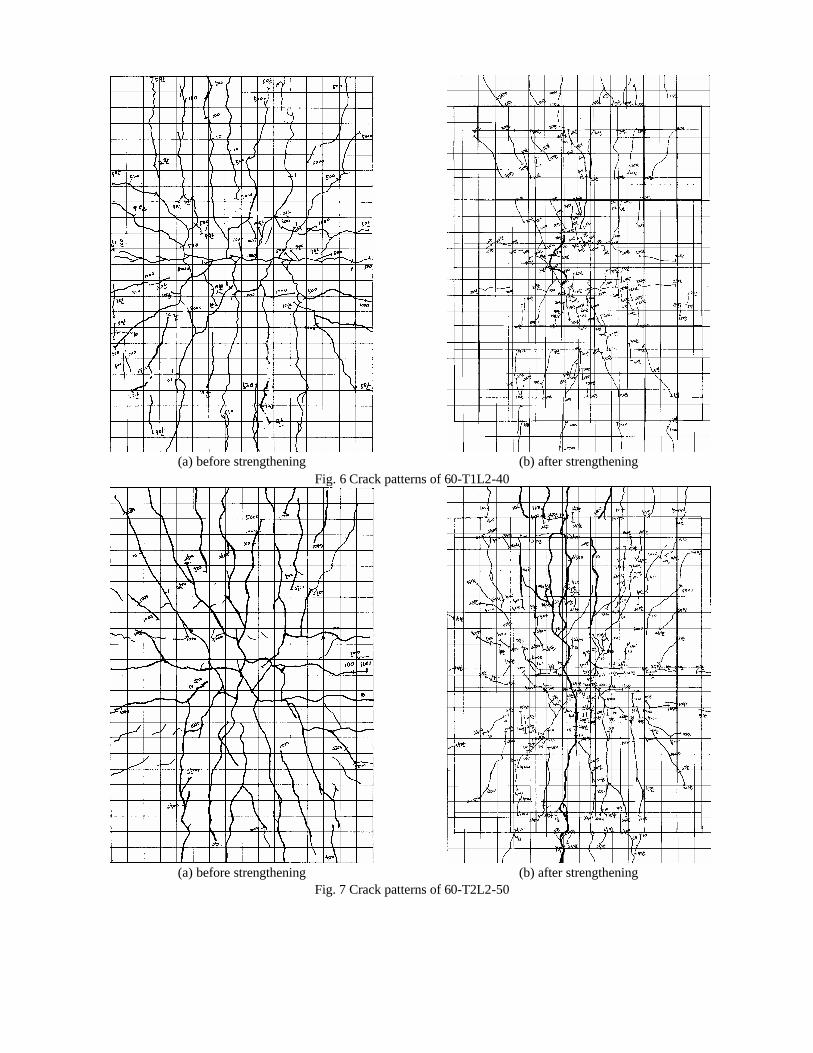
Typical crack patterns of two deck specimens before and after strengthening are shown in Figs. 6 and
7. They were similar to those that can be observed in real bridge decks. Prior to strengthening, the panels
9
developed the crack patterns of Figs 6a and 7a. As expected, the cracks in panels subjected to higher loads
(60-T1L2-40 and 60-T2L2-50) were wider that those of panels that received lower loads (40-T1L2-70 and
40-T2L2-80) not shown here.
After panels 40-T1L2-70 and 40-T2L2-80 were strengthened and again loaded cyclically, they
experienced partial delamination of the carbon fiber sheets after excessive flexural cracking. Yet, because
the CFS distributed tensile stresses and kept the flexural cracks relatively small, complete debonding did
not occur. Because of the good bond between concrete and CFS reinforcement, no dominant large cracks
were able to develop, only numerous closely spaced small-sized cracks. The crack patterns of panels 60-
T1L2-40 and 60-T2L2-50 after strengthening were strongly influenced by those produced in the pre-
cycled deck panels prior to strengthening. After strengthening, the newly developed flexural crack patterns
appeared to be very similar to the original patterns observed after preloading. Of course, the CFS had to be
removed to expose those cracks.
In the previous study8 it was observed that under static loads, all unstrengthened and two-directionally
strengthened decks exhibited typical flexural failure modes. The four test specimens of the present
investigation, which were subjected to cyclic loads, all failed eventually in a brittle mode after rupture of
the transverse carbon fiber sheets.
Load-displacement relationships
The numbers of load cycles to failure for the various specimens are listed in Table 3. Load-
displacement curves for representative load cycles are depicted in Figs 8 and 9 for two panels before and
after strengthening. All displacements shown represent absolute values, i.e. they include all permanent
deflections experienced during prior load cycles. The load-deformation curves of Figs 8 and 9 indicate that
the fatigue life of a specimen can be divided into three phases: (1) an initial damage phase, which may last

10
for about 10 cycles, with rapidly increasing permanent displacements, (2) a steady-state damage
accumulation phase with much smaller residual displacement increments, and (3) a final fatigue damage
phase. As expected, structural response during the first load cycle was comparable to that observed under
static load. Likewise, the maximum displacements experienced during the final load cycle before failure
were comparable to those recorded during the static load test. A similar observation has been made by
Otter and Naaman.20
In all cases the strengthening measures restored the original structural stiffness, as measured by the
initial slope of the load-displacement curve. For example, strengthening of panel 60-T1L2-40, which had
undergone plastic deformations during preloading, increased the stiffness by 50%, compared with that
exhibited after 100,000 load cycles in the preloading phase, not shown here.
Fig. 10 illustrates how the compliance of the various test panels changed as they underwent cyclic
loading. The compliance can be determined from a load-displacement or load-crack mouth-opening
displacement curve and can be used to measure the fatigue response of brittle materials. In this study, it is
defined as C = δ / P from the load-displacement curve. It is apparent that panel 60-T2L2-50, after
strengthening, experienced no fatigue failure and only a minimal increase of its compliance, while all
other panels experienced appreciable increases in compliance. This observation agrees with the stiffness
drops observed in Fig. 9.
Dissipated energy
The total energies dissipated before and after strengthening are illustrated in Fig. 11. Energy
dissipation during each load cycle was defined as the difference between the areas under the load-
displacement curves for loading and unloading. The total dissipated energies were then determined by
summing the dissipated energies for all load cycles up to failure. The energies dissipated by specimens

11
with lower stress levels after strengthening were considerably less than when stress levels were higher.
Panel 60-T2L2-50 which dissipated the least amount of energy before strengthening turned out to
dissipate the most after strengthening. This fact seems to indicate that fatigue life after strengthening
depends on the damage experienced before strengthening and can be further illustrated with the help of
Fig. 12, which shows the qualitative variation of relative stiffness during cyclic loading. An unstiffened
panel would have a normalized stiffness and fatigue life as characterized by curve A. Strengthening such a
panel before any load application will increase both its stiffness and fatigue life (curve B). If the panel is
strengthened after having experienced a modest amount of damage, a considerable increase of its
remaining fatigue life can be expected as a result of that strengthening (curve C). The experimental results
for panel 60-T2L2-50 indicate that the increase in fatigue life is pronounced even if the strengthening is
applied after a considerably larger amount of damage has been sustained (curve D). The extraordinary
increase in fatigue life of panel 60-T2L2-50 after strengthening far exceeds what should be expected and
therefore may simply be an experimental aberration. If the damage experienced during the pre-loading
phase was extensive and approached failure, the effect of strengthening on fatigue life extension should be
less dramatic (curve E).
This finding underscores the importance of the correct timing of strengthening a bridge deck panel,
which has undergone fatigue-type loading.
CUMULATIVE DAMAGE THEORY
One purpose of this study was to propose a simple procedure to estimate the remaining life of
deteriorated bridge decks and to assess quantitatively the increase in fatigue life due to strengthening. This
is a difficult task, because classical damage mechanics does not apply, since boundary conditions keep
12
changing as damage increases. Therefore, the method proposed herein is based on the empirical
information provided by the load-deformation relationships presented in the previous section. The load-
displacement relationship of a deck panel is a better representation of the structural deterioration than
some local stress-strain relationship conventionally adopted to characterize fatigue damage.
Fatigue damage shall be defined here as δ / δmax, where δ is the cumulative displacement at any load
cycle and δmax is the maximum displacement prior to failure. As pointed out earlier, δmax for cyclic loading
is very similar to the maximum displacement observed in a static test, for both unstrengthened and
strengthened panels, provided the same strengthening method is applied (see Table 4).
For design purposes, it is not advisable to rely on such a failure displacement, because it is difficult to
reliably determine it. Instead, it is suggested to substitute in the cyclic loading case a maximum
displacement 10% higher than that at which both transverse and longitudinal steel are expected to yield, as
determined by the test. This added safety margin is justified because repeated loading causes damage
which reduces the capacity of the deck for further load redistribution as compared with the static case.
In the case of strengthened deck panels, the maximum displacement is defined as that at which either
the CFS sheets fail or the concrete crushes in compression.
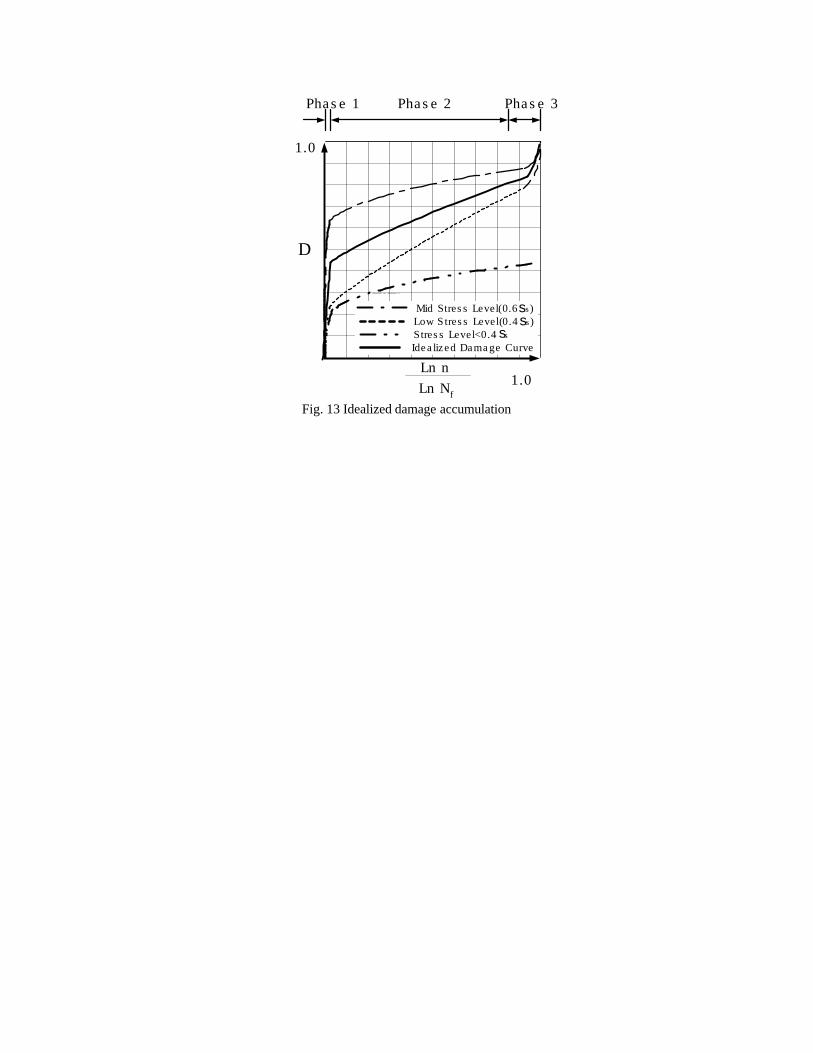
In Fig. 13, the three damage phases mentioned in the previous section are illustrated: In Phase I,
consisting of about 10 cycles, the first load cycle introduces a considerable amount of damage, whereas
the subsequent cycles of Phase II cause damage increments of decreasing magnitude. In Phase III, fatigue
damage accelerates, leading to failure within 1000 to 5000 cycles. Based on a number of assumptions, a
degree of damage and the residual life of a damaged deck can be estimated for different stress levels.
The damage of Phase I is mostly due to that caused in the first load cycle, which is similar to that
produced in a static test with the same load, i.e.
maxδδ static
ID = n = 1 (2)

13
where staticδ is a function of stress level. In Phase II, the small increments in damage can be represented
by
f
IIII N
nD
lnln
β= eII nn ≤<1 (3)
where Nf is the number of cycles to failure at a given stress level, IIn is the number of load cycles actually
applied, β is the slope of the damage curve (Fig 13), and en is the number of cycles defining the end of
Phase II. en depends on the applied stress level and is assumed to be reached when the deck deflection
under cyclic loading is equal to 90% of the maximum deflection observed in a static test.
The slope β in Phase II can be estimated from the test results for different stress levels and expressed
in the form of a log function as follows,
2955.0)ln(644.1 −−=sP
Pβ (4)
where P is the applied cyclic load and sP the static failure load. In Phase III, fatigue damage can be
estimated as follows:
f
eIIIIII N
nnD
ln)ln( −
= γ fIIIe Nnn ≤<
(5)
where,
6215.0)(445.0 +=sP
Pγ (6)
The fatigue life for any load level can then be estimated by the following modified Miner’s rule16:
1)()(2
211
1
1 1
2
=+−−
f
DD
f Nn
Nn
(7)
where 1n and 2n are the number of load cycles with two different load levels actually applied; 1fN and
2fN are the corresponding numbers of load cycles to failure; 1D and 2D are the damage levels caused by

14
those load cycles. The exponent of the first term in Eq. 7 converts the damage produced by cycling with
load level 1 to an equivalent amount of damage, if 1n load cycles had been applied at load level 2. Using
Eq. 7, it is possible to predict the number of load cycles to failure. The results are listed in Table 5.
The fatigue life 'iN of a strengthened concrete slab for any stress level can be expressed as the sum of
fatigue life iN of the unstrengthened deck and the fatigue life extension 'sheetsN due to CFS sheets:
''sheetsii NNN += (8)
Alternatively, the remaining life of a deteriorated deck after strengthening is equal to the residual life
of the deteriorated deck and the fatigue life extension provided by the strengthening material. The residual
life of the deteriorated unstrengthened deck, 2n , can be estimated using Eq. 7. It now remains to
determine the fatigue life extension provided by the strengthening measure.
By adding the effect of the CFS, 'sheetsN , to the residual fatigue life of the unstrengthened deck,
1
1' 1
fi N
nN
−= (9)
after it has been converted to an equivalent number of cycles with the new load amplitudes, we obtain
1
))(1('
2
'2
1
1
'1,
11
1
12
'1
'1
'2
1
2=
+
+−
−
−
−−
f
D
D
fsheetsDD
ff
Nn
NNn
N
n (10)
Table 6 summarizes the theoretical predictions of fatigue life and compares them to the experimental
results.
15
CONCLUSIONS
The results of the research presented here lead to the following conclusions. Strengthening pre-
damaged concrete bridge deck panels with CFS can substantially increase their fatigue life and restore
their structural stiffness. Specimen 60-T1L2-40, which had almost failed during the pre-loading test phase,
experienced significant improvement of its fatigue life.
Strengthening a deck by the T2L2 pattern proved to be more effective than by the T1L2 pattern. Since
the transverse reinforcing steel is 50% larger than the longitudinal reinforcement, the specific CFS
strengthening scheme T2L2 makes the combined reinforcement more isotropic. The resulting
redistribution of strength and stiffness appear to have a beneficial effect on the fatigue behavior of the
deck. Interestingly, in the static load case, the T1L2 reinforcing pattern proved to be more effective.
The proposed simple damage theory can be used to estimate the residual life of bridge decks with
unknown damage, even if these are strengthened with CFS sheets. Thus, this theory might be useful to
determine the cost-effectiveness of bridge deck strengthening strategies. However, this proposed model is
based on a small number of tests and therefore limited to the range of the parameters governing those tests.
Refinements of the model are to be expected as additional fatigue test data on strengthened deck panels
become available.
ACKNOWLEDGEMENTS
This work was supported by the Post-Doctoral Fellowship Program of the Korea Science &
Engineering Foundation (KOSEF).
16
REFERENCES
1.Comité Euro-International du Béton d’Information No188, Fatigue of concrete structures, State of the
Art, 1988.
2. Schläfli M. and Brühwiler E., “Fatigue of existing reinforced concrete bridge deck slabs,” Engineering
Structures, V. 20, N. 11, 1998, pp.991-918.
3. Sonoda K., “Fatigue strength of reinforced concrete slabs under moving loads,” IABSE Reports, V. 37,
1982, pp. 455-462.
4. Okada K., Okamura H. and Sonada K., “Fatigue failure mechanism of reinforced concrete bridge deck
slabs,” Transportation Research Record 664, V. 1, 1978, pp.136-144.
5. Mufti A. A. and Newhook P. J., “Punching shear strength of restrained concrete bridge deck slabs,” ACI
Structural Journal, V. 95, N. 4, 1998, pp. 375-381.
6. Perdikaris P. C. and Beom S., “RC bridge decks under pulsating and moving load,” Journal of
Structural Division, ASCE, V. 114, N. 4, 1988, pp. 591-607.
7. Fang I. K, Worley J. A, Burns N. H. and Klingner R. E. “Behavior of isotropic R/C bridge decks on
steel girders,” Journal of Structural Engineering, ASCE, V. 116, N. 3, 1990, pp. 659-678
8. Oh H., Sim J. and Meyer C., “Experimental assessment of the bridge deck panels strengthened with
Carbon Fiber Sheets,” Composites Part B: Engineering, V. 34, N. 6, 2003, pp. 527-538.
9. Bažant Z. P. and Xi Y., “Statistical size effect in quasi-brittle structures: II. Nonlocal theory,” Journal
of the Engineering Mechanic, ASCE, V. 117, N. 11, 1991, pp. 2623-2640.
10. Hordijk D. A. and Reinhardt H. W. “A fracture mechanics of plain concrete,” Fracture Mechanics of
Concrete Structures, Bažant Z. P. ed, Elsevier Applied Science, London, 1992, pp. 924-929.
11. Horii H., “Mechanism of fracture in brittle disordered material,” Fracture Processes in Concrete, Rock

17
and Ceramics, J. G. M. van Mier, J. G. Rots and Abakker eds, E&FN Spon, London, 1991, pp. 95-110.
12. Holmen J. O., “Fatigue of concrete by constant and variable amplitude loading,” Fatigue of Concrete
Structures, ACI SP-75, Detroit, 71-110.
13. Fatemi A. and Yang L., “Cumulative fatigue damage and life prediction theories: a survey of the state
of the art for homogeneous materials,” International Journal of Fatigue, V. 20, N. 1, 1998, pp. 9-34.
14. Hashin Z and Rotem A. “A cumulative damage theory of fatigue failure,” Material Science and
Engineering, V. 34, 1978, pp. 147-160.
15. Oh B.W., “Fatigue Analysis of Plain Concrete in Flexure,” Journal of Structural Engineering, ASCE,
V. 112, N. 2, 1986, pp. 273-288.
16. Grzybowski M. and Meyer C., “Damage Accumulation in Concrete with and without Fiber
Reinforcement” ACI Materials Journal, V. 90, N. 6, 1993, pp. 594-604.
17. Williams M. S. and Sexsmith R. G., “Seismic assessment of concrete bridge using inelastic analysis,”
Engineering Structures, V. 19 N. 3, 1996, pp. 208-216.
18. Paskova T. and Meyer C., “Low-cycle Fatigue of Plain and Fiber-Reinforced Concrete,” ACI
Materials Journal, V. 94, N. 4, 1997, pp. 273-285.
19. Kujawski D. and Elyin F., “A cumulative damage theory of fatigue crack initiation and propagation,”
International Journal of Fatigue, V. 6, N. 2, 1984, pp. 83-88.
20. Otter D. E. and Naaman A. E. “Properties of Steel Fiber Reinforced Concrete Under Cyclic Load,” ACI
Materials Journal, V. 85, N. 4, 1988, pp. 254-261.
List of Tables
Table 1. Physical Properties of Materials
Table 2 Strengthening scheme and static test results (Ref. 8)
Table 3 Fatigue test variables
Table 4 Relationship between static deflection and cumulative deflection
Table 5 Residual life predictions for panels prior to strengthening
Table 6 Fatigue life prediction of pre-damaged and strengthened panels
List of Figures
Fig. 1 Conceptual S-N-D surface
Fig. 2 Test specimen details and test setup
Fig. 3 Strengthening schemes
Fig. 4 Crack patterns of deck panels subjected to monotonic loading
Fig. 5 Fatigue crack propagation of unstrengthened panel
Fig. 6 Crack patterns of 60-T1L2-40
Fig. 7 Crack patterns of 60-T2L2-50
Fig. 8 Load-displacement relationships through pre-damage and fatigue loading (40-T1L2-70)
Fig. 9 Load-displacement relationships through pre-damage and fatigue loading (40-T2L2-80)
Fig. 10 Time histories of compliances
Fig. 11 Total dissipated energy
Fig. 12 Schematic effect of strengthening on fatigue life and stiffness
Fig. 13 Idealized damage accumulation

Table 1 Physical Properties of Materials
Properties Materials
Yield strength, MPa
Ultimate strength, MPa
Modulus of elasticity, GPa
Ultimate strain
Reinforcing bars 300 350 200 -
CFS - 3,550. 235 1.5
Properties Materials
Compressive strength, MPa
Young’s modulus, GPa
Modulus of rigidity, GPa
Poisson’s ratio
Epoxy 88. 7.0 2.3 0.3
Concrete 31.0 26.0 8.6 0.18
Table 2 Strengthening scheme and static test results (Ref. 8)
Yield load (kN)
(rebar yield point)
Failure load (kN)
(CFS rupture or
kinking)
Strengthening
ratio )10,( 4−×⋅bh
Acfs Specimen
T L
Strengthening
scheme
Failure
mode
Test Theory Test Theory
CON - - Flexural-
shear
405
(Type 4)
605
(Type 4)
573
(Type 4) -
T1L2 1.875 2.344 Two-directional
strip
Flexural-
Shear
450
(Type 4)
638
(Type 2)
626
(Type 2)
573
(Type 4)
T2L2 0.9375 2.344 Two-directional
strip
Flexural-
Shear
520
(Type 4)
454
(Type 2)
638
(Type 2)
626
(Type 2)
Table 3 Fatigue test variables
Specimen Stress level for pre-damage*
No. of cycles for pre-damage
Strengthening scheme
Post-strengthening stress level**
No. of cycles to failure, fN
40-T1L2-70 40% of yield strength 200,000 T1L2 70% of yield
strength 55,868
40-T2L2-80 40% of yield strength 200,000 T2L2 80% of yield
strength 79,776
60-T1L2-40 60% of yield strength 100,000 T1L2 40% of yield
strength 262,911
60-T2L2-50 60% of yield strength 10,000 T2L2 50% of yield
strength -***
* : obtained from static test of control specimen ** : obtained from static test of T1L2 or T2L2 specimen ***: after completion of 750,000 cycles, static test to failure

Table 4 Relationship between static deflection and cumulative deflection
Cumulative deflection (mm) Strengthening type Maximum static
deflection (mm) 60-T1L2-40 60-T2L2-50 40-T1L2-70 40-T2L2-80
T1L2 21.2 22.03 20.73
T2L2 18.8 -* 18.42
DeflectionStatic
DeflectionCumulative - 104% 97.8% 98%
* - No fatigue failure
Table 5 Residual life predictions for panels prior to strengthening
IID TotalD = III DD + Expected Life ( 1N ) Residual Life ( 2n ) Specimen Cycles for
Pre-damage Eq. 3 Eq. 2 and 3 Eq. 7 Eq. 7
40-T1L2-70 200,000 0.112 0.3 over 108 over 108
40-T2L2-80 200,000 0.11 0.256 over 108 over 108
60-T1L2-40 100,000 0.582 0.887 130,862 30,862
60-T2L2-50 10,000 0.481 0.786 130,862 120,862
Table 6 Fatigue life predictions for pre-damaged and strengthened panels
Specimen S-N relationship Predicted fatigue life Experimental number of cycles to failure
40-T1L2-70 )ln(0274.01 nS −= 58,000 55,868
40-T2L2-80 )ln(0177.01 nS −= 85,000 79,776
60-T1L2-40 )ln(0477.01 nS −= 280,000 262,911
60-T2L2-50 )ln(0264.01 nS −= 1.64×10⁸ Static failure after 750,000
e8
e9
e10
e11
e12
e13
e14 0.0
0.2
0.4
0.60.8
1.0
0.5
0.6
0.7
0.8
0.9
1.0
S
D
Ln(n)
Fig. 1 Conceptual S-N-D surface (S-stress level, N-no. of load cycles, D-damage)
Top
Bottom
Top
C L 240
Top
Bottom
16020 20
2230
55
12
Bottom
Longitudinal direction
Steel strain gage Concrete strain gage LVDT
Transverse direction
a) Dimensions and reinforcement details (unit: cm) b) Test setup
Fig. 2 Test specimen details and test setup

15 cm
15 cm
15 cm
12.5 cm
a) T1L2 b) T2L2 Fig. 3 Strengthening schemes
(a) CON (b) T1L2 (C) T2L2 Fig. 4 Crack patterns of deck panels subjected to monotonic loading
(a) N=10 cycles (b) N=1,000 cycles (c) N=50,000 cycles
Fig. 5 Fatigue crack propagation of unstrengthened panel
(a) before strengthening (b) after strengthening
Fig. 6 Crack patterns of 60-T1L2-40
(a) before strengthening (b) after strengthening
Fig. 7 Crack patterns of 60-T2L2-50

0
100
200
300
400
500
600
700
0 5 10 15 20 25 30Displcem ent(m m )
Load
(kN) static
1
1000
100000
200000
Structural yielding
0
100
200
300
400
500
600
700
0 5 10 15 20 25 30Displcem ent(m m )
Load(kN) static
1
1000
10000
50000
Structural yielding loads
(a) before strengthening (b) after strengthening
Fig. 8 Load-displacement relationships through pre-damage and fatigue loading (40-T1L2-70)
0
100
200
300
400
500
600
700
0 5 10 15 20 25 30Displacem ent(m m )
Load
(kN) static
1
1000
100000
200000
Structural yielding loads
0
100
200
300
400
500
600
700
0 5 10 15 20 25 30Displacem ent(m m )
Load(kN)
static110010001000070000
Structural yielding loads
(a) before strengthening (b) after strengthening
Fig. 9 Load-displacement relationships through pre-damage and fatigue loading (40-T2L2-80)
0
0.1
0.2
0.3
0.4
0.5
0.6
0.7
0 50000 100000 150000 200000 250000 300000 350000 400000
No. of Cycles
Compliance(mm/tonf)
60-T1L2-40(unstrengthened) 60-T1L2-40(strengthened)60-T2L2-50(unstrengthened) 60-T2L2-50(strengthened)40-T1L2-70(unstrengthened) 40-T1L2-70(strengthened)40-T2L2-80(unstrengthened) 40-T2L2-80(strengthened)
Fig. 10 Time histories of compliances

0
500000
1000000
1500000
2000000
2500000
3000000
3500000
4000000
4500000
Tota
l Re
leas
edEn
ergy
(ton
f*mm
*N)
60-T1L2-40 60-T2L2-50 40-T1L2-70 40-T2L2-80
after strengthening
before strengthening
Fig. 11 Total dissipated energy
0
1
0 1 2Norm alized Fatigue Life
Normalized stiffness
Non-strengthenedStrengthened
A
BC
D
E
Fig. 12 Schematic effect of strengthening on fatigue life and stiffness
(strengthening applied at four different times)
D
Ln Nf
Phase 2 Phase 3Phase 1
1.0Ln n
1.0
M id Stress Level(0.6 s) sLow Stress Level(0.4 s) sStress Level<0.4 ssIdealized Dam age Curve
Fig. 13 Idealized damage accumulation