common pre-seen case study (kc1 to kc4) … pre-seen case study (kc1 ... need to rethink our...
TRANSCRIPT

Copyright Reserved
No. of pages: 20
COMMON PRE-SEEN CASE STUDY
(KC1 TO KC4)
JUNE 2016
COMMON PRE-SEEN CASE STUDY (KC1 TO KC4) – JUNE 2016 Page 2 of 20
Ruhunu Putra Energy Group of Companies Sanath Jayamuni, the founder of Ruhunu Putra Energy PLC (RPE), had a dream of creating a world class conglomerate one day. He is the current chairman/CEO of the company and holds 25% of its shares. Following years of hard work and determination by Sanath, RPE is now a renowned business in Sri Lanka operating in many diversified sectors including auto air conditioning, energy, supermarkets, tea, manufacturing and very recently, leisure. Sanath himself and RPE have won several national level awards such as the Best Corporate Citizen Award in 2012, the National Business Excellence Award in 2013 and recently in 2016 the National Quality Award for their excellent innovative growth in several industries within a short period of time. Background Sanath completed his undergraduate studies at the Faculty of Management and Finance of the University of Colombo. He strongly believed that his studies provided him a lot of novel business ideas and he did not want to miss out on them. Just after leaving university in 1992, Sanath started Ruhunu Putra Auto Air Conditioning (Pvt) Limited in Colombo in order to provide vehicle air conditioning services. The company became successful within a short period of time and opened several branches (service centers) in Galle, Matara, Kurunegala, Kaluthara and Kandy. A few years later Sanath saw an opportunity to enter the auto gas industry, and established Ruhunu Putra Energy (Pvt) Limited in 2002. Service centers were opened (in the same locations as the vehicle air conditioning service centers) to convert vehicles into gas, which was a remedial solution for increasing global oil prices at that time. The company imported the required equipment to convert vehicles into gas. Sanath then saw the opportunity of importing LP gas for this purpose. As such he obtained the necessary approval from the government authorities to import LP gas and distribute it island-wide, while getting the agency to establish fuel distribution from Ceylon Petroleum Corporation in 2002. Ruhunu Putra Energy (RPE) was listed on the Colombo Stock Exchange (CSE) in 2009 to raise capital to: fund the expansion of the plant’s capacity by 30% in the auto gas industry build an apartment complex in Colombo build a hotel (resort) in Negombo settle the bank loan in order to improve the bottom line of the group

COMMON PRE-SEEN CASE STUDY (KC1 TO KC4) – JUNE 2016 Page 3 of 20
Vision of RPE To be the most preferred and trusted Sri Lankan multinational that touches the day-to-day lives of people in Sri Lanka and beyond, through a diverse group of companies. Mission of RPE Serve the rural community, customers and all other stakeholders with love, through our core business – gas and petroleum, and build a diversified business conglomerate, based on the four main principles of: • Reducing cost of living • Enhancing youth skills • Bridging regional disparity • Enhancing local and global markets
Structure of the Group Ruhunu Putra Energy PLC (RPE) Ruhunu Putra Energy (Pvt) Limited was incorporated in 2002 as a highly diversified business conglomerate with a substantial stake in the power and energy sectors. It was listed on the CSE in 2009 and Ruhunu Putra Energy PLC (RPE) is now one of the fastest growing companies setting new standards in development and progressing in innovation and technology. With the liberalisation of the petroleum business in Sri Lanka, the opportunity to retail all auto fuel, petrol and diesel in particular, arose. This provided a sound platform for RPE to enter the petroleum and gas retailing industry, pioneering the state of the art filling station concept in Sri Lanka. Their service and presence have enabled them to achieve a firm footing in the market in the past as well the present. Customers are offered facilities such as nitrogen air, digital air, lubricants, domestic gas cylinders and car care items under a 24 hour service. The 2141 Dialog SMS facility and direct dialing customer suggestion phone facilities are available at the filling stations, which provide an opportunity for customers to contact the management for their requirements or any significant inquiries. Currently there are more than 500 employees working at RPE’s head office and filling stations. Due to the challenge associated with the changing nature of work, RPE encourages growth and career development of employees through coaching in order to help them achieve their goals. RPE also provides adequate training, encourages staff development and provides opportunities for growth. The company is also proud to say that they helped the government to meet their fuel requirement by opening up a new filling station at the Hambanthota harbour, which fulfills the fuel needs of the fisheries sector. In 2014, RPE’s great expectation was to be one of the main players in the petroleum and gas industry in Sri Lanka.

COMMON PRE-SEEN CASE STUDY (KC1 TO KC4) – JUNE 2016 Page 4 of 20
Ruhunu Putra is a brand synonymous with quality and consistency. They have an expansive network of over 3,000 dealers and 20 distributors working across the country. RPE delivers customised LP gas solutions that serve commercial, industrial and domestic requirements through a variety of downstream activities. However, RPE recently encountered some issues. The current performance of the price of RPE shares trading on the CSE has not been satisfactory. It has been fluctuating in the range of Rs. 80 - 85 during the last 6 months, which is lower than the net assets value of the group. The sharp drop in crude oil price has exerted downward pressure on LP gas and Ruhunu Putra passed on the benefits to customers in 2015 under the directions of the government authorities concerned. The company took several initiatives to enhance product availability throughout the island. Even though there are only a few players in the market, the bulk market is severely affected by competition. The company may need more effective strategies to maintain the exiting market dynamics. Due to the expansion of the company, the parking lot of the existing office premises was not sufficient and the company entered into a rent agreement for Rs. 25,000 per month with Lionel Fernando who is the owner of the adjoining land. Further RPE has given their own building in Wattala (which was not used for any other activity) to Ruhunu Putra Tea Export (Pvt) Limited (a subsidiary of RPE) to be used for blending tea and carrying out the packaging of export orders. According to the World Bank, Sri Lanka has reached close to its USD 4,000 GDP per capita target. The actual GDP per capita increased to USD 3,819 in 2014 from USD 3,625 in the previous year. This will change the lifestyle of urban as well as rural people. The Asian Development Bank forecasted the total consumption of LP gas by all sectors (Domestic, Commercial and Industrial) to be 402,000 M/T by 2025, out of which 74.8% will be for household consumption. According to them, the total consumption will increase by 161% over the next 10 years. During the year, RPE initiated different marketing strategies to promote rural communities using LP gas instead of other traditional energy sources. Ruhunu Putra Supermarkets (Pvt) Limited (RPS) Under the leadership of Sanath, Ruhunu Putra explored the potential of innovating its trading legacy. As a result in 2006 Ruhunu Putra Supermarkets (Pvt) Limited (RPS) was established as a chain of supermarket outlets in Colombo despite the tough competition with rival supermarket chains that were already established in Sri Lanka many years ago. RPE holds 80% of RPS’s stated capital while Sanath’s close friend John Fernando holds the balance 20%. John is the managing director of the company and looks after the interest of Sanath too.

COMMON PRE-SEEN CASE STUDY (KC1 TO KC4) – JUNE 2016 Page 5 of 20
Sanath wanted to truly serve the customers and extended the opening hours of the supermarket outlets till 11 pm. A convenience store was jointly operated with the fuel retail outlets along with a 24 hour pharmacy. All these initiatives took RPS a step ahead of its competition. Operating since February 2006, the supermarket chain has a proud reputation for the most diverse and largest product range in terms of Stock Keeping Units (SKUs), housing up to 26,000 per store. Sanath once mentioned, “our main concern should be our customers. We target not only individual retail customers but also the customers who purchase in bulk. Our plan is to have 40 outlets and over 30,000 regular customers per month”. John made some remarks about the supermarket chain at a recent board meeting and warned that the current performance of the supermarket chain has not reached targets in terms of customer service, profitability, supply chain and working capital management. He said, “we still only have 25 outlets open and less than 12,000 customers visiting our outlets each month. We also still have not gone to outstation cities other than the main ones. We need to rethink our strategy in designing supermarkets as well as in selecting locations. We need new investment to open 15 new outlets outside the Colombo district. Our transaction cost per customer is higher than that of our competitors”.
Ruhunu Putra Tea Export (Pvt) Limited (RPT) Sanath was born in Deniyaya and had good experience in southern tea plantations since his beautiful hometown was surrounded by low grown tea plantations. He started a small scale tea bagging company called Ruhunu Putra Tea Export (Pvt) Limited (RPT) in 2002 with two school friends. One was Nihal Salgadu, a tea taster by profession, who joined the company with the view of developing it. He in fact heads the company. The other friend, Yahampath Perera, a chartered accountant, is a director who heads group finance. RPT was doing well and Sanath decided to expand the company in a large way since he got new orders for the next 5 years to Australia and Bahrain under the brand name “Ruhunu Putra Tea”. In 2010 RPE invested 100% of the capital required for expansion. It now holds 75% of the share capital of RPT. The finance director of the group, Yahampath, at a recent board meeting mentioned, “the cost of manufacturing tea bags is now increasing due to the current crises in tea industry. RPT specialises in low country tea blending and their markets request only those blends. Due to the crises in the tea industry most of the small tea growers have now stopped plucking tea leaves and there is a shortage of tea leaves for production. For the first time RPT incurred a loss in year 2015/16. Further a letter has been sent by the Inland Revenue Department asking reasons for non-distribution of dividends from the profit made in 2014/15”. Ruhunu Putra Leisure (Pvt) Limited (RPL) Ruhunu Putra Leisure (Pvt) Limited (RPL) was established in 2013 with a stated capital of Rs. 853 million. RPE holds 80% of the stated capital of RPL while Sanath holds 10% and his friend Saparamadu, one of the best Eco Tourism experts in the island, holds the balance 10%.

COMMON PRE-SEEN CASE STUDY (KC1 TO KC4) – JUNE 2016 Page 6 of 20
In 2014 RPL launched its first luxury resort, Ruhunu Resort & Spa – Negombo. It is a five-star resort in the South Western coast of Sri Lanka, nestled between the Negombo lagoon and the Indian Ocean and consists of 100 luxury rooms. The resort has been specially designed to provide a unique experience of luxury in harmony with the natural environment. The lagoon is fed by a number of small rivers and a canal. It is linked to the sea by a narrow channel to the north, near the Negombo city. RPE has invested a further Rs. 617.6 million in the resort.
A feasibility study is now being carried out for a massive 250-room resort in Aluthgama. Once completed, the Aluthgama resort would be the group’s largest development in the tourism sector. Its aim is to be the number one tourist destination in the island with incomparable magnitude and quality. RPE has given a loan of Rs. 75 million, payable in 5 years at an interest rate of 5% p.a., to fund the new projects in the pipeline.
The external auditors of RPL, Albert Silva & Co. Chartered Accountants, has pointed out that the company’s books of accounts should be ready to commence the annual audit on 7 July 2016. Ruhunu Putra Group - future strategies and impacts
Since Sanath wanted to grow the business using the diversification strategy RPE ventured into the manufacturing sector as well. They started a small plastic manufacturing plant close to the Sapugaskanda CPC (Ceylon Petroleum Corporation) refinery in 2009, having entered into an agreement with CPC to buy naphtha (feedstock), the main raw material needed to produce plastic. The company uses plastic injection molding, which is the preferred process for manufacturing plastic parts. Injection molding is used to create many items such as electronic housings, containers, bottle caps, automotive interiors and combs. Most of the plastic products are available under the “Ruhunu Petro” brand name. Due to the demand for Ruhunu Petro branded plastics, the board of directors wanted to expand the facility by investing Rs. 300 million in 2013 and create new jobs for more than 100 employees in their factory in Sapugaskanda.
RPE incurred Rs. 25 million on research & development (R&D) expenses during the financial year 2015/16 in order to continuously improve the quality of Ruhunu Petro branded products. Further, RPE took several cost saving measures and waste elimination initiatives to improve the quality and production efficiency (while protecting the environment), which will enhance the profitability and loyalty of customers in the future.
At a recently held board meeting, the following issues/concerns were discussed.
Sanath advised the board to look at the progress of Ruhunu Putra Auto Air Conditioning (Pvt) Limited, which was his first business venture. He said, “we have neglected this company completely. The current environment is good for new investment in this industry in Sri Lanka and as such we should plan our next investment in this industry. I had an initial discussion with the chairman of Cooling Air (Pvt) Limited, one of the leading air condition installers and service providers for apartments in Sri Lanka. We should invest in this industry via RPE, and amalgamate both Ruhunu Putra Auto Air Conditioning (Pvt) Limited and Cooling Air (Pvt) Limited”.

COMMON PRE-SEEN CASE STUDY (KC1 TO KC4) – JUNE 2016 Page 7 of 20
The importance of recruiting an expert to study the existing ERP system of the group was highlighted since there had been a fraud in RPS. The fraud involved two fictitious suppliers being created in the system, which were identified by the group’s internal auditors during their regular audit.
The group’s external auditor Ernst and Fernando Associates Chartered Accountants, who carried out the annual audit for all the companies in the group except RPL, has advised the board on the recent developments taking place in Sri Lanka in relation to taxation and its impacts on the group.
The group finance director was concerned about the loss making companies/departments of the group and even had an argument with the head of the group’s strategic business development unit, Monika Abeyrathna, in this regard. He had sent a memo with his concerns suggesting to close down RPT and re-invest in the supermarket sector. He had also suggested that one of the initial departments in the group that converted vehicles into gas, which is now incurring losses due to declining business in the auto gas industry, should be closed down and its resources disposed of immediately. However Monika, was not in favour of the suggestions and argued that the recent government policy published on all three-wheelers having to be converted into gas in order to be environment friendly, will be an ideal opportunity for the said department. Monika also suggested that they should look for a viable merger or acquisition relating to the tea industry to experience fast growth. She mentioned that she is now working to tie up with a world famous tour company to bring more tourists and offer good packages.
Sanath brought to the notice of the directors the rupee depreciation. He pointed out that this would affect the energy sector adversely and the profit generated from LP gas, which the company currently imports from the Middle-East and Malaysia.
Note 01
Ruhunu Putra Group Structure
Ruhunu Putra Energy PLC
(RPE) Minority
% %
Ruhunu Putra Supermarkets (Pvt) Limited 80 20
Ruhunu Putra Tea Export (Pvt) Limited 75 25
Ruhunu Putra Leisure (Pvt) Limited 88 12
COMMON PRE-SEEN CASE STUDY (KC1 TO KC4) – JUNE 2016 Page 8 of 20
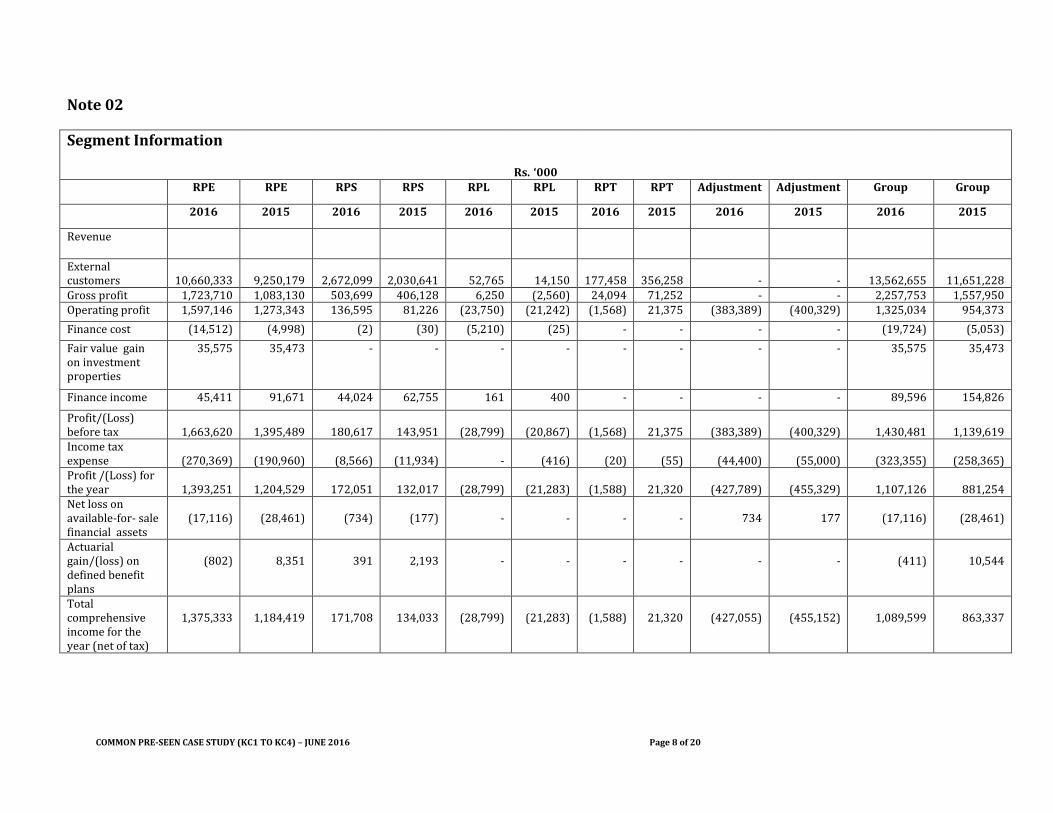
Note 02
Segment Information
Rs. ‘000
RPE RPE RPS RPS RPL RPL RPT RPT Adjustment Adjustment Group Group
2016 2015 2016 2015 2016 2015 2016 2015 2016 2015 2016 2015
Revenue
External customers
10,660,333
9,250,179
2,672,099
2,030,641
52,765
14,150
177,458
356,258
-
-
13,562,655
11,651,228
Gross profit 1,723,710 1,083,130 503,699 406,128 6,250 (2,560) 24,094 71,252 - - 2,257,753 1,557,950 Operating profit 1,597,146 1,273,343 136,595 81,226 (23,750) (21,242) (1,568) 21,375 (383,389) (400,329) 1,325,034 954,373
Finance cost (14,512) (4,998) (2) (30) (5,210) (25) - - - - (19,724) (5,053)
Fair value gain on investment properties
35,575 35,473 - - - - - - - - 35,575 35,473
Finance income 45,411 91,671 44,024 62,755 161 400 - - - - 89,596 154,826
Profit/(Loss) before tax
1,663,620
1,395,489
180,617
143,951
(28,799)
(20,867)
(1,568)
21,375
(383,389)
(400,329)
1,430,481
1,139,619
Income tax expense
(270,369)
(190,960)
(8,566)
(11,934)
-
(416)
(20)
(55)
(44,400)
(55,000)
(323,355)
(258,365)
Profit /(Loss) for the year
1,393,251
1,204,529
172,051
132,017
(28,799)
(21,283)
(1,588)
21,320
(427,789)
(455,329)
1,107,126
881,254
Net loss on available-for- sale financial assets
(17,116)
(28,461)
(734)
(177)
-
-
-
-
734
177
(17,116)
(28,461)
Actuarial gain/(loss) on defined benefit plans
(802)
8,351
391
2,193
-
-
-
-
-
-
(411)
10,544
Total comprehensive income for the year (net of tax)
1,375,333
1,184,419
171,708
134,033
(28,799)
(21,283)
(1,588)
21,320
(427,055)
(455,152)
1,089,599
863,337

COMMON PRE-SEEN CASE STUDY (KC1 TO KC4) – JUNE 2016 Page 9 of 20
Segment Information (continued)
Assets and Liabilities
Rs. ‘000
RPE RPE RPS RPS RPL RPL RPT RPT Adjustment Adjustment Group Group
2016 2015 2016 2015 2016 2015 2016 2015 2016 2015 2016 2015
Non-current assets
7,656,042
6,553,045
423,878
393,709
2,916,838
1,282,687
717,492
564,103
(1,982,758)
(1,365,891)
9,731,492
7,427,653
Current assets 3,712,902
3,497,427
312,578
279,198
12,152
9,250
72,525
52,758
(1,039,673)
(783,276)
3,070,484
3,055,357
Total assets 11,368,944
10,050,472
736,456
672,907
2,928,990
1,291,937
790,017
616,861
(3,022,431)
(2,149,167)
12,801,976
10,483,010
Non-current liabilities
2,240,580
2,047,194
207,915
5,815
449,201
201
45,000
-
(75,000)
-
2,867,696
2,053,210
Current liabilities 2,322,491
1,992,238
425,203
252,125
192,617
83,957
23,736
93,436
142,175
(310,915)
3,106,222
2,110,841
Total liabilities 4,563,071
4,039,432
633,118
257,940
641,818
84,158
68,736
93,436
67,175
(310,915)
5,973,918
4,164,051
Depreciation for the year
250,622
221,566
99,506
85,951
6,811
125
44
78
-
-
356,983
307,720
Purchase of property, plant and equipment
865,452
618,758
34,291
25,936
1,591,645
558,234
126,652
75,826
4,130
18,441
2,622,170
1,297,195
Provision for employee benefit liability
8,130
7,112
2,816
2,248
-
59
-
-
-
-
10,946
9,419

COMMON PRE-SEEN CASE STUDY (KC1 TO KC4) – JUNE 2016 Page 10 of 20
Note 03
Ruhunu Putra Energy PLC (RPE) Consolidated income statement
Rs. ‘000
Group Company
Year ended 31 March
2016 2015 2016 2015
Unaudited Audited Unaudited Audited
Revenue 13,562,655 11,651,228 10,660,333 9,250,179
Cost of sales (11,304,902) (10,093,278) (8,936,623) (8,167,049)
Gross profit 2,257,753 1,557,950 1,723,710 1,083,130
Other operating income 279,176 226,472 673,690 717,076
Selling and distribution expenses (457,294) (326,053) (443,634) (310,879)
Administrative expenses (799,252) (591,626) (401,142) (303,614)
Foreign currency exchange gains 44,651 87,630 44,522 87,630
Operating profit 1,325,034 954,373 1,597,146 1,273,343
Finance cost (19,724) (5,053) (14,512) (4,998) Fair value gain on investment properties 35,575 35,473 35,575 35,473
Finance income 89,596 154,826 45,411 91,671
Profit before tax 1,430,481 1,139,619 1,663,620 1,395,489
Income tax expense (323,355) (258,365) (270,369) (190,960)
Profit for the year 1,107,126 881,254 1,393,251 1,204,529
Profit attributable to:
Equity holders of the parent 1,073,780 851,649 1,393,251 1,204,529
Non-controlling interest 33,346 29,605 - -
Profit for the year 1,107,126 881,254 1,393,251 1,204,529

COMMON PRE-SEEN CASE STUDY (KC1 TO KC4) – JUNE 2016 Page 11 of 20
Note 04 Ruhunu Putra Energy PLC (RPE)
Consolidated statement of comprehensive income
Rs. ‘000
Group Company
Year ended 31 March 2016 2015 2016 2015
Profit for the year 1,107,126 881,254 1,393,251 1,204,529
Other comprehensive income
Loss on available-for-sale financial assets (17,116) (28,461) (17,116) (28,461) Acturial gain/(loss) on defined benefit plans (net of tax)
(411)
10,544
(802)
8,351
Income tax effect - - - - Other comprehensive income for the year (net of tax) (17,527) (17,917) (17,918) (20,110) Total comprehensive income for the year (net of tax)
1,089,599
863,337
1,375,333
1,184,419
Attributable to:
Equity holders of the parent 1,056,331 833,293 1,375,333 1,184,419
Non-controlling interest 33,268 30,044 - -
Total comprehensive income for the year 1,089,599 863,337 1,375,333 1,184,419
COMMON PRE-SEEN CASE STUDY (KC1 TO KC4) – JUNE 2016 Page 12 of 20
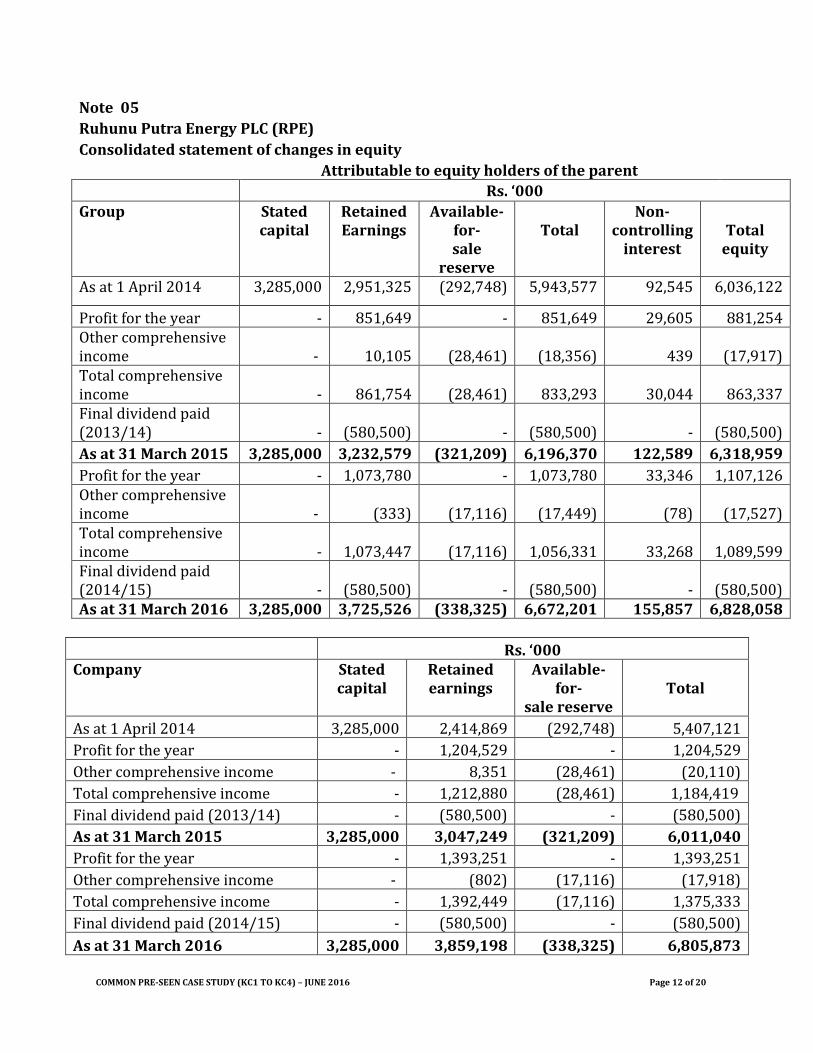
Note 05 Ruhunu Putra Energy PLC (RPE)
Consolidated statement of changes in equity
Attributable to equity holders of the parent
Rs. ‘000
Group
Stated capital
Retained Earnings
Available- for- sale
reserve
Total
Non-controlling
interest
Total equity
As at 1 April 2014 3,285,000 2,951,325 (292,748) 5,943,577 92,545 6,036,122
Profit for the year - 851,649 - 851,649 29,605 881,254 Other comprehensive income -
10,105
(28,461)
(18,356)
439
(17,917)
Total comprehensive income -
861,754
(28,461)
833,293
30,044
863,337
Final dividend paid (2013/14) -
(580,500) -
(580,500) -
(580,500)
As at 31 March 2015 3,285,000 3,232,579 (321,209) 6,196,370 122,589 6,318,959
Profit for the year - 1,073,780 - 1,073,780 33,346 1,107,126 Other comprehensive income -
(333)
(17,116)
(17,449)
(78)
(17,527)
Total comprehensive income -
1,073,447
(17,116)
1,056,331
33,268
1,089,599
Final dividend paid (2014/15) -
(580,500) -
(580,500) -
(580,500)
As at 31 March 2016 3,285,000 3,725,526 (338,325) 6,672,201 155,857 6,828,058
Rs. ‘000 Company
Stated capital
Retained earnings
Available- for-
sale reserve Total
As at 1 April 2014 3,285,000 2,414,869 (292,748) 5,407,121
Profit for the year - 1,204,529 - 1,204,529
Other comprehensive income - 8,351 (28,461) (20,110)
Total comprehensive income - 1,212,880 (28,461) 1,184,419
Final dividend paid (2013/14) - (580,500) - (580,500)
As at 31 March 2015 3,285,000 3,047,249 (321,209) 6,011,040
Profit for the year - 1,393,251 - 1,393,251
Other comprehensive income - (802) (17,116) (17,918)
Total comprehensive income - 1,392,449 (17,116) 1,375,333
Final dividend paid (2014/15) - (580,500) - (580,500)
As at 31 March 2016 3,285,000 3,859,198 (338,325) 6,805,873

COMMON PRE-SEEN CASE STUDY (KC1 TO KC4) – JUNE 2016 Page 13 of 20
Note 06 Ruhunu Putra Energy PLC (RPE) Consolidated statement of financial position
Rs. ‘000
Group Company
Unaudited Audited Unaudited Audited
As at 31 March 2016 2015 2016 2015
ASSETS Non-current assets Property, plant and
equipment 8,776,683 6,511,466 4,925,377 4,528,185
Investment properties 680,000 644,900 680,000 644,900
Intangible assets 67,258 63,203 9,763 10,000
Prepayments 87,825 91,955 - -
Investments in subsidiaries - - 1,941,302 1,323,702
Other non-current assets 119,726 116,129 99,600 46,258
9,731,492 7,427,653 7,656,042 6,553,045
Current assets Inventories 474,378 388,990 389,856 356,333
Trade and other receivables 929,611 1,121,942 1,986,407 1,942,568
Prepayments 34,981 30,781 34,981 30,781
Other current financial assets 3,328 4,236 3,328 4,236
Cash and short-term deposits 1,628,186 1,509,408 1,298,330 1,163,509
3,070,484 3,055,357 3,712,902 3,497,427
Total assets 12,801,976 10,483,010 11,368,944 10,050,472
EQUITY AND LIABILITIES
Equity Stated capital 3,285,000 3,285,000 3,285,000 3,285,000
Reserves (338,325) (321,209) (338,325) (321,209)
Revaluation reserve 72,958 72,958 69,871 69,871
Retained earnings 3,652,568 3,159,621 3,789,327 2,977,378 Equity attributable to equity holders of the parent
6,672,201
6,196,370
6,805,873
6,011,040
Non-controlling interest 155,857 122,589 - -
Total equity 6,828,058 6,318,959 6,805,873 6,011,040

COMMON PRE-SEEN CASE STUDY (KC1 TO KC4) – JUNE 2016 Page 14 of 20
Non-current liabilities Interest bearing loans and
borrowings
994,000
410,070 375,248
410,070
Deferred tax liabilities 601,567 492,336 601,567 492,336
Employee benefit liability 43,274 32,436 34,910 26,420
Refundable deposits 1,228,855 1,118,368 1,228,855 1,118,368
2,867,696 2,053,210 2,240,580 2,047,194
Current liabilities Trade and other payables 2,183,455 1,912,606 1,857,481 1,827,194
Refundable deposits 116,930 119,552 116,930 119,552
Income tax payable 77,877 33,426 72,093 22,242 Interest bearing loans and borrowings
727,960
45,257 275,987
23,250
3,106,222 2,110,841 2,322,491 1,992,238
Total equity and liabilities 12,801,976 10,483,010 11,368,944 10,050,472 Note 07
RPE’s investment in subsidiaries
Non-Quoted
% % Cost
(Rs. ‘000) Cost
(Rs. ‘000) Par value
(Rs.)
2016 2015 2016 2015 Ruhunu Putra Supermarkets
(Pvt) Limited 80 80
416,302
416,302 100 Ruhunu Putra Tea Export (Pvt) Limited 75 75
225,000
225,000 100
Ruhunu Putra Leisure (Pvt) Limited 88 80
1,300,000
682,400 100
Total 1,941,302 1,323,702

COMMON PRE-SEEN CASE STUDY (KC1 TO KC4) – JUNE 2016 Page 15 of 20
For Further Reading Sri Lanka Economic Outlook The Central Bank of Sri Lanka left its standing deposit facility rate on hold at 6.5 percent on March 29, 2016, after raising it for the first time in nearly 4 years by 50 bps in the previous meeting, aiming to avoid further inflationary pressures. The standing lending facility rate was also kept on hold at 8 percent. The inflation rate in Sri Lanka averaged 9.85 percent from 1986 until 2016, reaching an all-time high of 28.31 percent in June of 2008 and a record low of -0.89 percent in March of 1995. The inflation rate in Sri Lanka is reported by the Central Bank of Sri Lanka. In Sri Lanka, the Consumer Price Index (CPI) is composed of two main groups: Food items (41 percent) and Non-food items (59 percent). Food items are mainly composed of: bread and cereals (7.9 percent), fish and sea food (6 percent), and vegetables (5.7 percent). The most important non-food items are housing, water, electricity, gas and other fuels (23.7 percent), transport (12.3 percent), and restaurants and hotels (5.8 percent).

COMMON PRE-SEEN CASE STUDY (KC1 TO KC4) – JUNE 2016 Page 16 of 20
(Source: Tradingeconomics.com)
Sri Lanka’s oil and gas strategic analysis and outlook to 2025 Research and Markets has announced the addition of the ‘Sri Lanka Oil and Gas Strategic Analysis and Outlook to 2025 – Forecasts of Supply, Demand, Investment, Companies and Infrastructure (Fields, Blocks, Pipelines, Liquefied Natural Gas (LNG), Refinery, Storage Assets)’ report to their offering.
Amidst the downfall in oil prices creating uncertainty on the future of Sri Lankan industry growth, the report details key strategies of government, oil and gas companies and investors in the country. A detailed outlook of the industry in terms of production forecasts of oil, gas, LNG, LP Gas (LPG), gasoline, diesel and fuel oil along with supporting parameters of primary energy demand, GDP and population are included. The current status of planned projects along with the possible commencement of projects, feasibility of developing those projects in current market conditions, expected startup costs, impact of competing assets in other countries and overall industry developments, investments required and other related information on planned projects is provided in detail. The comprehensive guide provides analysis and forecasts of Sri Lanka’s oil and gas market for the period 2000 to 2025. Asset by asset details of all existing and planned projects across Sri Lanka’s oil and gas value chain are detailed in the report. Driven by strong methodology and proprietary databases, reliable projections of oil, gas, petroleum products, coal, and LNG supply and demand are made to 2025. The research work examines the existing infrastructure (oil and gas assets), market conditions, investment climate and competitive landscape of upstream, midstream and downstream sectors.

COMMON PRE-SEEN CASE STUDY (KC1 TO KC4) – JUNE 2016 Page 17 of 20
The SWOT Analysis and benchmarking tools are used to analyse and compare the real prospects and challenges of investing or expanding in the industry. Further, the report details all the investment opportunities sector-wise, highlighting the industry growth potential and project feasibility. Detailed information on new fields, blocks, pipelines, refineries, storage assets and LNG terminals along with the investments required, current status of the projects and commencement feasibility are provided. The report also analyses three key companies in Sri Lanka’s oil and gas industry. Business operations, SWOT Analysis and financial performance of the companies are provided. All the latest developments in the industry along with their possible impact on the industry are included in the report. LPG sales are from cylinders and bulk sales. The percentage using LPG for cooking has been increasing. The cylinder market has experienced a 20% increase (85% of the total consumption), and the bulk market a 5% decrease. (Source: http://www.ft.lk/article/437971/Sri-Lanka-s-oil-and-gas-strategic-analysis-and-outlook-to-2025)
GDP growth %
2009 2010 2011 2012 2013 2014 2015 2016
3.5 8.0 8.2 6.3 7.3 7* 6.5* 6.5*
* IMF forecasts (Source: Central Bank of Sri Lanka)
Inflation - Year-On-Year (YOY)
2011 2012 2013 2014 2015 2016 2017 2018 2019 2020
6.7 7.5 6.9 3.3 1.7 3.4* 4.3* 5* 5* 5*
* IMF forecasts
(Source: Central Bank of Sri Lanka)
COMMON PRE-SEEN CASE STUDY (KC1 TO KC4) – JUNE 2016 Page 18 of 20
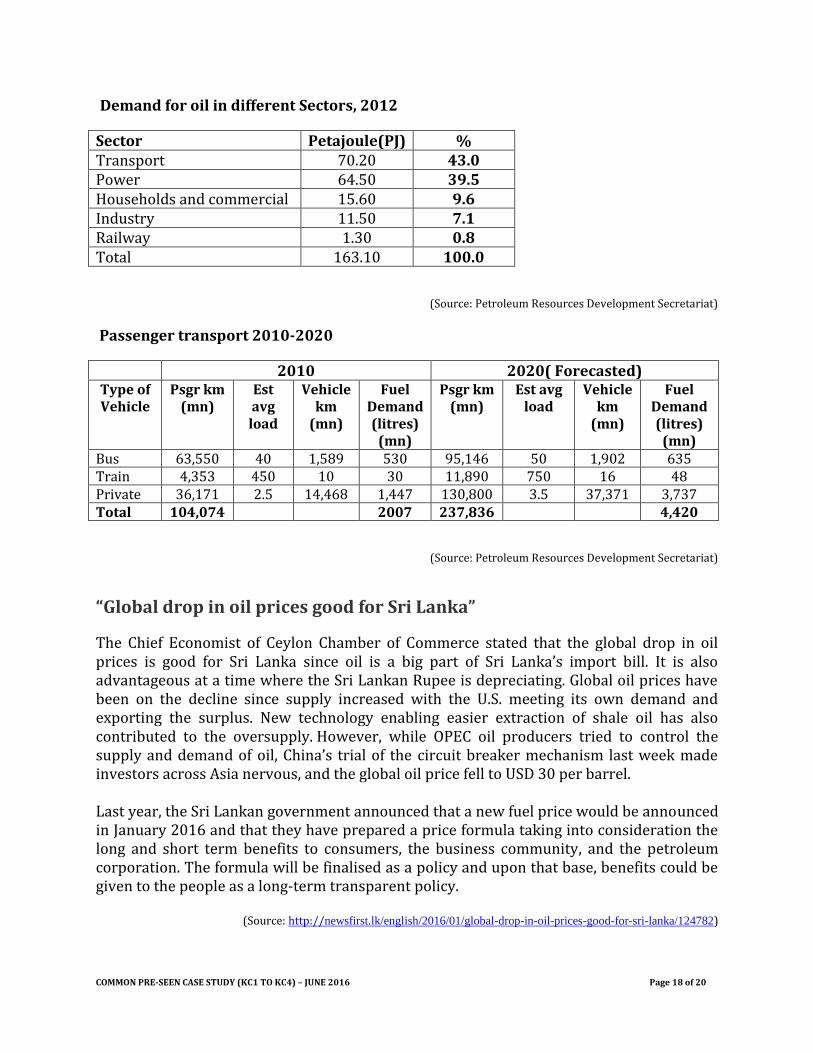
Demand for oil in different Sectors, 2012
Sector Petajoule(PJ) % Transport 70.20 43.0 Power 64.50 39.5 Households and commercial 15.60 9.6 Industry 11.50 7.1 Railway 1.30 0.8 Total 163.10 100.0
(Source: Petroleum Resources Development Secretariat)
Passenger transport 2010-2020
2010 2020( Forecasted) Type of Vehicle
Psgr km (mn)
Est avg load
Vehicle km
(mn)
Fuel Demand(litres)
(mn)
Psgr km (mn)
Est avg load
Vehicle km
(mn)
Fuel Demand (litres)
(mn) Bus 63,550 40 1,589 530 95,146 50 1,902 635 Train 4,353 450 10 30 11,890 750 16 48 Private 36,171 2.5 14,468 1,447 130,800 3.5 37,371 3,737 Total 104,074 2007 237,836 4,420
(Source: Petroleum Resources Development Secretariat)
“Global drop in oil prices good for Sri Lanka”
The Chief Economist of Ceylon Chamber of Commerce stated that the global drop in oil prices is good for Sri Lanka since oil is a big part of Sri Lanka’s import bill. It is also advantageous at a time where the Sri Lankan Rupee is depreciating. Global oil prices have been on the decline since supply increased with the U.S. meeting its own demand and exporting the surplus. New technology enabling easier extraction of shale oil has also contributed to the oversupply. However, while OPEC oil producers tried to control the supply and demand of oil, China’s trial of the circuit breaker mechanism last week made investors across Asia nervous, and the global oil price fell to USD 30 per barrel. Last year, the Sri Lankan government announced that a new fuel price would be announced in January 2016 and that they have prepared a price formula taking into consideration the long and short term benefits to consumers, the business community, and the petroleum corporation. The formula will be finalised as a policy and upon that base, benefits could be given to the people as a long-term transparent policy.
(Source: http://newsfirst.lk/english/2016/01/global-drop-in-oil-prices-good-for-sri-lanka/124782)

COMMON PRE-SEEN CASE STUDY (KC1 TO KC4) – JUNE 2016 Page 19 of 20
Growth in the LP gas sector in Sri Lanka The LPG downstream operations consist of the three market segments of Domestic, Commercial and Industrial. The domestic sector consists of households and the commercial sector comprises of comparatively larger scale users like hotels, restaurants and hospitals. The industrial segment consists of the manufacturing organisations, dominated at present mostly by the ceramics industry. As at the end of 2013, the LPG consumption by the domestic and commercial segments accounted for 86% of the total consumption. Over the period 2010 to 2013, household and commercial sector usage remained around 85% of the total consumption but an upward movement of this is anticipated in the future owing to the potential growth in the household segment with the improved macro-economic conditions. According to the forecasts made by the Asian Development Bank (ADB), by 2025 the total consumption of LP gas by all segments will be 402,000 M/T out of which 74.8% is for the consumption for the households. The total consumption according to the ADB forecasts will be around 161% over the current usage, over the next 10 year period. As far as the supply side forecasts are concerned the total consumption requirements would be able to be satisfied, with or without the local petroleum refinery rehabilitation programme. The foregoing account amply demonstrates the positive growth potential of the LPG sector of the local petroleum-based products market.
(Source: Laugfs Gas PLC Annual Report 2015)
Balancing the scales: Taming supermarket buyer power
Accompanied by the rise in per capita incomes and overall improvements in living standards, supermarkets are increasingly accounting for a growing share of grocery trade in many developing countries around the world. The trend is such that, in many of these instances, a large share of these grocery markets are increasingly being concentrated amongst a handful of supermarket chains, which in effect has led to an imbalance of power in the groceries supply chains, in favour of supermarkets. Over the past decade or so, Sri Lanka too has witnessed a proliferation of supermarkets chains. With the emergence of supermarket ‘home brands’ in Sri Lanka over the last couple of years and the local industry being well positioned to expand into the future, regulators must guard against the possibility of buyer power abuses in the interest of both suppliers and consumers. Against the preceding backdrop, this article discusses how the abuse of buyer power takes place, their impact on consumers and what regulators could do to curb such practices, drawing on international best practices. Supermarket buyer power Supermarkets’ buyer power arises from their retailer power; bigger buying volumes command better buying prices and as such both buyer power and retail power are mutually reinforcing. As the retail power of supermarkets expands due to their growing market share, so will their ability to bargain for better deals from their suppliers. Likewise, as buying prices fall, retail prices also fall giving them more market share. Thus buyer power and retail power are both mutually reinforcing. From a consumer welfare perspective, reduction in retail prices is seen as positive. However these benefits may only

COMMON PRE-SEEN CASE STUDY (KC1 TO KC4) – JUNE 2016 Page 20 of 20
accrue in the short run. The abuse of buyer power at the detriment of suppliers would in the long term adversely impact consumers as ultimately both consumers and suppliers are connected. The rise of retailers’ own brands, commonly known as ‘private labels’ or ‘home brands’ has exacerbated buyer power abuses. As supermarkets have started to acquire more market share and presence in the minds of consumers, they have begun to develop their own brands as a means of bolstering market share and profits. Thus in addition to their traditional role as purchasers, they have become direct competitors to their suppliers, which in effect has led to the increase in abuse of buyer power in their bid to thwart competition. The fast growth of supermarkets in Sri Lanka has seen the organised retail industry concentrated among three main private sector fast-moving consumer goods (FMCG) retail chains. The three industry leaders account for approximately 15% of modern retail trade in the country. With the emergence of home brands and the gradual concentration of market power in the hands of supermarkets, the scope for buyer power abuses is set to become more prevalent. In light of the experience in the developed and other developing countries, there is a risk that as the industry grows, consumers would be indirectly affected.
(Source: http://www.ft.lk/article/531091/Balancing-the-scales:-Taming-supermarket-buyer-power#sthash.BBxgpYhR.dpuf)