attaining sustainable development of oil and gas in … sustainable development of oil and gas ......
TRANSCRIPT

Attaining Sustainable Development of Oil and Gas in North America
A Review of the Environmental
Regulatory Landscape
Alan J. Krupnick and Raymond J. Kopp
JUNE 2014

Table of Contents
Introduction ............................................................................................................................................ 1
Oil and Gas Extraction ......................................................................................................................... 2
Mexico ................................................................................................................................................................... 2
United States ...................................................................................................................................................... 3
Canada .................................................................................................................................................................. 5
Oil and Gas Transport .......................................................................................................................... 7
United States and Canada .............................................................................................................................. 7
Oil Refining .............................................................................................................................................. 9
Mexico ................................................................................................................................................................... 9
United States ...................................................................................................................................................... 9
Canada .................................................................................................................................................................. 9
Demand ................................................................................................................................................... 10
Electricity Sector ........................................................................................................................................... 10
Mexico ........................................................................................................................................................... 10
United States and Canada ...................................................................................................................... 11
Transportation Sector ................................................................................................................................. 11
United States .............................................................................................................................................. 11
Canada .......................................................................................................................................................... 13
Mexico ........................................................................................................................................................... 13
Exports .............................................................................................................................................................. 13
Mexico ........................................................................................................................................................... 13
United States .............................................................................................................................................. 13
Canada .......................................................................................................................................................... 14
© 2014 Resources for the Future. Resources for the Future is an independent, nonpartisan think tank that, through its social science research, enables policymakers and stakeholders to make better, more informed decisions about energy, environmental, and natural resource issues. RFF is located in Washington, DC, and its research scope comprises programs in nations around the world.

Sustainable Integration of North American Energy Markets .............................................. 14
Environmental Impact Assessments and Statements ..................................................................... 14
Extraction ......................................................................................................................................................... 15
Transportation and Fuels Policies .......................................................................................................... 15
Fossil Fuel Transport ................................................................................................................................... 16
Climate Policy ................................................................................................................................................. 16
1

ATTAINING SUSTAINABLE DEVELOPMENT OF OIL AND GASIN NORTH AMERICA: A REVIEW OF THE ENVIRONMENTAL
REGULATORY LANDSCAPE
Alan J. Krupnick and Raymond J. Kopp*
Introduction North America has long been a significant player in global energy markets, more so recently given
the revolutionary use of hydraulic fracturing technology to unlock oil and gas resources. With dramatic growth in oil and gas production in the United States (US) and Canada—combined with energy sector reforms in Mexico—many now consider the region to be a potential energy powerhouse.
The three countries have much to gain from these developments. The exploitation of these resources and the potential for enhanced cross-border energy trade is likely to make the continent’s energy-intensive economic sectors more competitive, improve energy security, dampen short-term energy price volatility, and stimulate continent-wide economic growth.
Some have noted, however, that maximizing the economic potential of the continent’s vast natural resources—while ensuring that development is environmentally sustainable and mindful of climate consequences—will require better cross-border coordination, particularly in the policy realm.
Identifying areas for policy reform and harmonization first requires an understanding of existing regulatory landscapes. To that end, leading experts from Resources for the Future (RFF) in the United States, the International Institute for Sustainable Development (IISD) in Canada, and the Mario Molina Center in Mexico have come together to develop this review of critical regulations related to the potential tri-national coordination of oil and gas markets. This process led to the development of over 60 individual policy analyses that are reflected in this document.
This review focuses on national and subnational environmental regulations that are important for governing the sustainable development of oil and gas. It provides a snapshot of the policies and regulations in each country related to oil and gas extraction, oil and gas transport and oil refining, and certain issues that impact demand.
*Accompanying this report are three corresponding policy review reports, one each for Canada, Mexico, and theUnited States. Researchers from Canada’s International Institute for Sustainable Development (IISD) authored the Canadian policy review, researchers from Mexico’s Centro Mario Molina authored the Mexican policy review, and researchers from RFF authored the US policy review.
Lead report authors are Alan J. Krupnick, senior fellow and director, RFF Center for Energy Economics and Policy; and Raymond J. Kopp, senior fellow and director, RFF Center for Climate and Electricity Policy. Significant contributions came from Philip Gass at IISD in Canada, as well as RFF’s Kristin Hayes and Madeline Gottlieb. For questions, contact Alan J. Krupnick: [email protected].
1 KRUPNICK AND KOPP

The review concludes by highlighting several policy differences and opportunities for harmonization. For example:
• Individual country policies that affect siting and construction of new energy infrastructure should be a prime target for consideration, especially related to the process of environmental impact assessments.
• Policies regarding light- and heavy-duty new vehicle fuel economy and greenhouse gas emissions have largely been homogenized in the United States and Canada, and for light-duty vehicles in Mexico. Differences exist in the promotion of alternative fuel vehicles.
• Canada and the United States have different standards for railroad safety. Harmonization is important because of the high level of oil shipment by rail between the two countries and the risk of accidents.
• North America does have an immediate opportunity to begin the process of developing a continent-wide climate policy via the current international negotiations under the United Nations Framework Convention on Climate Change.
• There is an opportunity to harmonize the electric power sector regulations as the United States moves forward under the Clean Air Act and Mexico begins to restructure its electricity sector.
To supplement this summary report, the expert group developed a more extensive report for each country to provide additional detail on their distinct policies, including information on context; current policy and industry best practices; and commentary on policy coverage (or gaps), effectiveness, suitability, or options for reform.
While there are also various economic regulations that strongly influence demand for oil and gas, in this review, the experts have focused primarily on those policies with specific environmental impacts—including regulations related to hydraulic fracturing operations, carbon and conventional air pollutant emissions, managing risk, and others. This scope was somewhat extended in the case of Mexico, however, where the recent institutional and economic reforms in the energy sector are inextricably linked to environmental policy development. Similarly, the experts examined only a select number of policies related to the electricity sector and transborder electricity markets, which is an important area for future research.
Finally, due to the limited scope of this research, this review does not cover energy development issues in the Arctic (an area of increasing importance in the United States and Canada) and only briefly mentions indigenous peoples’ disputes related to land claims, mineral rights, and general protests about community benefits and impacts. These remain a significant part of the oil and gas production debate, however, and their exclusion should only be seen considered as a reflection of the limited scope of this exercise.
Oil and Gas Extraction
Mexico Revisions to the Mexican Constitution in December 2012 provided the starting point for the
nation’s ambitious energy reforms, opening oil and gas activities to greater participation from the private sector. Over the next several years, new policies and regulations will emerge to guide fossil
2 KRUPNICK AND KOPP

fuel extraction in Mexico. The federal government is the regulatory authority for these activities (unlike the United States and Canada, where the states and provinces play a larger role). The Mexican government is already reaching out to various US stakeholder groups for insights for a Mexican regulatory strategy, indicating an interest in coordination and potential harmonization.
The 2012 reforms established the National Agency for Industrial Security and Environmental Protection (Agencia Nacional de Seguridad Industrial y Protección del Medio Ambiente, or ANSIPMA) to manage and oversee hydrocarbon activities. The Mexican Congress is now defining the roles and responsibilities of the new agency. ANSIPMA will absorb many responsibilities previously held by the Energy Ministry (SENER) and Environment Ministry (SEMARNAT), including ensuring industrial safety, operations in natural protected areas, standard setting, and monitoring and enforcement of environmental regulations.
Mexico relies heavily on an environmental impact assessment (EIA) procedure to grant construction and operation permits for large-scale projects including hydrocarbons. The EIA review and authorization is perceived to be slow by the private sector due to bureaucratic bottlenecks and a lack of personnel with technical expertise. On the other hand, many civil society organizations view the process as too short to be properly informative.
As part of the energy reform, President Enrique Peña Nieto has proposed that the EIA procedure for oil and gas activities be housed under ANSIPMA. This realignment would lead to more financial resources and technically trained staff devoted to these EIAs, ideally resulting in a more rapid processing of the EIAs and greater confidence in the outcome of the process.
The Integrated Environmental License (Licencia Ambiental Única, or LAU) gathers the various environmental permits into a single process. It also helps to compare the pollution inventories across countries: the Toxic Release Inventory (TRI) in the United States, the National Pollutant Release Inventory (NPRI) in Canada, and the Pollutant Release and Transfer Registry (RETC) in Mexico. The LAU applies to air emissions from stationary sources under federal jurisdiction, which includes oil and gas activities, among others. The LAU is issued once and is permanent, but it must be updated if the facility changes its process or production rates.
The LAU requires an annual reporting (Cedula de Operación Anual, or COA) of production levels, inputs for production, criteria pollutants and their precursors, wastewater discharges, and generation and management of hazardous waste. Many COA reports are incomplete and exclude the estimation of fugitive emissions and other unregulated emissions. Also, some of the requirements of a LAU are not applicable or well-suited for some facilities.
United States A June 2013 RFF report2 summarizes the state of regulations for extraction in the United States:
“Outside of federal lands and offshore production, oil and gas production has historically been regulated primarily by state governments. This pattern has remained consistent throughout the shale gas and tight oil boom. States regulate the location and spacing of well sites, the methods of drilling, casing (lining), fracking, and plugging wells, the disposal of most oil and gas wastes and site restoration, and many other activities. State common and public
2 Richardson, Nathan, Madeline Gottlieb, Alan J. Krupnick, and Hannah Wiseman. 2013. The State of State Shale Gas Regulation. Washington, DC: Resources for the Future.
3 KRUPNICK AND KOPP

law governs the interpretation of lease provisions and disputes between surface and mineral owners and mineral lessees about payments and surface damage.
However, federal authority over some parts of shale gas development is significant, particularly regarding the protection of air and surface water quality and endangered species. The federal government also plays a direct role in that it issues regulations in its capacity as a landowner—many states with oil and gas deposits include large areas of federally owned land. In some cases, local governments have an important role, placing limits on the weight of equipment on roads; requiring operators to repair road damage; taxing oil and gas operations; and additionally constraining well pad locations, drilling and fracking techniques, and waste disposal methods.”
Research has documented state and federal regulations in this area and found the following:
• State regulations for extraction activities are heterogeneous in terms of aspects of the activities that are regulated or not, how each aspect is regulated (through permitting or through regulation), and how stringently they are regulated. For example, see Figure 1 below, which illustrates the range of fracking fluid disclosure requirements in place in various US states (as of mid-2013). It is unclear why so much heterogeneity exists.
• Most states use command-and-control approaches rather than performance standards. The latter would be more flexible and less costly, but requires greater oversight.
• Enforcement data and regulatory cost information are hard to come by. Therefore, it is difficult to identify states that stand out from an economic efficiency perspective.
• The federal government has a suite of laws applicable to oil and gas development; some of these contain exemptions for the oil and gas sector (for example, produced water is excluded as a hazardous waste subject to Resource Conservation and Recovery Act requirements).
• At the same time, the US Environmental Protection Agency (EPA) has begun to address methane and other volatile organic compound emissions from the well and other parts of the supply chain. More regulatory activity can be expected. EPA is also conducting a study on drinking water pollution and shale gas development.
• Local and state governments have been debating the allocation of state powers to regulate or limit shale gas and tight oil development. Some states have tried to prevent regulation by localities. A good example is Act 13 in Pennsylvania: the part of the act that supersedes local regulation was thrown out by the Pennsylvania Supreme Court.
4 KRUPNICK AND KOPP

Figure 1. Fracking Fluid Disclosure Requirements in Various US States
Source: Richardson, Nathan, Madeline Gottlieb, Alan J. Krupnick, and Hannah Wiseman. 2013. The State of State Shale Gas Regulation. Washington, DC: Resources for the Future.
Canada In Canada, the regulation of oil and gas extraction has also been focused at the provincial level.
Federal-provincial offshore petroleum development boards have been established as regulatory bodies, while a moratorium on offshore development off of the Pacific Coast has been in place for a number of years. Provinces have been the prominent regulatory bodies for shale gas development, with approaches varying from bans in some jurisdictions to increased shale gas exploration and development in others.
The most important area where the federal government has maintained a role is in the issue of environmental assessments. The Environmental Assessment Act (1992) intended to identify, evaluate, and mitigate adverse environmental effects caused by projects under federal jurisdiction. This act was repealed and replaced in 2012 by new legislation that sought to increase predictability, timeliness, and coordination in assessments. An assessment is now warranted when it is referenced under a defined “designated projects” list and is conducted at the discretion of the federal government. There are mixed views about the changes to environmental assessments, with positive responses about moves to expediency but concerns about rigor with the new approach.
The Northern Canadian territories (Yukon, Nunavut, Northwest Territories) have differing resource rights than provinces, granting the federal government increased influence in these jurisdictions.
Research at IISD identified the following dynamics at work with regard to the issue of extraction:
• Provinces maintain resource rights, and therefore are the primary regulators, but the federal government maintains a pivotal role in environmental assessments, a role that has been evolving in recent years.
5 KRUPNICK AND KOPP

• As in the United States, public opposition to hydraulic fracturing—particularly among populations in eastern Canada (where resources are in heavily populated areas) and among aboriginal groups concerned about pollution to water and resources on their traditional lands—is influencing policymaking.
• Issues of disclosure of fracking fluids closely mirror the debate ongoing in the United States. Some have called for more alignment of the Canadian FracFocus website with the American version.
• There is significant public debate, and some strong opposition, to the idea of oil sands extraction because of concerns over impacts to local communities (aboriginal and otherwise), impacts on water resources, the energy intensity of oil sands extraction activities, the significant land use, and surface environmental impacts.
• Reporting and mitigation of greenhouse gas (GHG) emissions has been a prominent issue in Canada. On the reporting side, the federal government has its own threshold for GHG reporting (50,000 tons of carbon dioxide equivalent [CO2e ] per year), while several provinces require reporting at lower thresholds. This has been streamlined through a single window reporting system.
• With regard to mitigation, provinces may have their own GHG mitigation system for oil and gas, as the federal government has not yet regulated the sector. Alberta has the most notable approach: an intensity-based system with targets and flexible compliance mechanisms including trading, offsets, and compliance payments at a set rate, with funds going to low-carbon technology. The federal government has stated its intent to regulate, but has not yet released draft regulations.
Digging Deeper on US Extraction Policies
A number of regulations and industry best practices affect all phases of shale gas extraction activity. Topics prominent in the public debate in the United States include permitting (on federal lands), fugitive methane control, fracking fluid disclosure, casing and cementing leakage, liquids handling (from freshwater withdrawals to ultimate disposal), deepwater drilling, induced seismicity at deep injection well sites, bans and moratoria, and performance bonding to assure that well sites are restored after the wells are depleted. Several of these are explored in more detail below.
Fugitive Methane. There is significant controversy over how much methane is leaking throughout the natural gas value chain. US federal regulators, the state of Colorado, and some operators are working on ways to cut these emissions. According to the Environmental Defense Fund, a high fraction of available emissions reductions opportunities would actually save the industry money. Even if the reductions were costly, it may still be worthwhile for the industry to agree to a tight cap on such emissions to end the debate about whether natural gas is a clean fuel relative to coal.
Fracking Fluid Disclosure. In the United States and Canada, arguments continue to build about balancing industry’s need for protecting and valuing proprietary information and the related incentive to innovate, and the public’s need for information on the chemicals that the public could be exposed to in the event of an accident or drinking water well pollution. The development of and recent improvements to the FracFocus reporting website in the United States have created a forum for such disclosure. Schlumberger, a fracking service provider already fully discloses the chemicals and their proportion in the fracking fluids, while withholding specific chemical recipes. The decision by oil
6 KRUPNICK AND KOPP
company Baker Hughes that it will follow Schlumberger’s lead is evidence that the industry is listening, but these efforts cannot, by themselves, take the debate off the table. Public and government engagement is now needed.
Liquids Handling. Liquids handling—from freshwater withdrawals to the ultimate disposal of liquids containing fracking fluids, brine, and other chemicals released from underground (called produced water)—is of high concern from both an environmental and economic perspective. This concern is heightened by increasing droughts in areas coincident with oil and gas plays. Freshwater withdrawal regulations need improvement; not all jurisdictions regulate the quantity, location, and timing of such withdrawals. On-site storage of fracking liquids in pits and ponds is usually regulated, but these regulations are highly heterogeneous and may miss the growing industry movement to reduce the liquids’ footprint by using tanks or closed-loop systems, and recycling. The induced seismic events caused by disposal and deep injection wells in Arkansas, Oklahoma, and Ohio are raising concerns about such options, while commercial treatment is very expensive when desalinization is needed. To begin to address these issues, some states are requiring operators to develop water use, treatment, and disposal plans.
Casing and Cementing. Public concerns about groundwater pollution dominate all other fracking-related issues. An essential part of the drilling process is protecting groundwater by isolating the well bore (using casing and cementing) from a freshwater aquifer. There is still too little routine reporting of data to document the risk of casing and cementing failures and subsequent contamination, owing partly to the use of non-disclosure agreements with landowners who find their wells polluted. Pennsylvania has taken a leadership role in this area through its presumptive liability rule, which holds operators responsible for any contamination that occurs within 12 months of the beginning of operations within a 2,500 foot radius of an unconventional well site. One of the defenses against the presumption is a pre-drilling baseline groundwater testing survey. The result reportedly has been a big increase in such testing.
Oil and Gas Transport
United States and Canada Pipelines and, more recently, railroads are used to move oil and gas from the fields to processing
and refinery plants and, for gas, to local distribution networks and customers. The boom in shale gas and tight oil has strained these networks in several ways. A primary example is the lack of pipeline capacity in the Bakken shale region, requiring a rapid ramp-up in railroad use and associated increase in railroad accidents (see Figure 2). Some of these accidents have been serious, as have some recent leaks from pipelines, resulting in new regulatory proposals to make transport safer. Indeed, the Federal Rail Administration in the United States recently passed a new regulation to improve rail integrity.
7 KRUPNICK AND KOPP

Figure 2. Number of Railroad Incidents Compared to Number of Railcars Used in Oil Shipments, 2009–2013
Source: Charles Mason, H.A. "Dave" True, Jr. Professor of Petroleum and Natural Gas Economics, University of Wyoming and Visiting Fellow, Resources for the Future
In Canada, the tragic accident in Lac-Mégantic, Quebec, which resulted in more than 40 deaths, has led to renewed and increased focus on improvements in rail car standards and the transportation of hazardous materials. There had already been amendments to the Canadian Rail Safety Act under consideration when the Lac-Mégantic accident occurred, drawing increased attention to the strengthening of standards and regulations under the act.
Another consequence of the US shale gas boom has been the production of natural gas liquids exceeding the capacity of takeaway pipelines and processing plants. Most industry analysts expect these problems to be handled by market forces (as opposed to policy interventions), albeit over some extended period of time.
Railroads are still about three times safer than pipelines in terms of amounts of oil spilled per ton-mile. Pipelines can be made safer or located in less vulnerable areas, or excavators can take more care to reduce this prevalent cause of leaks. Alternatively, railroad shipments can be routed to better-maintained tracks and other systems, safer cars can be used, and personnel training can be improved. The XL pipeline debate over siting highlights any number of issues with this part of the process.
Canada’s recent Rail Safety Act amendments require that the railroad tank cars mostly likely to leak in case of an accident be immediately removed from Canadian rails, with the next most vulnerable cars phased out within a three-year period. This is a wakeup call to the US regulatory system, which issued advisories and reporting requirements instead. The fact that the oil and gas operators own or lease the cars and have no control of routing may create problems for providing appropriate incentives for minimizing risk and determining liability for accidents.
8 KRUPNICK AND KOPP

Oil Refining
Mexico As noted above, LAUs (environmental operating permits) are required of all oil refineries under
federal jurisdiction. LAUs also require annual reporting on criteria pollutants and their precursors, wastewater discharges, generation and management of hazardous waste, toxic pollutants, ozone-depleting substances, and greenhouse gases.
United States US refineries are regulated for air emissions under the nation’s Clean Air Act and, to a lesser
extent, waste water releases under the Clean Water Act. Regulation of air emissions includes the suite of “criteria” pollutants (sulfur dioxide, carbon monoxide, oxides of nitrogen, particulates, and lead). In addition, refineries must control volatile organic compounds and hazardous air pollutants (HAPs). Regulation of HAPs is especially important for refineries because EPA is required to update the stringency of the regulations at periodic intervals on the basis of new control technology (defined as Maximum Achievable Control Technology). Thus, regulation of HAPs is a never-ending process and will continue to impact refinery operation.
In the future, refineries will become subject to CO2 regulation under the Clean Air Act, following the regulations currently being promulgated for new and existing power plants. There is concern about how such standards might reduce the incentives to build new plants. Only one new refinery has been built since 1998, although several have undergone major modifications. The mismatch between the mix of crude oil now being produced (with more light oil from the Bakken) and the existing refineries’ capabilities (which are designed mostly for heavy crude) is expected to spur further refinery growth.
Canada Canada’s future in refining is less tied to light oil than it is to the oil sands: upgraded capacity
related to the oil sands has increased while traditional refining operations have been in a slight decline.
Similar to those in the United States, refineries in Canada have been subject to regulations for air pollutants and toxins, as well as liquid effluents, for decades. In 2002, the Canadian Council of Ministers of the Environment launched the National Framework for Petroleum Refinery Emission Reductions as a multi-stakeholder process with three goals: protection of human health and the environment; quantifiable emission reductions; and convergence with comparable US refineries in terms of environmental performance (current and anticipated) for emissions levels related to air pollutants and air toxics3. Efforts have also been underway to reduce water use. For example, in a ‘first of its kind’ approach, a refinery in Edmonton, Alberta is using treated wastewater from the city for its energy purposes as opposed to clean water from the Saskatchewan River.
There has been talk about federal regulation of GHG emissions for the refining sector, but it would appear that these regulations would come after the already-delayed regulations on extraction. Alberta does cover these facilities under its Specified Gas Emitter Regulation (SGER), which entails a 12
3 Chamberland, C. (2007). Improving Air Quality in a Competitive Context: National Framework for Petroleum Refinery Emissions Reductions. Workshop #2 of the National Policy Consultation Series on Children’s Health and the Environment. February 27-28, 2007.
9 KRUPNICK AND KOPP

percent emissions intensity improvement target as of January 2007. There is also the potential that the intensity target, or the compliance flexibility prices, may be increased under an expected amendment to the SGER, but this is yet to be seen. Quebec will cover refineries under its cap-and-trade system beginning in 2015, although there will be assistance for these facilities in the form of partial free credit allocation to address competitiveness concerns with refineries in neighboring, uncovered jurisdictions. It is expected this free allocation would decline over time. In British Columbia (BC), refinery gas is covered under the BC carbon tax at a rate of 5.28 cents per cubic meter.
Demand
Quantities of oil and gas traded on North American energy markets and their prevailing prices are affected by regulations on oil and gas extraction, transport, and refining—but also by policies impacting oil and gas demand. In the United States, the most significant demand-related regulations concern electricity generation, light duty vehicles, heavy duty trucks, renewable transport fuels, and the ability to satisfy export demand for LNG. Canada faces similar issues to these, with the added issue of dealing with export concerns related to the oil sands.
Electricity Sector
Mexico
For several decades, the Mexican constitution established that electric power generation, transformation, transmission, and distribution were exclusive activities for state-owned firms. In 2013, unprecedented reforms to the constitution opened up these activities to the private sector. Planning and operation of the sector will now be under the control of an independent, decentralized public institution: the Centro Nacional de Control de Energía (CENACE), which will also control and operate the wholesale electricity market.
All types of power generation (with the exception of nuclear) will be open to public and private firms. The Energy Regulatory Commission (CRE) will be responsible for regulating and granting power generation permits to these firms and CENACE will work to ensure competitive conditions for private and public generators.
Transmission and distribution remain within the federal government (Comisión Federal de Electricidad; CFE). CFE establishes the transmission and distribution fees and guarantees open access to networks for all generators. According to the level of electricity consumption, end users will be classified as either qualified users or basic supply users. Basic supply users will receive electricity from CFE through regulated fees. Qualified users, on the other hand, can buy energy directly from the wholesale electricity market or from independent suppliers where they are free to negotiate prices and terms between the parties.
Alongside Mexico’s reforms of the oil and gas industry have also come reforms designed to boost renewables by opening up the electricity market to private companies. The government's goal is to generate 35 percent of its energy from renewable sources (including hydro) by 2024, up from four percent in 2012. This increase in generation is anticipated to come mainly through solar and wind projects, and be driven in part by renewables mandates as seen in many US states. Businesses are expected to self-generate electricity using distributed renewables generation, as well. Note, however, that some of Mexico’s electricity sector reforms could well reduce the price of electricity, lowering incentives for installing higher-priced renewables.
10 KRUPNICK AND KOPP

United States and Canada
For the past several decades, the US electricity generation sector has been subject to waves of environmental regulation—primarily focused on conventional air pollutants and water use. These regulations continue to impact the sector’s fuel mix and thereby its demand for gas, but they will be overshadowed by the forthcoming regulations under the Clean Air Act’s sections 111(b) and 111(d), limiting emissions of carbon dioxide from new and existing power plants, respectively.
Canada also has federal regulations regarding GHG emissions from new and existing power plants. These regulations (effective July 1, 2015) will limit emissions from coal in new plants to a standard roughly equivalent to emissions from natural gas combined cycle. Provinces in Canada have the opportunity to adopt equivalency approaches to the federal regulation, where they feel that they can meet the same outcomes through alternative means.
In both the United States and Canada, regulations for new power plants likely favor the construction of new gas plants, as coal plants will require carbon capture and storage technology to be deployed. Given the uncertain commercial performance record of carbon capture technology and the equally uncertain regulatory setting for long-term storage, it is expected that these new regulations will further disadvantage coal and lead to greater gas demand.
All indications suggest the regulations for existing power plants in the United States will further incentivize utilities to favor gas over coal, leading to additional coal plant retirements and thereby enhancing the demand for gas (as well as solar and wind).
Currently, 29 states in the United States also have renewable energy portfolio standards (RPS). Although not directly regulating CO2 emissions, these RPS policies will continue to force the deployment of zero-carbon generation within the sector. To the extent these regulations bind on utility capacity investment choices, they can displace new gas generation; however, to the extent the renewables are intermittent and require rapid cycling backup they can increase the demand for gas generation.
Canada has its own approaches for increasing and incentivizing renewable energy deployment, including through provisions in the tax code. Provinces have also developed their own approaches through RPS, feed-in-tariffs and efforts to expand clean energy exports.
Transportation Sector
United States
Changes in the US population and culture and previous fuel economy regulations are leading to a predicted leveling off of passenger vehicle driving and reductions in net oil demand, even as trucking ton-miles are on the upswing. Thus, the rationale for improving fuel economy has shifted away from energy security and toward CO2 emissions reductions. Over the past few years, the federal government launched aggressive, combined Corporate Average Fuel Economy (CAFE) and GHG emissions regulations for light-duty vehicles and also the first heavy-duty truck standards. The CAFE standards are up for a “midterm” review before they become tighter. The federal government is preparing for the next round of truck standards, which will likely be more costly.
Many observers expect a battle over both major federal regulatory efforts, with the vehicle and engine manufacturing sectors saying the standards will be too expensive and EPA (and the National Highway Traffic Safety Administration) defending them on grounds of air quality, CO2 emissions reductions, and energy security benefits, as well as fuel cost savings. RFF researchers have noted
11 KRUPNICK AND KOPP

numerous questions4 to be answered about consumer and manufacturer responses to the regulations and how the costs and benefits should be estimated before these issues can be decided.
Complementing these regulations are other policies by the federal government and the states to increase use of alternative fuel vehicles (tax credits, grants, etc.), change the fuel mix (renewable fuel standards, credits for the sale of alternative fuels, etc.), and improve fuel quality to reduce pollution per unit of fuel used. The US biofuels goals set in 2005 envisioned that a substantial part of fuel demand would be met by cellulosic biofuel. Production of this fuel has consistently fallen short of the year by year targets. Very recently, EPA set a cellulosic biofuel blending mandate equal to the year’s production to avoid levying fines on refineries for fuel that was not actually available for mixing with gasoline and diesel.
Industry has embraced LNG as the fuel of choice for trash trucks, and LNG is increasingly making inroads into the heavy-duty trucking fleet, increasing demand for natural gas as a transportation fuel. LNG corridors are helping to supply natural gas to long-haul trucks; still, the US Energy Information Administration predicts relatively minor penetration of natural gas into the truck market until 2027–2030 and almost no penetration into the light-duty market (Figure 3).
Figure 3. Compressed/Liquefied Natural Gas Use in the Transportation Sector
Source: Energy Information Administration Annual Energy Outlook 2014 Early Release Data, accessed on May 31, 2014, at http://www.eia.gov/forecasts/aeo/er/index.cfm.
4 Alan J. Krupnick, Joshua Linn, Virginia D. McConnell. 2014. Preparing for the Midterm Review of the Fuel Economy and Greenhouse Gas Emissions Rate Standards for Light-Duty Vehicles: A Summary of Priority Research Questions. RFF Issue Brief 14-04. March.
0
100
200
300
400
500
600
700
2011
20
12
2013
20
14
2015
20
16
2017
20
18
2019
20
20
2021
20
22
2023
20
24
2025
20
26
2027
20
28
2029
20
30
2031
20
32
2033
20
34
2035
20
36
2037
20
38
2039
20
40
Trill
ion
Btu
Freight Trucks Light-Duty Vehicles
12 KRUPNICK AND KOPP

Canada
In Canada, the influence of the US market in terms of light- and heavy-duty vehicles more or less dictates that Canada is a “policy taker” when it comes to fuel efficiency and tailpipe standards. Canadian standards for fuel efficiency and tailpipe emissions generally match the current US CAFE standards. Where Canada has been more unique and flexible is in the promotion of alternative fuel vehicles and biofuels.
Canada has a federal regulation requiring a renewable fuel content of 5 percent in gasoline and 2 percent in diesel. Several provinces have stronger mandates, up to 8.5 percent ethanol (Manitoba) and 4 percent biodiesel (British Columbia). There is interest in increasing biofuel blending in Canadian fuels, but with that comes concerns about performance (gelling) in Canada’s cold weather temperatures. Carbon pricing through various forms of taxation of transport fuels also has some influence on transport choices in Canada.
Mexico
Mexico is also a policy taker in terms of its new light-duty vehicle fuel economy standards, recently adopting the new US standards to 2016. This move came with considerable controversy because the Mexican fleet is already skewed to older, less fuel-efficient vehicles and tighter standards would make the price gap even greater. Notably, Mexico has not yet set fuel economy standards for heavy-duty trucks.
As part of a larger energy reform, Mexico imposed a tax on the carbon content of numerous fossil fuels, including gasoline and diesel fuel, effective January 1, 2014. The tax averages $3 per ton of CO2 and is expected to raise $2 billion on an annual basis. While the major purpose of the tax is revenue, it is also a tool of climate policy.
Exports
Mexico
For years, the state-owned Mexican oil company Petróleos Mexicanos (Pemex) has been capital starved and unable to fully exploit its on- and offshore oil and gas reserves. With the new energy reforms that will now permit direct foreign investment in the Mexican oil and gas sector, many expect the rates of Mexican oil and gas production to increase, perhaps considerably, over the next decade. This will almost certainly result in increased oil and gas exports, but the volumes and timing are uncertain, as are the policy developments that will guide any new export capacity and infrastructure.
United States
The LNG export discussion has heated up considerably in the United States over the past few years. In addition to US Department of Energy’s export license permitting, the primary environmental regulation related to exports deals with infrastructure siting. New and relatively unique pieces of infrastructure (LNG liquefaction terminals) must be sited and constructed; not only do these facilities require siting permits from the Federal Energy Regulatory Commission (FERC), but new greenfield sites require an extensive environmental analysis and are subject to an approval process under the National Environmental Policy Act (NEPA). The FERC and NEPA permitting process can be used by various parties to slow or halt siting of the facilities and thereby inhibit gas exports. Exports of oil are currently banned (except to Canada), but lifting this ban is very much an issue.
13 KRUPNICK AND KOPP

Canada
Canadian producers of oil from the oil sands have real concerns about their export market arising from the carbon intensity of the process required to extract the oil. Some argue that the political fight in the United States on the Keystone XL pipeline had a lot to do with its path through ecologically sensitive areas of the United States. However, the greater obstacle comes from climate advocates concerned with the oil sands’ greater lifecycle emissions of CO2. Understanding how these lifecycle emissions are calculated and treated in, for example, the low-carbon fuel standard in California, is important to the demand for Canadian oil.
Sustainable Integration of North American Energy Markets
Among economists there is little doubt that expanded international trade in transparent and competitive markets benefits all countries involved. North America is endowed with significant energy resources and it is now in the enviable position to take advantage of these resources. However, in today’s global economy, maximizing economic growth requires a balance with environmental protection. Achieving these goals will compel some form of greater cooperation within North American energy and electricity markets.
The complete integration of North American energy markets is a herculean task and will take time, political will, and considerable private investment. Numerous policies, large and small, will need to be reformed, harmonized, or simply coordinated. Below are a few areas of environmental policy that seem particularly relevant for early action.
Environmental Impact Assessments and Statements New energy infrastructure is fundamental to the efficient integration of North American energy
markets; therefore, individual country policies that affect siting and construction should be a prime target for reform and coordination. Each country conducts ex ante assessments of major proposed siting and infrastructure projects. These tend to be costly and time consuming, and can be used as a lever to stop or delay projects.
The most obvious difference across countries is in the degree of contentiousness about the EIA process. In Canada, the environmental impact statement (EIS) law passed in 1992 was recently repealed and a new law was put in its place, cutting the number of reviewing agencies from 40 to three. The NGO community says that stringency has been reduced in favor of expediency. IISD rates this issue as the second most contentious energy-related concern after carbon and climate policy issues.
In the United States, the EIS process under the National Environmental Policy Act has its detractors, but this particular policy instrument has not risen to enough prominence for major reform. However, the Obama administration’s development of the EIS for the XL pipeline has led to a new spate of critiques calling for reform of the law and the process to reduce the time, complexity, and cost of the process and block its use as a weapon to stop development. To that end, in May 2014, the US House of Representatives Energy and Commerce Committee passed H.R. 3301, the North American Energy Infrastructure Act. According to the committee’s website, “The bill’s new approval process effectively requires approval of all transboundary pipelines and transmission projects with little or no
14 KRUPNICK AND KOPP

federal environmental review. Modifications to existing cross-border pipelines or transmission lines would not require any approval or review at all.”5 The future of this bill is unknown.
In Mexico, President Peña Nieto is tackling the contentious issue of EIAs in the oil and gas sectors by consolidating the process under the new agency, ANSIPMA. This realignment allows Mexico to devote more resources and expertise to this sector, hopefully streamlining the process and increasing public confidence.
Despite the public controversies, a review of these processes across the three countries could be a first step toward understanding any gaps or inconsistencies, both in the substance and implementation of the EIAs. It will be important to understand how the different countries manage this process before potential reforms can be identified.
Extraction The suite of policies in place to regulate environmental impacts of oil and gas development in the
United States and Canada, and the policies expected to come from Mexico, affect the costs of bringing natural gas and oil to market. For natural gas, the price is also affected; much less so for oil. A harmonized set of policies across the three countries would assure that capital and resulting production are allocated to the projects and plays with the highest “social” rate of return—the highest private rate of return minus the expected environmental damage. This damage can be reduced by tighter, but more costly regulation. Finding that right balance is a difficult job for any jurisdiction, and let alone the three North American countries as a group. Yet this is a goal that needs to be kept in mind when new regulations are being planned and evaluated, such as in Mexico’s reforms of the regulatory system for fossil fuels.
Transportation and Fuels Policies For decades, Canadian and US environmental policies regarding light- and heavy-duty vehicles
have been not only harmonized but homogenized, including the latest round of US CAFE standards for light- and heavy-duty vehicles. Mexico also adopted the most recent US light-duty vehicle standards—both in stringency and the use of the vehicle “footprint” as the basis for the standards—but only through 2016. Depending on the outcome of the US midterm review of its CAFE regulations, it will be important for Mexico to be cognizant of the new standards. Unlike Canada and the United States, Mexico has not adopted fuel economy/greenhouse gas standards for heavy-duty trucks, although they are working on them. Notably, because the Mexican fleet is much older than that of Canada and the United States, Mexican demand for oil is unlikely to fall as rapidly, if at all, whether they keep pace with new US vehicle fuel economy standards or not.
The United States and Canada and their states and provinces do have different priorities on alternative-fueled vehicles, however; for example, the availability of cheap hydroelectric power in Manitoba and Quebec has led to emphasis on electric vehicles that exceeds that found in the United States. Where natural gas is prevalent in Canada (such as in British Columbia), the province is pushing natural gas vehicles. Both countries have used subsidies extensively to promote various types of alternative fuel vehicles, and removed the subsidies once reasonable penetration was reached.
5United States House of Representatives Committee on Energy and Commerce. “H.R. 3301, ‘The North American Energy Infrastructure Act.’ Accessed on May 31, 2014 at http://democrats.energycommerce.house.gov/index.php?q=bill/hr-3301-the-north-american-energy-infrastructure-act.
15 KRUPNICK AND KOPP

But the most controversy between the United States and Canada has been around low-carbon fuel standards, in California and Canada generally. In California, what constitutes a low- or zero-carbon fuel standard is different than in Canada, which takes a more expansive view that includes impacts from fuel exports and imports. This broad view would reduce the carbon footprint of oil from the oil sands relative to competing sources and types of fuels. Consideration of what is needed to achieve harmonization in this area is needed.
Fossil Fuel Transport Trade in oil and gas involves the physical transport of those products, and one would expect
increased transport needs as the market becomes integrated. However, transporting oil and gas is a risky business and developing public confidence in the safety of the transport system is crucial to public acceptance of an expanded, cross-border system.
Canada and the United States have different standards for railroad tank cars and the US timeline for safety improvements is unlikely to match that of Canada. Harmonization is important because of the high level of rail traffic in oil between the two countries, Canada’s stance to deny entry of the most dangerous tank cars, and the rapidly rising prominence of this issue in both countries.
The XL pipeline debate in the United States and the relative lack of debate in Canada suggests that the two countries (and particularly in Alberta) might not be on the same page with respect to pipeline safety reform. These issues will grow with oil sands production. Ultimately, these issues will be determined by the EIA processes in the two countries.
Climate Policy While Canada, the United States, and Mexico have stated climate goals and policies in place to limit
CO2 emissions across the major sources (electric power, transport, and commercial, residential and industrial emitters), there is an enormous degree of heterogeneity in their approaches to the problem. Within the United States and Canada there is added policy heterogeneity at the state and provincial levels that makes coordination even more challenging.
North America does have an immediate opportunity to begin the process of developing a continent-wide climate policy via the current international negotiations under the United Nations Framework Convention on Climate Change. Canada, the United States, and Mexico are signatories to this framework treaty and have the responsibility under the treaty to state their actions to reduce GHG emissions after 2020. A first step toward continental coordination on climate policy could be obtained through a set of organized and reinforcing statements submitted by the three countries.
A second round of harmonizing actions could proceed in any of a number of ways. Two of the most obvious would be harmonization and coordination across sectors or geography. Geographic harmonization has already been discussed among US states and Canadian provinces to link cap-and-trade programs. Adding Mexican states to the mix under a cap or an offset mechanism could also take place. At a minimum, the current conversations that exist between US and Mexican cross-border governors could be expanded to consider the integration of GHG emissions policies within their states.
Sectoral harmonization is already taking place with respect to the transport sectors (especially between the United States and Canada with fuel economy standards for light duty vehicles). Now is an opportune time to begin harmonizing the electric power sector regulations, as the United States moves forward under the Clean Air Act and Mexico begins to restructure its electricity sector under the new agency, CENACE.
16 KRUPNICK AND KOPP

Both Canada and Mexico have carbon taxes in place, at the federal level in Mexico and the provincial level in Canada. While a federal carbon taxes in the United States have been discussed for years, there has been little political support so far. However, such pricing could take root at the state level, and Canadian provinces and Mexico might encourage the United States to follow their lead.
17 KRUPNICK AND KOPP

ATTAINING SUSTAINABLE DEVELOPMENT OF OIL AND GAS IN NORTH AMERICA: US POLICY BRIEFS
Alan J. Krupnick, Madeline Gottlieb, and Raymond J. Kopp1
June 8, 2014
This document supports an RFF Summary Report entitled Attaining Sustainable Development of Oil and Gas in North America: A Review of the Environmental Regulatory
Landscape.
Introduction
The following set of policy descriptions was put together by researchers at Resources for the Future as part of an international review of environmental policies governing oil and gas development in Canada, Mexico, and the United States. The policy briefs presented here cover the United States, with Canada and Mexico covered in companion documents. The broader set is reflected in a summary report covering all three countries.
This document includes brief descriptions of policies governing the oil and gas production process, from extraction (well-site permitting onward) to end use in the transportation and electricity sectors. Each description provides context, the current state of regulation and best practice, and commentary options for reform and, in some cases, harmonization.
1 Krupnick is a senior fellow at Resources for the Future (RFF) and director of RFF’s Center for Energy Economics and Policy, [email protected]; Gottlieb is a contracted Senior Research Assistant at RFF; and Kopp is an RFF senior fellow and director of RFF’s Center for Climate and Electricity Policy, [email protected].

Table of Contents Well-site Permitting ............................................................................................................................. 1
Performance Bonds .............................................................................................................................. 2
Silica Sand Mining ................................................................................................................................. 4
Freshwater Withdrawals .................................................................................................................... 5
Setback Restrictions ............................................................................................................................. 6
Casing and Cementing ......................................................................................................................... 8
Liquids Handling ................................................................................................................................... 9
Wastewater Treatment Facilities .................................................................................................. 10
Underground Injection Control ...................................................................................................... 11
Fugitive Methane Standards ............................................................................................................ 13
Fluid Disclosure ................................................................................................................................... 14
Truck Traffic ......................................................................................................................................... 15
Compensation for Damages ............................................................................................................. 16
Deepwater Drilling ............................................................................................................................. 17
Bans and Moratoria ............................................................................................................................ 18
Pipeline Safety Act 2011 ................................................................................................................... 20
Pipeline Siting Requirements ......................................................................................................... 22
Pipeline Excavation Damage Prevention .................................................................................... 23
Track Safety Standards (improving rail integrity) .................................................................. 25
Tank Car Requirements .................................................................................................................... 26
Tank Car Staff ....................................................................................................................................... 27
Crude Oil Classification ..................................................................................................................... 28
Maximum Achievable Control Technology (MACT I & II) Applied to Refineries .......... 29
New Source Performance Standards (NSPS) for Refinery Flares ....................................... 30
Refinery Wastewater ......................................................................................................................... 30

Proposed Carbon Pollution Standard for New Power Plants .............................................. 31
Proposed Carbon Pollution Standard for Existing Power Plants ....................................... 32
Renewable Portfolio Standards (RPS) ......................................................................................... 33
Regional Greenhouse Gas Initiative (RGGI)/California Global Warming Solutions Act (AB 32) ................................................................................................................................... 35
Corporate Average Fuel Economy (CAFE) Standards ............................................................. 36
Phase II Fuel Efficiency/GHG Emissions Standards for Heavy-Duty Trucks .................. 38
Renewable Fuel Standard ................................................................................................................ 39
LNG Export Terminal Siting ............................................................................................................. 40
Sources .................................................................................................................................................... 42

Well-site Permitting
Context • State agencies are in charge of permitting drilling on state and private lands, and the federal
Bureau of Land Management (BLM) issues permits for well sites on federal lands.
• States are considered to issue permits much faster than BLM, but often are not transparent about the metrics used in assessing permits.
• According to the federal Government Accountability Office (GAO), BLM received half as many applications to drill in 2012 as it had in 2007 [1].
• In 2013, BLM reported that it had been unable to process completed applications to drill within the 30-day deadline required by the Energy Policy Act of 2005 [1].
Current Policy • States
o Regulations vary significantly. Some states require little information beyond the location of the proposed well and what it will be drilled for, and others require detailed information, such as proximity to buildings and waterways, type of fluids that will be used to fracture the well, etc.
• BLM
o BLM is required by law to ensure that applications comply with all pertinent rules and regulations. It must also review lease requirements or stipulations and conditions of approval (such as wildlife habitat protections or well control equipment testing).
Commentary • GAO recommends that BLM keep better notes of its permitting so that the process can be
more effectively reviewed. GAO also recommends that BLM increase its staffing to allow for more efficient, faster permit review [1].
• For states, it might be helpful to have a guidance document for the kinds of information that states should be collecting, and what process they should use to review that information. All of this should be publicly available.
• There is a research need as to whether states that take longer to provide permits are seeing less drilling activity on nonfederal lands, other things equal.
• In general, the responsible government agency should be charging permit application fees commensurate with providing efficient and thorough service.
1
Performance Bonds
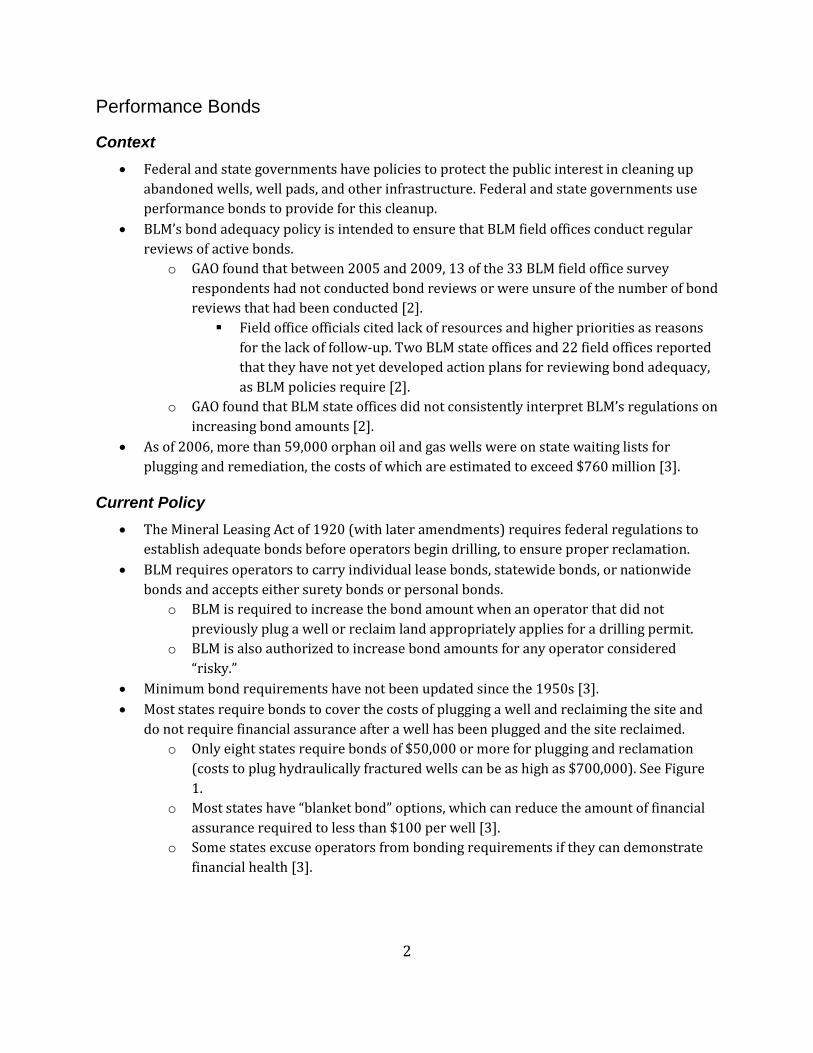
Context • Federal and state governments have policies to protect the public interest in cleaning up
abandoned wells, well pads, and other infrastructure. Federal and state governments use performance bonds to provide for this cleanup.
• BLM’s bond adequacy policy is intended to ensure that BLM field offices conduct regular reviews of active bonds.
o GAO found that between 2005 and 2009, 13 of the 33 BLM field office survey respondents had not conducted bond reviews or were unsure of the number of bond reviews that had been conducted [2]. Field office officials cited lack of resources and higher priorities as reasons
for the lack of follow-up. Two BLM state offices and 22 field offices reported that they have not yet developed action plans for reviewing bond adequacy, as BLM policies require [2].
o GAO found that BLM state offices did not consistently interpret BLM’s regulations on increasing bond amounts [2].
• As of 2006, more than 59,000 orphan oil and gas wells were on state waiting lists for plugging and remediation, the costs of which are estimated to exceed $760 million [3].
Current Policy • The Mineral Leasing Act of 1920 (with later amendments) requires federal regulations to
establish adequate bonds before operators begin drilling, to ensure proper reclamation. • BLM requires operators to carry individual lease bonds, statewide bonds, or nationwide
bonds and accepts either surety bonds or personal bonds. o BLM is required to increase the bond amount when an operator that did not
previously plug a well or reclaim land appropriately applies for a drilling permit. o BLM is also authorized to increase bond amounts for any operator considered
“risky.” • Minimum bond requirements have not been updated since the 1950s [3]. • Most states require bonds to cover the costs of plugging a well and reclaiming the site and
do not require financial assurance after a well has been plugged and the site reclaimed. o Only eight states require bonds of $50,000 or more for plugging and reclamation
(costs to plug hydraulically fractured wells can be as high as $700,000). See Figure 1.
o Most states have “blanket bond” options, which can reduce the amount of financial assurance required to less than $100 per well [3].
o Some states excuse operators from bonding requirements if they can demonstrate financial health [3].
2
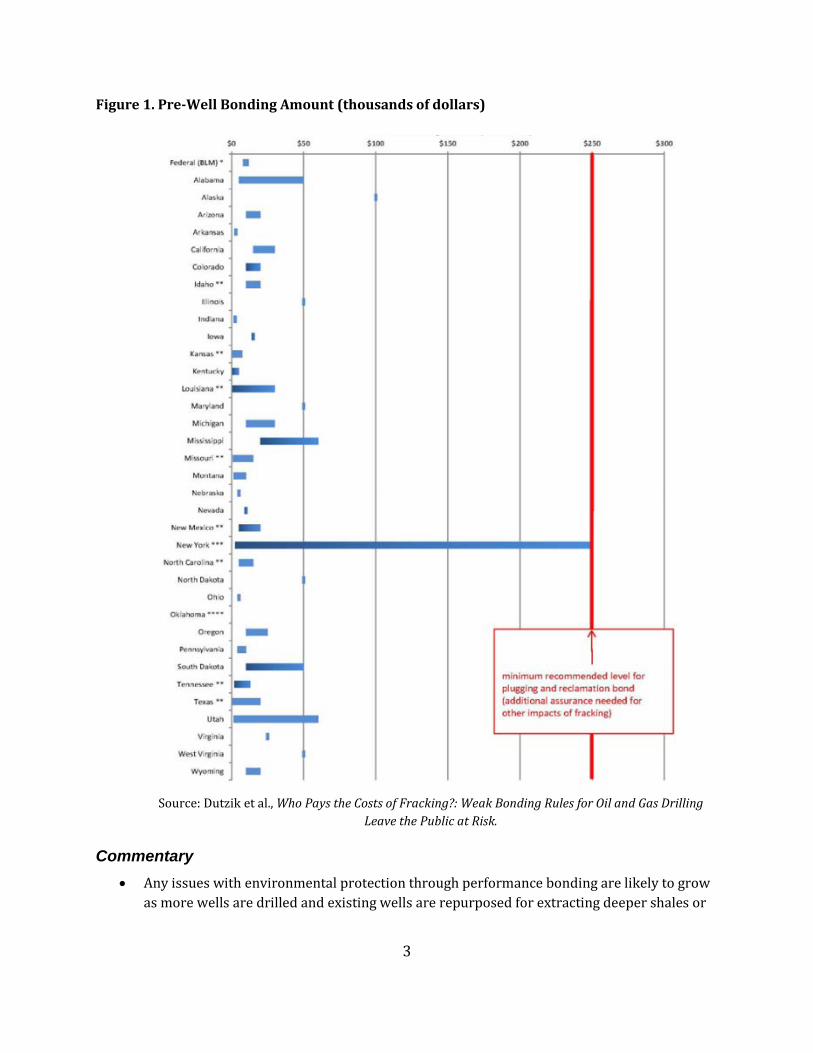
Figure 1. Pre-Well Bonding Amount (thousands of dollars)
Source: Dutzik et al., Who Pays the Costs of Fracking?: Weak Bonding Rules for Oil and Gas Drilling
Leave the Public at Risk.
Commentary • Any issues with environmental protection through performance bonding are likely to grow
as more wells are drilled and existing wells are repurposed for extracting deeper shales or
3

refracking, which likely raises the number of times well ownership changes and makes responsible parties harder to track.
• We agree with GAO, which recommends significant increases in minimum bond requirements (currently $10,000 for individual bond, $25,000 for statewide bonds, and $150,000 for national bonds), given information that reclamation of a site would cost around $100,000 [2].
o GAO also recommends increasing resources for bond reviews [2]. • PennEnvironment suggests that bonds cover a wider range of activities and potential
damages, that minimum bond requirements be increased to at least $250,000 per well, and that exemptions and blanket bonding be eliminated [3].
• Carnegie Mellon researchers found that the cost of plugging a well and reclaiming the site is approximately $100,000 and bond requirements should be increased significantly to account for those high costs. They also assert that blanket bonds should not be permitted unless that bond requirement is similarly increased.
Silica Sand Mining
Context • Silica sand, commonly used as a proppant for hydraulic fracturing, is being heavily mined in
Minnesota, Wisconsin, and Iowa because of this sand’s perfect crystalline structure. • The oil and gas industry used 56.3 billion pounds of sand in 2013, which represents a 25
percent increase since 2011, with a projected 20 percent continued increase in the next two years [4].
o During the first nine months of 2013, the energy industry bought $245 million worth of sand, 62 percent of US silica sales (up from 53 percent during the same period of 2012, and up from 33 percent during the same time period in 2011) [4].
• Residents in areas with sand mining have complained of airborne particulate matter, and some scientists are concerned about the potential for diseases like silicosis [4].
Current Policy and Best Practice • Sand mining is currently regulated like other nonmetallic mining in Minnesota, Wisconsin,
and Iowa. o Wisconsin Administrative Code Section NR 415.075(2) requires a fugitive dust
control plan before operations begin. • In 2013, Minnesota passed a suite of laws requiring special permits for silica sand mining
within one mile of a trout stream. It recently passed a series of optional standards that build on the 2013 regulations [5].
o The rule, HF 976, tasked the state’s Department of Natural Resources with creating rules for site reclamation, the Department of Health with creating air quality rules for silica, and the Pollution Control Agency with developing regulations for particulate emissions.
4

The Department of Health established a silica health-based value of 3 micrograms/square meter.
The other two departments have yet to promulgate rules. • To minimize local exposure to silica dust, mining operators can store sand indoors, use
tarps, cover trucks and rail cars, apply water or other dust-suppressing sprays, and use other mechanical control devices [6].
• Engineered proppants like ceramic and resin avoid many of the environmental issues associated with silica sand mining. Ceramic and resin proppants currently account for 10 percent each (20 percent total) of the proppant market in the United States. Silica sand is still much cheaper but producers expect ceramic proppants to continue to grow in market share [7].
Freshwater Withdrawals
Context • Each horizontally drilled, hydraulically fractured well requires about 5 million gallons of
water, a relatively small amount compared with other industrial water uses, but the time and place of the extraction may change its overall impact.
• Ambiguity in some states’ rules has caused local governments to step in to regulate water withdrawals.
o For instance, in Karnes County, Texas, in the Eagle Ford shale play, oil and gas drillers must apply for a permit from the local groundwater authority, which limits how much water can be withdrawn and requires companies to report how much they use. In neighboring Dimmit County, drillers can pump as much water as they want and no permit is required [8].
o Texas does not allow groundwater districts to require permits for water for oil and gas well “drilling and exploration operations,” though some localities argue that fracking is a production process [8].
Current Policy and Best Practice • The Susquehanna River Basin Commission regulates water withdrawals in its river basin,
which runs through New York, Maryland, and Pennsylvania. o In October 2008, the commission began requiring natural gas producers to apply for
a permit for a water withdrawal of any size. o In each of its approvals, commission reviews the timing, location, and amount of
withdrawals and sets a maximum withdrawal quantity. Approval does not necessarily guarantee that the approved quantity will always be available for withdrawal, since withdrawals must be temporarily halted at a prescribed “low flow.”
• State-of-the-art best practice is for government to use ecosystem-based models to determine the impacts of various water withdrawals.
5

• Every state regulates industrial water withdrawals generally, but very few have regulations pertaining specifically to oil and gas development.
o A few states make judgments on environmental damages and then deny or limit permits accordingly.
o Most require permits for withdrawals over a minimum threshold, and a few require registration and reporting of withdrawals over the minimum (but approval is not necessary).
• Industry is moving to reduce freshwater use by recycling produced water and adopting fracking fluid technologies requiring lower water volumes.
Commentary • Incentives, such as water withdrawal fees, can reduce water use. Such incentives could be
design to vary with season, location, and amount withdrawn. • The Susquehanna River Basin Commission system could be adopted by other states. • A number of studies have compared water stressed areas around the United States with oil
and gas fracking areas. The resulting maps show places with significant overlap, but overlap does not mean that the oil and gas operations are the primary cause of water stress, or that further regulation in these areas will reduce stress. For instance, oil and gas companies can be using salt water rather than freshwater, and agricultural water use can completely dominate oil and gas freshwater use.
Setback Restrictions
Context • Proximity of well pads to buildings and water sources (and even forest habitat) could pose
accident and pollution risks to people and the environment if a well site is located too close to a fragile ecosystem or human settlement.
o For instance, in 2013, a spill at a well site in Kentucky caused massive fish kills, including kills of a threatened species, and in 2009, a spill of 8,000 gallons of frack fluids near Dimock, Pennsylvania, caused another fish kill [9].
o Researchers in Colorado examined surface water in drilling areas where spills had occurred and found endocrine-disrupting chemicals that can cause reproductive, metabolic, neurological, and other diseases, especially in children [10].
Current Policy and Best Practice • State regulations generally take a command-and-control approach but vary widely in
specific distances from homes, schools, hospitals, rivers, lakes, etc. o More than half of the states currently developing oil and gas have setback
restrictions from buildings (ranging from 100 to 1,000 feet), but less than half have setback restrictions from water bodies (also ranging from 100 to 1,000 feet). See Figure 2.
6

Figure 2. Setback restrictions from buildings
Source: Richardson, Nathan, Madeline Gottlieb, Alan J. Krupnick, and Hannah Wiseman. 2013. The State of State Shale Gas Regulation. Washington, DC: Resources for the Future.
Commentary • The Nature Conservancy is developing a model to aid in well pad placement. An optimal
model would trade off the costs of deviating from the economically most advantageous site within a leased area against the value of the expected environmental, property, and human health damage.
• States without setback restrictions should justify why they are not needed. • Performance standards would be more flexible than the dominant command-and-control
approach but require greater regulatory capacity.
7

Casing and Cementing
Context • Poor casing and cementing have allegedly contaminated water in several instances around
the country. o In 2011, the US Environmental Protection Agency (EPA) announced that fracking
fluids had contaminated water in Pavillion, Wyoming; however, the investigation was dropped.
o A series of studies by Duke researchers, published in the Proceedings of the National Academy of Sciences, found that shale gas development had contaminated groundwater in Pennsylvania [11, 12]. These studies have been challenged by other experts.
• A 2012 study by hydrogeologist Tom Myers, published in Ground Water, found that fracking fluids can migrate through the wellbore to the surface in the Marcellus play inless than a decade [13].
• Industry-sponsored reports show that they expect anywhere from 18 to 45 percent of wells to have well integrity issues (which could potentially allow for fluid or gas migration) [14, 15].
• Nondisclosure agreements with affected landowners prevent research and understanding of actual risks.
Current Policy and Best Practice • Regulations vary across states, with some requiring a specific number of casing layers (from
one to four), set to a specific depth below the water table (from 30 to 100 feet) and cemented to a specific height within the wellbore (above the shoe, to the surface, etc.); others simply require a casing to be used and provide no specifications.
o Most state regulations are command-and-control, though there are a few performance standards that require operators to “protect all fresh water.”
• Many innovations in drilling techniques and fluids are being made to reduce leak risks. • Independent best practice suggests that casing should be set and cemented below the water
table, and multiple layers of casing are generally considered superior to fewer.
Commentary • Data collection and reporting systems need to be developed to enable regulators and
researchers to assess the risks of groundwater contamination from faulty cementing and casing operation, over space and over well lifetime, and the factors that can reduce risks.
• Pennsylvania’s presumptive liability rule is potentially a good model for other states to follow. This rule holds operators responsible for any contamination that occurs within 12 months of the beginning of unconventional oil and gas operations within a 2,500-foot radius
8

of the well site; one of the defenses against the presumption is a predrilling baseline groundwater testing survey.
Liquids Handling
Context • Frack fluids pose different risks at different points in the development process, and little is
known in the public domain about the composition and quantities of produced water, partly because it is thought to be so heterogeneous across wells, even in the same play.
• Work in progress at RFF shows that produced water concentrations of many hazardous substances exceed drinking water and even in-stream standards. But these liquid wastes are not supposed to be released to the environment untreated.
• Unless mitigation measures are taken, openly storing fluids in pits and ponds creates potential for spills and threatens wildlife from drowning or ingestion of toxic fluids.
• Ultimately, some liquid wastes need to be treated and released or permanently disposed of. Research at RFF on the routes being taken by trucks suggests that most Marcellus wastes are going to commercial waste treatment facilities, some hundreds of miles from the well site. Few shipments in our sample are going to Ohio deep injection wells.
Current Policy and Best Practice • No states require recycling and no states require the elimination of pits and ponds to store
flowback and produced water, though some states limit which substances can be stored in pits or ponds and which substances need to be stored in closed tanks.
• Best practice is to reuse liquids to frack additional wells, reducing freshwater and ultimate disposal costs. Best practice is also to have closed-loop systems for drilling, flowback, and produced water [16]. Only 25 percent of drilling rigs offer closed-loop drilling fluid systems.
Commentary • Several states are beginning to implement water-cycle planning, in which operators must
detail how they will handle and treat water from start to finish, approaching it as a holistic system instead of piecemeal.
• There are several options for improving liquids handling from start to finish: o Recycle and reuse produced water o Use low-toxicity additives o Employ closed-loop storage options
• Greater understanding of industry liquid-handling economics and the influence of regulation is needed.
9

Wastewater Treatment Facilities
Context • Anywhere from 10 to 50 percent of the fracturing fluid used to fracture a well will flow back
up and out of the wellbore and need to be either reused or disposed of [18]. o Wastewater can be disposed of many ways, including treatment and discharge at
publicly owned treatment works (POTWs) or centralized waste treatment facilities (CWTs).
• Research has shown that not all wastewater treatment plants are equipped to properly treat shale gas wastewater.
o RFF’s water quality study found that treatment of shale gas wastewater by POTWs in a watershed raises downstream chloride concentrations.
Current Policy and Best Practice • In 2010 Pennsylvania asked operators to voluntarily stop bringing wastewater to POTWs
for disposal and within several months had achieved high compliance [19]. • Indirect discharges of unconventional oil and gas wastewater via POTWs are subject to
EPA’s General Pretreatment regulations. o EPA is proposing to amend the Effluent Limitation Guidelines for shale oil and gas
wastewater to ensure that CWTs are adequately treating such waste before disposing of it; the amendments are scheduled to be posted in 2014.
• State policies on wastewater disposal vary; several states require applications or permits to discharge wastewater to surface waters, and some operate on a case-by-case basis.
• The American Petroleum Institute (API) suggests that operators consult local regulations to determine whether POTWs and CWTs are viable disposal options and that operators may need to disclose chemical compositions to be allowed to deposit wastes at those facilities [16].
Commentary • API posits that future disposal needs are unlikely to be met by POTWs because of regulatory
and other challenges and therefore suggests investing in private or industry-owned treatment facilities. Further, API says that an evolving practice in active drilling areas is to set up temporary treatment facilities to treat waste on site, thus reducing transportation needs [16].
• The Natural Resources Defense Council recommends that states and/or the federal government develop pretreatment standards and set a total maximum volume of wastewater that POTWs are allowed to accept. It points to Pennsylvania’s standard of 500 mg/L total dissolved solids and 250 mg/L chlorides as a sufficiently stringent example for others to follow [19].
o The Natural Resources Defense Council also recommends that EPA update the Effluent Limitation Guidelines to limit discharges of naturally occurring radioactive
10

material (NORM), total dissolved solids, and bromides, which were not considered in the original guidelines [19].
Underground Injection Control
Context • Underground injection has become a common form of wastewater disposal. Texas alone has
8,000 disposal wells, and the amount of wastewater injected underground increased from 46 million barrels in 2005 to 3.5 billion barrels in 2011 [20].
o According to EPA, about 28,000 Class II injection wells are being used for wastewater disposal in the United States [21].
• Recent studies have linked seismic activity in numerous states to underground wastewater injection wells.
o Scientists concluded that a series of earthquakes (reaching magnitude 3.9) in Youngstown, Ohio, were caused by the local wastewater injection well [22].
o A recent US Geological Survey (USGS) study found that a magnitude 5.0 earthquake in Prague, Oklahoma, was caused by fluid injection [23]. See Figure 3.
o In 2013 USGS researchers concluded that an earthquake swarm in New Mexico and Colorado along the Raton Basin was caused by underground wastewater injection [25].
11

Figure 3. USGS map of earthquake swarm in Oklahoma
Source: USGS, “Oklahoma Struck by Series of Quakes,” Nov. 2011.
Current Policy and Best Practice
• EPA oversees underground wastewater injection, but states can apply for supremacy (39 states have primary authority).
o The application for a permit to drill an injection well must include the location and depth of the proposed well.
o After receiving a permit, the operators must observe, record, and report the injection pressure, flow rate, and cumulative volume each month; they must also conduct mechanical integrity tests on the wells at least once every five years.
• All states allow, and some even encourage, underground injection of wastewater. o In light of recent seismic events, some states have begun enacting rules about where
injection wells can be located, and many local bans on injection wells have been enacted, such as in Arkansas, Ohio, and Texas.
o Though Pennsylvania does not formally ban underground injection of wastewater, the state Department of Environmental Protection says that the geology generally
12

does not allow for it, so wastewater is often shipped to Ohio or West Virginia for injection. Nevertheless, several new injection wells are opening in Pennsylvania this year.
• Industry best practice is to reduce throughput, thus reducing the volume of wastewater [16].
Commentary • Underground injection is considered by many, including API, to be the best option for
wastewater disposal, if done properly [16]. • Mark Zoback, of Stanford University, suggests several steps that operators can use to
minimize seismicity impacts from injections [24]: o Use seismic imaging to ensure that the injection site is not located near an active
fault line. o Minimize the volume of fluid injected. o Utilize highly permeable regional saline aquifers. o Install local seismic monitoring arrays. o Establish modification protocols in advance (so that operators have a
predetermined system for halting injections as necessary).
Fugitive Methane Standards
Context • According to EPA’s 2012 CO2 Emissions Inventory, about 2 percent of US CO2-equivalent
(CO2e) emissions are from fugitive methane, though other estimates have a wider range and some scientists argue that even with fugitive methane releases, oil and gas are still “cleaner” than coal or diesel. Others argue the reverse.
• A study by the Environmental Defense Fund found that about half of the 40 percent reductions that are currently possible are no-cost reductions [26].
Current Policy • EPA’s Green completion standards go into full effect in January 2015.
o Phase one requires combustion devices (flares) be used until operators are able to implement green completions, which are required beginning in 2015.
o These regulations ostensibly were designed to target volatile organic compounds (VOCs), not methane, but have the ancillary benefit of reducing methane emissions.
o API says the rule will cost $780 million over four years, but EPA contends it should save the industry $11 million to $19 million over the same timeframe [27, 28].
• Colorado recently passed the first state rules to directly reduce methane and VOCs from oil and gas development. Violations of ozone standards in the state were a key driver.
13

o The rules will reduce annual emissions of VOCs by 90,000 tons and methane by 100,000 tons; the rules also contain the nation’s strongest leak detection and repair regulations, including requirements for monthly inspections at the largest sources [29].
• In March 2014, EPA proposed a rule requiring oil and gas operators to report greenhouse gas emissions from their operations.
Commentary • We are skeptical that many fugitive methane emissions reductions are “free,” as suggested
by the Environmental Defense Fund study. • The continuing debate about the percentage of production leaking and the unfavorable
comparisons of natural gas to coal on CO2e grounds are harming industry’s license to operate.
• Some natural gas operating companies are beginning to organize efforts to pledge to reduce methane emissions and ultimately create a tradable methane credit market.
• EPA is expanding its voluntary Gas Star program to include a GOLD designation that rewards companies for reducing methane emissions. So far the program has reportedly been effective and could be a good carrot to complement EPA’s sticks.
• A carbon-pricing regime that incorporated fugitive methane emissions would do much to efficiently reduce CO2e mitigation costs.
Fluid Disclosure
Context • Industry and environmental and health groups have been arguing about the appropriate
trade-off between secrecy in tracking fluid formulations (for competitive reasons and to stimulate innovation) and the public’s right and need to know what is in these fluids (for public and environmental health reasons).
• Transparency improved when the Groundwater Protection Council and the Interstate Oil and Gas Compact Commission created FracFocus, a website where oil and gas companies can voluntarily disclose their fluid mixtures.
o FracFocus has been criticized for being voluntary (calling into question the accuracy and completeness of information provided) and difficult to use (because the data cannot be downloaded and are thus difficult to analyze).
o The US Department of Energy has provided support for the website.
Current Policy and Best Practice • Requirements are highly varied across states, with most states now requiring some form of
disclosure. o About half of the states with disclosure rules require mandatory disclosure to
doctors, though doctors are often required to sign nondisclosure agreements.
14

o All states allow for trade secret exemptions, though some states require a justification of this designation for each chemical and some do not.
• BLM’s revised proposed Hydraulic Fracturing on Indian and Federal Lands Act includes disclosure requirements, using FracFocus as the mode of reporting. BLM’s rules require postfracturing disclosure and provide exemptions for trade secrets.
• One best practice from the major fracking fluid suppliers is that set by Schlumberger for the state of Wyoming four years ago: to provide each chemical’s name, mass, and concentration to its operating company clients, which then decide on their own whether to disclose the information or follow regulations to make the information available to the state and/or to FracFocus. What is not being disclosed is the recipes for making company products. Baker-Hughes just announced it will adopt the same company policy as Schlumberger. Schlumberger argues that for all practical purposes, it is making full disclosure. Company calculations from FracFocus show that trade secrets claims appear in less than 5 percent of FracFocus records for wells fracked by Schlumberger.
• On the fluids themselves, industry best practice is moving to use lower concentrations of and less toxic chemicals.
Commentary • Disclosure is important for determining sources of groundwater contamination, treating
people who have been exposed to chemicals in accidents, and making a holistic assessment of the industry’s impact.
• Required full adoption of the Schlumberger disclosure model and mandatory disclosure in state and federal rules would go a long way to addressing public concerns.
Truck Traffic
Context • Oil and gas development has moved into rural and suburban neighborhoods unaccustomed
to such industrial activity, causing a backlash in some areas. • Fracturing a single well requires between 2,300 and 4,000 truck trips (considerably more
than conventional drilling) for delivery of water and other inputs, which can add to road congestion, road damage, and traffic accidents [30].
• US census data in six drilling states show that in some areas, traffic fatalities have more than quadrupled since 2004, even as most American roads have become safer [30].
o In North Dakota drilling counties, the population has increased 43 percent while traffic fatalities have increased 350 percent [30].
o RFF analyses of drilling and truck accident statistics since 2004 in Pennsylvania suggest that each additional well drilled per month per county results in a 2 percent increase in heavy-duty truck accidents [31].
15

Current Policy and Best Practice • To try to minimize community disturbances, some local governments have begun to pass
rules limiting which roads trucks can use, but these rules are sparse and often ineffective. • North Dakota is adding turning and climbing lanes to give drivers a safe way to pass trucks
and is also widening a stretch of heavily used Route 85 [32]. • Pennsylvania and Texas transportation departments have launched safe driving campaigns
aimed at minimizing such accidents [32]. • Federal rules limit the amount of time that truck drivers can spend on the road, but these
regulations are less stringent for drivers in the oil and gas industry [32]. • Industry is trying to limit freshwater needs and use pipelines to reduce trips [32].
Commentary • Increased accident rates are a consequence of industrial activity, so no special blame falls on
the industry. RFF’s expert survey showed that industry is quite aware and concerned about this problem, suggesting that it has been internalizing the costs.
• To the extent road damage, inadequate signage, a lack of enforcement, and other inadequacies of local and state funding are the problem, new revenue streams and greater accountability are needed. Severance taxes and Pennsylvania’s impact fee system are not the best approach because they are not based on damages (see “Compensation for Damages,” below).
Compensation for Damages
Context • Economic efficiency in the presence of externalities suggests that mechanisms be in place
for oil and gas operators to internalize damages they do to communities. This internalization should come ex ante, through regulatory activities, but it may also come ex post, through compensation for damages. Because activities are repetitive over time, damage compensation can be seen as a deterrent to future externality-causing behavior. Nevertheless, there are no institutionalized compensation schemes at the state or local level, the closest being Pennsylvania’s impact fee system. Any aggrieved party can seek compensation through the liability system, however.
Current Policy • Pennsylvania’s impact fee system was passed in 2012 as a substitute for severance taxes.
o Fee is per well. It begins at $40,000 per year (assuming gas prices are less than $2.25/mcf) and is reduced each year for three years, then stays at $10,000 per year from year 4 to year 10 [33].
16

o It has generated an average of more than $200 million per year in revenues, though estimates show that only 50 percent of the collected fee actually reaches the affected areas.
• Pennsylvania’s impact fee is not tied to actual impacts but rather is a schedule over time that depends partly on natural gas prices (like some state severance taxes); only a fraction of the collected revenue goes to communities and none to individuals. Thus internalization of damages is not occurring.
Commentary • Better instrument design is needed so that community impacts are taken into account when
the fee is set.
Deepwater Drilling
Context • Deepwater drilling in the Gulf of Mexico alone produces 1.6 million barrels of oil per day (70
percent of the Gulf’s oil production, and 23 percent of total US crude oil production), more than a fifth of the world’s offshore drilling units, and 7 percent of total US natural gas production [34, 35].
• The 2010 BP Deepwater Horizon oil spill raised awareness of the growing number of offshore accidents.
o In the first 10 months of 2010, the Gulf of Mexico alone saw seven incidents in which the drilling crew lost control of a well [36].
o RFF research shows a strong statistical relationship between well depth and the probability of a significant accident.
Current Policy • In 2012 the Bureau of Safety and Environmental Enforcement enacted new safety rules for
offshore drilling, with the following purposes: o To define testing requirements for cement o To clarify requirements for dual mechanical barriers o To extend requirements for blow-out preventers and well-control fluids to well
completions, workovers, and decommissioning operations • In 2013, Congress approved the RESTORE Act to allocate 80 percent of Clean Water Act
fines to ecosystem restoration in the Gulf. • The Department of the Interior (DOI) restructured its oil and gas organization to clarify and
separate the missions of the former Minerals Management Service into three separate agencies, each with its own focus and resources.
17

Commentary • President Obama’s Oil Spill Commission writes annual “report cards” addressing the
progress made on its recommendations. The commission also believes that DOI’s changes to regulations were less extensive than they should have been. For example, it would like to see the following reforms [36]:
o Extend the period for approving exploration plans from 30 to 60 days o Provide protection for whistleblowers o Substantially increase liability cap and financial responsibility limits (currently $75
million) o Increase the existing $1 billion per incident limit on payouts from Oil Spill Liability
Trust Fund o Fund the Bureau of Safety and Environmental Enforcement (BSEE) and the Bureau
of Ocean Energy Management (BOEM) with user fees • One of the more interesting reforms planned by DOI is adoption of a “near miss” reporting
system, similar to that used by the Federal Aviation Administration, to aid in developing measures to avoid future accidents.
• Donald Boesch, who served as commissioner of the National Commission on the BP Deepwater Horizon Oil Spill and Offshore Drilling, recommends advancing various measures to create more certainty and improve environmental oversight [36]:
o Congress and DOI should create a Leasing and Environmental Science office to foster environmentally responsible and efficient development.
o Congress should provide mandatory funding (not tied to annual appropriations) for oil spill research and development, in addition to a tax credit for research and development, to encourage private investment in response technology.
o Congress should maintain its risk awareness by appointing a subcommittee to oversee offshore safety and environmental risk, require annual reports from DOI on risks, and require oversight hearings on the state of technology and safety.
Bans and Moratoriums
Context • Federalism issues have arisen as local governments have asserted themselves in the
regulation of shale gas development; some states have chosen to support local regulations, and some states have passed legislation to preempt local regulation.
• Local bans can effectively render drilling uneconomical in large regions if enough of the shale is off limits.
Current Policy • Vermont is the only state with a statewide ban on fracking, but New York and other states
have moratoriums, and several states have local bans. See Figure 4.
18

• State courts in New York and Colorado upheld local bans, but a precedent-setting case in state court in West Virginia struck down a ban in Morgantown, and the Pennsylvania supreme court threw out this attempt to preempt local bans and regulatory efforts by the state.
• Colorado is seeking to define power-sharing arrangements between local government and the states to enhance use of memoranda of understanding that locals use with operators to gain agreements on acceptable behavior, short of rulemakings [37].
Figure 4. Bans and Moratoriums
Source: Richardson, Nathan, Madeline Gottlieb, Alan J. Krupnick, and Hannah Wiseman. 2013. The State of State Shale Gas Regulation. Washington, DC: Resources for the Future.
Commentary • A ban is a very blunt instrument. It eliminates risks to the local community rather than
managing the risks and reaping the economic benefits. But a local community may have preferences different from those of the state government, and those preferences need to be respected and taken into account.
• Bans may cause more intense development elsewhere, thereby relocating risks rather than limiting them.
• Moratoriums allow states and localities time to learn more about the extraction process and proper regulations before drilling proceeds; they are viewed by some as a smart way to
19

approach sustainable development, but by others as an indefinite postponement of the time when the jurisdiction can realize the economic benefits of drilling.
Pipeline Safety Act 2011
Context • The United States currently has 2.5 million miles of pipelines carrying oil and gas around
the country [38]. See Figure 5. • Pipelines are generally considered a safe mode of transport for oil and gas: based on fatality
data from 2005 to 2009, pipelines are 70 times safer than trucks (which transported less fuel but killed four times the number of people) [38].
• Recent accidents like the 2010 explosion in San Bruno that left 8 people dead and the 2010 accident in Michigan that spilled 840,000 gallons of crude into the Kalamazoo River (at $800 million, the most expensive pipeline accident in US history) have raised public awareness and concern about pipeline safety [38].
• Underground pipelines can remain in operation for decades, even up to a century; currently, more than half of the nation’s pipelines are at least 50 years old [38].
o Corrosion has caused 15 to 20 percent of all reported “significant incidents.” [38]
20

Figure 5. Gas Transmission and Hazardous Liquids Pipelines in the US, 2012
Source: US Department of Transportation, Pipeline and Hazardous Materials Safety Administration, “Gathering Pipelines: Frequently Asked Questions.”
Current Policy • Under current regulations of the Pipeline and Hazardous Materials Safety Administration
(PHMSA), only 7 percent of natural gas lines and 44 percent of hazardous liquid lines are subject to rigorous and frequent inspections, and of the roughly 240,000 miles of gathering pipelines in the US, PHMSA regulates only about 24,000 [38].
• Passed in January 2012, the Pipeline Safety, Regulatory Certainty and Job Creation Act (“Pipeline Safety Act”) has many components, including an increase in civil penalties for violations of US Department of Transportation (DOT) safety and compliance regulations. The act also mandated the following tasks:
o DOT must prepare a report on existing integrity management requirements and leak detection systems to determine whether expanded or enhanced requirements are necessary.
o The secretary of DOT must decide whether to require the use of automatic or remote-controlled shut-off valves, as well as the use of excess flow valves.
o The secretary must evaluate whether integrity management system requirements, which currently apply only to high-density population areas (and other high-consequence areas) should be expanded to other areas.
21
o The secretary must report on pipeline leak detection systems and whether new standards and technology should be employed.
Commentary • As pipelines age, it becomes increasingly more important to monitor and upgrade them as
necessary to prevent leaks and ruptures. • A Congressional Research Service report found that PHMSA lacks sufficient inspectors to
adequately monitor the millions of pipelines it is charged with overseeing. The report also said that replacing manual shut-off valves with automatic ones would cost the industry hundreds of millions of dollars [39].
Pipeline Siting Requirements
Context • Laying new pipelines requires some temporary and some permanent land disturbance that
may disrupt habitats and, if close to dwellings or taken by eminent domain, humans. • Once a route has been decided on, the company must receive permission to cross each part
of land that the route encounters. This can be done by purchasing an easement from the landowner in a voluntary contract, or by the power of eminent domain.
• Under federal law, interstate natural gas pipelines have the right to use eminent domain once a permit has been issued by the Federal Energy Regulatory Commission (FERC); other pipelines must rely on state law for eminent domain, and state regulations vary widely.
Current Policy • FERC is responsible for permitting pipeline siting. Before granting a permit, FERC conducts
a thorough environmental review, which often necessitates an environmental impact statement (and sometimes changes in routes and other operational details).
• Depending on the proposed pipeline route, various other federal regulations come into play, including the Clean Water Act, National Pollutant Discharge Elimination System permitting, dredge and fill permits from the Army Corps of Engineers, the Coastal Zone Management Act, the Endangered Species Act, and the Historic Preservation Act.
• There is no federal permitting process for interstate hazardous liquids pipelines (approval falls to the individual states involved), and the federal government has no role in permitting an intrastate pipeline of any kind. International pipelines do necessitate a federal permit, called a Presidential Permit.
• State rules for new pipelines vary significantly: some identify areas to exclude or avoid, some develop alternative routes, and some have no regulations at all.
• If a state has no agency in charge of pipeline permitting, then permitting falls to the land-use authority of the local governments along the proposed route.
22

Commentary • The Pipeline Safety Trust found that FERC rarely rejected pipeline siting permits and
therefore questioned its due diligence on the safety of these sitings [40]. • The Interstate Natural Gas Association of America (INGAA) suggests that operators engage
in presiting communications modeling with local communities and in pipeline leadership to cultivate relationships with local regulators.
• To obtain a Presidential Permit for an international pipeline, the State Department must show that the pipeline serves the “national interest,” but the term is not defined by federal law, leaving much room for dissent in the determination process (which includes a full environmental impact statement). A clear definition of the term may help simplify the permitting process in cases like Keystone XL.
• During the Keystone XL controversy, many new rules were proposed to switch the permitting authority to other agencies (e.g., FERC), to limit the allowed application approval time, and eliminate Presidential Permit requirements. None of these bills passed, but they indicate how Congress could circumvent or alter current regulations to allow pipeline sitings [41].
Pipeline Excavation Damage Prevention
Context • According to DOT, one of the greatest challenges to safe pipeline operation is avoiding
accidental damage caused by digging into a buried pipeline [42]. o Damage is caused by many routine operations, including road and highway
maintenance, general construction, farming activities, new home construction, and homeowner activities [42].
• In one year alone (2002–2003), 15 percent of incidents for hazardous liquids pipelines and 18 percent of incidents for natural gas transmission pipelines were due to excavation damage (see Figure 6.) [42].
o Excavation damage can cause catastrophic pipeline failure with environmental and human health repercussions, as well as loss of oil or gas.
23

Figure 6. Serious Incident Cause Breakdown, National, All Pipeline Systems, 1994–2013
Source: PHMSA Significant Incident Files, May 7, 2014
Current Policy and Best Practice • Every state has a “One-Call” center for businesses and individuals to call and report
excavations so that pipeline operators have a chance to mark their pipelines before construction begins. It is illegal to dig without calling a One-Call center first.
• PHMSA proposed a rule to oversee state excavation damage prevention laws and establish federal backstop requirements. Specifically, it will accomplish the following:
o Establish an administrative process for making adequacy determinations o Establish the federal requirements that PHMSA will enforce in states with
inadequate law enforcement programs to prevent excavation damage o Establish the adjudication process for administrative enforcement proceedings
against excavators where federal authority is exercised • INGAA’s Trenching and Excavation Safety Document CS-S-12 includes numerous
suggestions for improving excavation safety, such as the following [43]: o Develop a work plan and ensure that proper equipment is being used o Install high-visibility markings of underground structures and crossroads o Use protective systems like shoring, sloping or benching, trench boxes, or the
equivalent
Commentary • PHMSA recommends that industry educate the community and excavators about pipeline
awareness, and it encourages the general public to be aware of nearby pipelines and report any concerns to the local One-Call center [42].
• The Congressional Research Service says that some policymakers have proposed establishing federal civil penalties for violations of state One-Call rules; other stakeholders have argued that such enforcement is best performed by state regulators unless federal regulators determine that state rules are insufficient [44].
24

Track Safety Standards (improving rail integrity)
Context • Railroads are now transporting 11 percent of crude oil, up from 1 percent just five years ago
[45]. • Rail operators are responsible for moving the crude and maintaining tracks and other
infrastructure, but they do not own the crude oil itself or the tank cars in which it is carried. o Whoever owns the crude oil typically owns or leases the tank cars used to carry it.
• Since July 2013, there have been six major accidents across North America involving trains moving crude oil, one of which resulted in 47 deaths [45]. See Figure 7 for more information on incidents in the US.
Figure 7. Number of incidents versus number of railcars used for oil shipments
Source: Calculations from Charles Mason, Department of Economics, University of Wyoming, and Visiting
Fellow, Resources for the Future.
Current Policy • Within DOT, the Federal Railroad Administration (FRA) and PHMSA both regulate the rail
industry. o FRA oversees safety and compliance generally, while PHMSA oversees safety
specifically when hazardous materials are involved. • As of March 2014, a new FRA rule seeks to improve rail integrity by addressing defective
rails, rail inspections, inspection records, and qualified operators. o The final rule provides a four-hour window for verification of suspected rail defects.
25

o It requires track owners to have no more than 0.09 service failures per year per mile of track for Class 3, 4, and 5 tracks that carry hazardous materials.
o It also requires internal rail inspections on Class 3, 4, and 5 tracks that carry hazardous materials every 370 days or 30 million gross tons, whichever is less.
o Every rail flaw detection provider must have a training program in place; for a rail flaw detection test to be valid, it must be performed by a qualified operator who is subject to minimum training.
o Rail inspection records must include date, track identification and milepost, type of defect found, defect size (if not removed prior to traffic), and initial remedial action.
Commentary • The government could codify commitments and recommendations made by the American
Association of Railroads (AAR) such as analyzing routes for safety potential, restricting speed for crude oil trains, performing at least one more inspection than required, and installing wayside defective bearing detectors [46].
• The National Transportation Safety Board (NTSB) recommends that PHMSA expand hazardous materials route planning and, where possible, reroute to avoid transporting hazardous materials through populated or sensitive areas [47].
o NTSB further recommends that FRA revise its track safety standards to inspect each main track by foot or vehicle at least once every two weeks and to inspect each siding by vehicle or foot at least once a month [48].
Tank Car Requirements
Context • Rail operators do not own the tank cars in which oil is carried; whoever owns the crude oil
typically owns or leases the tank cars used to carry it. • Crude oil is generally transported in an unpressurized tank car, model DOT-111. • An NTSB study found that 54 percent of DOT-111s involved in accidents released fluids they
were carrying—a significantly higher rate than pressurized tank cars like DOT-105 and DOT-106 [45].
Current Policy • Within DOT, FRA and PHMSA both regulate the rail industry.
o FRA oversees safety and compliance generally, while PHMSA oversees safety specifically when hazardous materials are involved.
• In September 2013 PHMSA issued an advanced notice of proposed rulemaking that covers upgrades to DOT-111s.
• DOT issued an emergency order in February 2014, requiring railroads carrying more than 1,000,000 gallons of Bakken crude oil to notify state emergency response commissions of estimated volume, frequency of anticipated traffic, and route.
26

• FRA and PHMSA also issued a joint safety advisory recommending the use of tank cars with the highest level of integrity for transporting Bakken crude (and cautioning against the use of DOT-111 cars).
• NTSB suggests equipping DOT-111s with enhanced shell puncture and tank head systems and top fitting protection. It also recommends requiring bottom outlet valves designed to stay closed during accidents and requiring center sill or draft sill attachments, like those recommended by AAR in its 2011 tank car specifications [45].
• AAR has designed a new DOT-111, the CPC-1232, which is made of thicker and stronger materials. The association recommends such materials for every new tank car and asks that PHMSA make them mandatory [45].
Commentary • PHMSA notes three issues with the new rules [45]:
o Whether to require upgrades beyond the scope of AAR’s 2011 recommendations o Whether to retrofit tank cars that do not meet the new standards o What timeline to enforce for phaseouts and retrofits
Tank Car Staff
Context • Rail operators do not own the tank cars in which oil is carried; whoever owns the crude oil
typically owns or leases the tank cars used to carry it. • Since July 2013, there have been six major accidents across North America involving trains
moving crude oil, one of which resulted in 47 deaths [45]. • Accidents have occurred because operators have fallen asleep or been distracted (i.e., by
texting) while operating trains without a second-in-command [49].
Current Policy and Best Practice • Within DOT, FRA and PHMSA both regulate the rail industry.
o FRA oversees safety and compliance generally, while PHMSA oversees safety specifically when hazardous materials are involved.
• In April 2014, FRA proposed a rule that would require two-person crews on trains carrying crude.
• Current industry best practice is to have two-person crews for over-the-road operations; industry recommends that this be expanded to all rail operations [50].
Commentary • AAR president and CEO Edward Hamberger said that there has been no evidence shown
that two-person crews are safer; API, on the other hand, supports the regulation (supposedly because accidents look bad for the industry but the energy companies do not control the rail operations) [50].
27

• Canadian Pacific Railway already operates all its freight trains with two-person crews and is a major carrier of crude oil from the Bakken oil patch to the Port of Albany [49].
Crude Oil Classification
Context • Proper classification is critical because it ensures that materials are appropriately packaged
and that emergency responders know what protocols to follow in the event of an accident. • All crude oil is classified as hazard Class 3 and then into three packing groups: I, II, and III,
with III being the least dangerous [45]. • Recent evidence has shown that “unsafe practices related to the classification and packaging
of petroleum crude oil, are causing or otherwise constitute an imminent hazard to the safe transportation of … Petroleum crude oil” (Docket No. DOT-OST-2014-0025) [51].
o FRA audits revealed that shipments were being classified based solely on material safety data sheets and not on testing the crude itself [51].
Current Policy • Within DOT, FRA and PHMSA both regulate the rail industry.
o FRA oversees safety and compliance generally, while PHMSA oversees safety specifically when hazardous materials are involved.
• In February 2014, DOT issued an emergency order that would accomplish the following: o Require that crude oil be properly tested with sufficient frequency and quality and
classified accordingly o Require that crude oil be treated as Packing Group I or II hazardous material o Prohibit reclassifying crude oil to circumvent the rules
• API has voluntarily agreed to provide expertise and testing information to FRA regarding Bakken crude, including identifying best practices regarding testing and classification [45].
o In addition, API pledged to develop a standard for testing, classification, loading, and unloading of crude [45].
Commentary • There is a need to properly balance packaging requirements with the degree of hazard
posed by various materials. Misclassification of materials, whether intentional or not, can result in improper packaging and shipping.
• The Center for Strategic & International Studies suggests that new regulations could require further testing or processing before shipment and says that the industry is expected to release a study of crude oil characteristics at the end of May 2014 [45].
28

Maximum Achievable Control Technology (MACT I and II) Applied to Refineries
Context • Emissions come from refineries’ operational activities (filling, additive blending, tank
cleaning, and degassing); combustion of fuels to generate power, heat, and steam; flue gas; venting; flaring; and fugitive emissions.
• Refinery emissions that cause cancer, birth defects, and respiratory problems include the following:
o Criteria air pollutants (like sulfur dioxide, carbon monoxide, and particulate matter) o Volatile organic compounds (VOCs) o Hazardous air pollutants (HAPs) o Greenhouse gases (refineries are the second-largest industrial source) and
hydrogen sulfide
Current Policy • Section 112(d) of the Clean Air Act requires the US Environmental Protection Agency (EPA)
to set emission standards for HAPs emitted by major stationary sources based on the performance of the maximum achievable control technology (MACT) and to conduct two sets of reviews (followed by updates to the existing standards as necessary):
o Residual risk assessment, a one-time review to determine whether additional emission reductions are needed to protect human health or the environment
o Technology reviews, required every eight years to determine whether better emissions control approaches, practices, or processes are available
• EPA is proposing new MACT rules that it says will reduce emissions of BTEX gases (benzene, toluene, ethylbenzenes and xylenes) by 5,600 tons per year and VOCs by 52,000 tons per year, at a cost of about $40 million per year plus a $240 million capital cost. The rules include the following [52]:
o Adding MACT standards for delayed coking unit decoking operations o Revising the catalytic reforming units purge vent pressure exemption o Adding operational requirements for flares used as air pollution control devices in
Refinery MACT 1 and 2 o Adding requirements and clarifications for vent control bypasses in Refinery MACT
1
Commentary • API says companies need a minimum of three years to comply with the new law and
predicts that it will cost upwards of $100 million per year. It argues that the high costs do not justify the small emissions reduction potential [53].
29

New Source Performance Standards for Refinery Flares
Context • Refinery flares are combustion devices designed to prevent the release of gases to the
atmosphere, but incorrect operation can lead to toxic releases, wasted energy, and greenhouse gas emission releases.
o In addition, flares produce noise and light pollution.
Current Policy • Section 111(b) of the Clean Air Act requires EPA to periodically review and set emission
standards for new sources of criteria air pollutants, VOCs, and other pollutants. o EPA’s proposed updates to the New Source Performance Standards for refinery
flares will reduce HAPs by 3,800 tons per year and VOCs by 33,000 tons per year. • Current law prohibits visual emissions (except five minutes every two hours), requires a
pilot flame to be present, and sets a minimum heat value and a maximum exit velocity. • In a 2012 consent decree with BP, EPA required use of compressors to divert waste gas
from flares back into the plant for use as fuel. • In other consent decrees, EPA has also required use of “steaming” to improve flare
efficiency.
Commentary • Though small refineries are still being proposed to be built, the rate of new refinery building
has been slowing because of slack demand for refined products. Existing refinery operators will be under continuing pressure to reduce HAPS and criteria air pollutants, and refineries are up next for CO2 controls under Section 111(d) of the Clean Air Act.
Refinery Wastewater
Context • Wastewater arises from several sources:
o Tank bottom draining o Tanker vehicle cleaning o Vapor recovery processes o Contaminated stormwater runoff o Leaks and spills
• There is potential for contamination of water bodies from wastewater runoff in addition to potential dermal contact and inhalation from spills and leaks.
30

Current Policy and Best Practice • EPA currently defines the normal effluent discharge limit as 10 mg/L (average per month;
or 15 mg/L daily maximum) for oil and grease by concentration. • Best practices suggest [54] the following:
o Oily water should be passed through interceptors to separate some oils and fuels from water
o Steam and sour water strippers should be used to remove hydrocarbons and ammonia
o Stripped phenolic sour water should replace fresh water as wash water in desalters o Desalter pH should be monitored and stay around 6–7 o Adequate piping and valves should be used to fully drain tanks o Cooling tower blowdown should be routed separately, not through the sewer or
directly to the secondary oil/water separation equipment o The otal volume of condensate blowdown should be less than 10 percent of total
flow of wastewater from refinery
Commentary • A lack of research makes it difficult to comment on the efficacy of current refinery
wastewater operations. However, the current regulations have been in place since the 1970s with apparently very few updates since then, suggesting that it would be prudent to revisit those regulations to determine whether they are still adequate.
Proposed Carbon Pollution Standard for New Power Plants
Context • In 2012, the electric power sector accounted 38 percent of all US energy-related
CO2 emissions [55]. • Following a Supreme Court ruling in 2009, the US Environmental Protection Agency (EPA)
was obligated to promulgate standards restricting levels of CO2 emissions from new power plants, as well as other sources of CO2 emissions. EPA elected to address power plant emissions first [56].
Current Policy and Best Practice • Proposed carbon pollution standards for new and existing power plants fall under Section
111(b) of the Clean Air Act. As noted on the EPA website, “Section 111 (b) is the federal program to address new, modified and reconstructed sources by establishing standards” [57].
• Proposed performance standards for new facilities were released by EPA in April 2012, later withdrawn, and then rereleased on September 20, 2013.
• In the 2013 proposed rule, EPA set separate standards for natural gas-fired turbines and coal-fired units. This represents a key distinction from the original proposed rule.
31

• Large natural gas–fired plants would be required to use combined cycle technology and limit emissions to 1,000 pounds of CO2 per megawatt-hour (MWh). Smaller units (used less often) would be required to attain a slightly less stringent standard.
• New coal units would be required to fit carbon capture technology to lower their allowed emissions to 1,000–1,100 pounds of CO2 per MWh.
Commentary • EPA’s proposed new source rule is expected to be finalized in June 2014 and track the
proposed rule closely. • Carbon capture technology is just now being constructed at commercial scale, and operating
performance data are not available. • Captured carbon dioxide must be stored. Use of captured CO2 for enhanced oil recovery is
one storage option but is limited in magnitude. Regulations, transportation, and social acceptance of large-scale storage have not been developed.
• Given uncertainty about the performance characteristics of capture technology and the equally uncertain state of large-scale storage options, it is likely that the EPA regulations will effectively eliminate all future coal facilities, at least until capture and storage uncertainty is reduced, and accelerate the deployment of new combined cycle gas plants.
Proposed Carbon Pollution Standard for Existing Power Plants
Context • In 2012, the electric power sector accounted 38 percent of all US energy-related
CO2 emissions [55]. • Following a Supreme Court ruling in 2009 stating that EPA has the authority to regulate CO2
emissions under the Clean Air Act, EPA began to issue regulations to limit CO2 from the electric power sector [56].
• EPA first issued regulations for new coal and gas power plants (September 2013) and in June 2014 will issue regulations for existing coal and gas power plants.
Current Policy and Best Practice • EPA has been developing regulations for CO2 emissions under Section 111(d) of the Clean
Air Act since fall 2013. • A proposed rule was released June 2, 2014. The timeline given by the Obama administration
specifies release of final regulations by June 2015, and receipt of proposed state implementation plans by June 2016 [58].
• The proposed rule requires states to develop implementation plans that in the aggregate will lead to electricity sector reductions in CO2 emissions of 30 percent by 2030 (from a 2005 baseline). EPA provided each state with a performance standard (pounds of CO2 per MWh) tailored to the state’s generation mix and ability to reduce emissions. The proposed
32
regulations give the states significant flexibility in implementation and allow for regional cooperation and crediting of existing emissions reductions efforts, including the Northeast’s Regional Greenhouse Gas Initiative and California’s AB32.
Commentary • Compared with the CO2 regulations for new sources, the regulations for existing sources will
have a much greater impact on electric utilities, bulk electricity markets, retail electricity prices, the demand for gas, and CO2 emissions from the sector.
• If EPA issues separate performance standards for coal and gas plants (as it did in the rules for new plants), it will diminish the incentive for coal-to-gas switching and thereby lead to a diminished demand for gas vis-à-vis a rule that sets one performance standard for both coal and gas.
• EPA could give the states considerable flexibility and allow actions beyond the designated source categories (coal and gas) to count toward emission reductions. These “beyond-the-fence line” activities could include energy efficiency and renewables. To the extent these are allowed, they could diminish the demand for gas compared with the case of a single performance standard for coal and gas and no credit for beyond-the-fence-line activities.
Renewable Portfolio Standards (RPS)
Context • Twenty-nine states and the District of Columbia have renewable portfolio standards (RPS),
which are designed to encourage the deployment of low-carbon electricity generation technologies. See Figure 8.
• The stringency of the RPS in terms of the percentage of generation or percentage of generation capacity from low-carbon technologies varies considerably among the states.
• The generation technologies that are deemed “renewable” under an RPS also vary. For example, nuclear is rarely an eligible technology even though it is carbon free.
• Despite some attempts to develop a federal RPS, no such policies have been adopted.
Current Policy and Best Practice • States with RPS regulations have seen increases in the percentage of generation from
eligible technologies, but so too have states that do not have RPS regulations. • In many states, RPS requirements are beginning to bind on utilities and thereby forcing
them to add more renewable capacity than they would do given market conditions.
33

Figure 8. Renewable Portfolio Standard Policies
Source: Database of State Incentives for Renewables and Efficiency (DSIRE),
http://www.dsireusa.org/documents/summarymaps/RPS_map.pdf
Commentary • If the motivation behind RPS was reduction in CO2 emissions, state-level cap-and-trade
programs or carbon taxes would be more economically efficient and would also incentivize energy efficiency.
• As RPS regulations begin to bind in many states, they will force utilities to add eligible technologies. In many cases, given market conditions, utilities would rather add gas. Thus binding RPS regulations could mean more gas demand.
• Given binding RPS regulations, eligible technologies could be intermittent and require rapid-cycling gas backup, adding to gas demand.
• The interaction between binding RPS regulations and new regulations developed by EPA for existing coal and gas plants under Section 111(d) of the Clean Air Act is at present unknown.
34

Regional Greenhouse Gas Initiative and California Global Warming Solutions Act
Context • As the world’s largest historical emitter of greenhouse gases (recently overtaken by China)
the United States is under significant pressure from the global community to take the lead on emissions reduction, particularly after having refused to ratify the Kyoto Protocol after signing on in 1998.
• Climate legislation has repeatedly stalled at the federal level; the American Clean Energy and Security Act (Waxman-Markey bill) of 2009 was probably the closest the United States has come to passing federal climate change legislation.
Current Policy • The Regional Greenhouse Gas Initiative (RGGI) began in 2008 as a partnership among
Connecticut, Delaware, Maine, Maryland, Massachusetts, New Hampshire, New Jersey, New York, Rhode Island, and Vermont (New Jersey subsequently withdrew). It is the first market-based program to reduce greenhouse gas emissions in the United States.
o The new 2014 cap is 91 million short tons of carbon dioxide (from the power sector) with a scheduled decrease of 2.5 percent each year from 2015 through 2020.
o Each state has its own budget trading program regulations based on the model rule. • The California Global Warming Solutions Act (AB 32) was signed into law in 2006 and
required the California Air Resources Board (CARB) to develop actions to meet the 2020 emissions reduction goal of 427 million metric tons of (carbon dioxide equivalent) greenhouse gases.
o In 2011 CARB, adopted a cap-and-trade program covering the largest emitters in the state, including power plants, refineries, industrial facilities, and transportation fuels. The cap was set in 2013 at 2 percent below 2012 emissions, with plans to decrease the cap by 2 percent in 2014 and 3 percent each year from 2015 through 2020.
o Beginning January 2014, CARB officially linked its cap-and-trade program with the government of Quebec’s cap-and-trade system, such that auctions are held jointly and operators can purchase allowances from either system [59].
Commentary • California’s system, seen by many as an example of how to “do it right,” is earning the
highest carbon price of any cap-and-trade market—$11 per ton—with most of that money being funneled into clean energy projects.
• Learning from the European system, California spent years collecting emissions data before beginning and set a de facto price floor and ceiling to avoid the price volatility experienced in Europe. California has also allowed offset projects as a means of creating credits and has imposed a strict and thus far successful monitoring and enforcement program [60].
35

• The recent linking with Quebec’s cap-and-trade system may set the stage for other such linkages in the future; according to the New York Times, California and Europe have both begun discussions of linking their systems with China [60].
• RGGI’s performance initially invited skepticism as prices hovered around $2 per ton for several years, but recent data show that the system has effectively reduced emissions and generated more than $1.7 billion for clean energy projects in the nine states. In addition, the recent 45 percent cut to the emissions cap has doubled carbon prices to $4 per ton and is expected to catalyze greater investment in renewable technologies [60].
• June 2014, President Obama is expected to unveil a plan that would require states to reduce their power plant emissions. Analysts expect that plan to encourage states to adopt cap-and-trade systems like California’s [60].
Corporate Average Fuel Economy Standards for Light-Duty Vehicles
Context • The United States is home to one-third of the world’s automobiles, and 71 percent of all
petroleum products (28 percent of total energy) used in the US goes to the transportation sector [61].
• A number of policies and planning decisions affect overall demand for fuel in the transportation sector, but the centerpiece of US efforts to reduce oil use and greenhouse gas (GHG) emissions from the sector are the corporate average fuel economy (CAFE)/GHG emissions rate standards, commonly referred to simply as CAFE standards.
Current Policy and Best Practice • CAFE standards for light-duty vehicles were first enacted by Congress in 1975 and have
stayed constant for more than two decades. • In 2012, the two lead agencies, EPA and the Department of Transportation’s National
Highway Safety Administration (NHTSA), set much stricter CAFE standards each year to 2025. (See Figure 9.) Both agencies have committed to conduct a midterm evaluation of the later years of the standards. Specifically, the agencies will complete a technical assessment report of the appropriateness of the 2022–2025 standards by November 15, 2017, and make final decisions based on the evaluation by April 1, 2018.
36

Figure 9. Light-Duty Vehicle Fuel Economy Standards, 1978–2025
Source: Driving Efficiency: Cutting Costs for Families at the Pump and Slashing Dependence
on Oil, http://www.whitehouse.gov/sites/default/files/fuel_economy_report.pdf.
Commentary Changes in the US population and culture and previous fuel economy regulations are leading to a predicted slowing of passenger vehicle driving increases and reductions in net oil demand, even as trucking ton-miles are on the upswing. Thus, the rationale for improving fuel economy has shifted away from energy security and toward CO2 emissions reductions.
Many observers expect a battle over this major federal regulatory effort, with the vehicle manufacturing sector saying the standards will be too expensive and the agencies (EPA and NHTSA) defending them on grounds of air quality, CO2, and energy security benefits, as well as fuel cost savings. RFF researchers have noted numerous questions [62] to be answered about consumer and manufacturer responses to the regulations and how the costs and benefits should be estimated before these issues can be decided.
37

Phase II Fuel Efficiency/GHG Emissions Standards for Heavy-Duty Trucks
Context • The first ever (Phase I) CAFE/GHG emissions standards for heavy-duty trucks were
finalized in 2011 for implementation through 2016, when Phase II regulations are to be approved. The trucking industry worked closely with EPA and NHTSA to define what was reasonable during Phase I.
• Work at EPA and RFF shows that these standards will not be very costly, although the benefits depend heavily on how estimated fuel savings are calculated, just as for light-duty vehicles [63].
• With diesel currently making up 98 percent of truck fuel, meeting these standards will reduce oil use by 530 million barrels and CO2 emissions by 270 million metric tons [63].
• With natural gas so cheap, it is making inroads into the trucking sector. Its penetration will depend on several facets of government policy, including how this fuel is treated in the Phase I and II regulations.
Current Policy and Best Practice • The Phase I regulations will have relatively minor effects on the trucking sector and demand
for oil and natural gas. • The Phase I regulations credited natural gas with CO2 emissions reductions but based this
on volume, not on energy content, which would have given natural gas more credit. The natural gas industry wants this provision changed.
• Truck manufacturers have been innovating and selling trucks fueled by liquefied natural gas (LNG), in some cases without government subsidies; for trash trucks in particular, LNG has captured the new-truck market.
• Some natural gas operating companies and LNG providers, along with Clean Fuels, Inc., have partnered to help solve the “chicken and egg” problem by building LNG refueling stations on the interstate network and LNG corridors in various parts of the country in advance of truck sales to support this investment.
Commentary • The Phase II truck standards, coming in 2016, are expected to be much more costly than
those in Phase I because the “easy” fuel economy improvements have already been accomplished.
• Flexibility in the application of these standards, such as implementation of a trading program, would help keep costs in check.
• For making confident decisions about how tight the standards should be, policymakers need research on why this industry has been so reluctant to purchase more fuel-efficient trucks, given engineering estimates of their fuel savings and rapid payback periods.
38
Renewable Fuel Standard
Context • Before the shale gas and tight oil revolutions, energy security concerns loomed large in the
United States. Against this backdrop, in 2005 the federal government enacted a renewable fuel standard that mandates that specific quantities of renewable fuels (on a percentage basis) be blended into gasoline—and later, diesel—by certain years. The types of fuels covered by the renewable fuel standard (RFS) include cellulosic biofuels, biomass-based diesel, and advanced biofuels. EPA qualified something as a renewable fuel if its life-cycle greenhouse gas emissions reductions were at least 20 percent lower than the baseline petroleum fuel it would replace. The agency continues to update its life-cycle analyses.
Current Policy • The original RFS program (RFS1) was created under the Energy Policy Act of 2005 and later
expanded under the Energy Independence and Security Act (EISA) of 2007. This second iteration (RFS2) was finalized by EPA in 2010.
• Among other changes, RFS2 covered diesel as well as gasoline. It also revised upward the quantities of renewable fuels required, starting at 9 billion gallons in 2008 and growing to 36 billion gallons by 2022.
• Each year, EPA must evaluate whether the mandated amounts included in EISA are, in fact, achievable. In particular, “If the projected available volume of cellulosic biofuel is less than the required volume specified in the statute, EPA must lower the required volume used to set the annual cellulosic biofuel percentage standard to the projected available volume. EPA must also determine whether the advanced biofuel and/or total renewable fuel volumes should be reduced by the same or a lesser amount” [64].
o This guidance for any given year must be released by EPA by November 30 of the preceding year.
Commentary • The biofuels program has proven to be a disappointment and serves as a warning that
mandating market changes doesn’t necessarily make it so. Cellulosic biofuels production has consistently been insufficient to meet the program’s goals for renewable fuels. Most recently, EPA again reset the yearly target to equal production to avoid levying fines on refineries for fuel that was not actually available for blending with gasoline and diesel.
• One related event was elimination of the ethanol subsidy where it is used to blend with gasoline in the summer. Most economists found this subsidy to be unjustified on economic efficiency grounds. Some observers pointed to the rise in corn and related food prices, as well as Midwest agricultural land prices, as unfortunate consequences of this policy.
39

• Finally, a Congressional Research Service report notes that “considerable uncertainty remains regarding the development of the infrastructure capacity (e.g., trucks, pipelines, pumps, etc.) needed to deliver the expanding biofuels mandate to consumers” [65].
LNG Export Terminal Siting
Context • As of April 2014, the US Department of Energy had received 43 requests for permits to
export liquefied natural gas (LNG) in the lower 48 states. [66] • If these permits are granted, companies must request separate permits to construct and/or
operate LNG export terminals, requiring an extensive environmental impact statement (EIS).
• LNG export terminal siting permits for onshore facilities are issued by the Federal Energy Regulatory Commission (FERC). FERC’s authority to issue such permits is captured in Section 3 of the Natural Gas Act, although that was only codified as part of revisions under the Energy Policy Act of 2005.
• An important issue is whether the proposed site is a brownfield (basically a repurposing of an existing LNG import terminal, such as that for Cove Point, Maryland) or a greenfield.
Current Policy and Best Practice 13 requests for siting permits have currently been proposed to FERC (see Figure 10 below). Only Sabine Pass, on the Gulf coast, has been fully approved, with construction well underway.
• Criticisms of the current permitting process include the length of time needed to secure a permit, as well as the cost of completing regulatory requirements. A memorandum from the Congressional Research Service, for example, notes that the FERC approval for the Sabine Pass LNG export terminal took 441 days from application filing [67].
• The memorandum also estimates that “once a company enters the filing phase, there will be more significant costs associated with the required documentation, estimated to be approximately $100 million for engineering reports, environmental analysis, market studies, and other application requirements.”
40

Figure 10. North American LNG Export Termimals, Proposed
Source: Federal Energy Regulatory Commission, http://www.ferc.gov/industries/gas/indus-act/lng.asp
Commentary • There may be a relatively short time frame in which the US gas industry can profitably sell
LNG to Asian and other markets. Thus, delays in approval are more relevant. • The EIS process for these approvals has become wrapped in the environmental movement
to “keep fossil fuels in the ground.” In at least one sense, this is unfortunate because in many cases, the carbon footprint of exported gas that substitutes for coal is probably smaller.
• One such case is Cove Point in Maryland, which is selling LNG to India. This suggests that net CO2 benefits world-wide should be a component of the EIS.
• The above-noted distinction between greenfield and brownfield plants (the latter being repurposed from import terminals for LNG) should matter for the EIS as well, with a streamlined process for brownfields.
41

Sources
1. United States Government Accountability Office. 2013. Oil and Gas Development: BLM Needs Better Data to Track Permit Processing Times and Prioritize Inspections. Rep. no. GAO-13-572.
2. United States Government Accountability Office. 2011. Oil and Gas Bonds: BLM Needs a Comprehensive Strategy to Better Manage Potential Oil and Gas Well Liability. Rep. no. GAO-11-292.
3. Dutzik, Tony, Benjamin Davis, Tom Van Heeke, and John Rumpler. 2013. Who Pays the Costs of Fracking?: Weak Bonding Rules for Oil and Gas Drilling Leave the Public at Risk. Philadelphia, PA: PennEnvironment Research & Policy Center.
4. Sider, Alison, and Kristin Jones. 2013. "In Fracking, Sand Is the New Gold." The Wall Street Journal. December 2.
5. Minnesota State Legislature. 2013. Minnesota House of Representatives. HF 976. By Jean Wagenius, Joe Atkins, Rick Hansen, Jeanne Poppe, and David Tomassoni.
6. State of Wisconsin, Department of Health Services, Division of Public Health. 2012. “Respirable Crystalline Silica from Sand Mining.” October.
7. Hughes, Emma. 2013. “Proppants Market Could Be worth $10bn by 2017.” Industrial Minerals. 8. Galbraith, Kate. 2013. “Ambiguities Persist in Regulating Water Withdrawals for Fracking.”
Texas Tribune. March 13. 9. Lustgarten, Abrahm. 2009. "Frack Fluid Spill in Dimock Contaminates Stream, Killing Fish."
ProPublica. 10. Knapton, Sarah. 2013. “Fracking Chemicals 'could Cause Infertility, Cancer and Birth
Defects'” The Telegraph. December 17. 11. Jackson, R. B., A. Vengosh, T. H. Darrah, N. R. Warner, A. Down, R. J. Poreda, S. G. Osborn, K. Zhao,
and J. D. Karr. 2013. “Increased Stray Gas Abundance in a Subset of Drinking Water Wells near Marcellus Shale Gas Extraction.” Proceedings of the National Academy of Sciences 110.28 (2013): 11250-1255.
12. Osborn, S. G., A. Vengosh, N. R. Warner, and R. B. Jackson. 2011. “Methane Contamination of Drinking Water Accompanying Gas-well Drilling and Hydraulic Fracturing.” Proceedings of the National Academy of Sciences108.20 (2011): 8172-176.
13. Myers, Tom. 2012. “Potential Contaminant Pathways from Hydraulically Fractured Shale to Aquifers.” Ground Water 50.6 (2012): 872-82.
14. Brufatto, Claudio, et al. 2003. “From Mud to Cement- Building Gas Wells.” Oilfield Review (2003): 62-76.
15. Watson, Theresa, and Stefan Bachu. 2009. “Evaluation of the Potential for Gas and CO2 Leakage Along Wellbores.” Society of Petroleum Engineers (2009): 115-26.
16. American Petroleum Institute. 2010. “Water Management Associated with Hydraulic Fracturing.” API Guidance Document HF2.
17. RFF interviews with oil and gas operators. May 2014. 18. Yoxtheimer, Dave. n.d. “Shale Gas Flowback Water Treatment, Reuse and Disposal.”
Presentation slides, Penn State, Marcellus Center for Outreach and Research.
42

19. Hammer, Rebecca, and Jeanne VanBriesen. 2012. In Fracking’s Wake: New Rules Are Needed to Protect Our Health and Environment from Contaminated Wastewater. Rep. no. D:12-05-a. New York: Natural Resources Defense Council.
20. Henry, Terrence, and Kate Galbraith. 2013. “As Fracking Proliferates, So Do Wastewater Wells.” The New York Times. March 28.
21. United States Environmental Protection Agency. n.d. “Class II Wells - Oil and Gas Related Injection Wells (Class II).” Available at http://water.epa.gov/type/groundwater/uic/class2/.
22. Choi, Charles Q. 2013. “Confirmed: Fracking Practices to Blame for Ohio Earthquakes.” NBC News. September 4.
23. United States Geological Survey. 2014. “Record Number of Oklahoma Tremors Raises Possibility of Damaging Earthquakes.” May 5.
24. Zoback, Mark. 2012. “Managing the Seismic Risk Posed by Wastewater Disposal."Earth Magazine. April 17.
25. Rubinstein, JL, WL Ellsworth, A McGarr. 2013. The 2001 - present triggered seismicity sequence in the Raton basin of southern Colorado/Northern New Mexico. Seismol. Res. Lett. 84, 374 (2013).
26. Environmental Defense Fund. 2014. Economic Analysis of Methane Emission Reduction Opportunities in the U.S. Onshore and Natural Gas Industries.
27. Dittrick, Paula. 2012. “EPA Outlines New Source Performance Standards.” Oil and Gas Journal 110.4c (2012): 24-25.
28. Green, Mark. 2012. "EPA Should Improve Emissions Rule Before Finalizing." Energy Tomorrow. April 12.
29. Environmental Defense Fund. 2014. "In Colorado, a Breakthrough for Cleaner Air and Safer Climate." Available at http://www.edf.org/media/colorado-breakthrough-cleaner-air-and-safer-climate.
30. Begos, Kevin, and Jonathan Fahey. 2014. "Fracking Boom Exacts Little-known Price: Higher Fatalities on Some US Roads." Associated Press. May 5.
31. Krupnick, Alan, and Lucija Muehlenbachs. 2014. "Shale Gas Development Linked to Traffic Accidents in Pennsylvania." Resources 7 Mar. 2014: 6-8. Washington, DC: Resources for the Future.
32. The Associated Press. 2014. "Hidden Costs of Fracking: Spike in Traffic Deaths Where Trucks, Drilling Equipment Choke Streets." PennLive.com. May 6.
33. Pennsylvania Public Utility Commission. n.d. "Impact Fees." Available at. https://www.act13-reporting.puc.pa.gov/Modules/PublicReporting/Overview.aspx.
34. Hargreaves, Steve. 2011. "Oil's Future is in Deepwater Drilling." CNN Money. January 11. 35. Johnson, Toni. 2011. "U.S. Deepwater Drilling's Future." Washington, DC: Council on Foreign
Relations. 36. Boesch, Donald. 2014. Testimony on The Science Behind Discovery: Seismic Exploration and the
Future of the Atlantic OCS. House Committee of Natural Resources. January 10. 37. Dunnahoe, Tayvis. 2013. "Colorado Communities Collaborate with Operators." Oil & Gas Journal. 38. Groeger, Lena. 2012. “Pipelines Explained: How Safe Are America’s 2.5 Million Miles of
Pipelines?” ProPublica. 39. Parfomak, Paul W. 2012. Keeping America's Pipelines Safe and Secure: Key Issues for Congress.
Washington, D.C.: Congressional Research Service.
43

40. Pipeline Safety Trust. n.d. Pipeline Routing and Siting Issues. Issue Brief no. 9. Available at http://pstrust.org/docs/PST_Briefing_Paper_09_1.pdf.
41. Parfomak, P. W., Pirog, R., Luther, L., & Vann, A. 2013. Proposed Keystone XL pipeline project: Key issues. Washington, DC: Congressional Research Service.
42. US Department of Transportation. 2011. Fact Sheet: Excavation Damage. Available at http://primis.phmsa.dot.gov/comm/FactSheets/FSExcavationDamage.htm.
43. The INGAA Foundation, Inc. 2012. Trenching and Excavation Safety, Construction Safety and Consensus Guidelines, Rep. no. CS-S-12.
44. Parfomak, Paul W. 2010. Pipeline Safety and Security: Federal Programs. Washington, DC: Congressional Research Service.
45. Pumphrey, David, Lisa Hyland, and Michelle Melton. 2014. "Safety of Crude Oil by Rail." Washington, DC: Center for Strategic & International Studies.
46. United States Department of Transportation. 2014. “Letter to the Association of American Railroads.” Available at http://www.dot.gov/briefing-room/letter-association-american-railroads.
47. National Transportation Safety Board. 2013. Safety Recommendation R-14-01. 48. National Transportation Safety Board. 2014. Safety Recommendation R-14-11. 49. Anderson, Eric. 2014. "FRA Wants Trains to Have at Least Two-person Crews." Times Union.
April. 50. Reilly, Sean, and Elana Schor. 2014. "DOT to Propose Rule Requiring Expanded Staffing for
Trains Carrying Crude." Greenwire. April 9. 51. United States Department of Transportation. 2014. Amended and Restated Emergency
Restriction/Prohibition Order. DOT-OST-2014-0025. 52. United States Environmental Protection Agency. 2014. Fact Sheet: Proposed Petroleum Refinery
Sector Risk and Technology Review and New Source Performance Standards. Available at http://www.epa.gov/ttn/atw/petrefine/20140515factsheet.pdf.
53. InsideEPA.com. 2014. "Industry Urges Administration Against Tightening EPA Refinery Air Rules."InsideEPA.com. April.
54. European Bank for Reconstruction and Development. 2011. "Sub-Sectoral Environmental and Social Guidelines: Petroleum Refineries."
55. United States Environmental Protection Agency. n.d. "Overview of Greenhouse Gases." Available at http://www.epa.gov/climatechange/ghgemissions/gases.html.
56. United States Environmental Protection Agency. 2009. Endangerment and Cause or Contribute Findings for Greenhouse Gases Under Section 202(a) of the Clean Air Act. EPA–HQ–OAR–2009–0171.
57. United States Environmental Protection Agency. n.d. "What EPA Is Doing." Available at http://www2.epa.gov/carbon-pollution-standards/what-epa-doing#overview.
58. Obama, Barack. 2013. 2013. "Presidential Memorandum -- Power Sector Carbon Pollution Standards." The White House. June.
59. Center for Climate and Energy Solutions. n.d. "California Signs Linkage Agreement with Quebec, Releases Updated AB 32 Scoping Plan Draft." Available at http://www.c2es.org/regional-initiatives/news/2013/california-signs-linkage-agreement-quebec-releases-updated-ab-32-scop.
44

60. Gillis, Justin. 2014. "A Price Tag on Carbon as a Climate Rescue Plan." The New York Times. May 30.
61. The National Academies. n.d. “How We Use Energy — Transportation.” Available at. http://needtoknow.nas.edu/energy/energy-use/.
62. Krupnick, Alan, Joshua Linn, Virginia D. McConnell. 2014. Preparing for the Midterm Review of the Fuel Economy and Greenhouse Gas Emissions Rate Standards for Light-Duty Vehicles: A Summary of Priority Research Questions. Issue Brief no. 14-04. Washington, DC: Resources for the Future.
63. Krupnick, Alan, and Winston Harrington. 2012. Improving Fuel Economy in Heavy-Duty Vehicles. Issue Brief no. 12-01. Washington, DC: Resources for the Future.
64. United States Environmental Protection Agency. 2010. EPA Proposes 2011 Renewable Fuel Standards. Washington, DC: US EPA.
65. Schnepf, Randy and Brent D. Yacobucci. 2013. Renewable Fuel Standard (RFS): Overview and Issues. Washington, DC: Congressional Research Service.
66. United States Department of Energy. 2014. Summary of LNG Export Applications. Available at http://energy.gov/fe/downloads/summary-lng-export-applications.
67. Ratner, Michael, Paul Parfomak and Adam Vann. 2013. Memorandum on LNG Exports Permitting Process. Washington, DC: Congressional Research Service.
45

ATTAINING SUSTAINABLE DEVELOPMENT OF OIL AND GAS IN NORTH AMERICA: CANADA POLICY BRIEFS
Philip Gass, Douglas Russell, and Maxine Cunningham1
8 June 2014
This document supports an RFF Summary Report entitled Attaining Sustainable Development of Oil and Gas in North America: A Review of the Environmental Regulatory
Landscape.
Introduction The following set of policy descriptions was put together by researchers at the International
Institute for Sustainable Development as part of an international review of environmental policies governing oil and gas development in Canada, Mexico, and the United States. The policy briefs presented here cover Canada, with the United States and Mexico covered in companion documents. The broader set is reflected in a summary report covering all three countries.
This document includes brief descriptions of policies governing the oil and gas production process, from extraction (well-site permitting onward) to end use in the transportation and electricity sectors. Each description provides context, the current state of regulation and best practice, and commentary options for reform and, in some cases, harmonization.
Monetary values are expressed in Canadian dollars.
1 Philip Gass is a Project Manager at the International Institute for Sustainable Development (IISD), Douglas Russell is an Associate at IISD, and Maxine Cunningham is a Project Officer at IISD. Questions or comments can be addressed to Mr. Gass at [email protected].
2

Table of Contents
Environmental Assessments ............................................................................................................. 1
Water Testing—Fracking ................................................................................................................... 2
Water—Policy and Government Regulation for Oil and Gas Development ..................... 3
Disclosure—Fracking Fluid ............................................................................................................... 4
Rail Car Standards—Hazardous Materials ................................................................................... 5
Reporting—GHG Gases ........................................................................................................................ 6
Performance – GHG Emissions Limitation for Oil and Gas and Electricity Production and Manufacturing ...................................................................................................................... 7
Development—Unconventional Shale Gas ................................................................................... 9
Offshore Oil and Gas Exploration and Drilling.......................................................................... 10
Wastewater ........................................................................................................................................... 12
Pipeline Safety ...................................................................................................................................... 14
Pollution Prevention .......................................................................................................................... 15
Renewable Energy Initiatives ......................................................................................................... 16
Refining Operations ........................................................................................................................... 18
Performance – GHG Emissions Limitations in the Transport Sector ................................ 20
Import and Export of Natural Gas and Oil—Low Carbon Fuel Standards ....................... 21
Sources .................................................................................................................................................... 23
JUNE 2014
3

Environmental Assessments
Context In 1992, the Government of Canada enacted the Canadian Environmental Assessment Act
(CEAA), which was intended to achieve sustainable development by identifying, evaluating, and mitigating adverse environmental effects that may be caused by projects under federal jurisdiction. Over the years, CEAA was publicly reviewed and periodically amended by Parliament to ensure that the federal environmental assessment process was effective, efficient, and equitable. The Government of Canada repealed this legislation in 2012 and replaced it with the new CEAA 2012, which came into force on July 6, 2012. The amendments were intended to update and modernize the regulatory system in terms of predictability, timeliness, and coordination. On October 24, 2013, the federal Minister of Environment also finalized the amendments to the Regulations Designating Physical Activities. These regulations set out the physical activities that are considered “designated projects” under CEAA 2012.
Current Policy • CEAA 2012 now takes a “project list” approach: an environmental assessment is required
only for particular projects included in the list of “designated projects.” However, for most of those projects an assessment is not automatic and will be undertaken only where the federal government exercises its discretion to conduct an assessment. This is in contrast to the former Canadian Environmental Assessment Act, which used a “trigger” approach: an assessment was automatically required where a federal authority intended to participate in the project.
• Key issues identified by third parties in CEAA 2012 include the following: o fewer assessments may be conducted; o fewer factors are required to be considered; o timelines are shorter; o environmental effect is defined more narrowly; o stakeholders intervention is more limited in environmental assessment hearings; o heavy oil and oil sands processing facilities as well as pipelines, other than offshore
pipelines, have been removed from the designated projects list. • In addition, responsibility for environmental assessments (EAs) has been consolidated to
three agencies (Canadian Environmental Assessment Agency, Canadian Nuclear Safety Commission, National Energy Board) instead of 40; there is now a single environmental report.
Commentary Government’s approach to achieving more predictable and timely project reviews and reducing
duplication can be achieved, but there is concern that the new approach may lead to less rigour in assessing the environmental impact of projects.
1

Water Testing: Fracking
Context • Fracking has raised a host of environmental concerns, most notably around potential water
contamination. Many rural residents fear fracking fluid could leach into their drinking water. Up to 90 tonnes of water are required for some gas wells in northeastern British Columbia.
Current Policy and Best Practices
Provincial • New Brunswick. Commitment to baseline water testing: water will be tested before fracking
begins to provide a before-and-after comparison. Commitment to groundwater: if groundwater comes to the surface, drilling must be discontinued, the hole plugged, and government notified. Conditions apply to oil and gas on both private and provincially owned land from exploration through to abandonment.
• Alberta. The Alberta Energy Regulator (AER) protects freshwater aquifers (groundwater) with strict regulations that are designed to ensure that gas cannot migrate up a well bore to contaminate groundwater sources. Alberta Environment and Water is currently undertaking a comprehensive review with the Energy Resources Conservation Board (ERCB) on regulations, new technology, and water usage in regard to hydraulic fracking. A large component of this review will focus on assessing what additional data collection and reporting may be required, including baseline testing and information on fracture fluids.
Industry • Companies are working aggressively to reduce water use. Where practical, strategies
include use of brackish or salt water for some or all of the supply necessary for fracking operations, recycling of portion of frack fluid that is produced after the fracking operation, and fluid alternatives.
• In September 2013, the Canadian Association of Petroleum Producers (CAPP) introduced guiding principles for hydraulic fracturing and followed up in January 2014 with new operating practices. These practices obligate CAPP members to ensure sound wellbore construction, seek alternatives to fresh water, recycle where feasible, report water use voluntarily, disclose fracturing fluid, and pursue technical advancement and collaboration.
2

Water: Policy and Regulation for Oil and Gas Development
Context • There are increasing public concerns about the use of fresh water for oil field injection.
These concerns apply to both surface water and groundwater and indicate the need for the government to take steps to reduce the oil and gas industry’s use of fresh water. Projections indicate that water use for oil recovery could increase significantly in the future as demand for thermal oil sands recovery grows.
Current Policy and Best Practices
Provincial • Provinces regulate water and drilling permits, and development therefore varies across the
country. • Alberta Environment and Water (AEW) allocates water licences under the Water Act, which
act regulates the diversion of water from surface and groundwater sources, with the exemption of diversions of saline groundwater. Alberta’s Energy Resources Conservation Board (AERCB) regulates saline groundwater diversions, while AEW has jurisdiction over nonsaline groundwater diversions and the Alberta Energy Regulator (AER) requires the industry to track the actual volumes of water used.
• In 2006, Alberta replaced the Groundwater Allocation Policy for Oilfield Injection Purposes (1990) with the Water Conservation and Allocation Guideline for Oilfield Injection. The ultimate goal of the policy is to reduce or eliminate allocation of nonsaline (fresh) water for oilfield injection, while respecting the rights of the current licence holders. In 2011, the policy was reviewed; recommendations included reduction or elimination of nonsaline water use, improved productivity of water use, conservation and protection of nonsaline aquifers and aquatic ecosystems, improved partnerships, and research initiatives.
Commentary • An enhanced regulatory management regime could encourage industry to avoid the use or
disturbance of freshwater resources as much as possible and to optimize efficient use where usable water continues to be required.
• According to a report produced by the Pembina Institute, recommendations could include the following:
o Record the amount of water withdrawn under licences and approvals o Reduce the use of fresh water by the oil and gas industry o Introduce a charge for the industrial use of water o Revise regulations relating to the management of fresh water in coal bed methane
extraction o Track and report complaints about water
3

o Review grandfathered industrial water licences and approvals [1]
Disclosure: Fracking Fluid
Context • The impacts of shale gas development on the hydrological cycle are the most uncertain and
controversial and the subject of the vast majority of peer-reviewed studies [2]. Fracturing fluids contain several chemical additives that, depending on the operator and reservoir, are mixed in different recipes.
• In response to public concern about the risks that these chemical additives pose to human health and the environment, an increasing number of jurisdictions require disclosure. Fracking fluids are not currently required to be reported federally to the National Pollutant Release Inventory (NPRI) because facilities used exclusively for oil and gas exploration or the drilling of oil or gas wells are exempt from NPRI reporting requirements.
• In addition, facilities that conduct well drilling and completion activities (including hydraulic fracturing) do not generally meet the NPRI employee threshold. However, disclosure requirements vary provincially.
Current Policy and Best Practices
Provincial • British Columbia and Alberta require operators to post on a public website (fracfocus.ca)
the chemical additives used in their fracturing fluids on a per well basis, along with their maximum concentration, within 30 days of completing a fracturing job [3],[4],[5].
o Exceptions are permitted in both these provinces for ingredients considered trade secrets (i.e., confidential business information). For a component to be considered a trade secret, a claim of exemption must be filed with the Hazardous Materials Information Review Commission (HMIRC), and the Hazardous Materials Information Review Act (HMIRA) registry number must be provided. (The responsibilities of HMIRC were transferred to Health Canada on April 1, 2013.)
o Certain government officials and medical professionals are able to access information on trade secrets, using the HMIRA number, under specific circumstances (Minister of Justice 2013). In Alberta, if a trade secret is considered nonhazardous, then only the chemical family name needs to be listed (in addition to the maximum concentration).
• New Brunswick also requires public disclosure. • Saskatchewan, Manitoba, Ontario, and Prince Edward Island do not have any regulations
pertaining to fracking, including disclosure of chemicals.
Industry
4

• The Canadian Association of Petroleum Producers (CAPP) released a set of guidelines for fracking, which include public disclosure of all toxic chemicals by its member companies. It also supports use of FracFocus and supports provinces’ decisions to make public disclosure the law.
Commentary • To assess any potential impacts and to design monitoring strategies, researchers and
policymakers need the exact chemical composition of the hydraulic fracturing additives, as well as toxicity assessments and persistence and mobility tests in surface and subsurface systems [6].
• Federal (or continental) oversight may address differences in fracking disclosure across country. NPRI is the major tool in Canada for tracking use of toxic chemicals and could apply to all hydraulic fracturing operations for consistency. The ratio of chemicals could also be disclosed.
• FracFocus is a voluntary, industry website developed in response to calls for disclosure. The voluntary approach allows companies to choose whether and when to report. According to data compiled by Bloomberg, energy companies failed to list information for more than two of every five fracked wells in eight US states in 2011 [7]. The gaps reveal some shortcomings in the voluntary approach to transparency.
• The US version of FracFocus is searchable by state, something that may be considered for the Canadian website (province-based search) to increase transparency.
Rail Car Standards: Hazardous Materials
Context • Canada has a large and well-developed railway network, with about 44,000 km of tracks
across the country [8]. Rail safety is highly regulated in Canada; Transport Canada (TC) has regulatory oversight over the sector via various legislations and acts. TC has stringent rules dictating track inspection, track maintenance, equipment inspection and maintenance that are rigorously applied and enforced. All incidents are reported to and investigated by the Transportation Safety Board of Canada.
• Recently, the volume of transportation by rail has greatly increased while the budget for rail safety has been cut by 19 percent. There has been a shortage of inspectors; in 2009 there was 1 inspector per 14 tank cars, now there is one per 4,000 tank cars [9]. Trains have also increased in size; some trains are 3 km long and weigh over 18,000 tonnes.
• In 2012 the Railway Safety Act was amended to include a series of changes recommended by an independent review panel in 2008. Most of the requirements were voluntary. Since then, regulatory action was pushed by Transportation Safety Board of Canada in 2013 following several rail accidents in the United States and Canada, including an accident in Lac-Mégantic, Quebec, resulting in more than 40 deaths.
5

Current Policy Status • The Railway Safety Act imposes new regulations:
o 5,000 DOT-111 tank cars are to be removed within 30 days o 65,000 DOT-111 cars must be removed or retrofitted within three years o Emergency Response Assistance Plans are now required for all flammable liquids,
not just gasoline and diesel o Speed limits are reduced o Industry, not government, holds financial obligations
• Industry has been manufacturing DOT-111s to an improved standard, known as the CPC 1232 design, since Oct 2011 in anticipation of the changes.
• Canada will make the change to DOT -111 tankers ahead of the United States which has initiated a rule-making process but has not yet specified a timeframe.
Commentary • Regulations could be structured to reflect expected increases in demand.
Reporting: Greenhouse Gases
Context • In 2004, the Government of Canada announced the introduction of the Greenhouse Gas
Emissions Reporting Program (GHGRP), a legislated, publicly accessible inventory of data on greenhouse gases (GHGs).
• Canadian GHG reporting operates on a two-tier system: businesses must file both a federal GHG report and a provincial GHG emission report. In some provinces the relevant air regulations differ between the federal and provincial levels, although a single-window reporting system has been implemented.
Current Policy
Federal • GHGRP 2004 applies to large GHG emitters (in excess of 50,000 tonnes of carbon dioxide
equivalent, CO2e, per year). • GHGs subject to mandatory reporting include CO2, methane, nitrous oxide, sulphur
hexaflouride, hydrofluorocarbons, perfluorocarbons. • Information is collected under authority of the Statistics Act, CEPA, and Climate Change
Emissions Management Act. • Facilities report their emissions through the Single Window Information Management
(SWIM) system. The reporting system is administered by Environment Canada.
6

Provincial • British Columbia. British Columbia’s reporting regulations came into effect on November 25,
2009. Under the authority of the Greenhouse Gas Reduction (Cap and Trade) Act, the regulations set out the requirements. Operations emitting 10,000 tonnes or more of CO2e per year are subject to reporting requirements. Those operations with emissions of 25,000 tonnes or greater are required to have emissions reports verified by a third party.
• Alberta. Alberta’s Specified Gas Reporting Regulations came into effect on July 1, 2007, and will expire September 2014 (with expected renewal or amendment before that date). The regulation lays out the reporting requirements for large emitters of the province and is nearly identical to GHGRP. Alberta requires industrial facilities that emit more than 50,000 tonnes of CO2e to submit annual reports on GHGs. For 2011, 164 facilities located in Alberta reported GHG emissions amounting to 123.3 megatonnes in CO2e.
• Ontario. Ontario’s GHG reporting regulations came into effect on December 1, 2009. Under the Ontario Environmental Protection Act, all facilities that emit 25,000 tonnes of CO2e or more per year are required to report and verify (by an accredited third party) their emissions data annually for 26 sources outlined in the regulation. Reports are submitted using Environment Canada’s single-window system.
Performance: GHG Emissions from Oil and Gas and Electricity Production and Manufacturing
Context • Canada’s coal-fired electricity and transport sectors are subject to emissions regulations
that seek to reduce the emissions in those sectors. The oil and gas sector—a rapidly growing emissions source that accounts for nearly a quarter of Canada’s carbon emissions—has no current GHG emissions mitigation regulation at the federal level, but the sector is regulated in some provinces. The federal government has stated that such regulations, as well as those for other sectors, will be implemented, but indications are that some sectors may be several years from regulation. However, several provinces have adopted measures of their own to reduce their own provincial carbon emissions; British Columbia’s carbon tax, Quebec’s cap-and-trade system, and Alberta’s gas emitters regulation are examples of such provincial approaches.
Current Policy
Provincial • British Columbia. The province introduced its carbon-neutral tax of $10 per tonne in 2008,
making it the first North American jurisdiction to implement such a tax. The tax increased each year until 2012, reaching a final price of $30 per tonne, a level at which it is projected to stay for the foreseeable future after a review of the tax affirmed it should stay at the
7
current rate. In January 2013, the carbon tax was generating about $1 billion each year, which was used to lower other provincial taxes (corporate, personal income). According to a report by Sustainable Prosperity, the policy has been a major success. During the time the tax has been in place, fossil fuel consumption dropped 17.4 percent per capita (and fell 18.8 percent relative to the rest of Canada). British Columbia’s rate of economic growth (measured as GDP) kept pace with that of the rest of Canada over that time. The tax shift enabled the province to have Canada’s lowest income tax rates as of 2012. And the aggregate effect of the tax shift was positive for taxpayers as a whole, in that cuts to income and other taxes exceeded carbon tax revenues by $500 million from 2008 to 2012.
• Alberta. In 2007, Alberta was the first province to develop legislation regulating reduction of GHGs. The Specified Gas Emitters Regulation (SGER), implemented in 2007, required established facilities that emit more than 100,000 tonnes of GHGs a year to reduce their emissions intensity by 12 percent below a baseline established between 2003 and 2005. Industry had three options for meeting the target: improve performance at the facility, purchase credits from an Alberta-based offset project, or pay into a compliance fund designated for low-carbon technology at the rate of $15 per tonne of emissions. Regulations targeted approximately 100 facilities that emit more than 100,000 tonnes of GHGs annually. These 100 facilities accounted for approximately 70 percent of industrial GHGs. The emission reductions achieved in 2012 represent approximately 3.05 percent of Alberta’s total emissions. Alberta is currently reviewing SGER, which expires in September 2014.
• Saskatchewan. This province continues to work toward adopting SGER-style regulations for 2015 under the Management and Reduction of Greenhouse Gases Act.
• Ontario. Starting in April 2014, fuel suppliers are required to demonstrate a 2 percent content standard that will then have an average blend of 4 percent post-2016. The content standard is tradable, and according to the Canada’s Gazette, 1 Mt of reductions can be expected annually once the program is fully implemented, in 2017. Ontario has also completely phased out coal-fired electricity generation from the provincial grid.
• Quebec. Quebec’s cap-and-trade system came into full swing in 2013 with a number of regulations. The cap-and-trade regulations released identify covered entities and enable full linking with California on January 1, 2014, as part of the Western Climate Initiative, the first active cross-border carbon market in North America. The first permit auction, in early December, sold 1 million of the 2.97 million tonnes of 2013 vintage units bought at the price of $10.75. Another 1.7 million 2016 vintage units were purchased. Total auction proceeds were $29 million. A joint auction with California is planned for June 2014.
Commentary • Federal. Without new regulations, oil sands emissions are projected increase significantly
between 2005 and 2020, potentially outstripping reductions that all other sectors in Canada are projected to make.
8

• Alberta. SGER covers only 43 percent of Alberta’s emissions; it is expected that Alberta will renew the SGER after September 2014, potentially increasing the stringency of the SGER and raising the price of technology fund compliance payments.
Development: Unconventional Shale Gas
Context • Recent technological advances are making shale gas reserves increasingly accessible and
their recovery more economically feasible. The resource is already being considered and/or actively developed in British Columbia, Alberta, Quebec, New Brunswick, Nova Scotia, and elsewhere in Canada.
• The assessment of environmental impacts is hampered by a lack of information about many key issues including; environmental and health effects, contamination of drinking water, air pollution, large volumes of wastewater generated from shale gas wells, earthquakes, toxic chemicals, etc.
• As it stands, many provinces are relying on conventional development standards in place of unconventional standards; this has sparked public concern, including protests.
Current Policy • Federal. There is currently no federal legislation on fracking. The federal government
recently commissioned a study by the Council of Canadian Academies to assess the state of knowledge about the impacts of shale gas exploration, extraction, and development in Canada. The report was prepared for the Government of Canada in response to a request from the Minister of Environment and released May 1, 2014. Itaddressed the following question: What is the state of knowledge of potential impacts from the exploration, extraction, and development of Canada’s shale gas resources, and what is the state of knowledge of associated mitigation options? One of the main conclusions of the report was that the assessment of environmental impacts is hampered by a lack of information regarding many key issues. In other words, the question was difficult to answer objectively because relevant data have not been obtained, relevant data are not publically available, and/or existing data vary in quality, allowing for divergent interpretations.
• Provincially. Provinces regulate natural gas production, and development therefore varies across the country.
• New Brunswick. New Brunswick’s shale industry is in the exploration phase; no shale wells are currently in production. The government of New Brunswick is working to establish regulations for shale development before moving forward. New rules will be implemented as conditions to approvals and certificates of determination issued under the Oil and Natural Gas Act, Clean Environmental Act, Clean Air Act, and Clean Water Act.
• Alberta. Approximately 174,000 wells have been hydraulically fractured in Alberta since the technology was introduced more than 50 years ago.
9

• Quebec. In June 2013, a bill submitted to the Quebec National Assembly imposed a moratorium on shale gas drilling and fracturing in the lowlands of the St. Lawrence River. Oil and gas projects were excluded from the moratorium. The government will wait until two environmental assessments are complete, likely by the end of 2014, to determine next steps. If the law is passed, the moratorium will be in effect for five years.
o Holding one of the revoked licences, Lone Pine Resources, an oil and gas company, is now launching a $250 million lawsuit against the Canadian government over Quebec’s fracking moratorium under the North American Free Trade Agreement.
• Nova Scotia. The provincial government implemented a two-year moratorium on fracking in 2012. The government is looking to have an independent review completed by next year, and no applications for fracking will be considered during this review process. The province’s chief medical officer of health issued a report in October 2012 warning that the province’s infrastructure and legislation were not strong enough to protect public health if the shale gas industry expanded.
Commentary • At the federal level, natural gas production companies have exemptions from parts of at
least seven federal environmental laws written to protect air and drinking water from hazardous and radioactive chemicals released by heavy industries.
• In September 2012, the Council of Canadians delivered to the Ministry of Environment petitions signed by nearly 10,000 people, calling for a moratorium, According to an Environics poll around the time, 62 percent of Canadians support a moratorium until all federal reviews are complete.
Offshore Oil and Gas Exploration and Drilling
Background • Offshore oil and gas exploration has been taking place in Canada since 1964. In the past this
exploration has occurred on both coasts, but a moratorium is in place on the coast of British Columbia. Currently there are six active projects in Canada’s Atlantic region across multiple reservoirs producing both oil and gas. Regulations for offshore oil and gas are overseen by federal-provincial offshore petroleum boards covering projects in Newfoundland and Labrador and Nova Scotia.
Current Policy Status • British Columbia. The moratorium on oil and gas exploration on the British Columbia coast
has been in effect, in one form or another, since 1972. It is a policy moratorium; there is no statutory impediment to exploration. The moratorium is maintained through government policy.
10

• Newfoundland and Labrador. In-production developments are Hibernia, Terra Nova, and White Rose. Average monthly oil production has been between 6 MMbbls and 8 MMbbls over the past 12 months.
• Nova Scotia. This province has two in-production developments: Sable (average monthly gas production between 100,000 and 150,000 E3m3 (thousands of cubic meters) over the past 12 months), and Deep Panuke (average monthly gas production between 200,000 and 250,000 E3m3 for 2014).
• To obtain a license to convert an identified reserve into production, an operator must submit a development plan to the regulatory board, covering such issues as safety and local benefits, and attest that best practices are followed. An additional safety and environmental protection plan are also required. Nearly all of this information (save that which is proprietary) is made available for public review. Additional authorizations and approvals are required for production, petroleum transportation, and production reporting [10]. Regulatory requirements regarding spills specify that “Operators are required by law to develop spill response plans as part of their approval and permitting process. These plans include detailed descriptions on how companies prevent spills and how they would respond to a variety of spill scenarios in exploration, development and production phases. Offshore operators must also have equipment and trained personnel prepared to respond to an incident. Operators are required to report all spills to the Offshore Petroleum Boards in Newfoundland and Labrador and Nova Scotia, including spills of drilling fluids, hydrocarbons and diesel” [11].
• Four principal acts cover offshore oil and gas: o Canada Petroleum Resources Act, which governs leasing of federal reserves to
companies, and also covers issues such as environmental protection. o Canada Oil and Gas Operations Act, which covers exploration, production,
processing, and transportation of oil and gas. o Canada-Newfoundland Atlantic Accord Implementation Act and the Canada–Nova
Scotia Offshore Petroleum Resources Accord Implementation Act, which establish the regulatory board and outline issues between provinces and federal government regarding resource management and revenues.
Commentary • The Canadian Association of Petroleum Producers (CAPP) highlights technology and actions
that industry uses to prevent spills, including the following [12]: o Specialized equipment, such as blow-out preventers, which are heavy-duty valves
attached to the wellhead to control well pressure and prevent a blowout o Heavy-duty piping, subsurface safety valves, fire and gas detection systems and
deluge systems for putting out fires o Spill containment devices and drainage systems o Rigorous risk assessments to ensure design and equipment integrity o Extensive quality assurance and quality control programs to ensure equipment is fit
for its intended purpose
11
o Emergency shut-down equipment located throughout facilities o Third-party review and assessment of facilities to ensure highest standards o Extensive training and competency assessment of personnel o Operational techniques that incorporate the industry's best practices o Comprehensive health, safety and environmental management systems o Regular tracking of icebergs and accurate prediction of harsh weather
• Though not statutory, the moratorium for the British Columbia coast has become entrenched, while expansion is occurring in the Atlantic region in recent years.
• The Pembina Institute has conducted a comparison of Arctic offshore oil and gass drilling regulatory regimes in the United States and Canada (among other countries): http://www.pembina.org/reports/comparing-offshore-regulations-executive-summary-final.pdf.
• In Canada, Arctic drilling in deep water is being considered, but as of yet there are no developments. There has been community opposition to drilling in Arctic waters, and the federal government is considering which sites may open to drilling and which may remain closed. The National Energy Board and Aboriginal regulators are involved [13]. Actual drilling is potentially years away, but the BP Gulf oil spill has made local residents wary.
Wastewater
Background • Effluent from wastewater systems represents one of the largest sources of pollution, by
volume, in Canadian waters [14]. Harms to aquatic ecosystems and to Canadians from substances found in wastewater effluent have been documented domestically and internationally for more than 20 years.
• Mining industries discharged most (73 percent) of their wastewater to surface fresh water and discharged another 11 percent to tailing ponds and 9 percent to groundwater. Metal mines accounted for the largest proportion of wastewater discharged to tailing ponds. Of the total water discharged by mining operations, 60 percent was not treated before discharge, 31 percent underwent primary or mechanical treatment, and 9 percent underwent tertiary or advanced treatments [15]. One drop of oil can render up to 25 litres of water unfit for drinking [16].
Current Policy Status
Federal • Environment Canada published its first-ever set of wastewater regulations on July 18, 2012,
as a means of cleaning up, or at least reducing, the 150 billion litres of untreated or undertreated wastewater or sewage that is dumped into waterways each year. The regulations fall under the Fisheries Act and are enforceable by law. Environment Canada requires a minimum treatment standard for wastewater before it is released into
12

waterways. That minimum standard is called secondary treatment, a process that screens and filters water with both machines and biological processes and removes 95 percent of pollutants. In addition, there are requirements for monitoring, recordkeeping, reporting, and toxicity testing. Currently, there are approximately 850–1,000 Canadian wastewater treatment plants in need of upgrades to meet the federal wastewater regulations. These upgrades will cost an estimated $6 billion. All Canadian wastewater systems will eventually have to comply with the regulation by 2040. High-risk systems would require completion by 2020.
Provincially • Waste management acts authorize the provincial environment ministers to make guidelines
and regulations pertaining to every person and commercial, industrial, or public organization that produces, stores, transports, handles, treats, destroys, discharges, or disposes of wastes and special wastes. They generally supersede municipal by-laws and permits, and wastes discharged or disposed of must have a permit, approval, order, or waste management plan, or be in compliance with the regulations. The acts deal with licensing of disposal facilities as well as the transportation of wastes.
• British Columbia. The provincial Oil and Gas Commission regulates aspects of the water used
in oil and gas activities from both surface and subsurface sources. The disposal of produced water is heavily regulated through legislation. There is no surface discharge of produced water from oil and gas activities allowed in British Columbia.
• Ontario. The Municipal Industrial Strategy for Abatement (MISA) program was the provincial response to address levels of persistent toxic substances in industrial direct discharges entering Ontario’s waterways. The MISA regulations are nine sector-specific regulations that set limits on toxic pollutants in wastewater discharged directly into a body of water by a designated industrial facility. Each parameter addressed under MISA is regulated with both a daily limit and a monthly average limit, and the effluent must not be toxic to fish.
• Alberta. The Water Act provides the legislative mandate for water management and regulation for all water uses in the province. The Environmental Protection and Enhancement Act establishes a legislative framework for protection of water quality in aquatic ecosystems. All wastewater discharges and management of pollution incidents are addressed in this legislation and the regulations. Environmental impact assessments of major industrial projects are also established by this act.
Commentary • In Canada, the management of wastewater is subject to shared jurisdiction, which has led to
differing regulatory regimes and varying levels of treatment across the country. Treatment levels range from very good in many areas to poor or no treatment in others. Through
13

various consultation processes, interested parties have consistently indicated the need for all levels of government to develop a harmonized approach to managing the wastewater sector in Canada. Although Environment Canada published its first-ever set of wastewater regulations on July 18, 2012, many environmental groups urged Environment Canada to consider tougher measures and that 28 years to comply to the new regulations is too long.
Pipeline Safety
Background • The National Energy Board took action in March 2012 to promote safety, security and
environmental protection by requiring certain regulated companies that own or operate pipelines to annually report on new performance measures. Company reporting was reviewed in 2013 to assess whether the measures were providing the intended results and the guidance was enabling consistent reporting.
• The National Energy Board Onshore Pipeline Regulations are made under the National Energy Board Act, whose purpose is to promote safety and security, environmental protection, and efficient energy infrastructure and markets in the Canadian public interest within the mandate set by Parliament in the regulation of pipelines, energy development, and trade. Companies are responsible for meeting the requirements to manage safety, security, and environmental protection throughout the entire life-cycle of their facilities, from design through construction, operation, and abandonment. On April 10, 2013, the 1999 regulations were amended and renamed the National Energy Board Onshore Pipeline Regulations. The regulations clarify requirements for federally regulated pipelines regarding management systems for the purpose of protecting the public, workers, and the environment.
Current Policy • The Onshore Pipeline Regulations make it clear that management systems (a systematic
approach designed to effectively manage and reduce risk) must apply to company programs for safety, pipeline integrity, security, environmental protection, and emergency management. Also, the regulations require that management systems be in place throughout each phase of the life-cycle of the pipeline, from design, materials, construction, operation, and all the way through to abandonment.
o According to the National Energy Board, management systems are the primary means for a company to reduce risk and continually improve its operations. Management systems provide a consistent framework for the design, development, and implementation of organizational management programs, as well as for the cyclical planning, implementation, review, and adjustment of operational activities; such systems are essential for a company to address risks, manage its resources appropriately, and achieve desired outcomes.
14
• The regulations include provisions that focus on a company's senior leadership for accountability of its management systems, the company's safety culture, and the achievement of outcomes related to safety of the public and environmental protection. Furthermore, companies must have an internal reporting policy that will encourage employees to bring forward, without fear of reprisals, the hazards and risks that they may encounter during their work activities.
Pollution Prevention
Context • The Canadian Environmental Protection Act (CEPA), the National Pollutant Release
Inventory (NPRI) under CEPA, the Fisheries Act, and the Canadian Shipping Act are some of the main federal regulations that focus on pollution prevention.
• CEPA has been in force since 1988. A revised version of the act came into force in 1999. A substantial portion of the act deals with the identification, control and/or prevention of toxic substances in the environment. CEPA also fulfills Canada’s international and national commitments for regulating air pollution and ocean dumping.
• NPRI provides Canadians with facility-specific information regarding the release (to air, water, and land), disposal, and recycling of more than 300 substances that meet the criteria under Section 64 of CEPA 1999. NPRI is covered under Sections 46 to 53. Section 46 addresses the creation of inventories of data; Section 48 states that the minister shall establish a national inventory of releases of pollutants; Section 50 states that the minister shall publish this inventory; and Sections 47, 49, and 51–53 contain guidelines for the collection and publication of inventory data. NPRI does not capture data on all pollutant emissions in Canada. Reporting requirements are intended to create a balance between the level of effort required from reporting facilities and the overall quality of information on NPRI.
• The Fisheries Act is the principal federal statute that manages Canadian fisheries resources, protecting fish and the habitat they need to reproduce, grow, and survive. In 2012 the Fisheries Act was changed by provisions enacted in two successive omnibus budget bills—Bill C-38 and Bill C-45.
• The pollution provisions of the Canadian Shipping Act (CSA) apply to Canada’s oil handling facilities. On July 1, 2001, CSA replaced an older act, and it came into force on July 1, 2007.
Current Policy Status • NPRI. Close to 4,000 oil and gas extraction facilities report to NPRI, representing more than
40 percent of all facilities reporting to NPRI. All producing Canadian oil sands operations and off-shore oil and gas extraction facilities reported, as did most natural gas–processing plants. Current NPRI reporting requirements do not require reporting of fugitive or venting emissions or fracking. Oil and gas exploration are also exempt (Environment Canada 2014).
15
o Environment Canada is undertaking a review of NPRI’s reporting requirements for oil and gas facilities in order to achieve appropriate rates of reporting and coverage for pollutants of concern, as well as simplified data reporting/data collection processes for industry and Environment Canada.
o This review also responds to an environmental petition, Shale Gas Fracking and In Situ Oil Sands Chemicals and the National Pollutant Release Inventory: Public Disclosure Needed (petition 317), which was submitted to the Auditor General of Canada on June 22, 2011. Environment Canada responded to the petition on October 25, 2011, indicating that it would be undergoing a review of NPRI reporting from the oil and gas sector and would consider NPRI reporting for shale gas and in situ oil sands extraction as part of that review [17].
• Fisheries Act. A new subsection enables lawful harm to fish habitat and expands governments’ ability to authorize harm to fish habitat.
• Shipping Act. To date, there have been no convictions for pollution offences for ship-source oil pollution, following the act’s amendment in 2005 [18].
Commentary • CEPA. Environment Canada could adopt an on-line enforcement disclosure approach,
similar to the US EPA’s Enforcement and Compliance History Online (ECHO), linked to CEPA.
• NPRI. Facilities reporting to NPRI could be required to use the same method every year; to make comparisons and trend analyses more reliable, and requirements could be increased to include fugitive, venting, and fracking gases.
• Fisheries Act. The act could be amended to include fish habitat and the Department of Fisheries and Oceans could have stronger powers to enforce compliance.
Renewable Energy Initiatives
Context • “Renewable Energy provides some 1900 petajoules of Canada’s primary energy supply, or
about 16.5 percent” [19]. Conventional hydropower provides about two-thirds of Canada’s renewable energy and about 60 percent of Canada’s electricity.
Current Policies
Federal • The accelerated Capital Cost Allowance (CCA) in the income tax regulations allow investors
to accelerate write-off of certain equipment used to produce energy more efficiently or from alternative renewable resources. In 2005, a 50 percent accelerated CCA was introduced for eligible equipment that generated heat for use in industrial processes, generated electricity
16

by a renewable energy source, or made efficient use of fossil fuels. Budget 2005, 2007, 2008, 2010, and 2011 extended eligibility to a broader range of applications.
• The Government of Canada is also committed to expanding the production and use of renewable alternatives to gasoline and diesel, such as ethanol and biodiesel. The ecoENERGY Program, introduced in 2007, provides up to $1.5 billion over nine years to encourage investment in the biofuels industry.
• The Aboriginal and Northern Community Plan provides $30.7 million for Aboriginal and northern communities to increase their energy efficiency and their use of renewable electricity.
Provincial • Ontario. The Ontario Power Authority launched the Renewable Energy Standard Offer
Programme (RESOP) in 2006 to make it easier for small, renewable energy generating facilities to participate in the electricity supply system by providing a stable pricing regime under a 20-year contract. Projects can use solar, wind, hydro, or biomass and can range from 1MW to 10MW. When launched in 2006, the program aimed to generate 1000 MW over 10 years. In little over a year, 1300 MW of contracted projects were achieved. As of January 2009, RESOP had signed 604 contracts totalling 1,517.5 MW.
• Ontario. The Feed-in Tariff (FIT) program, the most comprehensive program of its kind in North America, came into effect in October 2009. It allows generators of all sizes, from homeowners to large developers, to participate, providing a fixed tariff for the electricity grid. The program’s prices that are intended to cover total project costs, provide a reasonable rate of return over a 20-year contract, and provide a straightforward way to obtain a contract for renewable electricity energy generation. FIT is open to various renewable energy technologies: biogas, biomass, landfill gas, solar photovoltaic, wind, and water power. It requires specific incentives for Aboriginal projects as well as for community-based projects. FIT payments can range from 10.3 cents/kWh to 80.2 Cents/kWh. The FIT program has created thousands of direct and indirect clean energy jobs, contracted 4,600 MW, attracted more than $27 billion in private investment, increased the amount of clean energy in Ontario’s supply mix, and supported Ontario’s plan to replace coal-fired generation.
• Ontario. A renewable portfolio standard (RPS) requires that 5 percent (1350 MW) of the province’s power come from renewable sources by 2007 and 10 percent (2700 MW) by 2010.
• British Columbia. The province introduced a voluntary RPS targeting 10 percent of new generation from renewable sources.
• Prince Edward Island. PEI has legislated an RPS, through the Renewable Energy Act, which requires public utilities to obtain 15 percent of their electricity generation from renewable energy sources starting on January 1, 2011.
• Nova Scotia. On February 1, 2007, Nova Scotia legislated an RPS, through regulation under the Electricity Act, which required standard service providers to obtain an additional 5
17

percent of their electricity generation from renewable energy sources by 2011 and 10 percent by 2013.
• Manitoba. MB Hydro is attempting to expand the reach of clean energy by seeking to get large-scale hydro exports recognized as renewable under RPS approaches in other jurisdictions (mainly the United States). Manitoba’s domestic electricity generation is already more than 95 percent renewable.
Commentary • According to Ontario’s Feed-in Tariff Program Two Year Review Report [20], Ontario should
take the following actions: o Improve the regulatory approvals process by better aligning approvals with the size
and characteristics of a project, reduce duplication, improve service standards, and streamline the process. According to the report, this could improve timelines for project approvals by up to 25 percent.
o Prioritize projects through a new system that is designed to award points based on the participation of local or Aboriginal communities.
o Prioritize projects with municipal support by awarding points during the application review process.
o Reduce FIT prices by more than 20 percent for solar and approximately 15 percent for wind. Prices for hydro, biogas, biomass, and landfill gas should be maintained at the current levels. Prices should be adjusted annually to reflect current costs.
• RPS development in Canada is relatively new; valuable lessons can be learned from jurisdictions with well-established and time-tested RPS, such as those in the United States.
Refining Operations
Commentary • As of 2013, Canada had 21 refineries and upgraders with a total capacity of roughly 515,000
cubic meters per calendar day. The total capacity has remained relatively steady, fluctuating between 490,000 and 531,000 since 2008, following a period of expansion in the 1990s and early 2000s. This section covers air emissions issues and water and effluent issues related to refining.
Current Policy • Federal. Canada has currently not proposed GHG emissions control regulations for new or
existing refineries or upgraders. There has been ongoing consultation with industry on potential for regulations for refineries, but as of yet this sector remains uncovered. In general the federal government has indicated that provincial approaches to regulating or pricing carbon will be allowed to be maintained when the federal government does propose
18

regulations for sectors, provided that they meet an equivalency threshold with proposed federal approaches.
• Air emissions and toxics. The Canadian Council of Ministers of the Environment (CCME) launched the National Framework for Petroleum Refinery Emission Reductions (NFPRER) as a multi-stakeholder process in 2002 with three goals: Protection of Human Health and Environment; Real, quantifiable emission reductions; and Convergence with comparable US refineries [23]. Canada sought to match US performance but with the potential for greater flexibility in achievement.
• Effluents from refineries. The Petroleum Refinery Liquid Effluent Regulations, under the Fisheries Act [24], cover oil and grease, phenols, sulfide, ammonia nitrogen, total suspended matter, and any substance capable of altering the pH of liquid effluent or once-through cooling water.
• Alberta. The province covers its refineries and upgraders under its Specified Gas Emitters Regulation, which applies to all facilities that emit in excess of 100,000 tonnes of CO2e per year. Under this system, covered entities are required to meet a reduction standard of 12 percent in emissions intensity as of January 2007. Compliance options include the following [21]:
o Improvements to operations o Purchasing Alberta-based offset credits o Trading credits with entities that exceed their target o Making payments into an Alberta Climate Change and Emissions Management fund
at a cost of $15 per tonne, with funds designated for developing low-emissions technology, such as carbon capture and storage
• Alberta. The province’s Water Council had requested various sectors to develop voluntary water conservation efficiency productivity (CEP) plans to improve their water performance under the Alberta’s Water for Life strategy (http://www.waterforlife.alberta.ca/). The oil and gas sector was one of those that developed a plan, completed in 2012, that covers refining and seeks to improve water efficiency [25].
• Quebec. The province currently has two petroleum refineries, which are subject to its cap-and-trade system beginning in 2015 but receive assistance in the form of partial free allowances to protect their competitiveness with entities in uncovered jurisdictions [22]. Per provincial regulation, the portion of free allowances declines over time.
• British Columbia. The carbon tax rate on refinery gas is 5.28 ¢/m3.
Commentary • GHGs. Industry has stated opposition to stronger GHG rules, or at the least favours a clear
price on carbon and a level playing field with other jurisdictions [26]. Industry supports the NFPRER.
• Water. There is some discussion of water use for refineries. The Canadian Association of Petroleum Producers highlights a Suncor refinery in the city of Edmonton as leader in water conservation for its decision not to use water from the Saskatchewan River for its operations, but instead using wastewater from the City of Edmonton’s Gold Bar Wastewater
19

Treatment Facility. Suncor filters the water in a “first of its kind” operation and uses this recycled water to meet its needs [27].
Performance: GHG Emissions Limitations in the Transport Sector
Context • Given the influence of the American market, Canada has typically fairly quickly aligned its
fuel efficiency standards for the light- and heavy-duty fleet with the prevailing US corporate average fuel economy (CAFE) standards. Canada has also adopted biofuel mixing standards at various levels across federal and provincial jurisdictions. Incentives for the manufacture and purchase of highly efficient vehicles have also been prevalent in the past decade.
Current Policy • Light-duty vehicles. Canada now has fuel economy and GHG emissions regulations in place
for vehicle models through 2025. Through these regulations, cars will be required to achieve an average 5 percent annual reduction in GHG emissions. The required improvement for light trucks is 3.5 percent through 2022 and 5 percent thereafter. Vehicles of the 2025 model year will consume up to 50 percent less fuel than 2008 vehicles [28].
• Heavy-duty vehicles. Proposed regulations for heavy-duty vehicles were released in April 2012 (and finalized in 2013) for the 2014 to 2018 model years, aligning with the standards of the United States [29].
• Renewable fuels. Starting in 2010, the Government of Canada required an average renewable fuel content standard of 5 percent (ethanol) in gasoline. Further, a 2 percent biodiesel in diesel fuel regulation has also been put in place (Environment Canada 2013).
• Several provinces have differing mandates (E = ethanol, B = biodiesel [30],[31]): o British Columbia: E = 5 percent; B = 4 percent; o Alberta: E = 5 percent; B = 2 percent; o Saskatchewan: E = 7.5 percent; B = 2 percent o Manitoba: E = 8.5 percent, B = 2 percent o Ontario: E = 7.5 percent; B = 2 percent (plans to increase to B = 4 percent by 2017) o PEI: Proposed B = 10 percent not yet mandated
• British Columbia. The provincial carbon tax is currently 6.67 cents per litre of clear gasoline, 7.67 cents per litre of clear diesel and light fuel oil. Methanol is taxed at a rate of 3.27 cents per litre. Natural gas is taxed at a rate of 5.7 cents per cubic metre [32].
• Quebec. The province has a carbon tax of 0.8 cents per litre of gasoline, and 0.9 cents per litre of diesel fuel
• Industry incentives for biofuels are outlined in the ecoENERGY for Biofuels Program (2008–2017). This $1.5 billion program is designed to boost production of biofuels through incentives to producers of renewable fuels based on production and market conditions. The program is designed to reduce risk associated with fluctuating feedstock and fuel prices.
20
Commentary • There have been a number of incentives for low-emitting vehicles, particularly electric or
hybrid vehicles in Canada; however many of these have reached their budget limit, or sun-set as technology becomes more mainstream. Ontario is one of the jurisdictions with a program still in place, with purchase rebates up to $8,500 for battery electric vehicles. The full list of rates is available here: http://www.mto.gov.on.ca/english/dandv/vehicle/electric/ev-vehicle-list.shtml.
• There is interest in increasing biofuel mandates in Canada; however there is also concern about the efficiency of biofuels in cold climates, since the fuel can gel at Canada’s winter temperatures [33].
Import and Export of Natural Gas and Oil: Low-Carbon Fuel Standards
Context • A low-carbon fuel standard (LCFS) is a rule enacted to reduce carbon intensity in
transportation fuels compared with conventional petroleum fuels, such as gasoline and diesel. The most common low-carbon fuels are alternative fuels and cleaner fossil fuels, such compressed natural gas (CNG) and liquefied petroleum gas (LPG). The main purpose of a low-carbon fuel standard is to reduce the carbon footprint of transportation.
• California’s LCFS was introduced in 2007 with the goal of decreasing carbon dioxide
emissions associated with transportation fuels by defining carbon-intensity standards that suppliers must achieve across all fuels they provide to the market. These reductions include not only tailpipe emissions but also all other associated emissions from production, distribution, and use of transport fuels, considering the entire life-cycle (“well to wheels” or “seeds to wheels”), to reduce the carbon footprint of transportation fuels. The LCFS directive calls for a reduction of at least 10 percent in the carbon intensity of California’s transportation fuels by 2020. LCFS targets are back-loaded—that is, the mandated carbon reductions start slowly and ramp up quickly starting in 2015 [38]. Canadian producers of oil from the oil sands have expressed concerns about exports to markets with low-carbon fuel standards that take into account the carbon intensity of full life-cycle of fuels, notably inclusion of production emissions. In particular, the Canadian Association of Petroleum Producers (CAPP) has stated its opposition to a broader application in the United States of low-carbon fuel standards based on the California LCFS [34]. Similarly, the Canadian government has intervened in European Union consultations on its LCFS.
Current Policy • British Columbia. The LCFS requires fuel suppliers to reduce the average carbon intensity of
transportation fuels by 10 percent by 2020. This requirement uses life-cycle assessment to determine the overall carbon intensity of fuels used for transportation and includes all
21
factors associated with the production and consumption of each fuel. This includes exploration and production of fossil fuels, production of crops for biofuels and the refining, transport, and end use of the fuel [35],[36].
• Alberta. The renewable fuels standard (RFS) requires an average of 2 percent renewable diesel in diesel fuel and 5 percent renewable alcohol in gasoline sold in Alberta. Renewable fuels used to meet the RFS must demonstrate at least 25 percent fewer greenhouse gas emissions than the equivalent petroleum fuel [37].
Commentary • British Columbia’s low-carbon fuel standard was enacted in 2008 with the objective of
reducing the average carbon intensity of transportation fuels by at least 10 percent by 2020. It differs from California’s in that it does not incorporate indirect land-use values into the life-cycle analysis. The California standard accounts for the fact that GHG emissions associated with land-use conversion in oil sands surface mining are higher than for conventional oil production (peat oxidation yields CO2 and tailing pond impacts that contribute to methane, a significant greenhouse gas). As a result, the Canadian petroleum industry has come out in support of the British Columbia standard and criticized California’s approach. News releases from the provincial and state governments indicate that the fuel standards are identical despite the differences in direct and indirect land-use calculations. The current battle is not as much about changing California’s standard as it is about making sure that future LCFS in Canada and the United States follow British Columbia’s format and not California’s [39].
• An irony of LCFS policies is the “fuel shuffling” phenomenon. An argument can be made that
implementation of LCFS in one importing market (e.g., the United States) leads to higher global GHG emissions because of increased transportation of crude oil and other fuels to and from more distant markets. For example, Canadian crudes that are assigned a higher “carbon intensity” value could be transported to Asia in exchange for greater volumes of Middle Eastern crudes with lower carbon intensity being shipped to the United States. A similar phenomenon is already occurring with biofuels, as Brazilian ethanol produced from sugarcane is being “shuffled” with corn-based ethanol produced in the United States.
22

Sources [1] Griffiths, M., Woynillowicz, D. (2003). Oil and Troubled Waters; Reducing the impact of the oil
and gas industry on Alberta’s water resources. Pembina. Retrieved from http://www.Ualberta.ca/~ersc/water/links/pembina.pdf.
[2] [6] Council of Canadian Academies. (2014). Environmental Impacts of Shale Gas Extraction in Canada. Ottawa (ON): The Expert Panel on Harnessing Science and Technology to Understand the Environmental Impacts of Shale Gas Extraction, Council of Canadian Academies.
[3] British Columbia Oil and Gas Commission. (2012). Fracture Fluid Report Upload Manual. Retrieved from: http://www.bcogc.ca/sites/default/files/documentation/wells-manuals/fracfluiddisclosuremanualfinal_1.pdf
[4] Alberta Energy Regulator. (2012). ERCB Improves Public Access to Hydraulic Fracturing Fluid Information FracFocus.ca coming soon to Alberta. Retrieved from: http://www.aer.ca/about-aer/media-centre/news-releases/news-release-2012-12-19-nr2012-14
[5] Alberta Energy Regulator. (2012). Directive 059: Well Drilling and Completion Data Filing Requirements. Retrieved from: http://www.aer.ca/documents/directives/Directive059.pdf
[7] Elgin, B., Haas, B., Kuntz, P., Polson, J. (2012). Fracking Hazards Obscured in Failure to Disclose Wells. Bloomberg. Sustainability, August 2012, web. 20 May, 2014.
[8] Office of the Auditor General of Canada. (2013). Oversight of Rail Safety; Transport Canada. Retrieved from http://www.oag-bvg.gc.ca/internet/English/parl_oag_201311_07_e_38801.html.
[9] Brahmi, T. (2014). Canada. House of Commons. Railroad Transportation Adjournment Proceedings. Tarik Brahmi on Rail Transportation. Retrieved from http://openparliament.ca/debates/2014/2/24/tarik-brahmi-1/only/.
[10] Natural Resources Canada. (2011). Oil and Gas Activity. Retrieved from: http://www.nrcan.gc.ca/energy/offshore-oil-gas/5841
[11] [12]Canadian Association of Petroleum Producers (CAPP). (n.d.). Spill Prevention and Response in Atlantic Canada. Retrieved from: http://www.capp.ca/GetDoc.aspx?DocId=105603&DT=NTV.
[13] Canadian Press. (2014). Arctic offshore drilling closer to reality as projects enter regulatory review. CBC News. Retrieved from: http://www.cbc.ca/news/canada/arctic-offshore-drilling-closer-to-reality-as-projects-enter-regulatory-review-1.2583487
[14] Government of Canada. (2011). Wastewater Systems Effluent Regulations. Retrieved from http://www.gazette.gc.ca/rp-pr/p1/2010/2010-03-20/html/reg1-eng.html.
[15] Statistics Canada. (2013). Section 4: Waste water discharges. Retrieved from http://www.statcan.gc.ca/pub/16-201-x/2012000/part-partie4-eng.htm.
[16] Environment Canada. (2010). Introduction to Water Quality. Retrieved from http://www.ec.gc.ca/eau-water/default.asp?lang=En&n=2C3144F5-1.
23

[17] Office of the Auditor General of Canada. (2011). National Pollutant Release Inventory reporting of chemicals used for shale gas and in-situ mining (petition 317). Retrieved from http://www.oag-bvg.gc.ca/internet/English/pet_317_e_35778.html.
[18] Purcell, C. “Important Changes to the Canadian Shipping Act.” International Law Office, September 2014. Web. May 20, 2014.
[19] Environment Canada. (2010). Renewable Energy. Retrieved from: http://www.ec.gc.ca/energie-energy/default.asp?lang=En&n=F62D29CC-1
[20] Ontario Ministry of Energy. (2013). Feed-In Tariff Program Two Year Review. Retrieved from: http://www.energy.gov.on.ca/en/fit-and-microfit-program/2-year-fit-review
[21] Alberta Environment and Sustainable Resource Development (ESRD). (2014). Greenhouse Gas Reduction Program Retrieved from: http://esrd.alberta.ca/focus/alberta-and-climate-change/regulating-greenhouse-gas-emissions/greenhouse-gas-reduction-program/default.aspx.
[22] MDDEP. (n.d.). Regulation Respecting a Cap-and-Trade System for Greenhouse Gas Emission Allowances (C&T) Technical Overview. Retrieved from: http://www.mddep.gouv.qc.ca/changements/carbone/SPEDE-description-technique-en.pdf.
[23] Chamberland, C. (2007). Improving Air Quality in a Competitive Context: National Framework for Petroleum Refinery Emissions Reductions. Workshop #2 of the National Policy Consultation Series on Children’s Health and the Environment. February 27-28, 2007.
[24] Government of Canada. (2014). Petroleum Refinery Liquid Effluent Regulations. Retrieved from: http://laws-lois.justice.gc.ca/eng/regulations/C.R.C. percent2C_c._828/index.html.
[25] Canadian Fuels Association. (2013). Water – A Precious Resource. Retrieved from: http://canadianfuels.ca/assets/upload/pdf/en/Environment/Guidance percent20Material/Water percent20Primer percent20- percent20Jan-2013 percent20FINAL percent20(Sec percent20V percent20Revised percent20Jan percent202014).pdf.
[26] Canadian Fuels Association. (2014). Industry Policy Positions. Retrieved from: http://canadianfuels.ca/en/industry-policy-positions.
[27] Canadian Association of Petroleum Producers (CAPP). (2014). Using Recycled Water Instead of River Water. Retrieved from: http://www.capp.ca/energySupply/innovationStories/Water/Pages/usingrecycledwaterinsteadofriverwater.aspx.
[28] [29] Environment Canada. (2013). Greenhouse Gas Emission Regulations. Retrieved from: http://www.ec.gc.ca/cc/default.asp?lang=En&n=E97B8AC8-1.
[30] Webb, A. (2013). Canadian federal and provincial biofuels mandates. Retrieved from: http://www.biofuelnet.ca/2013/09/26/canadian-federal-and-provincial-biofuels-mandates/
[31] British Columbia Trucking Association. (2014). North American Biodiesel Roundup – What’s Mandated Where for Diesel Blends. Retrieved from: http://www.bctrucking.com/node/11725
24

[32] British Columbia Ministry of Finance. (2013). Tax Rates on Fuels. Retrieved from: http://www.sbr.gov.bc.ca/documents_library/bulletins/mft-ct_005.pdf.
[33] LSU AgCenter. (2013). Biodiesel Fuel Management in Cold Weather. Retrieved from: http://www.lsuagcenter.com/en/our_offices/departments/W.A._Callegari_Environmental_Center/News/Biodiesel-Fuel-Management-in-Cold-Weather.htm.
[34] Canadian Association of Petroleum Producers (CAPP). (2009). Comments on Proposed Low Carbon Fuel Standard Regulations. Retrieved from: http://www.capp.ca/getdoc.aspx?DocID=151109.
[35] British Columbia Ministry of Energy and Mines. (2013). Renewable & Low Carbon Fuel Requirements Regulation. Retrieved from: http://www.empr.gov.bc.ca/RET/RLCFRR/FAQ/Pages/default.aspx.
[36] British Columbia Queen’s Printer. (2008). Renewable and Low Carbon Fuel Requirements Regulation. Retrieved from: http://www.bclaws.ca/EPLibraries/bclaws_new/document/ID/freeside/394_2008.
[37] Alberta Energy. (2014). Renewable Fuels Standard Administration. Retrieved from: http://www.energy.alberta.ca/BioEnergy/2847.asp.
[38] Fuelling California. (n.d.) Low Carbon Fuel Standard Issue Brief: A Comprehensive Analysis of Current Research and Outlook for the Future. Retrieved from: http://www.fuelingcalifornia.org/wpcms/wp-content/uploads/LCFS-Issue-Brief-FINAL.pdf.
[39] Pacific Institute for Climate Solutions (PICS). (2010). Briefing Note 2010 – 18 BC’s Low Carbon Fuel Standard. Retrieved from: http://pics.uvic.ca/sites/default/files/uploads/publications/BC's percent20low percent20carbon percent20fuel percent20standard percent20.pdf
25

ATTAINING SUSTAINABLE DEVELOPMENT OF OIL AND GAS IN NORTH AMERICA: MEXICO POLICY BRIEFS
Juan Carlos Belausteguigoitia, Carlos Muñoz-Piña, Mariza Montes de Oca,
Santiago Ramírez, Artemisa Aguirre, Rodrigo González, Ana Paula Gil, Renata Lozano, Raul Livas, Marisol Fonseca1
June 8, 2014
This document supports an RFF Summary Report entitled Attaining Sustainable Development of Oil and Gas in North America: A Review of the Environmental Regulatory
Landscape.
Introduction The following set of policy descriptions was put together by researchers at the Centro Mario
Molina as part of an international review of environmental policies governing oil and gas development in Canada, Mexico, and the United States. The policy briefs presented here cover Mexico, with the United States and Canada covered in companion documents. The broader set is reflected in a summary report covering all three countries.
This document includes brief descriptions of policies governing the oil and gas production process, from extraction (well-site permitting onward) to end use in the transportation and electricity sectors. Each description provides context, the current state of regulation and best practice, and commentary options for reform and, in some cases, harmonization.
Abbreviations of government agencies and organizations are for the entities’ names in Spanish.
1 Questions or comments on this working document can be addressed to Mr. Muñoz-Piña at [email protected].

Table of Contents
National Agency for Industrial Security and Environmental Protection .......................... 1
Mexico’s New Hydrocarbons Institutional Framework ........................................................... 2
Environmental Regulation for Shale Oil and Gas Extraction in Mexico ............................. 4
Hydrocarbon Extraction in Natural Protected Areas ............................................................... 5
Environmental Impact Assessment (EIA) ..................................................................................... 6
Environmental Operation Licensing and Reporting ................................................................. 7
Opening of Electric Power Activities to Private Firms ............................................................. 9
Fuel Efficiency Standards for Vehicles in Mexico ..................................................................... 10
Sources .................................................................................................................................................... 12

National Agency for Industrial Security and Environmental Protection
Context
● Reforms to the Mexican Constitution in December 2012 provided the starting point for Mexico’s ambitious energy reforms, opening oil and gas activities for the first time in decades to a larger participation by the private sector. These changes are currently being followed by a wave of secondary legislation initiatives that will complete the new institutional framework.
● The opening of the hydrocarbon sectors will imply a large expansion of infrastructure: new fields, both in water and on land, will bring new and additional industrial safety and environmental challenges. The previous integrated arrangement, with the state-owned firm closely working with the environmental agency and assuming most of the industrial safety policy tasks, will have to change.
Current Policy
● Through the transitory text of the 2012 Constitutional reforms, a new environmental and industrial safety agency was created, specifically for the regulation of hydrocarbon activities. The not-yet-launched Agencia Nacional de Seguridad Industrial y Protección del Medio Ambiente (ANSIPMA) would have a broad mandate; a bill now in Congress will define its attributes.
● The institutional design of the agency proposed by the executive branch is now under discussion in Congress. However, some of the proposed elements of the bill suggest serious risks of potential regulatory capture:
1. Unipersonal position for the agency’s head, instead of collegiate direction, the more common approach both in Mexico and elsewhere. Advisory and supervisory boards OK.
2. Presidential designation and removal of the agency’s director, with no overlap between administrations.
3. Requirements of five years’ working in related professional activities are in the right direction, but only one year of separation from incumbent firms is considered too short.
4. The accountability and transparency requirements are vague; no report to Congress or the public is specified.
Commentary
● The current discussion in Congress should consider some changes to strengthen the agency’s design against capture and increase democratic accountability, particularly introducing a collegiate executive direction that would overlap an administration’s period.
1

● The ample mandate of the agency includes authorizations of operations in natural protected areas, standard setting, monitoring and enforcement of regulations, thus reducing the power of SEMARNAT, the institution in charge of these issues nationwide. Should its mandate be spread or shortened to have less capture on topics where interest groups are so narrowly focused?
Mexico’s New Hydrocarbons Institutional Framework
Context The recent constitutional reform of Articles 25, 27, and 28 opened the Mexican energy sector for the participation of the private sector in the activities of exploration and extraction of oil and natural gas, activities that were previously exclusive to Petróleos Mexicanos (Pemex). However, it preserves the stewardship and ownership of the state over Mexico’s hydrocarbon resources. The new Ley de Hidrocarburos (LdH) expands the parameters of these constitutional articles into a full institutional setup for the hydrocarbon industry,2 including mechanisms for allocation of contracts, information requirements, access to distribution networks, and the definition of new systems of administration.
Current Policy
Allocations • The LdH regulates the figure of allocations to Pemex and other state-owned firms. The
Ministry of Energy (SENER) can grant and amend these, given a “favorable opinion” from the National Hydrocarbons Commission (CNH). Pemex and other state enterprises may collaborate with private firms through service contracts for activities related to such allocations.
Exploration and Extraction Contracts • The CNH, according to the guidelines established by SENER and the Ministry of Finance
(SHCP), may establish contracts for exploration and extraction with Pemex, other state productive enterprises and private firms.
• Pemex and other productive state firms have the ability, if needed, to migrate their allocations toward contracts to form alliances or partnerships with private firms.
Information Obtained from Exploration and Extraction Activities • All geological, geophysical, petrophysical, and petrochemical information obtained from the
activities of surface exploration and extraction is considered national property (propiedad
2 Specifically it regulates hydrocarbons exploration and production; treatment, refining, alienation, commercialization, transportation and storage; processing, compression, liquefaction, regasification and decompression, as well as transport, storage, distribution and public sales of natural gas; transport, storage, distribution and public sales of liquefied petroleum gases; transport, storage, distribution and public sales of oil products; and pipeline transport and storage linked to pipelines of petrochemicals.
2

de la nación). The CNH will establish and administer a national hydrocarbon information center.
Open Access • Licensees that provide transport and distribution services by pipeline, storage of
hydrocarbons, LPG, oil products, and petrochemicals are obliged to provide open access, subject to the availability of capacity in their systems.
Commentary Mexico’s ambitious hydrocarbon reform is expected to bring competition and increase capital investment, technology, and productivity in the sector, boosting economic growth over the short and long term. However, the increase in the number of actors and projects will make environmental regulation and monitoring more complex, posing significant risks for the environment if regulation, monitoring, and enforcement capacity does not increase at the same pace.
The LdH additionally regulates the following:
Exploration and Extraction Contracts • The remuneration stated in the contracts will be subject to the provisions of the Revenue
Act of Hydrocarbons. • The Ministry of Energy (SENER) is responsible for the following:
o Selecting areas o Approving and issuing the five-year plan of tenders o Establishing a recruitment model for each area to maximize national revenue o Designing the technical terms and conditions of each contract
• The Ministry of Finance (SHCP) is responsible for the following: o Establishing economic conditions on tax terms for tenders and contracts o Determining adjudication variables of the tender process o Performing administrative and accounting audits on the tax terms of contracts
• The National Hydrocarbon Commission (CNH) is responsible for the following: o Providing technical assistance to SENER o Performing tenders o Subscribing the contracts
Other Hydrocarbon Activities • SENER will issue licenses for oil treatment and refining; natural gas process; hydrocarbon
imports and exports; LPG transport and storage not linked to pipelines, distribution, and public sales; oil products; and petrochemicals.
• The Energy Regulatory Commission (CRE) will issue licenses for oil products and petrochemicals transport, storage, distribution, compression, liquefaction, decompression, regasification and public sales; LPG pipeline transport, storage linked to pipelines.
Public Sales
3

• Quality specifications will be established in the Mexican official norms (NOM) issued by CRE.
• Jet fuel cannot be sold directly; it will be controlled by ASA according to the terms of the Airports Act.
National Center for Control of Natural Gas (CENAGAS) • CENAGAS is the independent operator of the system and is commissioned to ensure the
continuity and security of gas supply in the country.
Integrated National Transport and Storage System of Natural Gas • This system will integrate the following:
o Transport pipelines and storage infrastructure of natural gas o Compression, liquefaction, decompression, and regasification equipment linked to
the transport and storage of natural gas
Environmental Regulation for Shale Oil and Gas Extraction in Mexico
Context ● The US Energy Information Administration assessed 137 shale formations in 41 countries
outside the United States. Mexico was ranked in sixth worldwide for shale gas reserves, with 545 trillion cubic feet, and eighth for shale oil reserves, with 13 billion barrels. [1]
● In its current energy planning stage, Mexico incorporated some of these formations for the exploration and production of unconventional reservoirs [2]. Petróleos Mexicanos (PEMEX) identified five geological provinces as precursors for shale oil and gas—Sabinas, Burros-Picachos, Burgos, Tampico-Misantla, and Veracruz—where an estimated 141.5 trillion cubic feet of natural gas and 31.9 billion condensed barrels are available. [3]
Current Policy ● Before the ambitious energy reforms of 2013–2014, only PEMEX could extract
hydrocarbons in Mexico. Now, the sector has been opened to private sector participation, individually or in association with state-owned firms.
● There is not yet any specific regulation for environmental and industrial safety regarding shale oil and gas hydraulic fracturing, as the activities themselves are at an experimental or pilot stage in the diverse regions in the country. However, while specific regulation is being written, existing regulations and procedures, such as water quality standards or environmental impact assessments requirements, will allow federal agencies to ensure a basic coverage of most of the relevant aspects of the activity.
Commentary A recent study by the Centro Mario Molina [4] identifies the following key points for action:
• There is a need for new regional plans for water availability and usage in the shale areas.
4

• Water pollution and wastewater management plans are needed, plus standards or guidelines to ensure the mechanical integrity of wells during their lifetime to avoid aquifer damage.
• The hydrocarbon sector regulator in environmental matters must design and implement a program to minimize flaring and venting, with a baseline for GHGs and criteria pollutants.
• Installing a seismic “traffic light” that provides feedback on the fracking procedures and the disposal of polluted subsurface waters.
• More transparency and participation mechanisms are needed to communicate risks and the actions taken to reduce it, with an emphasis on informing poorer stakeholders and neighboring or otherwise environmentally linked communities.
Hydrocarbon Extraction in Natural Protected Areas
Context • Mexico is one of the five countries with highest biodiversity in the world. A signatory of the
international Convention on Biological Diversity, the country has responded to its global responsibilities and to its citizens by declaring nearly 1 percent of its territory as natural protected area (NPA), with different degrees of protection and economic activities allowed.
• Because new sources of hydrocarbon wealth are found within NPAs, the interaction of both policy goals becomes complex and will likely not be resolved without friction or conflict. As private firms are expected to play a larger role in hydrocarbon extraction, transport, and processing, thanks to the energy reforms, these interactions will grow in complexity and tension over time, as they have done in mining activities.
Current Policy • Mining operation authorizations require the involvement of at least a dozen federal
agencies,3 of which, the Ministry of Economy (SE) gives extraction concessions, and the Ministry of the Environment (SEMARNAT) handles its environmental regulation. In contrast, NPAs are created by presidential decree and regulated through the General Law of Ecological Balance and Environmental Protection (LGEEPA), with little involvement of other agencies besides SEMARNAT and its NPA commission.
• Article 87 of the General Environmental Protection Law has a default prohibition on extraction of minerals in NPAs, overridden only if the NPA’s particular management plan allows it and if SEMARNAT grants special authorization. All mining activities within an NPA have to submit an environmental impact assessment to SEMARNAT to obtain authorization,
3 Ministry for Foreign Affairs, Ministry of Economy, Ministry of Finance and Public Credit, Ministry of Agrarian Development and Urban Territory, Ministry of Labor and Social Welfare, Ministry of Environmental Protection, Ministry of National Defense, Ministry of Energy, Water National Commission, Mexican Social Security Institute, National Commission for the Development of Indigenous Peoples, National Agrarian Registry and the Mexican Geological Service.
5

but the rules differ depending on whether the mineral wealth was discovered before or after the NPA was created:
○ If the mineral concession existed before the NPA decree, the extraction and removal of minerals can be carried out, if permits are in order.
○ If the mineral wealth is found after the NPA was created, extraction can be carried out only after a positive response in litigation is obtained, and with all the environmental regulations fulfilled. Some activities do not win the legal challenge.
Commentary
• ANSIPMA, the new environmental agency for hydrocarbons, will have SEMARNAT’s attributes regarding authorizations within NPAs. Will the newly created ANSIPMA accelerate the process and provide certainty and sustainability to investment projects, or will stakeholders on either side of the spectrum capture it?
Environmental Impact Assessment (EIA)
Context
• Mexico relies heavily in its environmental impact assessment (EIA) procedure to grant construction and operation permits for large-scale projects, including mining and hydrocarbons.
• Mexico’s EIA process also plays the function of covering any environmental issues not covered in the obligatory standards (Normas Oficiales Mexicanas, NOMs).
• The EIA review and authorization process is perceived as slow, with bottlenecks due to government’s lack of personnel and technical expertise and some low-quality analysis by the private sector. Private firms complain about costly delays stemming from this.
• The EIA process has a public review period that has the objective of increasing transparency and governance.
o However, it is perceived by civil society organizations as too short to inform the public properly.
o The review also faces some contradictions between the general law and its derivative regulation regarding the timing and length of the process. Civil society organizations have gained injunctions on this basis.
Current Policy
• The general law (LGEEPA) distinguishes between activities that require EIAs submitted to the local authorities and those that should be submitted to the federal agency (SEMARNAT). Oil and gas fall in the latter category.
6

• SEMARNAT’s Undersecretariat for Environmental Management has a “general direction” to direct the process.
o In the current prereform institutional context, PEMEX is an active player in developing and thoroughly reviewing EIAs internally, with few delays. Its compensation measures are considered up to global standards. (External independent reviews are needed to verify the claim).
o Private sector tourism, energy, and mining face the most frequent problems, regarding both technical and public review issues. The public reviews do not generally achieve the aims of gaining support and delivering feedback from stakeholders. (This assertion also requires verification.)
• The president presented, as part of the energy reform, an initiative creating a new, specialized institution for the hydrocarbon activities, ANSIPMA. The proposed agency would, among other things, assume the tasks of EIA review and authorization for oil and gas activities. In principle, a more specialized body for the regulation of the hydrocarbon activities could make the process more efficient. However, given the institutional design of the ANSIPMA currently under debate, it is not clear how the EIA process will evolve.
Commentary To address the current structural bottleneck and prevent it from worsening when the energy reforms open more activities to private firms, some options can be considered:
• More funding, directly and/or through the creation of the new hydrocarbon environmental agency.
• Lighter workload, allowing for regional EIAs that cover a certain level of activities, to which private firms join, with a lesser burden of analysis and reporting requirements.
• Clarification of federal/local matters and public review requirements. Less conflict would create fewer delays.
• Requirements for the qualifications of EIA consultants.
Environmental Operation Licensing and Reporting
Context • The Environmental Operation License (LAU) emerged as a response to industry groups’
request to consolidate various environmental permits into a single process. It also helped make comparable the pollution inventories of NAFTA partners: the United States’ Toxic Release Inventory (TRI), Canada’s National Pollutant Release Inventory (NPRI), and Mexico’s Pollutant Release and Transfer Registry (RETC).
• The LAU applies to air emissions from stationary sources under federal jurisdiction4 (Article 111bis of LGEEPA), which includes oil and gas activities.5 The license is issued once and is permanent, but it must be updated if the facility changes its process or production rates.
4 The fixed sources under federal jurisdiction are installations operating in the following sectors: chemical, petroleum and petrochemicals, paints and inks, automotive, pulp and paper, metallurgical, glass, electric
7

• One condition of the license is submission of a mandatory annual operation report (COA). The COA covers production, inputs for production, criteria pollutants and their precursors, wastewater discharges, and generation and management of hazardous waste. Additionally, under the pollutant release and transfer section of the COA, installations must report on hazardous air pollutants (HAPs), ozone-depleting substances (ODS), and greenhouse gases (GHGs).
Current Policy • Many COAs are incomplete because the use of estimation methods is not well disseminated
and/or enforced; typical problems in the reports include missing estimations for fugitive emissions and other nonregulated emissions. ○ In most cases, fugitive emissions are not declared in the reports for lack of knowledge
and diffusion of estimation techniques. Additionally, although recommended in the manual for reporting, the reporting of fugitive emissions is not explicitly required in the current legislation.
• It is not explicitly defined whether the application to obtain the LAU should start before the construction process or once the operation starts.
• Because of the lack of specific regulation for the oil and gas sector, some of the requirements of a LAU are not applicable for some installations; for example, installations without combustion systems are asked for compliance with the standard on air emission limits for boilers.
• In the oil and gas sector there is no clear delimitation of the limits of installation—that is, systems and subsystems. Some subsystems may not require an LAU because they have associated no emissions or other environmental impacts. This is especially relevant in the oil sector: if the systems and subsystems of an installation were explicitly regulated, fewer LAUs would be required, and regulatory costs would also decrease.
Commentary To increase the quality and quantity of the data reported in COAs, some options can be considered:
• Modify and explicitly regulate in which part of the process an LAU is required, and what are the limits of the installation.
• Introduce sanctions for failure to provide information and sanctions for repeated erroneous information.
• Harmonize current regulation (NOMs) on the hydrocarbon sector in Mexico with international standards.
• Introduce an explicit section on fugitive emissions and enforce its publication in the industries needed.
power generation, asbestos, cement and lime and treatment of hazardous waste and electricity generation industries. 5 The LAU format also requests information related with fresh water supply sources, wastewater discharges and hazardous waste generation, management and disposal.
8

Opening of Electric Power Activities to Private Firms
Context
• The Mexican Constitution made electric power generation, transformation, transmission, and distribution the exclusive activities of state-owned firms. In 2013, unprecedented reforms to Articles 25, 27 and 28 of the constitution opened up these activities to the private sector. The specific rules and the new roles are still to be defined by separate bills, currently under discussion by the Mexican Congress and Senate, but a new institutional framework is clearly emerging.
Current Policy • Planning and operation of the National Electricity System (SEN) would be under the
operational control of an independent decentralized public institution: the Centro Nacional de Control de Energía (CENACE), which would also control and operate the wholesale electric market.
• Regulation of power generation would involve several institutions. ○ All types of power generation are open to public and private firms, and the
associations they may form, except for nuclear power, whose generation would remain with state-owned firms.
○ The Energy Regulatory Commission (CRE) would be responsible for regulating and granting power generation permits to participating public and private firms.
○ CENACE would work to ensure competition conditions for private and public generators—for example, by forcing the separation of generation firms from operation ones.
○ National electric coverage to consumers would still be the direct responsibility of CFE; however, the state firm could be “supported” by private firms on these tasks. The specific way this subsidiary participation would take is still debated.
• Transmission and distribution ○ Electric power transmission and distribution is the responsibility of the government:
there are no concessions in these activities. Networks are managed, operated and owned by CFE.
○ CRE establishes the transmission and distribution fees and guarantees open access to networks for all generators.
○ SENER determines the expansion needs of the SEN and selects the agent (CFE or privates) to execute them, according to criteria that would include environmental aspects.
○ CFE can contract with private firms to finance, install, maintain, operate, and expand the actual infrastructure to supply the public service (through public-private partnership models and similar schemes).
• Fees and trading
9

○ The Ministry of Finance (SHCP), with the participation of the Ministry of Energy (SENER) and the Ministry of Economy (SE), regulates and establishes the fees charged to end users.
○ According to their consumption, end users will be classified as either qualified or basic supply users. CFE will provide the basic supply users’ electricity under regulated fees.
○ Qualified users, on the other hand can buy energy directly from the wholesale electricity market or form independent suppliers. In this case they are free to negotiate prices and terms between parties to the transaction.
Commentary The ambitious energy reform in Mexico is expected to bring competition and competitiveness into the generation of electric power in Mexico. It would allow a faster and more efficient expansion of transmission and distribution networks, and will offer the consumers a wider range of voltage and quantities of electric power at more competitive prices.
Fuel Efficiency Standards for Vehicles in Mexico
Context • In Mexico, 20.4 percent of total greenhouse gas emissions—nearly 145 million tons of
carbon dioxide equivalent (CO2e) each year—is produced by the transport sector [5].
Current Policy • Mexico has no fuel efficiency standards for heavy vehicles. President Peña Nieto’s
administration was expected to present a regulation package to harmonize regulations with Canada and the United States, but the process is stalled.
• New light vehicles must now comply with the official standard NOM-163-SEMARNAT-SENER-2013-SCFI.This official standard establishes corporate goals regarding the reduction of CO2 emissions and equivalent gases for vehicles weighing less than 3,857 kg. These goals are reflected in the average fuel efficiency (fuel average performance) (km/l) per fleet of cars produced. The target is to achieve an average fleet efficiency of 14.9 km/l by the year 2016.
○ The rule provides incentives (banking credits, etc.) to improve compliance. ○ The Federal Attorney´s Office for Environmental Protection will monitor vehicle
production and apply sanctions. • From 2013 to 2032, the regulation is expected to reduce gasoline consumption by 112.8
billion liters, thereby avoiding 265 million tons of HC, CO2, and CO emissions, plus 546,000 tons of NOx and 88,000 tons of SO2. The expected benefits in health and averted deaths are valued at 26,818 million pesos [5].
10

Commentary • For light vehicles, one option for reform is to create “feebates,” charging those who pollute
above the limit and subsidizing those below the limit. This would favor cleaner technologies and create incentives for development.
• Lowering the cost of technological development would lower barriers to innovation and create incentives.
• Introducing financial incentives in banking markets could help close the gap between clean and dirty vehicle technologies.
11

Sources [1] US Energy Information Administration. (2013). Technically Recoverable Shale Oil and Shale Gas
Resources: An assessment of 137 Shale Formations in 41 Countries outside the United States. Washington, DC: EIA.
[2] Government of Mexico. (2013). National Development Plan 2013-2018. [3] Secretaría de Energía. (2013). Estrategía Nacional de Energía 2013-2027. México: SENER. [4] Centro Mario Molina. (2013). Sustainable Production of Shale Oil and Gas in Mexico. [5] Diario Oficial de la Federación. (2013). NORMA Oficial Mexicana NOM-163-SEMARNAT-ENER-
SCFI-2013, emissions of carbon dioxide (CO2) generated by the exhaust and its equivalence in terms of fuel efficiency, applicable to new motor vehicles of gross vehicle weight of up to 3 857 kg.
12