analyze bug statistics using kibana dashboard and get ... white paper describes how kibana dashboard...
TRANSCRIPT

White Paper | Analyze Bug Statistics using Kibana Dashboard and Get Voice Alerts
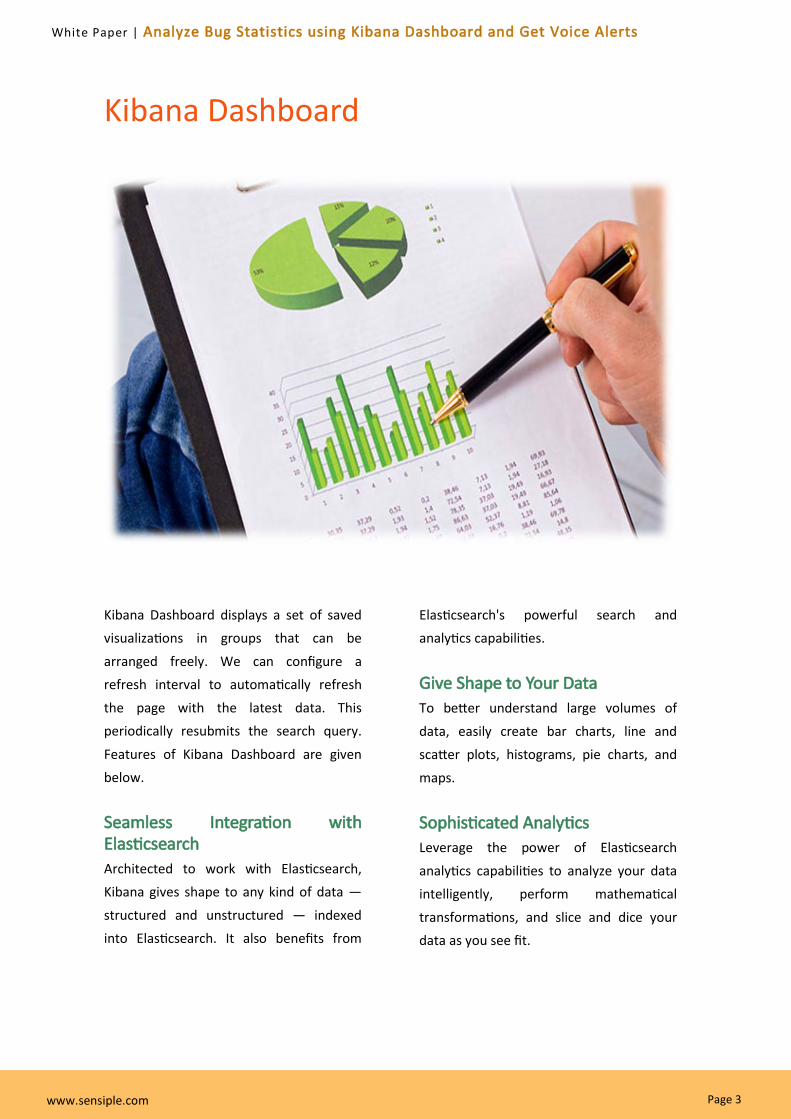
Kibana Dashboard
Elast Alert
Sensiple Notification System
Analyze Bug Statistics using Kibana
Dashboard and Get Voice Alerts

Page 2
White Paper | Analyze Bug Statistics using Kibana Dashboard and Get Voice Alerts
This white paper describes how Kibana
Dashboard can be used to analyze the bug
statistics of a Bug Tracking System (Mantis)
and how we can integrate ElastAlert and
get Voice Alerts for ‘immediate’ priority
bugs.
Abstract
At Sensiple, we are using the Mantis Bug
Tracking System for tracking the defects. It
helps to track the complete life cycle of a
defect. But, we are in need of a nice
dashboard to analyze these defects. The
dashboard should display the number of
defects logged so far, defects by status,
defects by severity, defects by priority,
defects aging details etc. At the same time,
the dashboard should be configurable so
that we can view the defects logged
recently (today / this week / this month/
this year). It should also automatically
refresh the dashboard for every ‘n’
minutes/seconds.
Apart from the dashboard, we are also in
need of a voice alert to the developer
when an ‘immediate’ priority ticket is
logged.
The Challenge
Page 3
White Paper | Analyze Bug Statistics using Kibana Dashboard and Get Voice Alerts
Kibana Dashboard displays a set of saved
visualizations in groups that can be
arranged freely. We can configure a
refresh interval to automatically refresh
the page with the latest data. This
periodically resubmits the search query.
Features of Kibana Dashboard are given
below.
Seamless Integration with Elasticsearch
Architected to work with Elasticsearch,
Kibana gives shape to any kind of data —
structured and unstructured — indexed
into Elasticsearch. It also benefits from
Elasticsearch's powerful search and
analytics capabilities.
Give Shape to Your Data
To better understand large volumes of
data, easily create bar charts, line and
scatter plots, histograms, pie charts, and
maps.
Sophisticated Analytics
Leverage the power of Elasticsearch
analytics capabilities to analyze your data
intelligently, perform mathematical
transformations, and slice and dice your
data as you see fit.
Kibana Dashboard
Page 4
White Paper | Analyze Bug Statistics using Kibana Dashboard and Get Voice Alerts
Empower more Team Members
Visualizing data in a powerful interface
empowers every line of business to make
practical use of your data collection.
Empower More Team Members
Visualizing data in a powerful interface
empowers every line of business to make
practical use of your data collection.
Flexible Interface, Easy to Share
Easily create, save, share, and embed your
visualized data for quick and smart
communication.
Easy Setup
Simple and friendly setup and startup.
Kibana 4 ships with its own web server to
help you get up and running quickly.
Visualize Data from Many Sources
Easily visualize data pushed into
Elasticsearch from Logstash, es-hadoop or
3rd party technologies like Apache Flume,
Fluentd, and many others.
Simple Data Export
Easily export interesting bits of data to
merge and meld with other data sets to
quickly prototype new analyses and
discover something new.
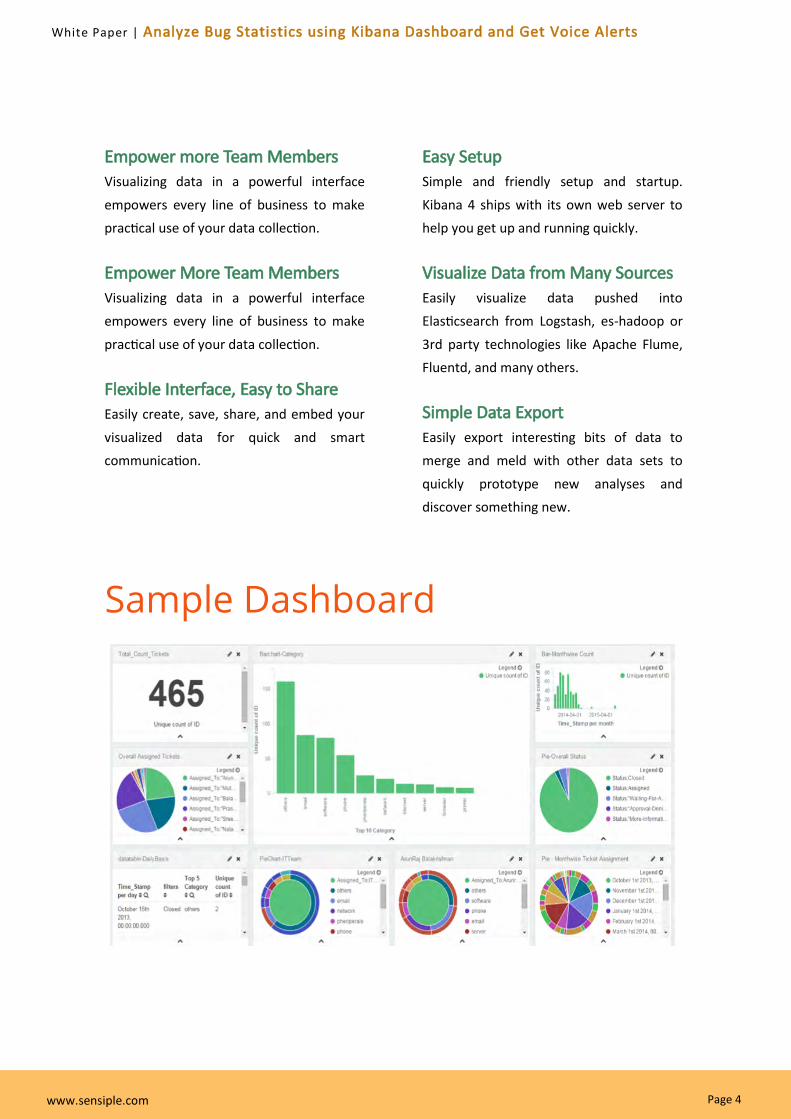
Sample Dashboard
Page 5
White Paper | Analyze Bug Statistics using Kibana Dashboard and Get Voice Alerts
ElastAlert is a simple framework for
alerting on anomalies, spikes, or other
patterns of interest from data in
Elasticsearch. If you have data being
written into Elasticsearch in near real time
and want to be alerted when that data
matches certain patterns, ElastAlert is the
tool for you. It works by combining
Elasticsearch with two types of
components, rule types and alerts.
Elasticsearch is periodically queried and the
data is passed to the rule type, which
determines when a match is found. When a
match occurs, it is given to one or more
alerts, which take action based on the
match. This is configured by a set of rules,
each of which defines a query, a rule type,
and a set of alerts.
Elast Alert
Rule Types
Rule Type Description
Any The any rule will match everything. Every hit that the query returns will generate an alert.
Blacklist The blacklist rule will check a certain field against a blacklist, and match if it is in the blacklist.
Whitelist Similar to blacklist, this rule will compare a certain field to a whitelist, and match if the list does
not contain the term.
Change This rule will monitor a certain field and match if that field changes. The field must change with
respect to the last event with the same query_key.
Frequency This rule matches when there are at least a certain number of events in a given time frame. This
may be counted on a per-query_key basis.
Spike
This rule matches when the volume of events during a given time period is spike_height times
larger or smaller than during the previous time period. It uses two sliding windows to compare the
current and reference frequency of events. We will call this two windows “reference” and
“current”.
Flatline This rule matches when the total number of events is under a given threshold for a time period.
new_term This rule matches when a new value appears in a field that has never been seen before. When
Elast Alert starts, it will use an aggregation query to gather all known terms for a list of fields.
Cardinality This rule matches when the total number of unique values for a certain field within a time frame is
higher or lower than a threshold.
Page 6
White Paper | Analyze Bug Statistics using Kibana Dashboard and Get Voice Alerts
Alert
Type Description
Command
The command alert allows you to execute an arbitrary command and pass arguments or stdin from
the match. Arguments to the command can use Python format string syntax to access parts of the
match. The alerter will open a subprocess and optionally pass the match, or matches in the case of
an aggregated alert, as a JSON array, to the stdin of the process
Email This alert will send an email. It connects to an smtp server located at smtp_host, or localhost by
default. If available, it will use STARTTLS.
Jira
The JIRA alerter will open a ticket on jira whenever an alert is triggered. You must have a service
account for ElastAlert to connect with. The credentials of the service account are loaded from a
separate file. The ticket number will be written to the alert pipeline, and if it is followed by an email
alerter, a link will be included in the email.
OpsGenie
OpsGenie alerter will create an alert which can be used to notify Operations people of issues or log
information. An OpsGenie API integration must be created in order to acquire the necessary opsge-
nie_key rule variable. Currently the OpsGenieAlerter only creates an alert, however it could be ex-
tended to update or close existing alerts. It is necessary for the user to create an OpsGenie Rest
HTTPS API integration page in order to create alerts.
Page 7
White Paper | Analyze Bug Statistics using Kibana Dashboard and Get Voice Alerts
Key Features
Voice, Email, SMS Notification.
Built for Multi-Tenancy.
Recipient details can be uploaded via FTP.
Supports both manual and system interfaces
for campaign creation and launch
Multiple Time-Zone support for launching
campaigns
Custom Calling Window Time - enables
campaign creator to define their own calling
window time to notify the recipients.
Dynamic Survey Campaign Creation &
Deployment.
Advanced Call Flow definition & deployment
for Voice enabled campaigns.
Pluggable Email & SMS Gateway service for
Tenants & Subtenants.
Static voice ports allocation for tenants.
Dynamic dashboard to monitor the
campaign status.
Tenants and Subtenants can Hold/Resume
their campaigns.
Provides Web Service / API for notification
SNS is a notification system developed by
Sensiple to facilitate sending mass
notifications to a list of recipients through
three types of communication channels,
namely, Voice, Email and SMS. SNS enables
the corporates or individuals to notify their
contacts about any type of Campaigns,
Invitations, Surveys, Disaster notification
etc.
Sensiple Notification System
Page 8
White Paper | Analyze Bug Statistics using Kibana Dashboard and Get Voice Alerts
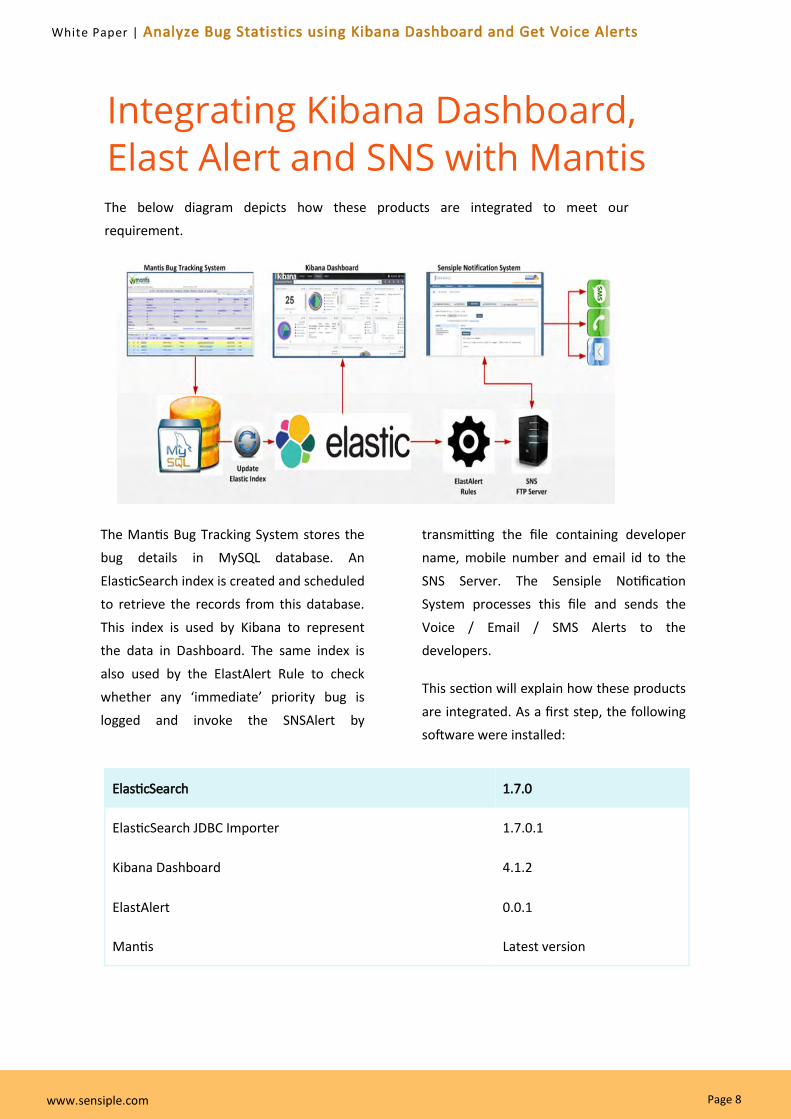
The Mantis Bug Tracking System stores the
bug details in MySQL database. An
ElasticSearch index is created and scheduled
to retrieve the records from this database.
This index is used by Kibana to represent
the data in Dashboard. The same index is
also used by the ElastAlert Rule to check
whether any ‘immediate’ priority bug is
logged and invoke the SNSAlert by
transmitting the file containing developer
name, mobile number and email id to the
SNS Server. The Sensiple Notification
System processes this file and sends the
Voice / Email / SMS Alerts to the
developers.
This section will explain how these products
are integrated. As a first step, the following
software were installed:
ElasticSearch 1.7.0
ElasticSearch JDBC Importer 1.7.0.1
Kibana Dashboard 4.1.2
ElastAlert 0.0.1
Mantis Latest version
Integrating Kibana Dashboard,
Elast Alert and SNS with Mantis The below diagram depicts how these products are integrated to meet our
requirement.
Page 9
White Paper | Analyze Bug Statistics using Kibana Dashboard and Get Voice Alerts
The high level configuration details for the above software are given below.
Mantis Configure Mantis user table to include mobile number of that user so that these details can
be sent to SNS for voice alerts.
ElasticSearch JDBC Importer
Specify the type of the importer and mention the database configuration details of MySQL
database which is connected to Mantis. This will act as the source for feeding the data to the
index.
Specify the Schedule details so that the importer can run and fetch the details from data-
base at the required interval.
Specify the SQL Statement so that it fetches the recently added/modified bug details from
the Mantis MySQL database
Kibana Dashboard Specify the Elasticsearch’s host and port details so that Kibana can connect to it for
generating dashboard
ElastAlert
Specify the Elasticsearch’s host and port details so that ElastAlert can connect to it and get
the index details.
Specify the Type of Alert (frequency, change etc.)
Specify the filter so that ElastAlert can raise the alert when the bug with “immediate”
priority is assigned.
Specify the alert to be raised so that it can send the details to SNS FTP Server
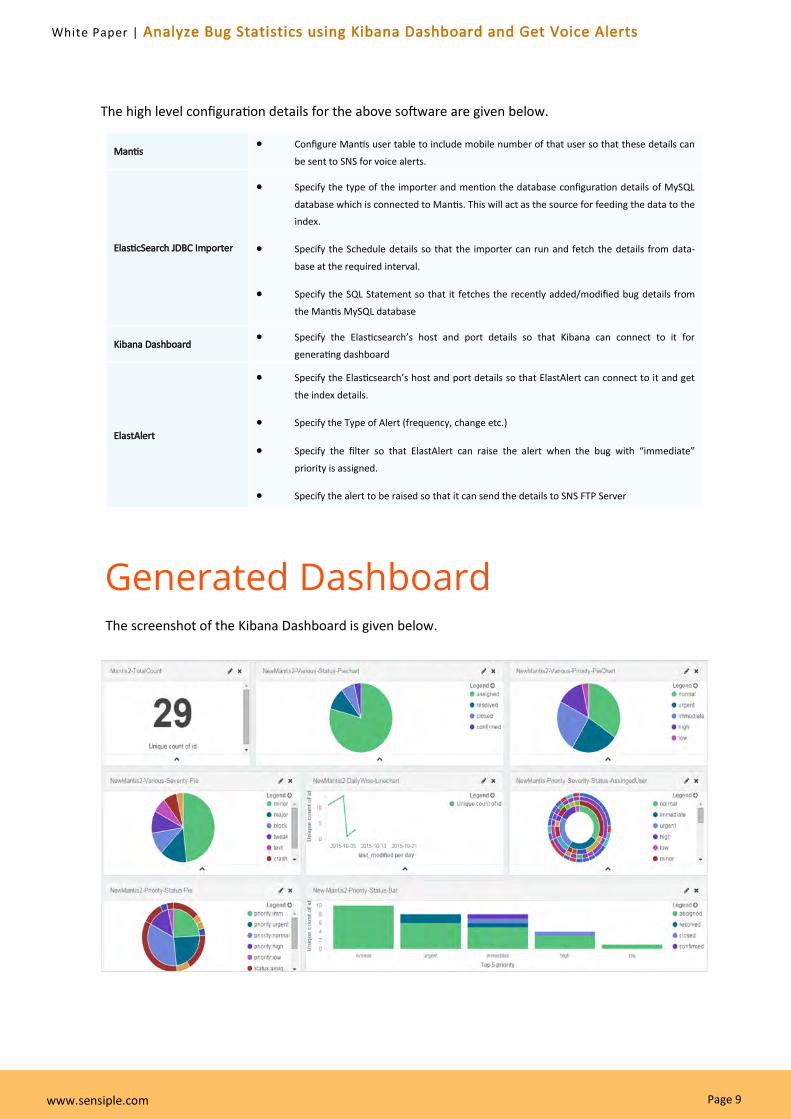
The screenshot of the Kibana Dashboard is given below.
Generated Dashboard
Page 10
White Paper | Analyze Bug Statistics using Kibana Dashboard and Get Voice Alerts
Conclusion
We have now configured the Kibana Dashboard to analyze the bug statistics of Mantis Bug
Tracking System. We have also integrated it with ElastAlert and SNS to get voice/sms/email
alert when ‘immediate’ priority ticket is logged.
Kibana Dashboards can be quickly developed to better understand the large volumes of data,
create bar charts, line and scatter plots, histograms, pie charts, and maps. The ElastAlert is a
simple framework for alerting on anomalies, spikes, or other patterns of interest from data in
Elasticsearch. It works by combining Elasticsearch with two types of components, rule types and
alerts. The SNS can be used for sending mass notifications to a list of recipients through three
types of communication channels, namely, Voice, Email and SMS.
Srinivasan N works as Head COE of Business Application Management
Services (BAMS) at Sensiple. He is an IT professional, with Masters in
Engineering and is TOGAF trained. He has 20+ years of experience in IT.
He has expertise in JAVA/J2EE/SOA/WEB Services. He has strong
expertise in all phases of SDLC, Process/Product Quality Management as
well as Team Management. He has worked in various business domains
including Healthcare, Trading, Insurance and Banking.
Others who contributed for this POC are:
Jayapriya - System Engineer at Sensiple
Anil Prabhu – Associate System Engineer at Sensiple
Mohammed Faizan – Trainee System Engineer at Sensiple
Mouni Babu - Associate System Engineer at Sensiple
Srinivasan N, Head CoE, SENSIPLE
Author

CORPORATE OFFICE
1000 Route 9 North, Suite 303 Woodbridge, NJ 07095
Phone : 732 283 0801
Fax : 732 283 0489, 732 283 3775
MIDWEST OFFICE
OFFSHORE OFFICE
Plot No: 9/A15, SIPCOT IT Park Padur Post
Siruseri, Tamilnadu 603 103 India
Phone : +91 44 4741 9000
Fax : +91 44 4741 9100
the proprietary rights of the trademarks and
in this document.
headquartered in the United States and with
delivery centers in India, SENSIPLE has extended
its services across the globe. SENSIPLE has
company in its early stages to a one stop IT
are Customer Experience, Digital Enterprise,
Infrastructure Services with clients across the
globe.
Aksarben Village,2111 South 67th Street, Suite 300Omaha, NE – 68106
Phone : 402 337 2921