pdc_2011_building smart without compromising efficiency
TRANSCRIPT

Building Smart Without
Compromising Efficiency

Presenters
Bill Seed, Staff Vice President,
Universal Health Services
Angela Lee, AIA, ACHA, LEED AP,
Senior Vice President, HKS
Debajyoti Pati, PhD, FIIA, LEED AP,
Vice President and Director of
Research, HKS

Acknowledgments
• Summerlin Hospital,
Las Vegas, NV
• Texoma Medical
Center, Denison, TX
• Rapid Modeling
Corporation
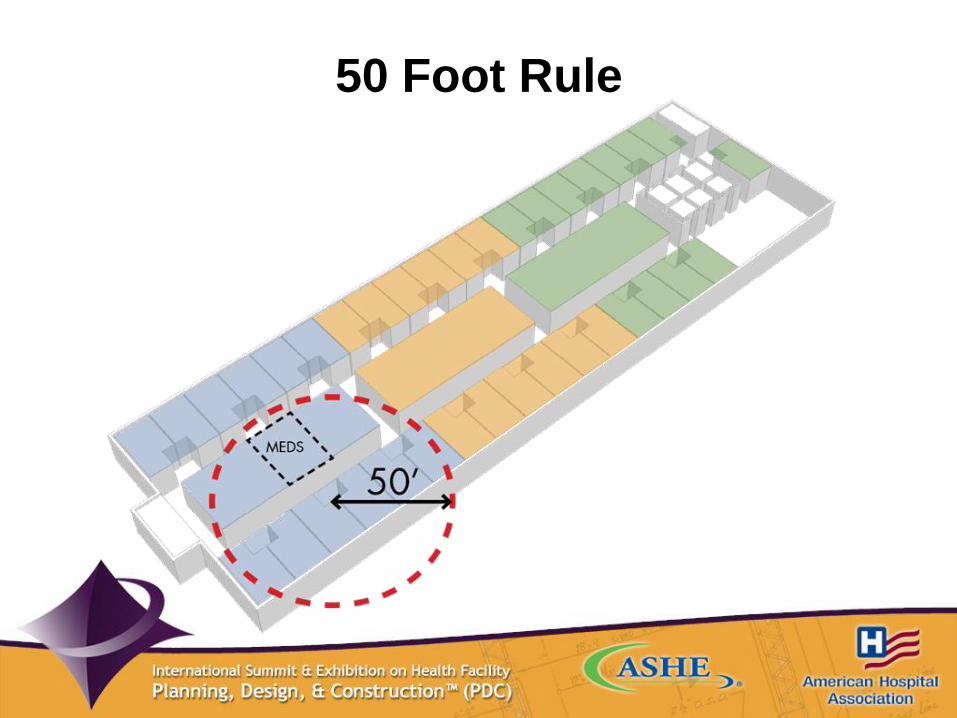
50 Foot Rule

CAN LARGER INPATIENT BED UNITS AND
EFFICIENT USE OF NURSING TIME GO
HAND IN HAND?
QUESTION

Larger Unit Implications
• (+) Staffing efficiency
• (-) Large floor plate
• (-) Distances
between destinations
– (-) Longer walking
distance
– (-) Time spent walking
Acute care units have increased in floor area by 118 percent over the past 20 years (KSA)

Implications of Walking
• System efficiency
– Unnecessary walking
= Waste
• Care quality
– Time away from
patients (patient-
centric care)
– Medication errors
• Individual
performance
– Interactions with
workplace stressors
– Alertness, stress,
fatigue

Private Vs. Semi-Private

Trend Towards Smaller Units

CAN LARGER INPATIENT BED UNITS AND
EFFICIENT USE OF NURSING TIME GO
HAND IN HAND?
QUESTION

The UHS-HKS Projects
• Guiding principles:
– Proximity of services
– Amenities for care
– Decentralized nurses’
station
– Computer logistics
by focusing on
the efficiency of
flow, one can
focus on patient-
centric care and
supply nurses
everything they
need without
walking long
distances

BY OPTIMIZING FLOW AND REDUCING
POTENTIAL WASTE, THE LARGE UNIT
WOULD NOT RESULT IN WALKING
DISTANCES THAT ARE SUBSTANTIALLY
HIGHER THAN NATIONAL BENCHMARK
HYPOTHESIS

BY OPTIMIZING FLOW AND REDUCING
POTENTIAL WASTE, HOW NURSES SPEND
THEIR TIME WOULD NOT CONSTITUTE AN
OUTLIER
HYPOTHESIS

Texoma Medical Center
Recognized up front, inpatient strategies can save time, money and promote better patient care.

Texoma Medical Center
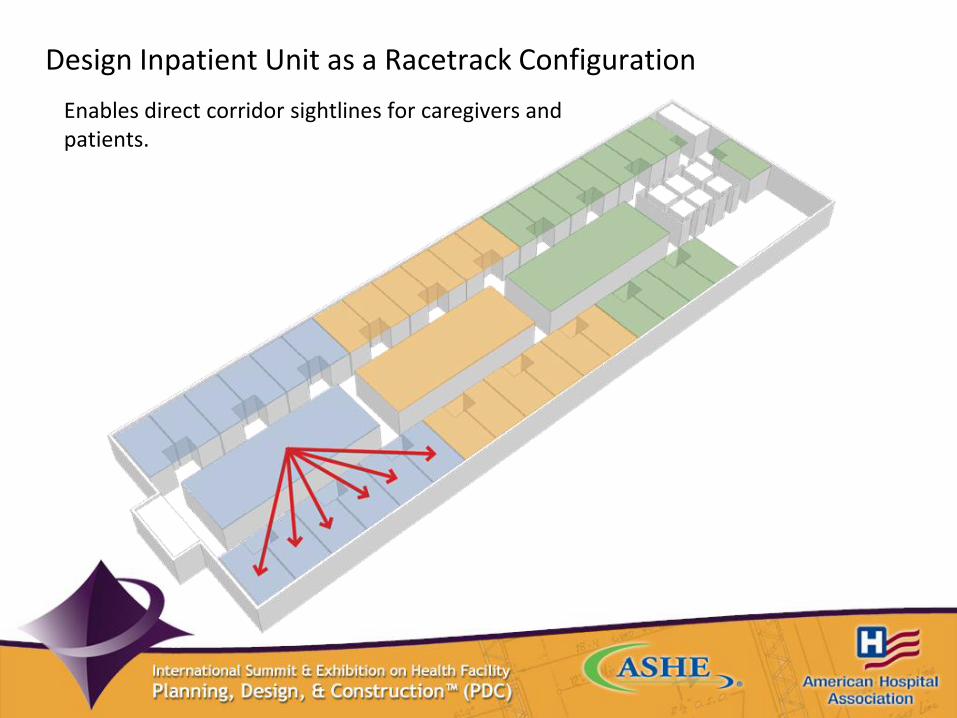
Use a racetrack configuration, which offers efficiency as well as easy wayfinding. The configuration provides the most efficient perimeter-to-core ratio and enables direct corridor sightlines for caregivers and patients. It also promotes separation of public and service areas.

Design Inpatient Unit as a Racetrack Configuration
Provides most efficient perimeter to core ratio.

Design Inpatient Unit as a Racetrack Configuration
Enables direct corridor sightlines for caregivers and patients.
Design Inpatient Unit as a Racetrack Configuration
Enables direct corridor sightlines for caregivers and patients.

Design Inpatient Unit as a Racetrack Configuration
Intermediate passages through the core reduce travel distances.

Design Inpatient Unit as a Racetrack Configuration
Lean/efficient double loaded corridors – Easy to Navigate

Summerlin Medical Center

A Patient Centered Expansion
Pinwheel design will minimize travel distances, promote patient safety, and maximize views from patient rooms.
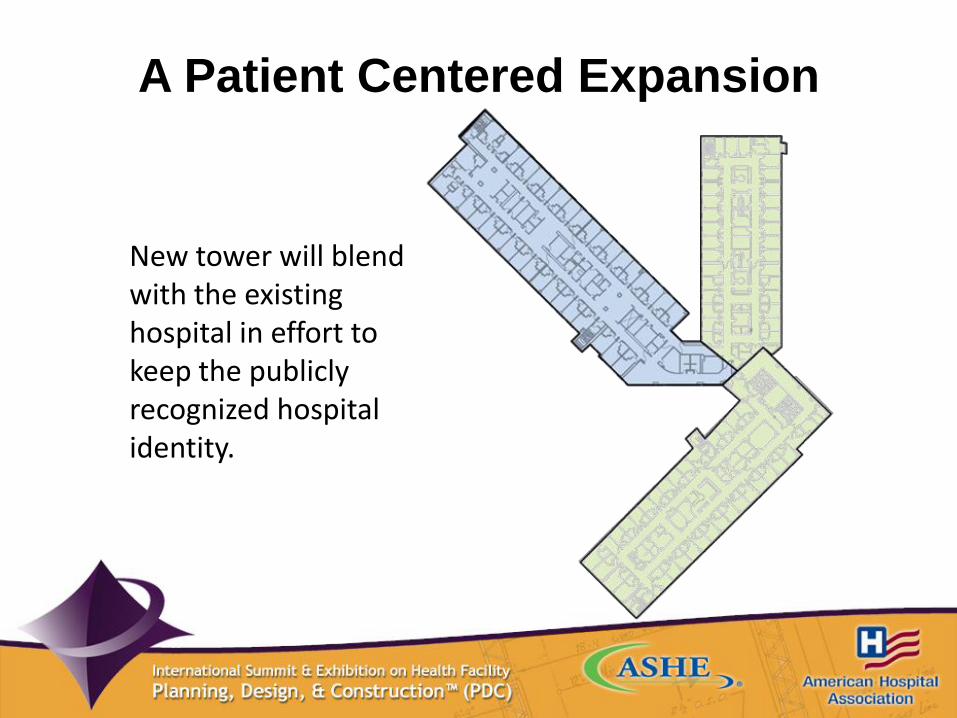
A Patient Centered Expansion
New tower will blend with the existing hospital in effort to keep the publicly recognized hospital identity.

A Patient Centered Expansion
$100 million expansion and renovation in one of southern Nevada’s fastest growing communities in Las Vegas, Nevada
All of the changes were made externally, with breaking through the connecting wall as a final step

Summerlin Medical Center

Summerlin Medical Center

DATA COLLECTION
POST OCCUPANCY PERFORMANCE

Time-Motion Data
• Rapid Modeling
Corporation’s
programmed Palm PDAs
• 1 week on each unit
• Summer 2010
• Compared with TCAB
Time Study RN national
database

Walking Data
• Sportline pedometer
• 1 week on each unit
• Summer 2010
• Compared with 36-
hospital time-motion
study*
*Hendrich, A., M. Chow, B.A. Skierczynski & Z. Lu. (2008). A 36-Hospital Time and Motion Study: How Do Medical-Surgical Nurses Spend Their Time? The Permanente Journal, 12(3), 25-34.

FINDINGS
POST OCCUPANCY PERFORMANCE

Time Data by Task Type
• Value adding:
– Comparison with
TCAB data
Proportion of time spent in value adding tasks: Minimum, Q1, Mean, Q3, Maximum
34.6%
59.1% 64.2% 68.0%
96.4%
59.8%59.5%TEXOMASUMMERLIN

Time Data by Task Type
• Non value adding
tasks:
– Comparison with
TCAB data
Proportion of time spent in non value adding tasks: Minimum, Q1, Mean, Q3, Maximum
0%
9.1% 11.5% 13.7%
33.9%
8.2% 10.5%TEXOMA SUMMERLIN

Time Data by Task Type
• Necessary tasks:
– Comparison with
TCAB data
Proportion of time spent in necessary tasks: Minimum, Q1, Mean, Q3, Maximum
2.6%
21.6% 24.2% 27.5%
50.0%
TEXOMASUMMERLIN32.0%30.0%

Time Data by Task Category
• Direct Care Time:
– Comparison with
TCAB data
Proportion of time spent in direct care: Minimum, Q1, Mean, Q3, Maximum
47.8%43.0%
91.5%15.7%
43.2% 48.3% 51.6%
TEXOMASUMMERLIN
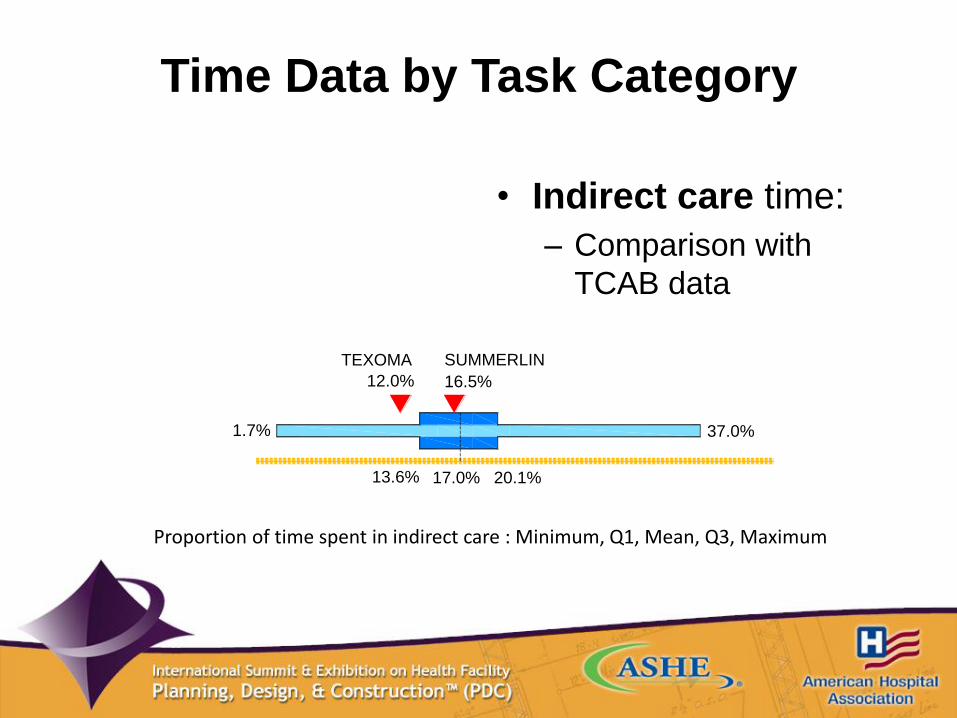
Time Data by Task Category
• Indirect care time:
– Comparison with
TCAB data
Proportion of time spent in indirect care : Minimum, Q1, Mean, Q3, Maximum
1.7%
13.6% 17.0% 20.1%
37.0%
12.0% 16.5%
TEXOMA SUMMERLIN

Time Data by Task Category
• Documentation:
– Comparison with
TCAB data
Proportion of time spent in documentation: Minimum, Q1, Mean, Q3, Maximum
1.6%
15.1% 18.0% 21.1%
38.5%
15.8%10.5%
TEXOMASUMMERLIN

Time Data by Task Category
• Administration:
– Comparison with
TCAB data
0% 19.2%
TEXOMA SUMMERLIN
16.0% 19.4%
3.2%5.2% 6.5%
Proportion of time spent in administration: Minimum, Q1, Mean, Q3, Maximum

Time Data by Task Category
• Personal:
– Comparison with
TCAB data
Proportion of time spent in personal work: Minimum, Q1, Mean, Q3, Maximum
0%
3.4% 4.5% 5.4%
16.9%
1.0% 2.1%TEXOMA SUMMERLIN

Time Data by Task Category
• Waste:
– Comparison with
TCAB data
Proportion of time wasted: Minimum, Q1, Mean, Q3, Maximum
0%
1.9% 2.9% 3.5%
9.8%
3.0%1.7%TEXOMASUMMERLIN

Time Data by Task Level
• Nurse station:
– Comparison with
TCAB data
Proportion of time spent in nurse station: Minimum, Q1, Mean, Q3, Maximum
0%
27.8% 36.1% 44.2%
89.9%
54.9%47.3%TEXOMASUMMERLIN

Time Data by Task Level
• Patient room:
– Comparison with
TCAB data
Proportion of time spent in patient room: Minimum, Q1, Mean, Q3, Maximum
3.8%
34.6% 40.7% 44.7%
80.7%
37.2%36.3%TEXOMASUMMERLIN

Time Data by Task Level
• Medication:
– Comparison with
TCAB data
Proportion of time spent in medication: Minimum, Q1, Mean, Q3, Maximum
0%
13.4% 16.8% 20.6%
45.6%
15.8% 17.3%
TEXOMA SUMMERLIN

Time Data by Task Level
• Off the unit:
– Comparison with
TCAB data
Proportion of time spent of the unit : Minimum, Q1, Mean, Q3, Maximum
0%
1.8% 3.3% 4.2%
22.0%
0.3% 0.8%TEXOMA SUMMERLIN

Walking Data
0 mile 1 mile 2 miles 3 miles 4 miles 5 miles
Day Shift Range
36-Hospital
Night Shift Range
36-Hospital
36-Hospital Study Individual Walking Distance Range
Day ShiftSummerlin
Night ShiftSummerlin
Night ShiftTexoma
Day ShiftTexoma

CONCLUSION

• The unit operations and efficiencies are
similar to the middle 50% of TCAB
participant hospitals.

• While retaining efficiencies in time
distribution across activities and walking
distances, the two units successfully
incorporated larger number of beds
while reducing construction costs.

• A healthcare provider can significantly
reduce construction costs but operate
with the same efficiencies.

• Integrated decision-making with a primary focus on the efficiencies of flow can be used to address the seemingly difficult task of achieving larger inpatient bed units as well as efficient use of caregiver time.