pd-1+ regulatory t cells amplified by pd-1 blockade ... · pd-1 blockade is a cancer immunotherapy...
TRANSCRIPT

PD-1+ regulatory T cells amplified by PD-1 blockadepromote hyperprogression of cancerTakahiro Kamadaa,b,1, Yosuke Togashia,1, Christopher Tayc,1, Danbee Hac, Akinori Sasakid, Yoshiaki Nakamurad,Eiichi Satoe, Shota Fukuokaa,d, Yasuko Tadaa, Atsushi Tanakac, Hiromasa Morikawac, Akihito Kawazoea,d,Takahiro Kinoshitaf, Kohei Shitarad, Shimon Sakaguchic,2, and Hiroyoshi Nishikawaa,b,2
aDivision of Cancer Immunology, Research Institute/Exploratory Oncology Research and Clinical Trial Center, National Cancer Center, 104-0045 Tokyo,Japan; bDepartment of Immunology, Nagoya University Graduate School of Medicine, 466-8550 Nagoya, Japan; cExperimental Immunology, ImmunologyFrontier Research Center, Osaka University, 565-0871 Osaka, Japan; dDepartment of Gastroenterology and Gastrointestinal Oncology, National CancerCenter Hospital East, 277-8577 Chiba, Japan; eDepartment of Pathology, Institute of Medical Science, Tokyo Medical University, 160-0023 Tokyo, Japan;and fDepartment of Surgical Oncology, National Cancer Center Hospital East, 277-8577 Chiba, Japan
Contributed by Shimon Sakaguchi, March 26, 2019 (sent for review December 28, 2018; reviewed by Kunle Odunsi and Eliane Piaggio)
PD-1 blockade is a cancer immunotherapy effective in various typesof cancer. In a fraction of treated patients, however, it causes rapidcancer progression called hyperprogressive disease (HPD). With ourobservation of HPD in ∼10% of anti–PD-1 monoclonal antibody(mAb)-treated advanced gastric cancer (GC) patients, we exploredhow anti–PD-1 mAb caused HPD in these patients and how HPDcould be treated and prevented. In the majority of GC patients,tumor-infiltrating FoxP3highCD45RA−CD4+ T cells [effector Treg(eTreg) cells], which were abundant and highly suppressive in tumors,expressed PD-1 at equivalent levels as tumor-infiltrating CD4+ orCD8+ effector/memory T cells and at much higher levels than cir-culating eTreg cells. Comparison of GC tissue samples before andafter anti–PD-1 mAb therapy revealed that the treatment mark-edly increased tumor-infiltrating proliferative (Ki67+) eTreg cells inHPD patients, contrasting with their reduction in non-HPD pa-tients. Functionally, circulating and tumor-infiltrating PD-1+ eTregcells were highly activated, showing higher expression of CTLA-4 than PD-1− eTreg cells. PD-1 blockade significantly enhanced invitro Treg cell suppressive activity. Similarly, in mice, genetic abla-tion or antibody-mediated blockade of PD-1 in Treg cells increasedtheir proliferation and suppression of antitumor immune responses.Taken together, PD-1 blockade may facilitate the proliferation ofhighly suppressive PD-1+ eTreg cells in HPDs, resulting in inhibitionof antitumor immunity. The presence of actively proliferating PD-1+
eTreg cells in tumors is therefore a reliable marker for HPD. Deple-tion of eTreg cells in tumor tissues would be effective in treatingand preventing HPD in PD-1 blockade cancer immunotherapy.
regulatory T cells | PD-1 | hyperprogressive disease |immune-checkpoint blockade
Cancer immunotherapy represented by immune checkpointblockade (ICB) such as anti–CTLA-4 and anti–PD-1 mono-
clonal antibodies (mAbs) instigates cytotoxic CD8+ T lympho-cytes (CTLs) to kill cancer cells (1, 2). ICB has shown clinicalefficacy in multiple cancer types and even in patients with ad-vanced stages of cancer (3–5). However, the therapeutic efficacyof ICB is currently limited to 15–30% of treated cancer patients.More importantly, rapid disease progression [known as hyper-progressive disease (HPD)], rather than cancer regression, hasbeen reported recently in certain cancer patients treated withanti–PD-1 mAb (6–8). To make ICB safer and more effective forcancer immunotherapy, the mechanism of HPD needs to beelucidated.Regulatory T (Treg) cells are an immunosuppressive subset of
CD4+ T cells, characterized by specific expression of the tran-scription factor forkhead box protein P3 (FoxP3) (9–14). Theyare abundant in tumor tissues, and there is accumulating evi-dence that FoxP3+ Treg cells, among various types of immunosup-pressive cells in tumor tissues, play key roles in hindering effectiveantitumor immunity in cancer patients (14–19). In addition, there areobservations that, among tumor-infiltrating lymphocytes (TILs), not
only activated and exhausted CD4+ and CD8+ T cells, but also afraction of Treg cells express PD-1 (20–25). Whereas the clinicalefficacy of PD-1 blockade has been attributed to its augmentationof effector functions of tumor-infiltrating T cells, especially CTLs,possible effects of PD-1 blockade on PD-1–expressing Treg cells intumor tissues remain unknown (1, 2).FoxP3+ T cells in humans are heterogeneous in function (14).
They comprise suppressive Treg cells and nonsuppressive con-ventional T (Tconv) cells, as human naive CD4+ T cells transientlyup-regulate FoxP3 expression upon T cell receptor (TCR) stim-ulation (26). Accordingly, human FoxP3+CD4+ T cell populationcan be fractionated into the following three subsets based on the
Significance
PD-1 blockade is a cancer immunotherapy effective in varioustypes of cancer. However, we observed rapid cancer progression,called hyperprogressive disease (HPD), in ∼10% of advancedgastric cancer patients treated with anti–PD-1 monoclonal anti-body. Tumors of HPD patients possessed highly proliferatingFoxP3+ Treg cells after treatment, contrasting with their reductionin non-HPD tumors. In vitro PD-1 blockade augmented pro-liferation and suppressive activity of human Treg cells. Likewise,murine Treg cells that were deficient in PD-1 signaling were moreproliferative and immunosuppressive. Thus, HPD may occur whenPD-1 blockade activates and expands tumor-infiltrating PD-1+ Tregcells to overwhelm tumor-reactive PD-1+ effector T cells. Depletionof the former may therefore help treat and prevent HPD.
Author contributions: Y. Togashi, K.S., S.S., and H.N. designed research; T. Kamada,Y. Togashi, C.T., D.H., E.S., S.F., Y. Tada, A.T., and H.M. performed research; T. Kamada,Y. Togashi, C.T., D.H., A.S., Y.N., E.S., S.F., Y. Tada, A.T., A.K., T. Kinoshita, K.S., S.S.,and H.N. analyzed data; A.S., Y.N., A.K., T. Kinoshita, and K.S. obtained clinical samplesand data; H.M. generated PD-1 floxed mice; and T. Kamada, Y. Togashi, C.T., K.S., S.S., andH.N. wrote the paper.
Reviewers: K.O., Roswell Park Cancer Institute; and E.P., Institut Curie.
Conflict of interest statement: The Sponsor declares a conflict of interest. Y. Togashi hasreceived honoraria and grants from Ono Pharmaceutical as to this work, honoraria andgrants from Bristol-Myers Squibb and AstraZeneca, and honoraria from Chugai Pharma-ceutical and Merck Sharp & Dohme (MSD) outside of this study. K.S. received honorariaand grants from Ono Pharmaceutical and Bristol-Myers Squibb and grants from MSDoutside of this study. H.N. received honoraria and grants from Ono Pharmaceutical asto this work, honoraria and grants from Bristol-Myers Squibb and Chugai Pharmaceutical,and grants from Taiho Pharmaceutical, Daiichi-Sankyo, Kyowa-Hakko Kirin, Zenyaku Kogyo,Astellas Pharmaceutical, Sysmex, and BD Japan outside of this study. Other authors declareno competing financial interests.
This open access article is distributed under Creative Commons Attribution-NonCommercial-NoDerivatives License 4.0 (CC BY-NC-ND).1T. Kamada, Y. Togashi, and C.T. contributed equally to this work.2To whom correspondence may be addressed. Email: [email protected] [email protected].
This article contains supporting information online at www.pnas.org/lookup/suppl/doi:10.1073/pnas.1822001116/-/DCSupplemental.
Published online April 26, 2019.
www.pnas.org/cgi/doi/10.1073/pnas.1822001116 PNAS | May 14, 2019 | vol. 116 | no. 20 | 9999–10008
IMMUNOLO
GYAND
INFLAMMATION
Dow
nloa
ded
by g
uest
on
June
7, 2
020

expression levels of the naive T cell marker CD45RA and FoxP3or CD25 (14, 18, 19, 27): Fraction (Fr) I naive Treg cells(CD45RA+CD25lowFoxP3lowCD4+); Fr. II effector Treg(eTreg) cells (CD45RA–CD25highFoxP3highCD4+); and Fr. IIInon-Treg cells (CD45RA–CD25lowFoxP3lowCD4+). Fr. II eTreg cells,which highly express CTLA-4, are the predominant tumor-infiltratingFoxP3+CD4+ T cells in the majority of cancers (14, 18, 19, 28).In this study, we have determined the Treg cell fraction in the
tumor and the peripheral blood that expresses PD-1 and exam-ined the effects of PD-1 blockade on FoxP3+ Treg cells in vitroand in vivo, in humans and mice. In particular, we have examinedHPD in gastric cancer (GC) patients during anti–PD-1 mAbtherapy by analyzing tumor samples obtained by biopsy beforeand after therapy. We have found that PD-1 blockade or defi-ciency enhances proliferation and immunosuppressive activity ofPD-1+ Treg cells in humans and mice. Our results indicate a keyrole of PD-1+ eTreg cells in HPD development and suggest thatdepletion of Treg cells in tumor tissues could be effective intreating HPD during anti–PD-1 mAb therapy.
ResultsHPDs Are Observed in ∼10% of Advanced GC Patients Treated withAnti–PD-1 mAb. Thirty-six patients with advanced GC who re-ceived anti–PD-1 mAb (nivolumab) from October to December2017 were enrolled in this study (SI Appendix, Table S1). Nineand 10 patients achieved partial responses (PR) and stable dis-eases (SD), respectively, by anti–PD-1 mAb treatment at the firstevaluation 4–6 wk after starting the treatment. Among 17 patientswith progressive diseases (PD), four patients (11.1% of 36 pa-tients) were diagnosed as HPD during anti–PD-1 mAb treatment(Fig. 1A and SI Appendix, Table S1). HPD was defined as pre-viously reported (6): time-to-treatment failure <2 mo, >50% in-crease in tumor burden compared with pretreatment imaging,and >twofold increase in progression speed. Despite good per-formance status (PS) before the treatment, three HPD patientsdied of tumor progression within a very short period (20–65 d)after the initial administration of anti–PD-1 mAb (SI Appendix,Table S2). Most HPD patients (three among four cases) sufferedfrom multiple metastatic lesions especially in the liver (SI Ap-pendix, Table S1).In 21 patients among 36 GC patients, formalin-fixed paraffin-
embedded (FFPE) samples at pretreatment were available forgenome analyses and subjected to next-generation sequencing(SI Appendix, Table S3). As summarized for genomic features ofthe patients in SI Appendix, Fig. S1 and Tables S2 and S4, oneHPD patient possessed MDM2 gene amplification as reported inother types of cancer (case 3 in SI Appendix, Table S2) (7), whileno patients without HPD had the MDM2 gene family alteration(SI Appendix, Fig. S1). Other genetic changes found in HPDpatients (such as ERBB2 amplification, KRAS amplification, TP53mutation, and PIK3CA mutation) were also detected in non-HPDpatients (SI Appendix, Fig. S1), suggesting that these mutationswere unlikely to be specifically involved in HPD.
eTreg Cells in TILs Highly Express PD-1. The lack of common geneticalterations in HPD prompted us to examine immune responsesin HPD patients. Paired (pre- and posttreatment) fresh tumorsamples were obtained from 14 (2 HPD and 12 non-HPD) pa-tients among 36 GC patients for phenotypic and functionalanalyses of Treg cells in TILs. While Fr. II eTreg cells were moreabundant in TILs compared with peripheral blood mononuclearcells (PBMCs), there was no significant difference between HPDand non-HPD patients in eTreg cell frequency in TILs andPBMCs (Fig. 1 B and C). Notably, Fr. II eTreg cells and also Fr.III cells in HPD and non-HPD patients highly expressed PD-1 ata comparable level as effector/memory CD45RA−FoxP3−CD4+
TILs, which could be further dissected into the CD25+ (Fr. IV)and the CD25− (Fr. V) populations (Fig. 1 D and E) (27). The
PD-1 expression levels of Fr. II TILs were also comparable withthose of central memory (CM) or effector memory (EM) typeCD8+ TILs. Thus, eTreg cells, which expressed PD-1 as highly aseffector CD8+ and CD4+ T cells, would likely be targeted byanti–PD-1 mAb, particularly in tumor tissues.
Frequency of Proliferating (Ki67+) eTreg Cells Is Increased in TILs ofHPD Patients and Decreased in Non-HPD Patients After Anti–PD-1 mAb Treatment. To address in vivo effect of PD-1 blockadeon Treg cells, we examined the changes in the ratio of immunecells, particularly eTreg cells, in TILs from HPD patients beforeanti–PD-1 mAb treatment and at first evaluation 4–6 wk afterstarting the treatment (Fig. 2 and SI Appendix, Fig. S2). Thekinetics of eTreg cell frequency in TILs was variable in patientswith or without HPD (Fig. 2A). While HPD patients did notshow significant changes in the ratio of eTreg cells to CD8+
T cells in TILs after anti–PD-1 treatment, non-HPD patientsexhibited significant decrease in the ratio (Fig. 2A). The frequencyof PD-1+, CTLA-4+, or Ki67+ eTreg cells in HPD patients’ TILsbefore treatment was not significantly different from non-HPDpatients’ TILs (SI Appendix, Fig. S2). Notably, however, the fre-quency of Ki67+ eTreg cells in TILs was increased, albeit notsignificantly, during anti–PD-1 mAb treatment in HPD patients,contrasting with the significant decrease in non-HPD patients (Fig.2B). We also measured the ratio of Ki67+ eTreg cells to Ki67+CD8+
T cells in TILs and found that it was reduced in the non-HPD groupafter treatment while remaining unchanged in the HPD group (SIAppendix, Fig. S3). In one HPD patient without MDM2 gene al-teration (case 1 in SI Appendix, Table S2), the frequency of Ki67+
eTreg cells in the tumor was markedly higher after treatment. Im-munohistochemistry confirmed the presence of a larger numberof Foxp3+CD4+ T cells in posttreatment tumor compared withpretreatment tumor (Fig. 2 B and C). These results collectivelyindicate that HPD would likely occur when CD8+ T cells are notdominant over eTreg cells in tumor tissues and that the domi-nance is dependent on the proliferative response of eTreg cellsrather than CD8+ T cells to anti–PD-1 therapy.
PD-1+ eTreg Cells Are Higher in CTLA-4 Expression and More Proliferativethan PD-1− eTreg Cells. We then investigated the activation status ofPD-1+ and PD-1− eTreg cells in TILs. CTLA-4, a key molecule forTreg-mediated suppression (29, 30), was expressed at higher levels byeTreg cells in TILs compared with PBMCs, and the expression washigher in PD-1+ eTreg cells than PD-1− ones (Fig. 3 A and B). Inaddition, Ki67 expression was much higher in PD-1+ eTreg cells com-pared with PD-1− eTreg cells in PBMCs (Fig. 3 A and B). Collectively,PD-1+ eTreg cells in TILs were actively proliferating and appeared to bepotently immunosuppressive as indicated by high CTLA-4 expression.
Anti–PD-1 mAb Augments Treg Cell-Mediated ImmunosuppressiveActivity in Vitro. Since both TCR and CD28 signals, which areinhibited by PD-1, play crucial roles in Treg cell maintenanceand immunosuppressive function (31–33), we examined whetherPD-1 blockade could enhance Treg cell-mediated immunosup-pressive function. We first analyzed proliferative capacity of carbox-yfluorescein diacetate succinimidyl ester (CFSE) labeled CD8+ T cellscultured with or without PD-1+CD45RA−CD25highCD4+ T cells(eTreg cells) in the presence of anti-CD3 mAb and antigen-presenting cells (APCs) (SI Appendix, Fig. S4). While re-sponder CD8+ T cells (Tresp cells) vigorously proliferated in theabsence of eTreg cells, the proliferation of Tresp cells was sig-nificantly suppressed by eTreg cells. Addition of anti–PD-1 mAbto the cell culture further augmented the suppression mediatedby eTreg cells (Fig. 4 A and B). In addition, anti–PD-1 mAbtreatment significantly increased Ki67 expression by PD-1+
eTreg cells (Fig. 4C). This was validated by PD-L1 Fc Ig, whichsignificantly decreased the proliferation of PD-1+ eTreg cells,but not PD-1− eTreg cells. The proliferation was restored with
10000 | www.pnas.org/cgi/doi/10.1073/pnas.1822001116 Kamada et al.
Dow
nloa
ded
by g
uest
on
June
7, 2
020

A Pre-treatment HPD at 1st evaluation3rd line:
Irinotecan+
ramucirumab
4th line: Nivolumab
2 doses
+55 days-70 days -10 days +36 days
TILs
CD4+ T cells CD8+ T cells
PBMCs
CD4+ T cells CD8+ T cellsB
FoxP3
CD
45R
A
0 103 104
CD45RA
CC
R7
0 103 104 105 0 103 104 0 103 104 105
0.2 0.2
61.0 5.5 33.1
I
IIIIIIV, V
VI
EM
NaiveCM
TEMRA96.3 1.1
0.12.5 51.2 1.9
1.33.841.8
2.7 32.6
34.7 30.0
CD45RA
CC
R7
FoxP3C
D45
RA
TILs PBMCs
P < 0.01
n.s.
n.s.
HPD
C
P < 0.01
P < 0.01
P < 0.01
P < 0.01
P < 0.01
P < 0.01
TILs PBMCs
P < 0.05
P < 0.05
TILs PBMCs
HPDNon-HPD
E CD8+ T cellsCD4+ T cells
D
PD-1
% o
f Max
TILsPBMCsIsotype
CD4+ T cells
0 103 104 105
Fr.II Fr.IIIFr.I
Fr.IV, V Fr.VI
CD8+ T cells
CM Naive
EM TEMRA
100
80
60
40
20
0
0 103 104 105 0 103 104 105 0 103 104 105
% o
f Max
100
80
60
40
20
0
103
104
105
0
103
104
0
103
104
105
0
103
104
0
Fig. 1. Clinical course of an HPD patient and PD-1 expression by various T cell fractions in tumors and the periphery. (A) Clinical course of an HPD patient. A73-y-old male with an MDM2 amplification (case 3 in SI Appendix, Table S2) received anti–PD-1 mAb (nivolumab) as fourth-line treatment. After two doses ofanti–PD-1 mAb, his performance status became poor, and the computed tomography showed rapid disease progression diagnosed as HPD. Fifty-five daysafter the initial administration of anti–PD-1 mAb, he died of tumor progression. (B) TILs and PBMCs collected from 14 GC patients before anti–PD-1 mAbtreatment were subjected to flow cytometry. Representative flow cytometry plots of CD4+ T cells (CD45RA and FoxP3) and CD8+ T cells (CCR7 and CD45RA) areshown. (C) Frequency of CD45RA−FoxP3highCD4+ eTreg cells in 14 GC patients. (D and E) PD-1 expression by each CD4+ and CD8+ T cell fraction. TILs andPBMCs collected from 14 GC patients before anti–PD-1 mAb treatment were subjected to flow cytometry. Representative flow cytometry staining for PD-1 byeach CD4+ and CD8+ T cell fraction. Red, TILs; blue, PBMCs; gray, isotype control (D). Summary of PD-1 expression by each CD4+ and CD8+ T cell fraction in 14GC patients (E). Red circle, HPD patients; black circle, non-HPD patients; naive (CCR7+CD45RA+); CM, central memory (CCR7+CD45RA−); EM, effector memory(CCR7−CD45RA−); TEMRA, terminally differentiated effector memory (CCR7−CD45RA+).
Kamada et al. PNAS | May 14, 2019 | vol. 116 | no. 20 | 10001
IMMUNOLO
GYAND
INFLAMMATION
Dow
nloa
ded
by g
uest
on
June
7, 2
020

further addition of anti–PD-1 mAb (Fig. 4D). These findingscollectively indicate that PD-1 expressed by eTreg cells can be anegative regulator of Treg cell-mediated immunosuppressive func-tion and Treg cell proliferation and that PD-1 blockade augmentsimmunosuppressive activity and proliferation of eTreg cells.
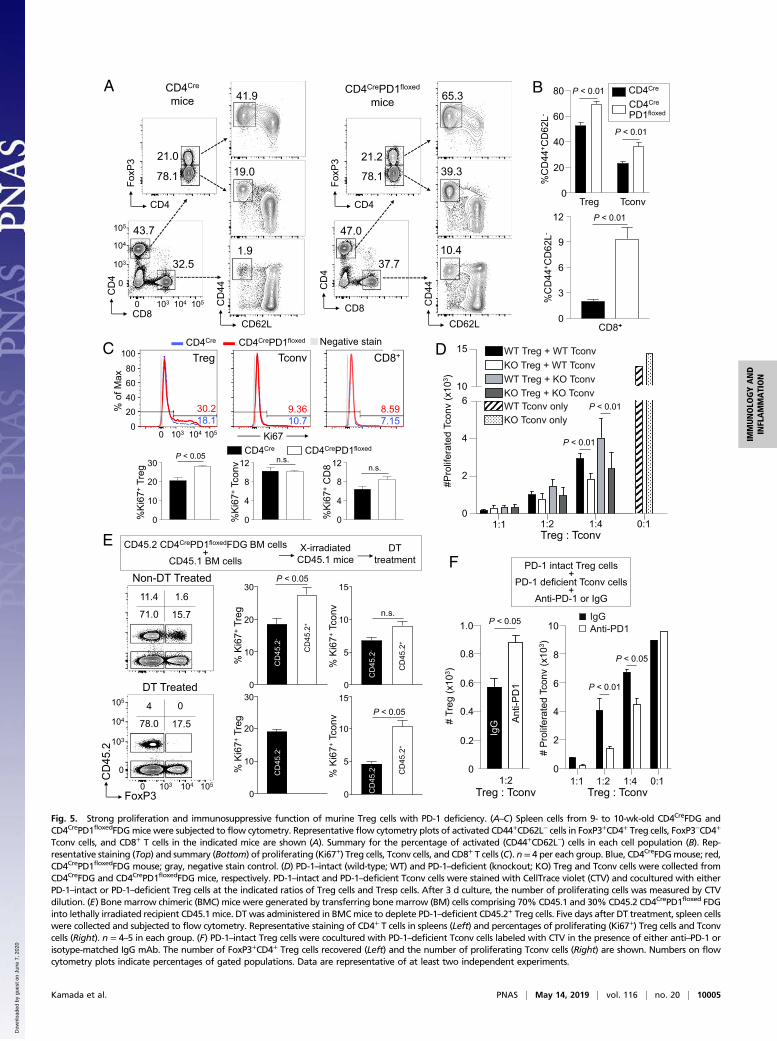
PD-1–Deficient Treg Cells Are Highly Proliferative and Immunosuppressivein Mice. To confirm the above findings in humans, we in-vestigated the role of PD-1 in Treg cells by generatingCD4CrePD1floxedFoxP3IRES-DTR-GFP (FDG) mice with T cell-specificPD-1 deficiency (SI Appendix, Fig. S5). While CD4CrePD1floxedFDGand control CD4CreFDG mice had comparable frequencies ofTreg cells, FoxP3−CD4+ (Tconv), and CD8+ T cells, the formerpossessed higher proportions of activated CD44+CD62L− cellsin the various T cell populations, although they did not manifestdiscernable autoimmunity (Fig. 5 A and B). Interestingly, onlyKi67+ Treg cells, but not Ki67+ Tconv cells and CD8+ T cells,were significantly increased in CD4CrePD1floxedFDG mice com-pared with CD4CreFDG mice (Fig. 5C). Given that Treg cells arehighly dependent on basal TCR signaling to proliferate (33, 34)and possess a higher frequency of Ki67+ self-renewing cells thanCD4+ Tconv or CD8+ T cells at steady state (27), it is likely thatstronger TCR signaling due to PD-1 deficiency readily augmentsTreg cell proliferation.
We next addressed whether the lack of increase in Ki67+
Tconv cells in CD4CrePD1floxedFDG mice was due to enhancedimmunosuppressive function of PD-1–deficient Treg cells. Toassess this possibility, we compared immunosuppressive functionof PD-1–intact and PD-1–deficient Treg cells by in vitro sup-pression assay. The results showed that PD-1–deficient Treg cellswere more suppressive against the proliferation of Tconv cells fromeither CD4CreFDG or CD4CrePD1floxedFDG mice (Fig. 5D). It isthus possible that in CD4CrePD1floxedFDG mice, enhanced immu-nosuppression by PD-1–deficient Treg cells suffices to preventproliferation of PD-1–deficient Tconv cells.We further sought to exclude any extrinsic effects of PD-
1 deficiency on the proliferation of Treg cells because PD-1–deficient mice are known to be prone to autoimmunity. To thisend, we transferred bone marrow (BM) cells composed of 70%CD45.1 wild-type (WT)mice and 30%CD45.2 CD4CrePD1floxedFDGmice into lethally irradiated CD45.1 host mice. Consistent withour observations above, CD45.2+ PD-1–deficient Treg cells hadincreased Ki67 expression compared with CD45.2− PD-1–intactTreg cells (Fig. 5E, Top). No significant difference in Ki67 ex-pression was observed between CD45.2+ PD-1–deficient Tconv cellsand CD45.2− PD-1–intact Tconv cells. To determine the impor-tance of PD-1–deficient Treg cells in suppressing PD-1–deficientTconv cells, we administered diphtheria toxin (DT) in the bone
Anti-PD-1mAb
Red: FoxP3Green: CD4Blue: DAPI
Pre-treatmentPost-treatment at 1st
evaluation (HPD)C
A
B
n.s.n.s.HPD non-HPD
P < 0.01n.s.HPD non-HPD
P < 0.01n.s.HPD Non-HPD
Pre-treatment(TILs)
PRat 1st evaluation
(TILs)
0 103 104
FoxP3
CD
45R
A 9.3
0.1
50.4
0.1
45.514.4
Pre-treatment (TILs)Post-treatment at 1st
evaluation (TILs)
HPD25.9% 40.2%
21.1% 11.2%
0 103 104
Ki670 103 104
Ki67
Non-HPD(SD)
10080604020 0
% o
f Max
10080604020 0
103
104
0
Fig. 2. Immunological features of HPD patients. (Aand B) TILs and PBMCs collected from 14 GC patientsbefore and after anti–PD-1 mAb treatment weresubjected to flow cytometry. (A, Left) Representativeflow cytometry plots for eTreg cells of kinetic changesof eTreg cells in TILs from pretreatment to first eval-uation. (A, Right) Summaries of kinetic changes ofeTreg cells in two HPD patients and 12 non-HPD patients.(B, Left) Representative staining of Ki67 by eTregcells in TILs of kinetic changes from pretreatment tofirst evaluation. Black, anti–PD-1 mAb (−); red, anti–PD-1 mAb (+); gray, isotype control. (B, Right) Sum-mary of kinetic changes of Ki67+ eTreg cells in twoHPD patients and 12 non-HPD patients. One patientwho experienced HPD without any MDM2 gene al-terations had very high Ki67+ eTreg cell infiltrationat HPD state (an arrowhead; case 1 in SI Appendix,Table S2). n.s., not significant. (C) FFPE slides of case1 before and after treatment were subjected to im-munohistochemical staining of tumor-infiltratingTreg cells.
10002 | www.pnas.org/cgi/doi/10.1073/pnas.1822001116 Kamada et al.
Dow
nloa
ded
by g
uest
on
June
7, 2
020

marrow chimeric (BMC) mice to deplete CD45.2+ PD-1–deficientTreg cells. This gave rise to an increase in Ki67+ PD-1–deficientCD45.2+ Tconv cells compared with PD-1–intact CD45.2− Tconvcells (Fig. 5E, Bottom). The latter was likely to be still suppressed byCD45.2− PD-1–intact Treg cells, which remained constant in fre-quency (15.7% in non–DT-treated and 17.5% in DT-treated) butwere less efficient in suppressing PD-1–deficient Tconv cells, asshown in the in vitro suppression assay in Fig. 5D.In addition, to confirm the role of PD-1 in Treg cells, we ex-
amined whether blocking PD-1 signaling with anti–PD-1 mAbwould increase Treg cell immunosuppressive function in vitro.In the in vitro suppression assay containing PD-1–deficientTconv cells, PD-1–intact Treg cells, and anti–PD-1 mAb, PD-1 blockade on Treg cells not only increased their numbers butalso resulted in greater suppression of PD-1–deficient Tconv cellproliferation (Fig. 5F).Collectively, these results indicate that PD-1 deficiency or
blockade in Treg cells augments their proliferation and immu-nosuppressive activity in vivo and in vitro and renders them amemory/effector phenotype in vivo.
PD-1–Deficient Treg Cells Potently Suppress Antitumor Response byPD–1–Deficient Effector T Cells and Promote Tumor Growth in Mice.We next assessed the effects of Treg-specific PD-1 deficiency orblockade on antitumor immune responses in mice. With B16F0murine melanoma model, we found that the majority of tumor-infiltrating Treg cells expressed PD-1 as high as Tconv cells andCD8+ T cells. Along with the high PD-1 expression, tumor-infiltrating Treg cells were also highly Ki67-positive (Fig. 6A).We then examined antitumor activity of PD-1–deficient ef-
fector T cells by transferring spleen cells from either CD4CreFDGor CD4CrePD1floxedFDG mice into lympho-depleted mice, whichwere injected s.c. with B16F0 melanoma cells. Three days later,transferred FDG Treg cells were depleted by administering DT.Whereas tumor development did not differ significantly between thetwo groups without DT treatment, tumors were markedly reduced inthe DT-treated CD4CrePD1floxedFDG group, indicating that PD-1–
deficient effector T cells possess stronger antitumor activity thanPD-1–intact ones upon Treg cell depletion (SI Appendix, Fig. S6).We next assessed whether PD-1 deficiency in Treg cells would
enhance their ability to suppress in vivo antitumor responses inlympho-depleted mice transferred with PD-1–deficient or PD-1–intact Treg cells. Since PD-1–deficient and PD-1–intact Tregcells differ in their proportions of activated cells, we collectedCD44−CD62L+ naive Treg cells from either FoxP3IRES-Cre orFoxP3IRES-CrePD1floxed mice to ensure that any effect would resultfrom only the intrinsic deficiency of PD-1 in Treg cells. FoxP3IRES-Cre
or FoxP3IRES-CrePD1floxed Treg cells were cotransferred withCD4CrePD1floxedFDG spleen cells into lympho-depleted (6-Gy–irradiated) mice (Fig. 6B). All recipient mice received sub-cutaneous injection of B16F0 melanoma cells immediately fol-lowing cell transfer and were treated with DT 3 d later to depleteTreg cells from the CD4CrePD1floxed FDG inoculum. At the end of18 d, we found mice transferred with PD-1–intact Treg cells hadconsiderably smaller tumors, whereas those with PD-1–deficientTreg cells bore much larger tumors (Fig. 6B). The result suggeststhat PD-1–deficient Treg cells strongly favor tumor development.To further determine the effect of Treg cell-specific PD-1 block-
ade on B16F0 tumor development, we cotransferred PD-1–intactTreg cells with CD4CrePD1floxedFDG spleen cells into lympho-depleted mice, which received DT 3 d after cell transfer and thenanti–PD-1 or control mAb treatment on days 5, 10, and 15 postcell transfer. Mice treated with anti–PD-1 mAb developed sig-nificantly larger tumors than those treated with control mAb (Fig.6C). Additionally, anti–PD-1 mAb induced higher Ki67 expressionin Treg cells compared with control (Fig. 6D).Taken together, PD-1 blockade in Treg cells results in their
expansion and enhances their immunosuppressive activity, pro-moting tumor growth even in the presence of potent antitumorimmune responses mediated by PD-1–deficient Tconv cells.
Proliferative eTreg Cells Can Be Targeted by Anti–CTLA-4, Anti–OX-40,or Anti-CCR4 mAb. Last, to evaluate eTreg-specific markers inhumans as potential therapeutic targets especially in HPD, 22
A
TILs PBMCs
PD-1
P < 0.01
P < 0.01
P < 0.01
P < 0.01
B
TILs PBMCs
P < 0.01
P < 0.01
P < 0.01
P < 0.01
TILs PBMCs
n.s.
P < 0.01P < 0.01
P < 0.05
TILs PBMCs
n.s.
P < 0.05
n.s.
P < 0.01
PD-1+ eTreg cellsPD-1- eTreg cells Isotype
10080604020 0
10080604020 0
% o
f Max
4.9%
95.1%
67.6%
32.4%
PBMCs
TILs
0 103 104 105 0 103 104 105 0 103 104 105 0 103 104 105 0 103 104 105
FoxP3
PD-1
PD-1 CTLA-4 Ki67 FoxP3
eTreg cells
MFI
ratio
103
104
105
0
Fig. 3. Phenotypic and functional differences be-tween PD-1+and PD-1− eTreg cells. (A and B) TILs andPBMCs collected from 14 GC patients before anti–PD-1 mAb treatment as in Fig. 1 were subjected toflow cytometry. Representative staining for PD-1,CTLA-4, Ki-67, and FoxP3 of PD-1+ and PD-1− eTregcells from TILs or PBMCs. Naive Treg cells were usedto demarcate PD-1+ and PD-1− eTreg cell fractions.Red, PD-1+ eTreg cells; blue, PD-1− eTreg cells; gray,isotype control (A). Summary for expression leveldetected by MFI (Mean Fluorescence Intensity) of PD-1, CTLA-4, Ki-67, and FoxP3 in PD-1+ and PD-1− eTregcells in 14 GC patients (B). MFI for each moleculerelative to MFI of PD-1− eTreg cells in PBMCs weresummarized. n.s., not significant.
Kamada et al. PNAS | May 14, 2019 | vol. 116 | no. 20 | 10003
IMMUNOLO
GYAND
INFLAMMATION
Dow
nloa
ded
by g
uest
on
June
7, 2
020

TIL samples from GC patients who underwent surgical resectionwere subjected to flow cytometric analysis (SI Appendix, TableS5). In these samples, eTreg cells expressed CTLA-4, OX-40,and CCR4 at significantly higher levels compared with CD4+
or CD8+ Tconv cells, with a comparable level of LAG-3 (SIAppendix, Fig. S7). These data suggest that antibodies, especiallycell-depleting ones, targeting CTLA-4, OX-40, and CCR4 can beused for the treatment and prevention of HPD by specificallydepleting eTreg cells (28).
DiscussionImmune checkpoint blockade, particularly by anti–PD-1 mAb, isnow widely used as a cancer immunotherapy, with occasionaldevelopment of HPD with poor clinical outcome. A previousstudy reported that 12 of 131 (9%) patients with various types of
cancer succumbed to HPD during anti–PD-1 mAb treatment andthat no GC patients (0/2) experienced HPD (6). In our presentstudy, the occurrence rate of HPD in anti–PD-1 mAb-treatedadvanced GC patients was ∼10% (4 among 36). Our recent in-dependent study with advanced GC patients also showed thedevelopment of HPD with poor prognosis in 21% (13 of 62) ofanti–PD-1–treated patients (35), further underlining a need todetermine the cause of HPD and design treatment strategiesagainst it.Our results in humans and mice have demonstrated that PD-
1 deficiency or blockade enhanced the activation of both Tregand Tconv cells, the former suppressing and the latter aug-menting antitumor immunity. PD-1 attenuates TCR signal andalso CD28 costimulatory signal; PD-1 blockade or deficiency inT cells therefore enhances TCR and CD28 signal intensity, which
A B
C
P < 0.01
P < 0.01P < 0.05
n.s.
Anti-PD-1 mAb (-) Anti-PD-1 mAb (+)
Anti-PD-1 mAb
n.s.PD-1
n.s.CTLA-4
n.s.CD28
P < 0.01Ki67
D
PD-1- PD-1+
Anti-CD3/CD28PD-L1 Fc
Anti-PD-1 mAb
---
+--
++-
+++
---
+--
++-
+++
n.s.
P < 0.01P < 0.01
n.s.
Rel
ativ
e in
crea
se (f
old)
Anti-PD-1 mAb(-)(+) Isotype
Treg:Tresp0:1
100806040200
Treg:Tresp1:1
% o
f Max
Anti-PD-1 mAb(-)
15.2%35.9%
84.9% 92.3%
(+)
100806040200
% o
f Max
CFSE0 103 104105 0 103 104105
0 103 104105 0 103 104105 0 103 104105 0 103 104105
CTLA-4 CD28 Ki67PD-1
(-) (+) (-) (+) (-) (+) (-) (+)
100806040200
% d
ilute
d
Fig. 4. Role of PD-1 in Treg cell-mediated immunesuppression. (A and B) PD-1+CD45RA−CD25highCD4+
T cells (eTreg cells) were sorted from PBMCs, andCFSE-labeled CD8+ T cells (Tresp cells) from PBMCswere cocultured with the indicated ratio of thesorted PD-1+ eTreg cells for 5 d with anti-CD3 mAband irradiated APCs. Proliferation of Tresp cells wasdetermined by CFSE dilution. Representative CFSEstaining (A) and percent of proliferating Tresp cells inthe cultures with the indicated ratio of Treg cells andTresp cells (B). (C) eTreg cells in the cultures weresubjected to flow cytometry to examine activationand proliferative status. (Top) Phenotypic changes(PD-1, CTLA-4, and CD28 expression) and pro-liferative capacity (Ki-67 expression) of eTreg cellswith/without anti–PD-1 mAb (nivolumab). Black, anti–PD-1 mAb (−); red, anti–PD-1 mAb (+); gray, isotypecontrol. (Bottom) Summary for expression levels de-tected by MFI of PD-1, CTLA-4, CD28, and Ki-67 of eTregcells with/without anti–PD-1 mAb in four healthy indi-viduals. (D) Proliferation of Treg cells. PD-1− or PD-1+
eTreg cells were sorted from PBMCs of healthy indi-viduals and cultured with/without PD-L1 Fc Ig and/oranti–PD-1 mAb in the presence of anti-CD3 mAb andanti-CD28 mAb. Forty-eight hours after incubation, theproliferation of PD-1− or PD-1+ eTreg cells was evalu-ated by WST-1 assay. Ratio of the absorbance at 48 to0 h is shown.
10004 | www.pnas.org/cgi/doi/10.1073/pnas.1822001116 Kamada et al.
Dow
nloa
ded
by g
uest
on
June
7, 2
020
B CD4Cre
CD4Cre
PD1floxed
41.9
19.0
1.9
A CD4Cre
mice
78.1
21.0
43.7
32.5
103 104 1050
103
104
105
0
78.1
21.2
47.0
37.7
CD4CrePD1floxed
mice 65.3
39.3
10.4
CD
4
CD8
CD
44
CD62LC
D4
CD8 CD
44
CD62L
FoxP
3
CD4
FoxP
3
CD4
DTtreatment
CD45.2 CD4CrePD1floxedFDG BM cells +
CD45.1 BM cellsX-irradiated
CD45.1 mice
103
104
105
0
0 103 104 105
2.54D
C
FoxP3
DT Treated
11.4 1.6
71.0 15.7
4
78.0 17.5
Non-DT Treated
0
EF
Treg : Tconv
# P
rolif
erat
ed T
conv
(x10
3 )
0
2
4
6
8
10
1:1 1:2 1:4 0:1
IgGAnti-PD1
Treg : Tconv
P < 0.01
P < 0.05
0
0.2
0.4
0.6
0.8
1.0
IgG A
nti-P
D1
P < 0.05
PD-1 intact Treg cells+
PD-1 deficient Tconv cells+
Anti-PD-1 or IgG
D
#Pro
lifer
ated
Tco
nv(x
103 )
0
2
4
610
15 WT Treg + WT TconvKO Treg + WT TconvWT Treg + KO TconvKO Treg + KO TconvWT Tconv onlyKO Tconv only
P < 0.01
P < 0.01
1:1 1:2 1:4 0:1Treg : Tconv
Treg Tconv
P < 0.01
0
20
40
60
80
%C
D44
+ CD
62L-
P < 0.01
+
3
6
9
12
0
%C
D44
+ CD
62L-
P < 0.01
CD4Cre CD4CrePD1floxedP < 0.05
30
20
10
0%K
i67+
Treg
12
8
4
0%K
i67+
Tcon
v n.s. 12
8
4
0%K
i67+
CD
8 n.s.
C
30.218.1
9.3610.7
8.597.15
100
80604020
00 103 104 105
xaMfo
%
Treg Tconv CD8+
Negative stainCD4Cre CD4CrePD1floxed
Ki67
CD
45.2
-
% K
i67+
Treg
30
20
10
0
CD
45.2
-
CD
45.2
+
% K
i67+
Treg
30
20
10
0
P < 0.05
CD
45.2
-
CD
45.2
+
% K
i67+
Tcon
v
15
10
5
0
P < 0.05
CD
45.2
-
CD
45.2
+
% K
i67+
Tcon
v
15
10
5
0
n.s.
# Tr
eg(x
103 )
Fig. 5. Strong proliferation and immunosuppressive function of murine Treg cells with PD-1 deficiency. (A–C) Spleen cells from 9- to 10-wk-old CD4CreFDG andCD4CrePD1floxedFDGmice were subjected to flow cytometry. Representative flow cytometry plots of activated CD44+CD62L− cells in FoxP3+CD4+ Treg cells, FoxP3−CD4+
Tconv cells, and CD8+ T cells in the indicated mice are shown (A). Summary for the percentage of activated (CD44+CD62L−) cells in each cell population (B). Rep-resentative staining (Top) and summary (Bottom) of proliferating (Ki67+) Treg cells, Tconv cells, and CD8+ T cells (C). n = 4 per each group. Blue, CD4CreFDGmouse; red,CD4CrePD1floxedFDG mouse; gray, negative stain control. (D) PD-1–intact (wild-type; WT) and PD-1–deficient (knockout; KO) Treg and Tconv cells were collected fromCD4CreFDG and CD4CrePD1floxedFDG mice, respectively. PD-1–intact and PD-1–deficient Tconv cells were stained with CellTrace violet (CTV) and cocultured with eitherPD-1–intact or PD-1–deficient Treg cells at the indicated ratios of Treg cells and Tresp cells. After 3 d culture, the number of proliferating cells was measured by CTVdilution. (E) Bone marrow chimeric (BMC) mice were generated by transferring bone marrow (BM) cells comprising 70% CD45.1 and 30% CD45.2 CD4CrePD1floxed FDGinto lethally irradiated recipient CD45.1 mice. DT was administered in BMCmice to deplete PD-1–deficient CD45.2+ Treg cells. Five days after DT treatment, spleen cellswere collected and subjected to flow cytometry. Representative staining of CD4+ T cells in spleens (Left) and percentages of proliferating (Ki67+) Treg cells and Tconvcells (Right). n = 4–5 in each group. (F) PD-1–intact Treg cells were cocultured with PD-1–deficient Tconv cells labeled with CTV in the presence of either anti–PD-1 orisotype-matched IgG mAb. The number of FoxP3+CD4+ Treg cells recovered (Left) and the number of proliferating Tconv cells (Right) are shown. Numbers on flowcytometry plots indicate percentages of gated populations. Data are representative of at least two independent experiments.
Kamada et al. PNAS | May 14, 2019 | vol. 116 | no. 20 | 10005
IMMUNOLO
GYAND
INFLAMMATION
Dow
nloa
ded
by g
uest
on
June
7, 2
020

A B
C
D
Fig. 6. Increased tumor growth by PD-1–deficient Treg cells. (A) C57BL/6 mice were inoculated with B16F0 melanoma cells in the right rear flank. Fifteen days afterinoculation, T cells were prepared from tumors and draining inguinal lymph nodes and subjected to flow cytometry. Representative flow cytometry staining forPD-1 expressed by Treg cells (red), Tconv cells (blue), and CD8+ T cells (green) in TILs (Top) and Ki67 expressed by TIL Treg cells (red) from tumor and PD-1+ Treg cells(blue) and PD-1− Treg cells (green) from draining lymph nodes (Bottom). (B) C57BL/6 mice were lympho-depleted by 6-Gy irradiation and then were transferredwith spleen cells from CD4CrePD1floxedFDGmice and Treg cells from either FoxP3IRES-Cre or FoxP3IRES-CrePD1floxed mice. After cell transfer, mice were injected s.c. withB16F0 cells. DT was administered intraperitoneally 3 d after cell transfer to deplete Treg cells from the CD4CrePD1floxedFDG transferred fraction. Tumor growth ofB16 tumors was measured over 18 d. (C) Irradiated (6 Gy) CD45.2 B6 mice were transferred with CD45.2 CD4CrePD1floxedFDG spleen cells and PD-1–intact CD45.1Treg cells. Mice were injected with B16 tumor cells and DT as in B, and anti–PD-1 or isotype-matched IgG mAb was administered on days 5, 10, and 15. Tumorgrowth of B16 tumors was measured over 18 d (Left). Tumor masses measured on day 18 are shown (Right). (D) Tumor-draining lymph nodes in anti–PD-1 mAb-treated or control mice were collected on day 18 posttransfer to assess transferred CD45.1+ Treg cells. Representative flow cytometry staining (Left) and percentage(Right) of proliferating (Ki67+) transferred CD45.1+ Treg cells from both groups. Data are representative of at least two independent experiments.
10006 | www.pnas.org/cgi/doi/10.1073/pnas.1822001116 Kamada et al.
Dow
nloa
ded
by g
uest
on
June
7, 2
020

activates Treg cells as well as Tconv cells (31–33). A previousanimal study showed that PD-1–deficient Treg cells had in-creased immunosuppressive activity and better protected againstautoimmune diseases compared with PD-1–intact Treg cells,indicating that lack of PD-1 signaling enhances the immuno-suppressive function of Treg cells (20). On the other hand, it wasrecently reported that PD-L1 binding to PD-1 during peripheralTreg cell generation from Tconv cells was critical for the main-tenance of long-term FoxP3 expression and in vivo regulation ofimmune responses against murine colitis and graft versus hostdisease (21). Furthermore, Treg cells have been shown to exhibitimmunosuppressive activity via direct interaction between PD-1 on Treg cells and PD-L1 on CD8+ T cells, an activity signifi-cantly decreased by PD-1 blockade in an animal model ofchronic infection (22). It is also worth noting that some tumor-infiltrating Treg cells express PD-L1 in addition to PD-1 (36, 37),raising the likelihood of reciprocal PD-1 and PD-L1 signalingthat allows for a delicate control of immune cell homeostasiswithin tumor tissues. These results suggest that PD-1 signalingcontributes to the function and maintenance of Treg cellsdepending on various factors ranging from the Treg cell subtypein question to the mechanism-of-action by which Treg cellscontrol diseases (e.g., chronic viral infection and cancer) throughtheir target cells of choice such as APCs or others (13, 14, 30).The success of anti–PD-1 mAb therapy hinges on its ability to
unleash effector T cells from PD-1–dependent inhibition to en-able them to kill tumor cells. This strategy, however, can besupplanted by various means, one of which is the proliferation ofTreg cells and augmentation of their immunosuppressive activityas shown in the present study. In tumor tissues, activated PD-1+
Treg cells, which highly express CTLA-4, may result in moreTreg: APC aggregates coupled with CTLA-4–dependent down-regulation of the costimulatory molecules CD80 and CD86 onAPCs, hence restricting APC access for Tconv cells and theiractivation (29, 30, 38). Additionally, proliferating PD-1+ Tregcells may rapidly absorb IL-2 and deprive it from tumor-reactiveeffector T cells (30). With such Treg cell-mediated immunesuppression in tumor tissues, the antitumor efficacy of PD-1blockade may rest on the balance between reinvigoration of ef-fector T cells and augmentation of PD-1+ Treg cell proliferationand suppression. In the event that the latter effect is moredominant, tumor cells could escape effector T cell killing andgrow uncontrollably (SI Appendix, Fig. S8). This is supported bythe finding that Treg cells were increased in nonresponders toanti–PD-1 mAb treatment for malignant melanoma and de-creased in responders (39), consistent with our observation in theHPD cases. The underlying reason for preferential expansion ofTreg cells upon PD-1 blockade remains unknown. Although thetumors of HPD and non-HPD patients harbor high PD-1+ Tregcells, which serve as a major predisposition, it is reasonable tospeculate that the former may inherently be enriched in factors(e.g., adenosine and indoleamine 2,3-dioxygenase) that supporteTreg cell expansion and induction upon PD-1 blockade. Futurework ought to assess the metabolite content of HPD tumors todissect unique features that favor and sustain Treg cell proliferation.At present, it would be worthwhile to evaluate the proliferativeresponse of Treg cells in TILs during anti–PD-1 mAb treatment toidentify potential HPD patients. According to recent reports usingmass cytometry, the relative frequencies of certain T cell subsetsand expression of activation/migration markers (e.g., CD45ROand CD11a) may be used to predict clinical outcome followingPD-1 blockade (40, 41). ICOS is highly correlated with Ki-67 expression in Treg cells (42) and, indeed, expressed by pro-liferating Treg cells in gastric cancer TILs (43). It was also shownthat despite constant cell cycling of the majority of tumor-infiltrating T cells, only a few specific clusters increased in sizein response to anti–PD-1 mAb therapy (40). Such findings areuseful for future studies to assess relevant cellular and molecular
defects that would induce and expand PD-1+ Treg cells in thetumor tissue, causing HPD.Our study strongly indicates that inhibiting Treg cell pro-
liferation could be an important strategy to treat and preventHPD in high-risk patients under PD-1 blockade therapy. This isunderscored by our mouse studies, which clearly suggest that byleaving the PD-1 pathway intact in Treg cells and not inducingtheir proliferation, PD-1 blockade on non-Treg effector T cellsmay be more effective in eliminating tumor cells. Notably,combination of nivolumab and ipilimumab (anti–CTLA-4 mAb),which reportedly target Treg cells for depletion (44, 45), candecrease HPD in malignant melanoma patients (46). OX-40–targeting therapy, which reportedly suppresses Treg cells, ispresently under clinical trial with several solid tumors, and phaseI trials have shown promising antitumor activity (47). Further-more, we have previously shown that CCR4 was specifically andpredominantly expressed by highly suppressive eTreg cells inmalignant melanoma; in vitro treatment of melanoma TILs withanti-CCR4 mAb (mogamulizumab) indeed depleted melanoma-infiltrating CCR4+ eTreg cells and efficiently expanded and ac-tivated both CD4+ and CD8+ T cells specific for a cancer-testisantigen expressed by the melanoma (48). Several early-phaseclinical trials with mogamulizumab, used as an eTreg cell de-pletion reagent, either as monotherapy or in combination withICBs, are being conducted in advanced solid tumors. The com-bination of nivolumab and mogamulizumab is also being in-vestigated in a Japanese phase I trial for solid tumors (49). Theoccurrence rate of HPD in this combination therapy appears tobe lower than nivolumab monotherapy, warranting furtherstudies with large cohorts. Besides antibody-mediated therapy,cytokine therapy could be a viable option as well. For example,antitumor effects of anti–PD-1 mAb were greatly enhanced byincreasing systemic IL-27 levels. This was attributed to reducedIL-2 production and reduced IL-2Rα expression in Tconv cellsand Treg cells, respectively, which limited Treg cell number inanti–PD-1 mAb-treated mice (50). Further development ofstrategies for Treg cell depletion in cancer tissues is required.In conclusion, the development of HPD in advanced GC patients
during anti–PD-1 mAb therapy is associated with proliferation ofTreg cells in tumor tissues. PD-1 blockade promotes cell cycling ofTreg cells and augments Treg cell-mediated immune suppression,likely through stronger TCR signaling. Currently, monitoring of Tregcells in the tumor during anti–PD-1 mAb treatment is not routinelypracticed. Our study calls for a need to do so. Further confirmation withlarge cohort studies is required, especially for designing novel strategies tobetter detect and treat HPD. Depletion of tumor-infiltrating eTregcells or attenuation of their immunosuppressive function could beinstrumental in treating and preventing HPD, as our study suggests.
Materials and MethodsAll participants provided written informed consent. This study was approvedby the institutional review boards of National Cancer Center and was con-ducted in accordance with ethics guidelines including the Declaration ofHelsinki. Micewere used according to protocols approved byOsakaUniversityanimal care and use committee. Details about materials and methods areprovided in SI Appendix, Materials and Methods.
ACKNOWLEDGMENTS. We thank Ms. Tomoka Takaku, Miyuki Nakai,Konomi Onagawa, Megumi Takemura, Chie Haijima, Megumi Hoshino,Kumiko Yoshida, and Miho Ozawa for their technical assistance. This studywas supported by Grants-in-Aid for Scientific Research [S Grant 17H06162 (toH.N.), Challenging Exploratory Research Grant 16K15551 (to H.N.), YoungScientists Grant 17J09900 (to Y. Togashi)], Japan Society for the Promotion ofScience Research Fellow [Grants 17K18388 (to Y. Togashi) and 18J21161 (toT. Kamada)] and Grant-in-Aid for Specially Promoted Research [Grant 16H06295(to S.S.)] from the Ministry of Education, Culture, Sports, Science and Technologyof Japan, by the Project for Cancer Research, by Therapeutic Evolution [P-CREATE,Grants 16cm0106301h0002 (to H.N.), 18cm0106340h0001 (to Y. Togashi),and 18cm0106303h0003 (to S.S.)] Core Research for Evolutional Science andTechnology [CREST, Grant 17gm0410016h0006 (to S.S.)], and Leading Ad-vanced Projects for medical innovation [LEAP, Grant 18gm0010005h0001 (to
Kamada et al. PNAS | May 14, 2019 | vol. 116 | no. 20 | 10007
IMMUNOLO
GYAND
INFLAMMATION
Dow
nloa
ded
by g
uest
on
June
7, 2
020

S.S.)] from Japan Agency for Medical Research and Development (AMED), by theNational Cancer Center Research and Development Fund [no. 28-A-7 (to H.N.)], bythe Naito Foundation (to Y. Togashi and H.N.), by the Takeda Foundation (toY. Togashi), by the Kobayashi Foundation for Cancer Research (to Y. Togashi),
by the Novartis Research Grant (to Y. Togashi), by the Bristol-Myers SquibbResearch Grant (to Y. Togashi), and by the Sagawa Holdings Foundation (toY. Togashi). The analysis of immune status was executed in part as a researchprogram supported by Ono Pharmaceutical Co., Ltd.
1. Zou W, Wolchok JD, Chen L (2016) PD-L1 (B7-H1) and PD-1 pathway blockade forcancer therapy: Mechanisms, response biomarkers, and combinations. Sci Transl Med8:328rv4.
2. Pardoll DM (2012) The blockade of immune checkpoints in cancer immunotherapy.Nat Rev Cancer 12:252–264.
3. Topalian SL, et al. (2012) Safety, activity, and immune correlates of anti-PD-1 antibodyin cancer. N Engl J Med 366:2443–2454.
4. Brahmer JR, et al. (2012) Safety and activity of anti-PD-L1 antibody in patients withadvanced cancer. N Engl J Med 366:2455–2465.
5. Hodi FS, et al. (2010) Improved survival with ipilimumab in patients with metastaticmelanoma. N Engl J Med 363:711–723.
6. Champiat S, et al. (2017) Hyperprogressive disease is a new pattern of progression incancer patients treated by anti-PD-1/PD-L1. Clin Cancer Res 23:1920–1928.
7. Kato S, et al. (2017) Hyperprogressors after immunotherapy: Analysis of genomicalterations associated with accelerated growth rate. Clin Cancer Res 23:4242–4250.
8. Champiat S, et al. (2018) Hyperprogressive disease: Recognizing a novel pattern toimprove patient management. Nat Rev Clin Oncol 15:748–762.
9. Sakaguchi S, Sakaguchi N, Asano M, Itoh M, Toda M (1995) Immunologic self-tolerance maintained by activated T cells expressing IL-2 receptor α-chains (CD25).Breakdown of a single mechanism of self-tolerance causes various autoimmune dis-eases. J Immunol 155:1151–1164.
10. Hori S, Nomura T, Sakaguchi S (2003) Control of regulatory T cell development by thetranscription factor Foxp3. Science 299:1057–1061.
11. Fontenot JD, Gavin MA, Rudensky AY (2003) Foxp3 programs the development andfunction of CD4+CD25+ regulatory T cells. Nat Immunol 4:330–336.
12. Khattri R, Cox T, Yasayko SA, Ramsdell F (2003) An essential role for Scurfin in CD4+
CD25+ T regulatory cells. Nat Immunol 4:337–342.13. Sakaguchi S, Miyara M, Costantino CM, Hafler DA (2010) FOXP3+ regulatory T cells in
the human immune system. Nat Rev Immunol 10:490–500.14. Wing JB, Tanaka A, Sakaguchi S (2019) Human FOXP3+ regulatory T cell heteroge-
neity and function in autoimmunity and cancer. Immunity 50:302–316.15. Onizuka S, et al. (1999) Tumor rejection by in vivo administration of anti-CD25 (in-
terleukin-2 receptor α) monoclonal antibody. Cancer Res 59:3128–3133.16. Shimizu J, Yamazaki S, Sakaguchi S (1999) Induction of tumor immunity by removing
CD25+CD4+ T cells: A common basis between tumor immunity and autoimmunity.J Immunol 163:5211–5218.
17. Curiel TJ, et al. (2004) Specific recruitment of regulatory T cells in ovarian carcinomafosters immune privilege and predicts reduced survival. Nat Med 10:942–949.
18. Saito T, et al. (2016) Two FOXP3+CD4+ T cell subpopulations distinctly control theprognosis of colorectal cancers. Nat Med 22:679–684.
19. Togashi Y, Nishikawa H (2017) Regulatory T cells: Molecular and cellular basis forimmunoregulation. Curr Top Microbiol Immunol 410:3–27.
20. Zhang B, Chikuma S, Hori S, Fagarasan S, Honjo T (2016) Nonoverlapping roles of PD-1 and FoxP3 in maintaining immune tolerance in a novel autoimmune pancreatitismouse model. Proc Natl Acad Sci USA 113:8490–8495.
21. Stathopoulou C, et al. (2018) PD-1 inhibitory receptor downregulates asparaginylendopeptidase and maintains Foxp3 transcription factor stability in induced regula-tory T cells. Immunity 49:247–263.e7.
22. Park HJ, et al. (2015) PD-1 upregulated on regulatory T cells during chronic virus in-fection enhances the suppression of CD8+ T cell immune response via the interactionwith PD-L1 expressed on CD8+ T cells. J Immunol 194:5801–5811.
23. Lowther DE, et al. (2016) PD-1 marks dysfunctional regulatory T cells in malignantgliomas. JCI Insight 1:e85935.
24. Montler R, et al. (2016) OX40, PD-1 and CTLA-4 are selectively expressed on tumor-infiltrating T cells in head and neck cancer. Clin Transl Immunology 5:e70.
25. Asano T, et al. (2017) PD-1 modulates regulatory T-cell homeostasis during low-doseinterleukin-2 therapy. Blood 129:2186–2197.
26. Tran DQ, Ramsey H, Shevach EM (2007) Induction of FOXP3 expression in naivehuman CD4+FOXP3 T cells by T-cell receptor stimulation is transforming growthfactor-beta dependent but does not confer a regulatory phenotype. Blood 110:2983–2990.
27. Miyara M, et al. (2009) Functional delineation and differentiation dynamics of humanCD4+ T cells expressing the FoxP3 transcription factor. Immunity 30:899–911.
28. Ha D, et al. (2019) Differential control of human Treg and effector T cells in tumorimmunity by Fc-engineered anti-CTLA-4 antibody. Proc Natl Acad Sci USA 116:609–618.
29. Wing K, et al. (2008) CTLA-4 control over Foxp3+ regulatory T cell function. Science322:271–275.
30. Vignali DA, Collison LW, Workman CJ (2008) How regulatory T cells work. Nat RevImmunol 8:523–532.
31. Takahashi T, et al. (1998) Immunologic self-tolerance maintained by CD25+CD4+
naturally anergic and suppressive T cells: Induction of autoimmune disease bybreaking their anergic/suppressive state. Int Immunol 10:1969–1980.
32. Zhang R, et al. (2013) An obligate cell-intrinsic function for CD28 in Tregs. J Clin Invest123:580–593.
33. Levine AG, Arvey A, Jin W, Rudensky AY (2014) Continuous requirement for the TCRin regulatory T cell function. Nat Immunol 15:1070–1078.
34. Vahl JC, et al. (2014) Continuous T cell receptor signals maintain a functional regu-latory T cell pool. Immunity 41:722–736.
35. Sasaki A, et al. (January 9, 2019) Predictive factors for hyperprogressive disease duringnivolumab as anti-PD1 treatment in patients with advanced gastric cancer. GastricCancer, 10.1007/s10120-018-00922-8.
36. Liu Y, et al. (2014) FoxA1 directs the lineage and immunosuppressive properties of anovel regulatory T cell population in EAE and MS. Nat Med 20:272–282.
37. Chevalier MF, et al. (2018) Conventional and PD-L1-expressing regulatory T cells areenriched during BCG therapy and may limit its efficacy. Eur Urol 74:540–544.
38. Onishi Y, Fehervari Z, Yamaguchi T, Sakaguchi S (2008) Foxp3+ natural regulatoryT cells preferentially form aggregates on dendritic cells in vitro and actively inhibittheir maturation. Proc Natl Acad Sci USA 105:10113–10118.
39. Weber JS, et al. (2013) Safety, efficacy, and biomarkers of nivolumab with vaccine inipilimumab-refractory or -naive melanoma. J Clin Oncol 31:4311–4318.
40. Wei SC, et al. (2017) Distinct cellular mechanisms underlie anti-CTLA-4 and anti-PD-1 checkpoint blockade. Cell 170:1120–1133.e17.
41. Krieg C, et al. (2018) High-dimensional single-cell analysis predicts response to anti-PD-1 immunotherapy. Nat Med 24:144–153.
42. Miyara M, et al. (2015) Sialyl Lewis x (CD15s) identifies highly differentiated and mostsuppressive FOXP3high regulatory T cells in humans. Proc Natl Acad Sci USA 112:7225–7230.
43. Nagase H, et al. (2017) ICOS+ Foxp3+ TILs in gastric cancer are prognostic markers andeffector regulatory T cells associated with Helicobacter pylori. Int J Cancer 140:686–695.
44. Romano E, et al. (2015) Ipilimumab-dependent cell-mediated cytotoxicity of regula-tory T cells ex vivo by nonclassical monocytes in melanoma patients. Proc Natl Acad SciUSA 112:6140–6145.
45. Arce Vargas F, et al.; TRACERx Melanoma; TRACERx Renal; TRACERx Lung Consortia(2018) Fc effector function contributes to the activity of human anti-CTLA-4 anti-bodies. Cancer Cell 33:649–663.e4.
46. Larkin J, Hodi FS, Wolchok JD (2015) Combined nivolumab and ipilimumab or mon-otherapy in untreated melanoma. N Engl J Med 373:1270–1271.
47. Hamid O, et al. (2016) First in human (FIH) study of an OX40 agonist monoclonalantibody (mAb) PF-04518600 (PF-8600) in adult patients (pts) with select advancedsolid tumors: Preliminary safety and pharmacokinetic (PK)/pharmacodynamic results.J Clin Oncol 34(Suppl 15):3079.
48. Sugiyama D, et al. (2013) Anti-CCR4 mAb selectively depletes effector-type FoxP3+CD4+
regulatory T cells, evoking antitumor immune responses in humans. Proc Natl Acad SciUSA 110:17945–17950.
49. Yamamoto N, et al. (2017) Anti-CC-chemokine receptor 4 (CCR4) antibody moga-mulizumab (Moga) and nivolumab (Nivo) combination phase I study in patents withadvanced or metastatic solid tumor. Ann Oncol 28(Suppl 5):v605–v649.
50. Zhu J, et al. (2018) IL-27 gene therapy induces depletion of Tregs and enhances theefficacy of cancer immunotherapy. JCI Insight 3:e98745.
10008 | www.pnas.org/cgi/doi/10.1073/pnas.1822001116 Kamada et al.
Dow
nloa
ded
by g
uest
on
June
7, 2
020