pcos cardiovascular healthcardiovascular health
TRANSCRIPT

PCOS PCOS Cardiovascular HealthCardiovascular HealthCardiovascular HealthCardiovascular Health((PostPost--Reproductive Life)Reproductive Life)(( p )p )
Robert A. Wild, M.D., Ph.D., M.P.HRobert A. Wild, M.D., Ph.D., M.P.HProfessor and Chief Gynecology Professor and Chief Gynecology Professor Clinical EpidemiologyProfessor Clinical EpidemiologyProfessor Clinical EpidemiologyProfessor Clinical Epidemiology
Department of Obstetrics and GynecologyDepartment of Obstetrics and GynecologyVA Medical CenterVA Medical CenterVA Medical CenterVA Medical Center
Oklahoma University health Sciences CenterOklahoma University health Sciences CenterOklahoma city OklahomaOklahoma city OklahomaOklahoma city, Oklahoma Oklahoma city, Oklahoma
Women’s health aspects of PCOS ESHRE Campus symposiumWomen’s health aspects of PCOS ESHRE Campus symposiumWomen s health aspects of PCOS ESHRE Campus symposiumWomen s health aspects of PCOS ESHRE Campus symposiumAmsterdam, The NetherlandsAmsterdam, The Netherlands1818 November 2010November 2010

ConflictsConflicts
• none

ObjectivesObjectives
• Attendee become familiar with the evidence for the major risk factors for CVDj
• Attendee will become familiar with the evidence for major CVD risk factors inevidence for major CVD risk factors in women with PCOS
• Attendee will become familiar with recommendations in the AE-PCOSrecommendations in the AE PCOS Consensus guidelines for CVD risk for women with PCOSwomen with PCOS

I l bl WIrreplaceable Women

INTERHEART study: case-control study 9 risk factors accounted for
94% of the Population Attributable Risk for myocardial infarction
Risk Odds Protective OddsRisk Odds
• Smoking 2·86 (2·36 3·48)
Protective Odds
Fruits/Vegs 0·58 (0·48 0·71)• Smoking 2·86 (2·36–3·48)• Diabetes 4·26 (3·51–5·18)• Hypertension 2·95 (2·57–3·39)
Fruits/Vegs 0 58 (0 48–0 71) Alcohol 0·41 (0·32–0·53) Exercise 0·48 (0·39–0·59) yp ( )
• Abdominal obesity 2·26 (1·90–2·68)• Psycho/Social 3·49 (2·41–5·04)
( )
• ApoB/ApoA1 4·42 (3·43–5·70)
Yusuf,S. et al 2004

PCOS Fruits and Vegetables

Difference in dietary intake between women withDifference in dietary intake between women with polycystic ovary syndrome and healthy controls
Variable Control PCOS P value
CCola beverages 4.1 ± 7.9 2.9 ± 4.2 .50
White bread 5 5 ± 2 9 7 9 ± 4 4 02White bread 5.5 ± 2.9 7.9 ± 4.4 .02
Fried potatoes 0.4 ± 0.7 1.0 ± 1.5 .07
Cooked potatoes 2.9 ± 3.3 2.8 ± 2.7 .86
White rice 1 1 ± 1 9 1 2 ± 1 7 77White rice 1.1 ± 1.9 1.2 ± 1.7 .77
Pasta 2.6 ± 2.5 2.5 ± 2.8 .92
4 day diet recall 30 PCOS and 27 controls
Douglas,C.et al 2006
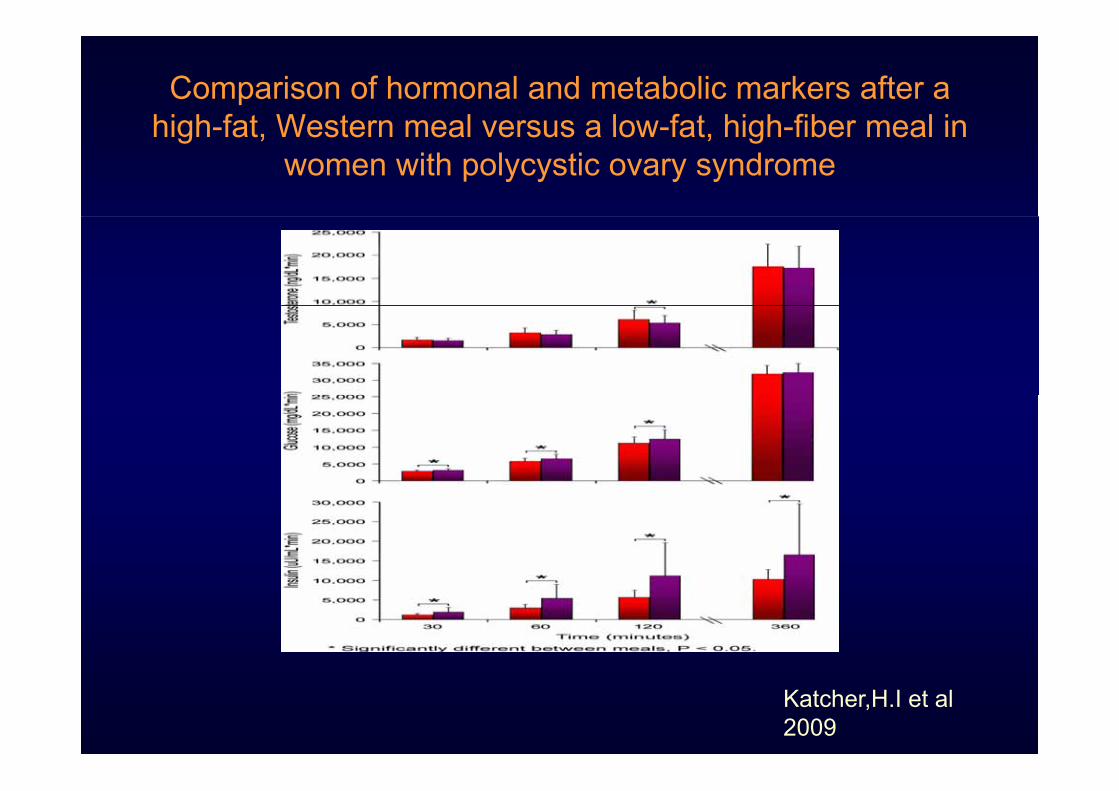
Comparison of hormonal and metabolic markers after a high fat Western meal versus a low fat high fiber meal inhigh-fat, Western meal versus a low-fat, high-fiber meal in
women with polycystic ovary syndrome
Katcher,H.I et al 2009

The Pear The
Apple
Waist Circumference < 35 inches (88cm)

Abdominal Obesity and Waist Abdominal Obesity and Waist Circumference ThresholdsCircumference Thresholds
Men WomenEuropid >94 cm (37.0 in.) >80 cm (31.5 in)South Asian >90 cm (35.4 in.) >80 cm (31.5 in)Chinese >90 cm (35.4 in.) >80 cm (31.5 in)J >85 (33 5 i ) >90 (35 4 i )Japanese >85 cm (33.5 in.) >90 cm (35.4 in)
C t NCEP ATP III it iCurrent NCEP ATP-III criteria
>102 cm (>40 in) in men, >88 cm (>35 in.) in women

Appropriate BMI levels for PCOS patients in Southern China
n=(999) PCOS vs. (922 controls)
BMI OR dyslipidemia
• <18.5kg/m2 (6.62%)• >18.5 & 23Kg/m2(11.7%)
2.51(1.02-6.16)4 10((2 45 6 85)g ( )
• >23 and <25 Kg/m2(29%)• >25 Kg/m2 (39%)
4.10((2.45-6.85)2.22(1.19-4.15)
g ( )1.36(0.74-2.47)
Chen, X. 2010

ROC curves for detecting metabolic syndrome (MetS)(3 or more)In Chinese PCOS (n=999) BMI 23 Rotterdam
Chen X et al. 2010
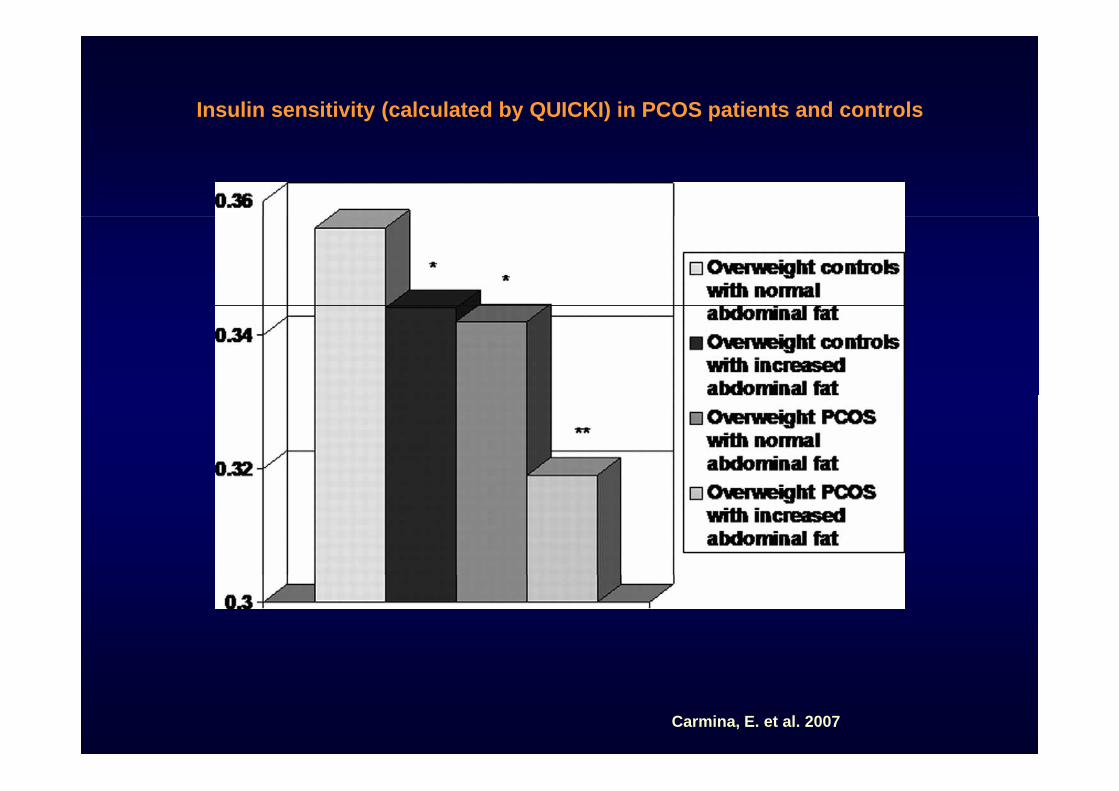
Insulin sensitivity (calculated by QUICKI) in PCOS patients and controls
Carmina, E. et al. 2007

Insulin sensitivity in normoweight PCOS patients and controls NIH
Carmina, E. et al. 2007;
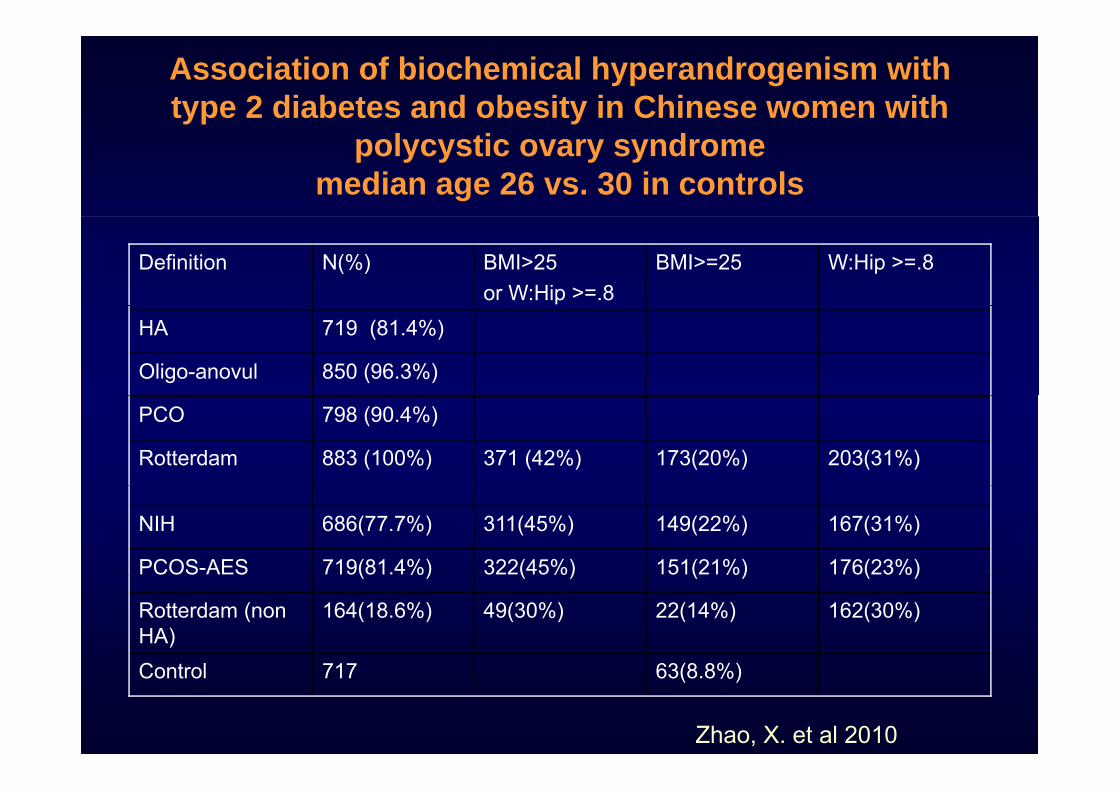
Association of biochemical hyperandrogenism with type 2 diabetes and obesity in Chinese women with
polycystic ovary syndrome median age 26 vs. 30 in controls
Definition N(%) BMI>25or W:Hip >=.8
BMI>=25 W:Hip >=.8
HA 719 (81.4%)
Oligo-anovul 850 (96.3%)
PCO 798 (90.4%)
Rotterdam 883 (100%) 371 (42%) 173(20%) 203(31%)
NIH 686(77.7%) 311(45%) 149(22%) 167(31%)
PCOS-AES 719(81.4%) 322(45%) 151(21%) 176(23%)( ) ( ) ( ) ( )
Rotterdam (non HA)
164(18.6%) 49(30%) 22(14%) 162(30%)
C t l 717 63(8 8%)Control 717 63(8.8%)
Zhao, X. et al 2010

Variation in metabolic and cardiovascular risk with different
polycystic ovary syndrome phenotypes
PCOS H+PCO Hirsute Controls P value Parameter PCOS
(n=195)H+PCO(n=195)
Hirsute (n=68)
Controls (n=25) BMI
adjusted
22 31 ± 25 89 ± 24 73 ± 29 68 ±Age (y) 22.31 ±6.7a
25.89 ±7.56b
24.73 ±8.35ab
29.68 ±4.29b <.001 —
BMI (kg/m2) 31.06 ±7 98a
26.96 ±6 38b
26.91 ±7 48b
26.97 ±3 64b <.001 —( g ) 7.98a 6.38b 7.48b 3.64b
Waist circum 93.79 ± 83.42 ± 84.07 ± 79.83 ± < 001 019ference (cm)
18.81a 13.37b 16.92b 8.37b <.001 .019
SBP (mm 123 09 114 73 ± 116 33 ± 115 21 ±SBP (mm Hg)
123.09 ± 16.92a
114.73 ±21.02b
116.33 ±15.30b
115.21 ±9.51b .002 .24
DBP (mm H )
78.9 ±12 29a
73.48 ±12 84b
74.22 ±13 10b
73.6 ±8 27ab .005 .41Hg) 12.29a 12.84b 13.10b 8.27ab
Wiltgen et al 2010
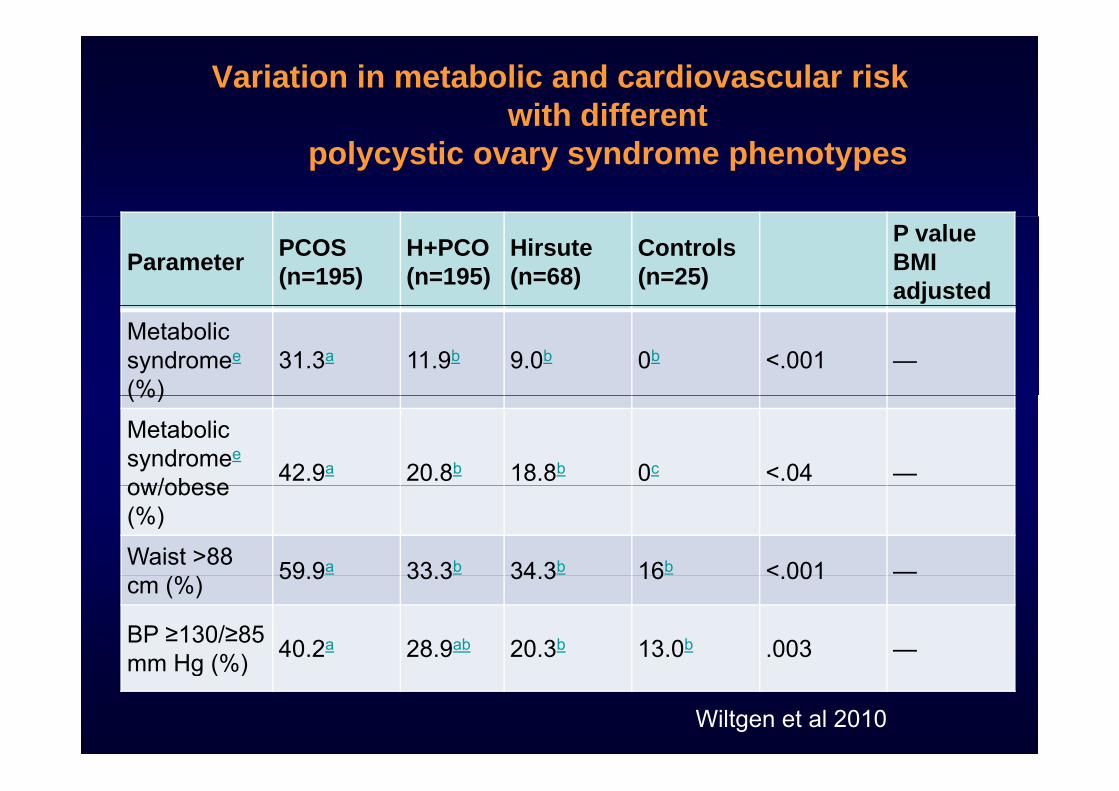
Variation in metabolic and cardiovascular risk with different
polycystic ovary syndrome phenotypes
Parameter PCOS (n=195)
H+PCO(n=195)
Hirsute (n=68)
Controls (n=25)
P value BMI adjusted
Metabolic syndromee
(%)31.3a 11.9b 9.0b 0b <.001 —
(%)
Metabolic syndromee
ow/obese 42.9a 20.8b 18.8b 0c <.04 —ow/obese (%)
Waist >88 59 9a 33 3b 34 3b 16b < 001 —cm (%) 59.9 33.3 34.3 16 <.001
BP ≥130/≥85 mm Hg (%) 40.2a 28.9ab 20.3b 13.0b .003 —mm Hg (%)
Wiltgen et al 2010

T2DM & PCOS

Prevalence of T2DM in PCOS vs. Controls
PCOS Control Odds Ratio Odds RatioStudy or SubgroupDos Reis 1995Rajkhowa 1996Cibula 2000
Events329
Total297228
Events00
60
Total1939
752
Weight0.1%0.2%0.8%
M-H, Fixed, 95% CI5.15 [0.25, 105.59]2.80 [0.13, 59.82]5.46 [2.37, 12.60]
Year199519962000
M-H, Fixed, 95% CI
Yarali 2001Sir-Petermann 2004Sawathiparnich 2005Lo 2006
143
988
30146
611035
000
1136
30976
55175
0.1%0.2%0.1%
89.9%
3.10 [0.12, 79.23]6.16 [0.33, 115.68]
13.00 [0.51, 330.48]4.68 [4.28, 5.11]
2001200420052006
Alvarez-Blasco 2006Leibel 2006Marquez 2008Shaw 2008Bhattacharya 2009
036
346
323650
104264
303
702
722170
286116
0.6%0.1%0.6%6.6%0 7%
0.31 [0.02, 6.09]4.49 [0.22, 91.35]3.05 [0.72, 12.82]1.50 [0.92, 2.45]1 33 [0 26 6 67]
20062006200820082009Bhattacharya 2009
Moini 2009
Total (95% CI)Total events
64
1063
264273
12105
20
1274
116276
56959
0.7%0.1%
100.0%
1.33 [0.26, 6.67]9.23 [0.49, 172.33]
4.43 [4.06, 4.82]
20092009
Total eventsHeterogeneity: Chi² = 26.82, df = 12 (P = 0.008); I² = 55%Test for overall effect: Z = 33.93 (P < 0.00001)
1063 1274
0.01 0.1 1 10 100Lower risk for PCOS Higher risk for PCOS
Moran , L. et al. 2010

Prevalence of T2DM in PCOS vs. Controls (BMI matched)
Study or SubgroupRajkhowa 1996
Events10
Total72
Events1
Total39
Weight6.9%
M-H, Fixed, 95% CI6.13 [0.75, 49.80]
Year1996
PCOS Control Odds Ratio Odds RatioM-H, Fixed, 95% CI
Yarali 2001Dunaif 2001Phy 2004Faloia 2004
1343
30147
50
0021
30121820
2.9%2.5%3.0%8 3%
3.10 [0.12, 79.23]7.61 [0.35, 163.82]10.67 [1.31, 86.93]1 21 [0 12 12 40]
2001200120042004Faloia 2004
Sawathiparnich 2005Diamanti-Kandarakis 2005Alvarez-Blasco 2006
3014
506
2932
1308
206
2272
8.3%20.0%3.3%
26.6%
1.21 [0.12, 12.40]0.08 [0.00, 1.96]
2.37 [0.09, 60.96]1.14 [0.32, 4.11]
2004200520052006Alvarez Blasco 2006
Attuoua 2008
Total (95% CI)
418
32107
347
85
72100
319
26.6%26.5%
100.0%
1.14 [0.32, 4.11]3.84 [1.37, 10.79]
2.54 [1.44, 4.47]
20062008
Total eventsHeterogeneity: Chi² = 9.97, df = 8 (P = 0.27); I² = 20%Test for overall effect: Z = 3.22 (P = 0.001)
44 20
0.01 0.1 1 10 100Lower risk for PCOS Higher risk for PCOS
Moran,L. et. al. 2010

PCOS & Psycho/SocialPsycho/Social
FactorsFactors

Odd f P iti D i S iOdds of Positive Depression Screen in Women with PCOS vs. Controls
Dokras et al 2010

Odds of Depression Score Positive PCOS vs. Controls BMI Matched
Dokras et al 2010Dokras et al 2010

PCOSPCOS &&
DyslipidemiaDyslipidemia

Lipid and apolipoprotein abnormalities in hirsute womenLipid and apolipoprotein abnormalities in hirsute women
PCOS (n=47)• 31years
Non PCOS (n=15) • 32 yearsy
• Waist 94.7 cm• BMI = 33.9
y• Waist 68.9cm • BMI = 21.6
• Higher Trig, lower HDL-cholesterol , higher non HDL cholesterol,
•• higher APO CIII*higher APO CIII*
Wild RA 1992

More Atherogenic Serum Lipoprotein Profile Is Present in Women with Polycystic Ovary Syndrome: A Case-ControlWomen with Polycystic Ovary Syndrome: A Case Control StudyPCOS (n=577) 29 yrs BMI 27
Non PCOS (n=295) 33 years BMI 24 4BMI 27
TG (mg/dL) 95
BMI 24.4
TG (mg/dL) 82Cholesterol (mg/dL)
196
*HDL-Chol 45
Cholesterol (mg/dL)
178
HDL Chol (mg/dL)
45
+LDL-Chol (mg/dL)
125
HDL-Chol(mg/dL) 56
LDL-Chol (mg/dL) 106(mg/dL)**Non HDL Chol (mg/dL)
151Non HDL Chol (mg/dL)
123
Apo AI (mg/dL) 146*Apo- AI (mg/dL) 118Apo B (mg/dL) 81* /
Apo- AI (mg/dL) 146
Apo B (mg/dL) 79
Apo B/Apo A 55*Apo B/Apo A .69 Apo B/Apo A .55+Calculated LDL Valkenburg R et al 2008

Lipids and lipoprotein subfractions in women with PCOS: relationship to metabolic and endocrine parameters
PCOS (n=52) Non PCOS (n=14)COS ( 5 ) o COS ( )
• BMI= 31.2• BMI = 29.4 matched Age 28 2 rs • Age = 31.2 yrs
• Waist = 82.9 cm • FAI = 3 8
• Age = 28.2 yrs• Waist = 88 cm • FAI = 8.8 • FAI = 3.8
• *Triglycerides (mmol/L)=0.9• HDL Cholesterol = 1.31
• *Triglycerides (mg/dL)=1.3• HDL Cholesterol = 1.19
•• Hepatic lipase (mmol Hepatic lipase (mmol FA/ l/h) 10 2FA/ l/h) 10 2
•• *Hepatic lipase (mmol *Hepatic lipase (mmol FA/ml/h)= 14.3FA/ml/h)= 14.3
FA/ml/h) = 10.2FA/ml/h) = 10.2
•• LDL III (mg/dL) = 25LDL III (mg/dL) = 25•• *LDL III (mg/dL) 38 *LDL III (mg/dL) 38
LDL III (mg/dL) 25LDL III (mg/dL) 25
Pirwany IR et al 2001

LDL classes in 30 PCOS patients and 24 weight-matched controls
Bernies et al 2007

Dyslipidemia of PCOSDyslipidemia of PCOS
FFA/Insulin resistance Hypertriglyceridemia
VLDLLPL
ApoCII/ApoCIII
Hypertriglyceridemia
TGTG
HTLP
IDL
LDL
HTLP
LPLHDL
Hepatic Lipase
LDLHDL
PlaqueSmall-denseLow HDL-C
AndrogensEstrogens
IR

Apolipoprotein B & AApolipoprotein B & A--I SurrogatesI SurrogatesApoB Lipoproteins ApoA-I Lipoproteins
VLDL-CHDL-C
LDL-CVLDL C LDL C
Total CholesterolTotal Cholesterol
TC is an apoB surrogateTC is an apoB surrogate HDLHDL--C is the lipid C is the lipid t f At f A IIsurrogate of apoAsurrogate of apoA--II
TC/HDL‐C or LDL‐C/HDL‐C ratios / /are apoB/A‐I surrogates

HDL-C PCOS vs. Controls (mg/dL)
Wild et al 2010

PCOS vs. Controls Triglycerides (mg/dL)
Wild et al 2010

Non-HDL-C PCOS vs. Controls (mg/dL)
Wild et al 2010

LDL -C in PCOS vs. controls (mg/dL)
Wild et al 2010

Inflammatory Markers in PCOSn=108 PCOS vs. n=75 normal
BMI 27 BMI 27 BMI 27 BMI 27BMI < 27 Kg/m2
BMI < 27 Kg/m2
BMI > 27 Kg/m2
BMI > 27 Kg/m2
Controls PCOS Controls PCOS(n=35) (n=56) (n=40) (n=52)
hs-CRP( /L)
104+0.25 1.67+0.23* 1.15+0.22 3.45 +0.35**CRP(mg/L)
IL-6(pg/mg/L) 1.25+0.31 1.52+0.34* 1.34+0.35 6.45+2.27**
TNF-a 3.66+1.02 3.72+1.26 3.76+1.04* 6.87+1.12**
Samy N et al 2009

Inflammatory Markers in PCOSInflammatory Markers in PCOS
Mohamidin AM 2010

PCOSPCOS&&
CVD

Carotid Intimal Thickness in PCOS
Talbott et al 2009

PCOS & Coronary Artery CalciumPCOS & Coronary Artery Calcium
Author, Year Study Size
Study Population/ Study Design
Control for Age and BMI
Outcome Measure/ Results
Design Analysis Design Analysis
Shroff, 2007
24 cases24 controls
Obese, premenopausal, clinic population[ ti l]
Frequency match for age & BMI
None Prevalence of CAC (>0)OR=5.5 (95% CI=1.03, 29.45) p<0.03
[cross‐sectional]
Christian, 2003
36 cases71 controls
Premenopausal, age 30‐45 [cross‐sectional]
Frequency match for age & BMI
Age & BMI adjusted
Prevalence of CAC (>0)OR=1.99 (95% CI=0.68,5.82) p=0.21 (NS) [cross sectional] age & BMI p 0.21 (NS)
Talbott, 2004
61 cases85 controls
White women, BMI < 35 [prospective]
BMI restricted (<35)
Age & BMI adjusted
Prevalence of CAC (>0)OR=2.31 (95% CI=1.00, 5.33) p=0.049
Talbott, 2008
149 cases166 controls
All racesAll BMI [cross‐sectional]
Age & BMI adjusted
Prevalence of CAC >10OR=1.90 (95% CI=1.04, 3.48) p=0.037
NICHD Criteria was used to diagnose PCOS cases in all studies.
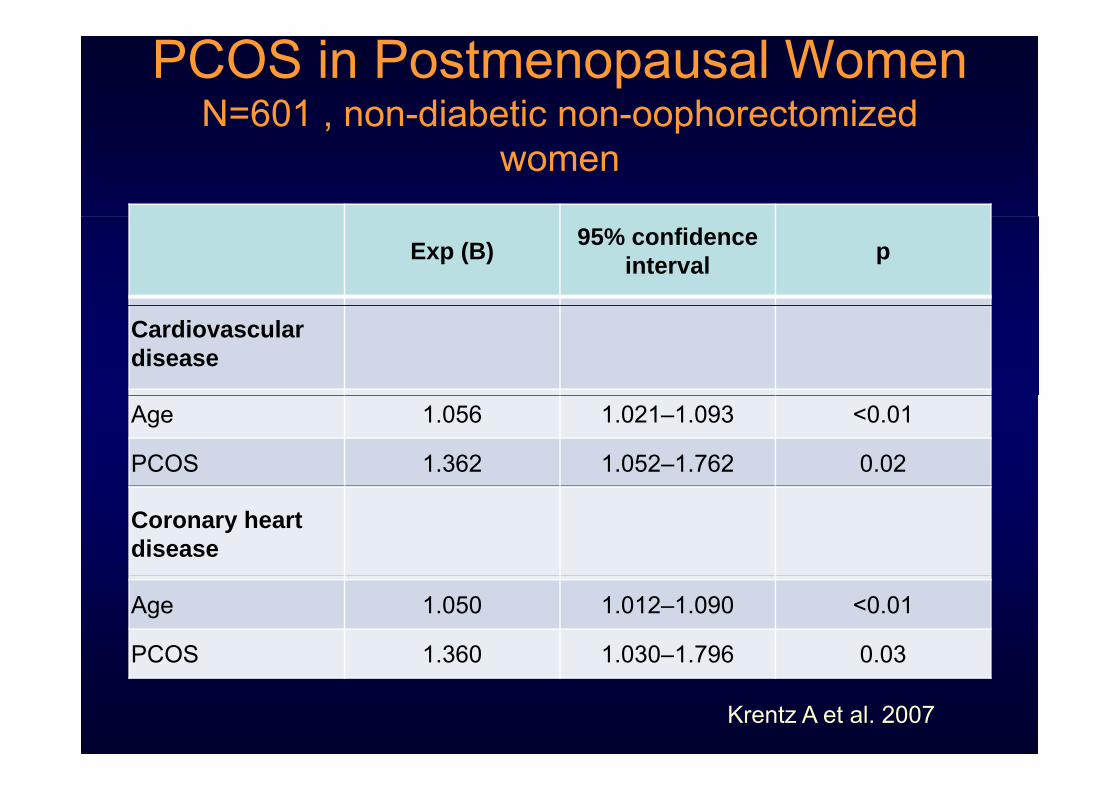
PCOS in Postmenopausal Women N=601 , non-diabetic non-oophorectomized 60 , o d abet c o oop o ecto ed
women
Exp (B) 95% confidence interval p
Cardiovascular disease
Age 1.056 1.021–1.093 <0.01
PCOS 1.362 1.052–1.762 0.02
Coronary heart disease
Age 1.050 1.012–1.090 <0.01
PCOS 1.360 1.030–1.796 0.03
Krentz A et al. 2007

Cumulative Unadjusted CV Death or MI Free Cumulative Unadjusted CV Death or MI Free Survival in Postmenopausal WomenSurvival in Postmenopausal Women±± ClinicalClinicalSurvival in Postmenopausal Women Survival in Postmenopausal Women ±± Clinical Clinical
Features of PCOSFeatures of PCOS
Shaw et al 2008Shaw et al 2008

First Author
Date Journal N (S.D.)Age range
Endpoints Criteria for PCOS
P value Odds ratioC.I.
1. Pi i t
1998 J Clin E id
786 women di d b t 20 74
Follow‐up l955‐l997 I h i (CHD) H t
NIH n.s. Ischemic heart di SMR 1 40Pierpoint Epid diagnosed between
l930‐l97920‐74 Ischemic (CHD) Heart
Disease, Diabetes Mortality
disease SMR= 1.40 (.75‐2.40) ;Diabetes: 3.5 (1.5‐8.4)
2. Cibula 2000 Human Reproduc.
28 cases752 controls
51.9 (4.64)(45 – 59)
6/28 ( 21%) cases with CHD compared
NIH P<.001 4.2 p ( ) p
to 38/752 or (5%)controls
3. Wild 2000 J. Clinical Endocrin.
390 PCOS and 1060 age matched controls
56.7(38‐98)
CHD and cerebrovascular disease endpoints
Rotterdam n.s. for CHD
4.7% CHD cases and 4.0% controls p=.6CVD: 3 1% in casescontrols disease endpoints CVD: 3.1% in cases versus 1.2%
4. Elting 2001 Human Repro
346 casescontrol rates from general population
38.7 (30.3 – 55.7)
CHD endpoints in 0.9% PCOS women
NIH n.s CHD Prevalence rates:.9 (.2‐2.6) in cases .7 (.5‐.9) in controls
5. Talbott 2004 Minerva Ginecol
127 PCOS white cases; 142 white controls seen in l997 CHARM II
Mean age: 42.8(6.3) cases and 43 4 (6 25)
CHD endpoints: MI, CA bypass surgery, angina pectoris))
NIH P<.05 1 MI, 1 CA bypass, 3 angina pectoris among cases OR=5 86l997 CHARM II
f‐up 43.4 (6.25)(30‐62)
OR=5.86
6. Shaw2 2008 JCEM 390 women : cohort study
62.5 10 CHD death or on fatal Myocardial Infarction
Premenopausal hx of irregular Menses &
P <.001 Hazard ratio: 1.61 (1.22‐2.12)
current biochemical evidence of hyperandrogenemia.
7 2002 JCEM 82 439 R 47 3 F t l d f t l History of P< 05 1 25(1 07 1 47 NF7. Solomon1
2002 JCEM 82,439 women Range:47.3‐48.6 at f‐up
Fatal and non fatal (NF) CHD
History of premenopausal menstrual irregularity
P< .05 1.25(1.07‐1.47 NF1.67 (1.35‐2.06 fatal
1 Solomon: menstrual cycle irregularity at age 20-35 baseline & free of CHD at baseline2 Shaw : top quartile of hyperandrogenemia and menstrual cycle irregularity

AE-PCOSAE PCOS STATEMENTSTATEMENT

Prevention of CVD in PCOS Prevention of CVD in PCOS 2010 Consensus Statement (AE2010 Consensus Statement (AE--PCOS Society)PCOS Society)2010 Consensus Statement (AE2010 Consensus Statement (AE--PCOS Society)PCOS Society)
•• At risk At risk
–– obesity (especially abdominal), smoking, hypertension obesity (especially abdominal), smoking, hypertension –– dyslipidemia (increased LDLdyslipidemia (increased LDL--C and/or nonC and/or non--HDLHDL--C) C) y p (y p ( ))–– subclinical vascular disease, subclinical vascular disease, –– IGTIGTIGTIGT–– FH of premature CVD (<55 yrs, male relative; <65 yrs, FH of premature CVD (<55 yrs, male relative; <65 yrs,
female relative)female relative)female relative)female relative)•• At high riskAt high risk
–– MBS MBS –– T2DM, overt vascular or renal diseaseT2DM, overt vascular or renal disease
Wild et al 2010
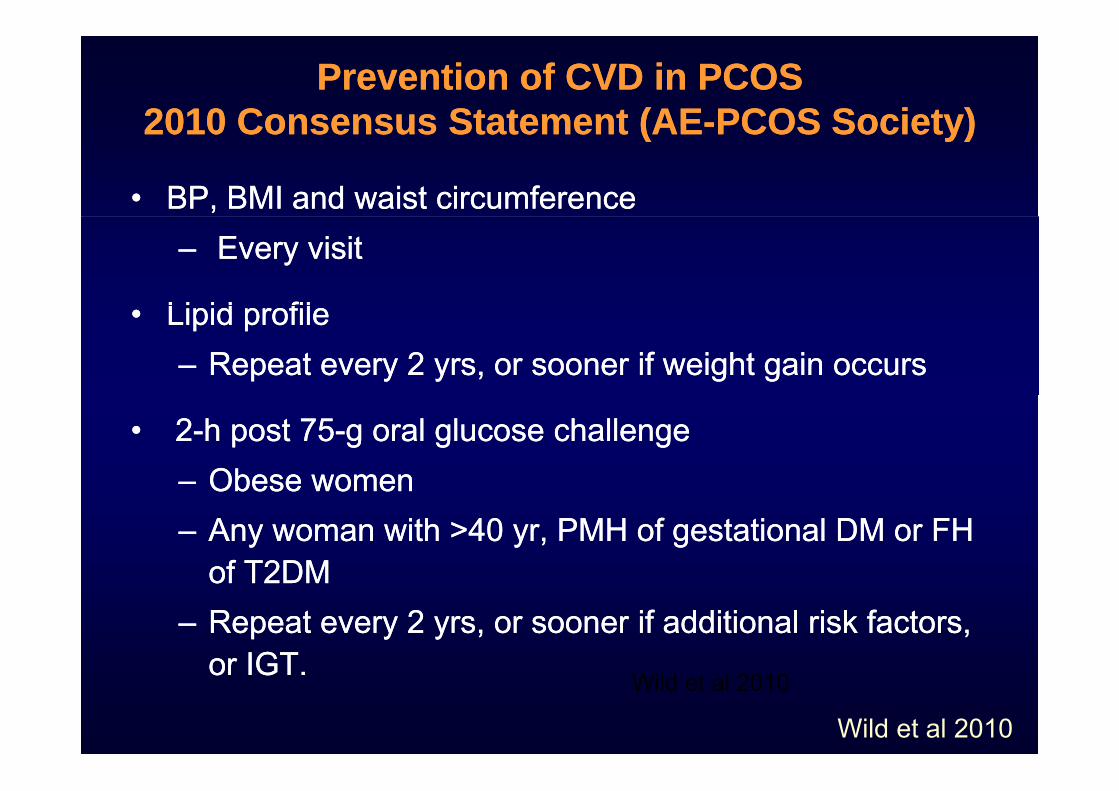
Prevention of CVD in PCOS Prevention of CVD in PCOS 2010 Consensus Statement (AE2010 Consensus Statement (AE--PCOS Society)PCOS Society)2010 Consensus Statement (AE2010 Consensus Statement (AE--PCOS Society)PCOS Society)
•• BP, BMI and waist circumferenceBP, BMI and waist circumference–– Every visitEvery visit
Li id filLi id fil•• Lipid profileLipid profile–– Repeat every 2 yrs, or sooner if weight gain occursRepeat every 2 yrs, or sooner if weight gain occurs
•• 22--h post 75h post 75--g oral glucose challengeg oral glucose challenge–– Obese womenObese womenObese womenObese women–– Any woman with >40 yr, PMH of gestational DM or FH Any woman with >40 yr, PMH of gestational DM or FH
of T2DMof T2DMof T2DMof T2DM–– Repeat every 2 yrs, or sooner if additional risk factors, Repeat every 2 yrs, or sooner if additional risk factors,
or IGTor IGTor IGT.or IGT.
Wild et al 2010
Wild et al 2010

Prevention of CVD in PCOSPrevention of CVD in PCOS
Lifestyle ModificationLifestyle Modification–– Positive Multiple factor approach simultaneously is Positive Multiple factor approach simultaneously is p pp yp pp y
recommended coupled with understanding stages of change recommended coupled with understanding stages of change •• PrePre--contemplation,contemplation,preparation,action,maintenance,relapsecontemplation,contemplation,preparation,action,maintenance,relapse
–– Hypocaloric diet (i.e., 500 Kcal/day deficit) with reduced Hypocaloric diet (i.e., 500 Kcal/day deficit) with reduced glycemic load to decrease weight by 5%glycemic load to decrease weight by 5%--10%10%
E i ith th di d di l li it tiE i ith th di d di l li it ti–– Exercise with orthopedic and cardiovascular limitationsExercise with orthopedic and cardiovascular limitations•• Individualized exercise program for optimal complianceIndividualized exercise program for optimal compliance•• Walking (10 000 steps = 30 minutes daily exercise; 15 000 stepsWalking (10 000 steps = 30 minutes daily exercise; 15 000 stepsWalking (10,000 steps 30 minutes daily exercise; 15,000 steps Walking (10,000 steps 30 minutes daily exercise; 15,000 steps
usually needed for weight loss)usually needed for weight loss)
–– Smoking cessationSmoking cessation
–– Medication as needed to reach targetsMedication as needed to reach targets
Thessaloniki ESHRE/ASRM-Sponsored PCOS Workshop 2008Wild et al 2010

CONCLUSIONCONCLUSION

INTERHEART study: case-control study 9 risk factors accounted for
94% of the Population Attributable Risk for myocardial infarction
Risk Odds Protective OddsPCOS at RISK or HIGH RISK
Risk Odds
Smoking 2·86 (2·36 3·48)
Protective Odds
Fruits/Vegs 0·58 (0·48 ·71) Smoking 2·86 (2·36–3·48) Diabetes 4·26 (3·51–5·18) Hypertension 2·95 (2·57–3·39)
Fruits/Vegs 0 58 (0 48– 71) Alcohol 0·41 (0·32–·53) Exercise 0·48 (0·39–·59) yp ( )
Abdominal obesity 2·26 (1·90–2·68) Psycho/Social 3·49 (2·41–5·04)
( )
ApoB/ApoA1 4·42 (3·43–5·70)
Yusuf, S. et al 2004