p.c.n. and arena meet hotelthe most known flowchart to be applied for services organization is the...
TRANSCRIPT
P.C.N. and Arena Meet Hotel
Luis A. J. Borges Colorado State University – Pueblo
Faruq Salawu Adedeji
Colorado State University – Pueblo
Mehmet Ates Colorado State University – Pueblo
Shane Ellis
Colorado State University – Pueblo
Kelvin Oseme Colorado State University – Pueblo
Fatih Senturk
Colorado State University – Pueblo
This paper deals with the analysis of a hotel facility to determine opportunity for improvements using the Process Chain Network (P.C.N.) in combination with the Arena simulation software. The information presented is based on the authors’ personal experiences as guests at hotels, and presented in a final project assignment in the MBA Production and Operations Management course. INTRODUCTION
According to Sampson (2011) Process Chain Network implies a process that links entities into a network that visualizes business processes, networks, and managerial issues. It is a flowchart that you can use in a service organization. This paper applies this tool to analyze a hotel. It can be used to any kind of hotel, and in any service company.
Bar-Yam et al. (2002) state that approaches to teaching can be categorized according to major educational goals: (a) the transmission of knowledge by the professors to the students; and (b) the facilitation of students’ autonomous learning and self-expression. In addition, the preparation of instructor can be more differentiated teaching, there could be more divergent use of teaching resources. They can teach with good results by persons other than the traditional classroom instructors.
D’Angelo et al. (1969) state that constructivist pedagogy proposes that instruction must take students' prior ideas, experiences, and knowledge into account while providing opportunities for students to
Journal of Applied Business and Economics Vol. 18(1) 2016 51
construct new understanding. In this paper, the authors brought the own experience and ideas to solve the problem related to a project of improve the hotel booking, check-in, and checkout using the Process Chain Network (P.C.N.)
Whenever one starts to analyze the flowchart, one can find several opportunities for improvement. One of them it is related to waiting lines. In that case, the authors applied the simulation software Arena. According to arenasimulation.com (2015), discrete event simulation describes a process with a set of unique, specific events in time. These flexible, activity-based models can be effectively used to simulate almost any process.
In addition to those waiting line problems, there are some other issues encountered by the team introduce some logic improvements by eliminating some activities, by changing the flow of the process. Those changes are visualized in the graphics in the current situation and in the proposed recommendations. THEORETICAL BACKGROUND
The most known flowchart to be applied for services organization is the Service Blueprint (Heizer & Render, 2011). There is the way to draw the activities involved in a service company. Sampson (2011) introduced the Process Chain Network – P.C.N. changing the Service Blueprint by adding some other options to analyze the processes, by creating three regions of a process domain: (1) direct interaction, (2) surrogate interaction, and (3) independent processing.
Direct interaction means that people are interaction with people directly. Surrogate interaction is when an entity is performing process steps with a non-human resource of another entity such as ordering supplies via a supplier website. Independent processing is when processes take place with neither of the previous interactions such as cleaning a facility in a hospital (Sampson, 2001, 2011).
According to arenasimulation.com (2015), business process simulation software is an effective way to evaluate the full implications of business decisions before they are put into practice. This software was used for the solutions of waiting line problems in the analysis of the hotel, in the hospitality industry. CURRENT SITUATION OF THE P.C.N. SCENARIO
Our case is to make a PCN diagram for a hotel with limited resources. The booking, check-in and checkout processes are as follows:
The customer calls the hotel, the hotel receptionist checks for availability of room for the customers intended date of check-in and reservation is made.
On check-in the receptionist collects some of its customer’s information, gives the key of the reserved room to customer and the hotel attendant leads the customer to the room.
On checkout, the hotel attendant inspects the room and the receptionist prepares the bill. Assumptions
There is only one server (receptionist) in the hotel and multiple attendants. It takes between 8-12mins to attend to a customer The customers are couples coming for honeymoon The time between arrival follows an exponential distribution with a mean of 10minutes The hotel Operates 24hrs a day and has a capacity of 200 rooms.
Method and Procedure
We identified a business process in order to analyze two entities. Then we constructed some PCN Diagrams for the selected process. First step involved the customer need and last step had the need resolved. Hence the resulting PCN diagrams were formulated below.
52 Journal of Applied Business and Economics Vol. 18(1) 2016
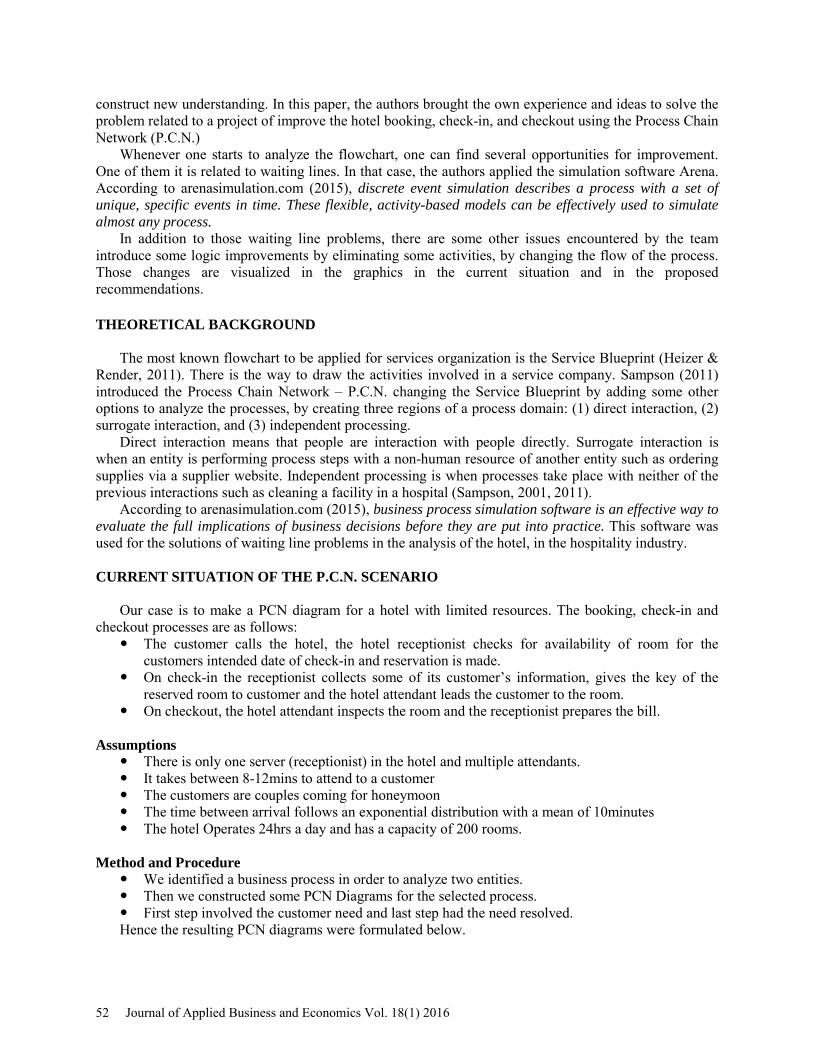
DEVELOPMENT OF THE P.C.N.
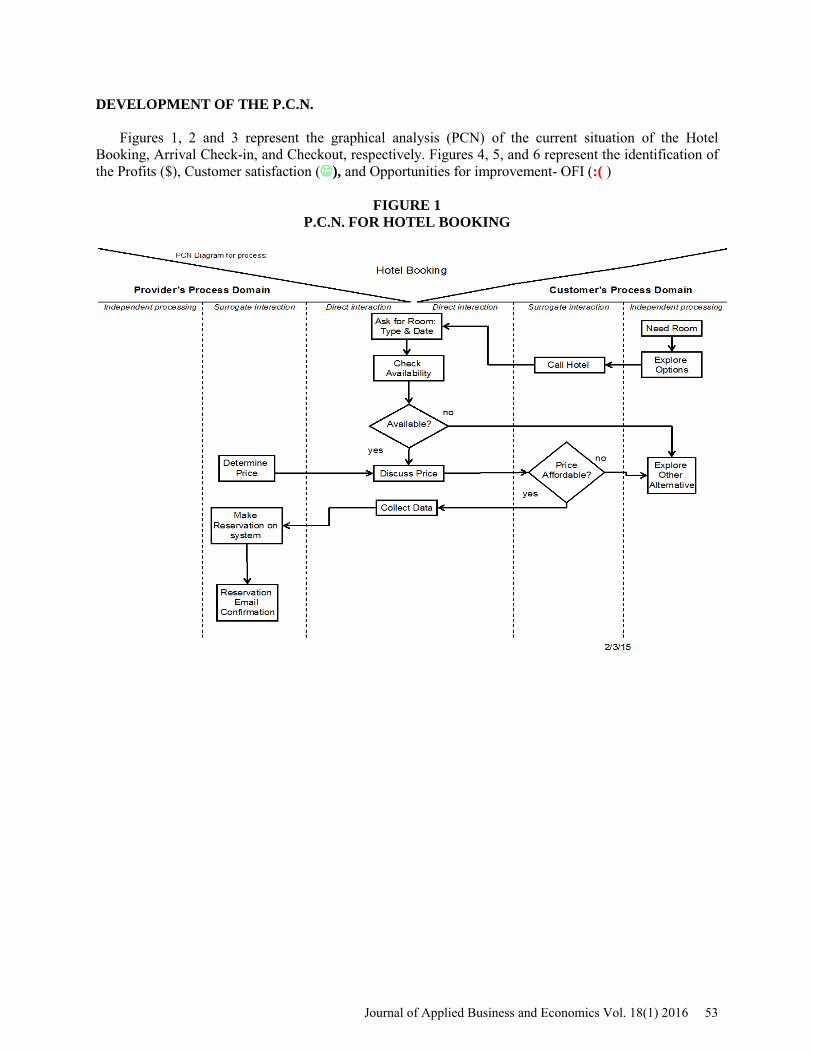
Figures 1, 2 and 3 represent the graphical analysis (PCN) of the current situation of the Hotel Booking, Arrival Check-in, and Checkout, respectively. Figures 4, 5, and 6 represent the identification of the Profits ($), Customer satisfaction (), and Opportunities for improvement- OFI (:( )
FIGURE 1 P.C.N. FOR HOTEL BOOKING
Journal of Applied Business and Economics Vol. 18(1) 2016 53
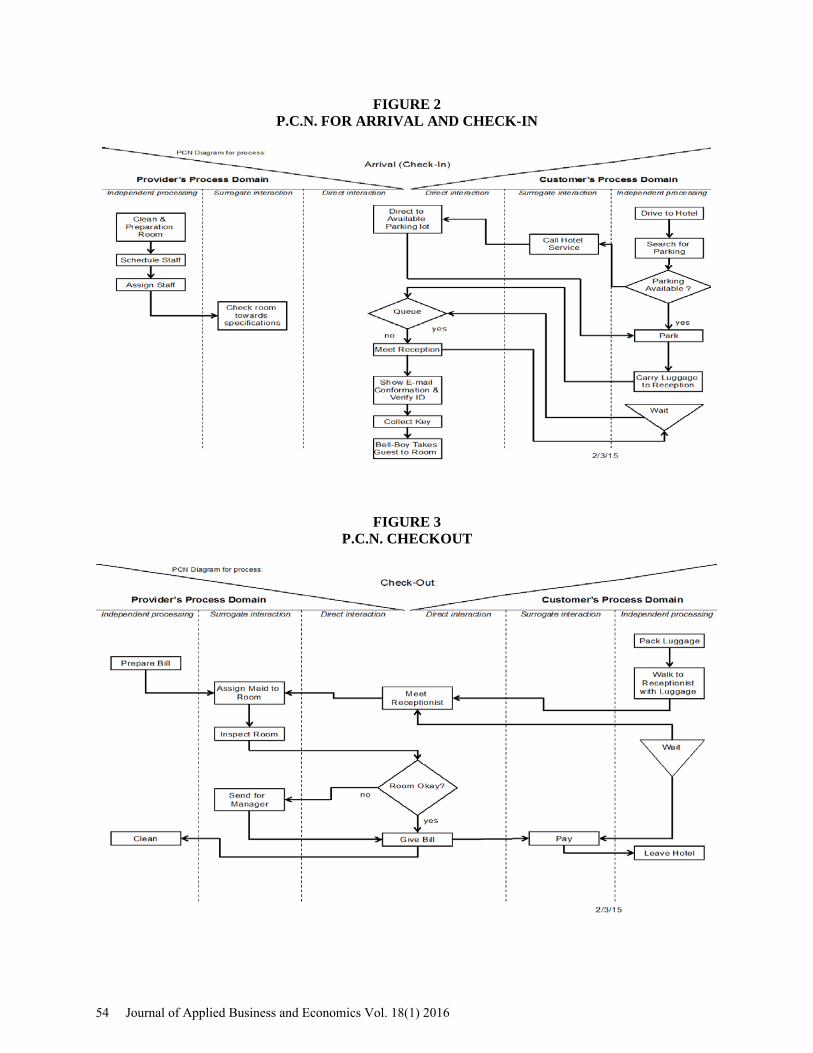
FIGURE 2 P.C.N. FOR ARRIVAL AND CHECK-IN
FIGURE 3 P.C.N. CHECKOUT
54 Journal of Applied Business and Economics Vol. 18(1) 2016
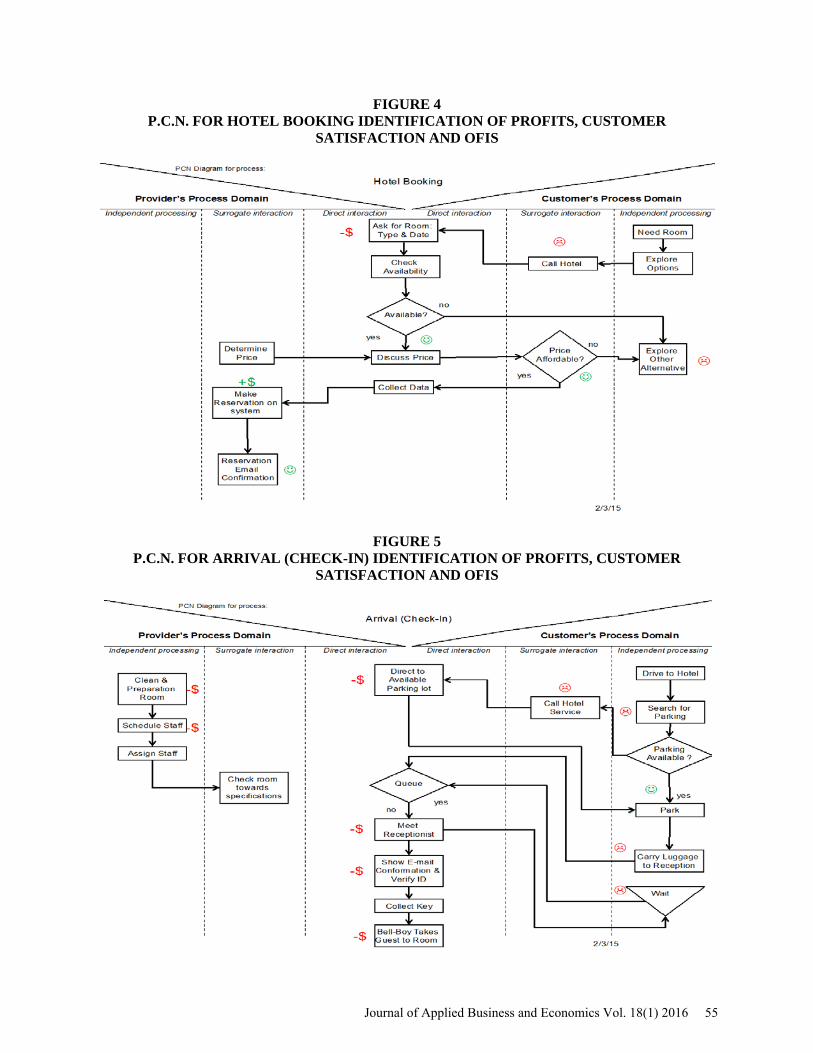
FIGURE 4 P.C.N. FOR HOTEL BOOKING IDENTIFICATION OF PROFITS, CUSTOMER
SATISFACTION AND OFIS
FIGURE 5 P.C.N. FOR ARRIVAL (CHECK-IN) IDENTIFICATION OF PROFITS, CUSTOMER
SATISFACTION AND OFIS
Journal of Applied Business and Economics Vol. 18(1) 2016 55
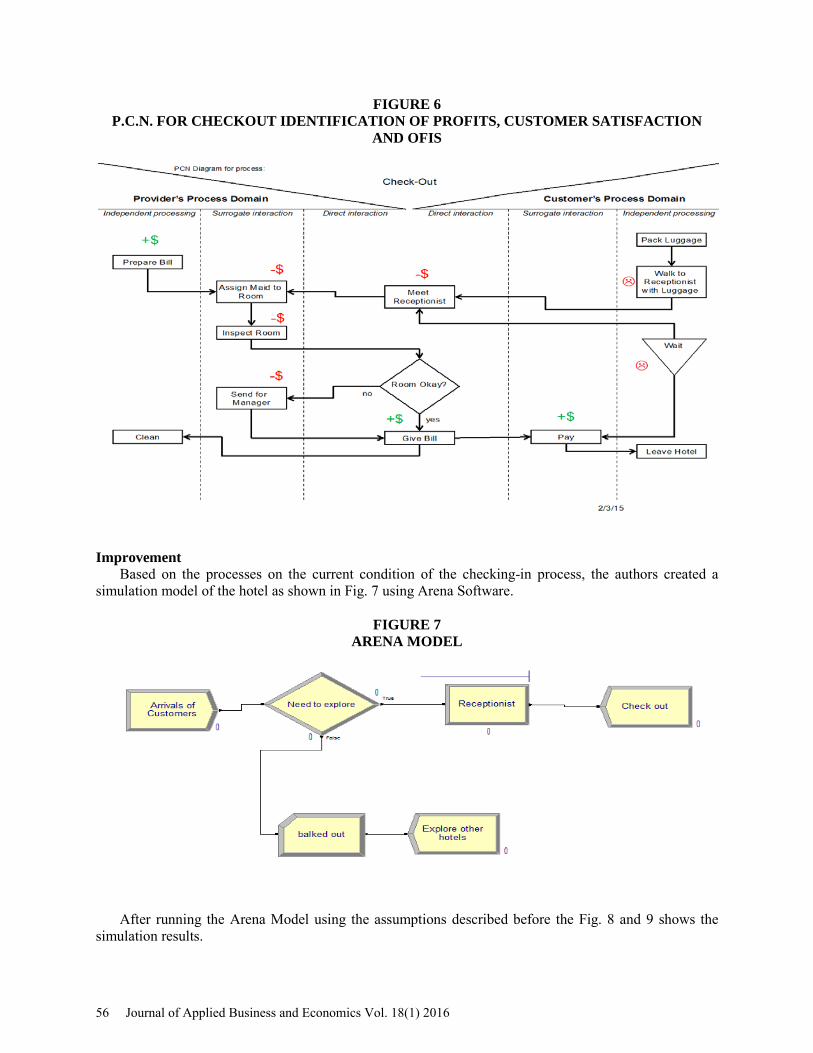
FIGURE 6 P.C.N. FOR CHECKOUT IDENTIFICATION OF PROFITS, CUSTOMER SATISFACTION
AND OFIS
Improvement
Based on the processes on the current condition of the checking-in process, the authors created a simulation model of the hotel as shown in Fig. 7 using Arena Software.
FIGURE 7 ARENA MODEL
After running the Arena Model using the assumptions described before the Fig. 8 and 9 shows the simulation results.
56 Journal of Applied Business and Economics Vol. 18(1) 2016
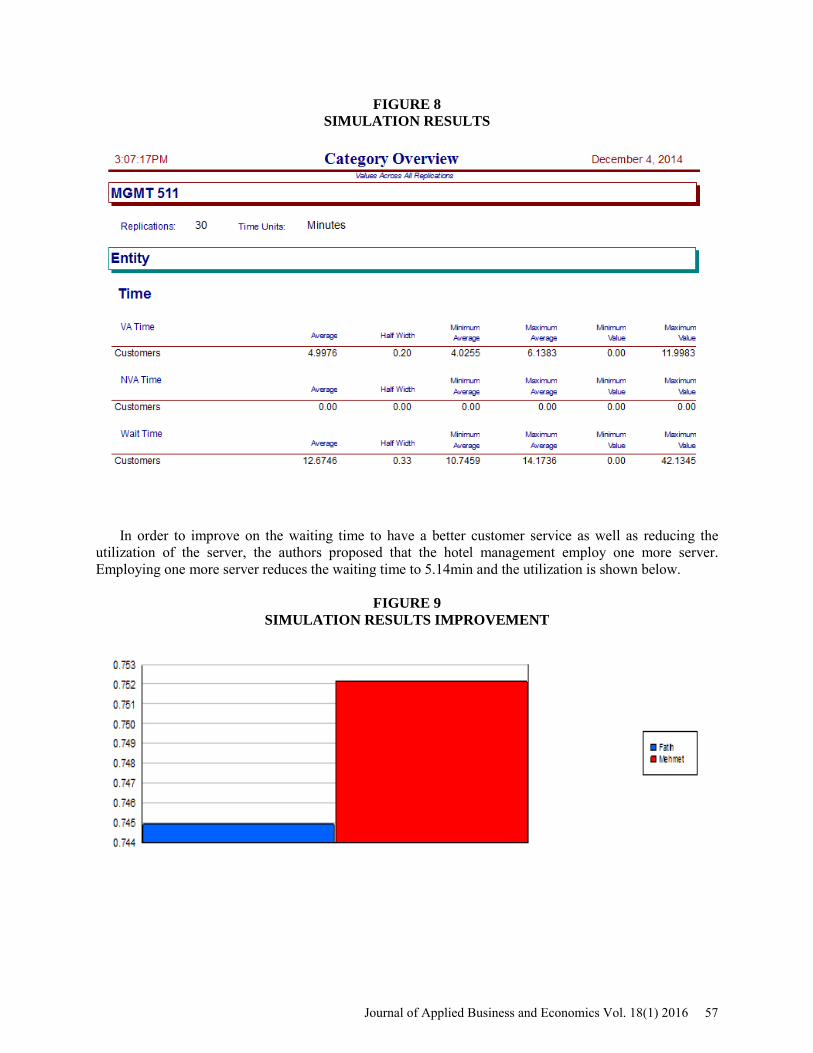
FIGURE 8 SIMULATION RESULTS
In order to improve on the waiting time to have a better customer service as well as reducing the utilization of the server, the authors proposed that the hotel management employ one more server. Employing one more server reduces the waiting time to 5.14min and the utilization is shown below.
FIGURE 9
SIMULATION RESULTS IMPROVEMENT
Journal of Applied Business and Economics Vol. 18(1) 2016 57
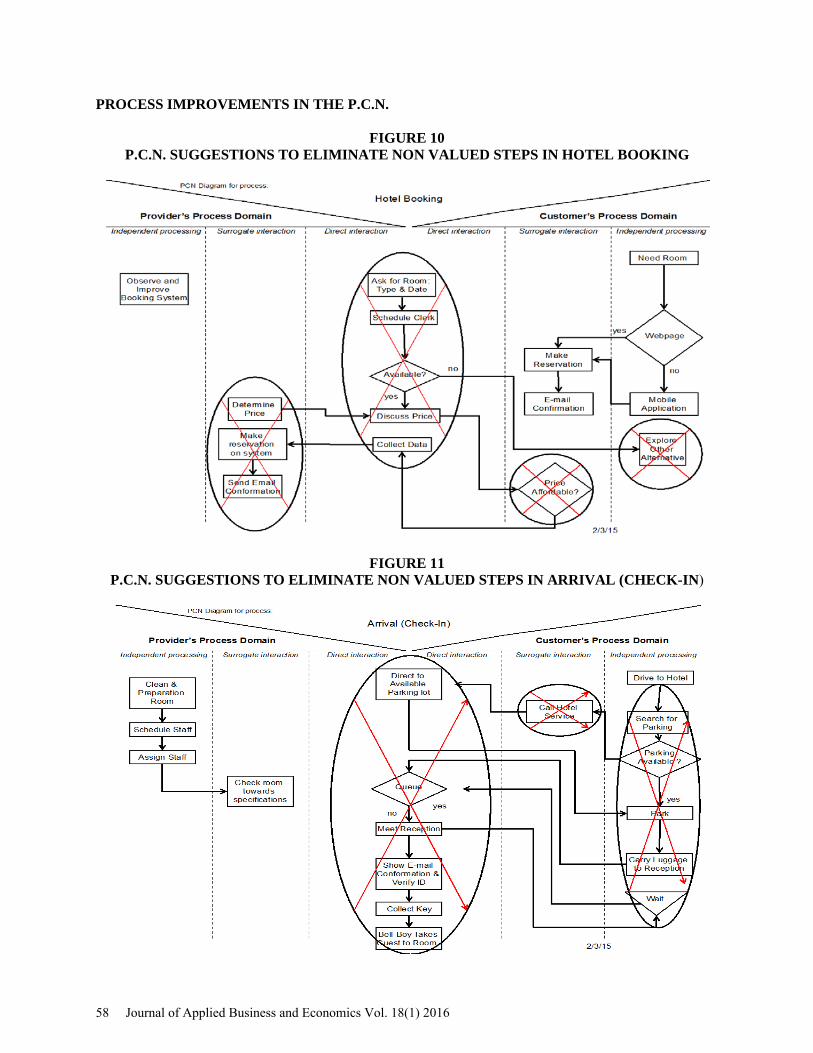
PROCESS IMPROVEMENTS IN THE P.C.N.
FIGURE 10 P.C.N. SUGGESTIONS TO ELIMINATE NON VALUED STEPS IN HOTEL BOOKING
FIGURE 11 P.C.N. SUGGESTIONS TO ELIMINATE NON VALUED STEPS IN ARRIVAL (CHECK-IN)
58 Journal of Applied Business and Economics Vol. 18(1) 2016
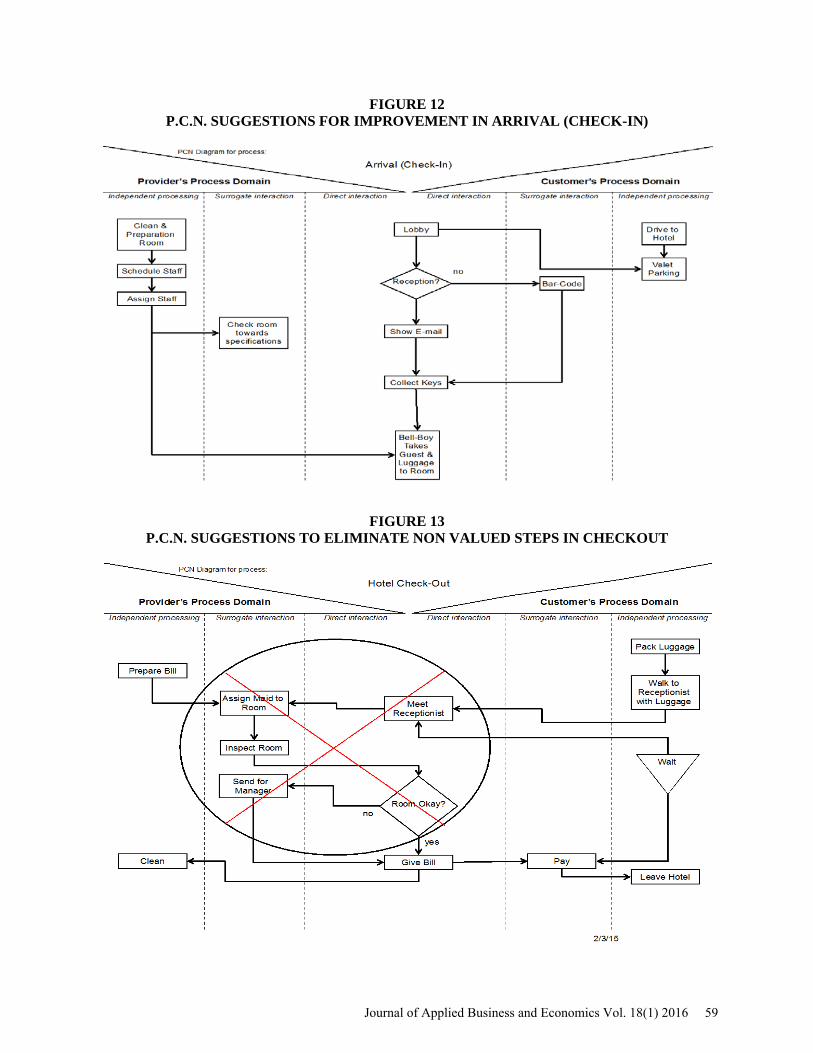
FIGURE 12 P.C.N. SUGGESTIONS FOR IMPROVEMENT IN ARRIVAL (CHECK-IN)
FIGURE 13 P.C.N. SUGGESTIONS TO ELIMINATE NON VALUED STEPS IN CHECKOUT
Journal of Applied Business and Economics Vol. 18(1) 2016 59
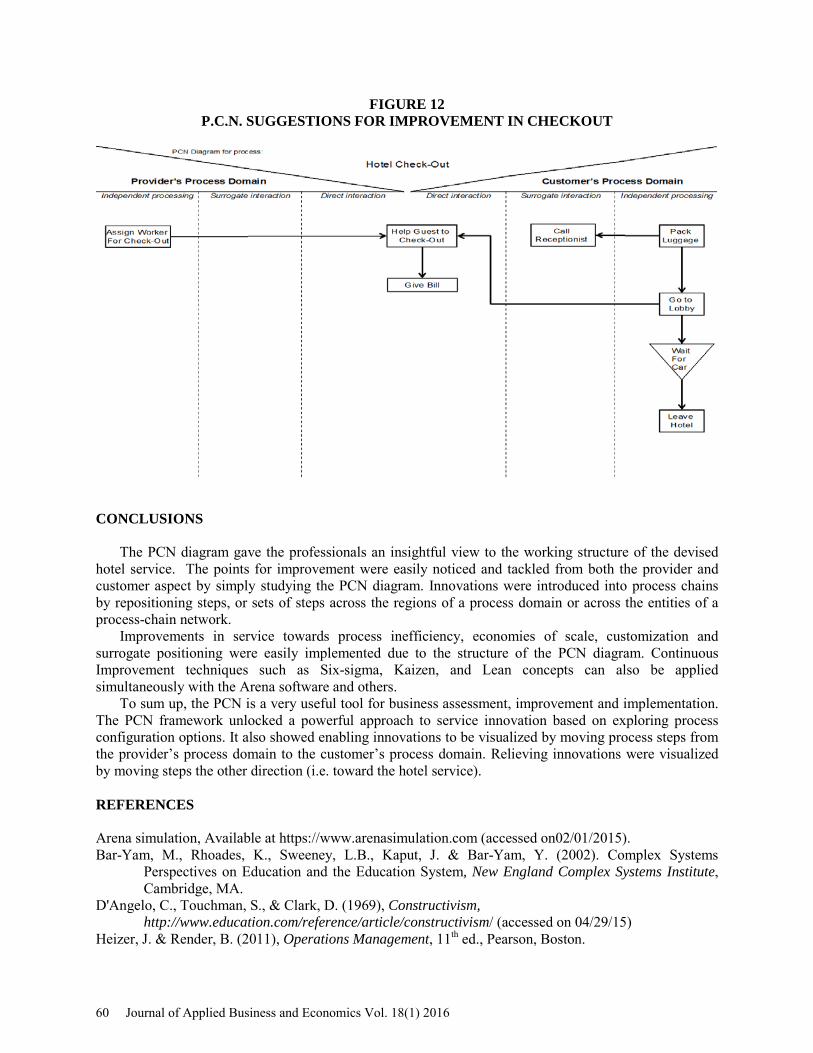
FIGURE 12 P.C.N. SUGGESTIONS FOR IMPROVEMENT IN CHECKOUT
CONCLUSIONS
The PCN diagram gave the professionals an insightful view to the working structure of the devised hotel service. The points for improvement were easily noticed and tackled from both the provider and customer aspect by simply studying the PCN diagram. Innovations were introduced into process chains by repositioning steps, or sets of steps across the regions of a process domain or across the entities of a process-chain network.
Improvements in service towards process inefficiency, economies of scale, customization and surrogate positioning were easily implemented due to the structure of the PCN diagram. Continuous Improvement techniques such as Six-sigma, Kaizen, and Lean concepts can also be applied simultaneously with the Arena software and others.
To sum up, the PCN is a very useful tool for business assessment, improvement and implementation. The PCN framework unlocked a powerful approach to service innovation based on exploring process configuration options. It also showed enabling innovations to be visualized by moving process steps from the provider’s process domain to the customer’s process domain. Relieving innovations were visualized by moving steps the other direction (i.e. toward the hotel service). REFERENCES Arena simulation, Available at https://www.arenasimulation.com (accessed on02/01/2015). Bar-Yam, M., Rhoades, K., Sweeney, L.B., Kaput, J. & Bar-Yam, Y. (2002). Complex Systems
Perspectives on Education and the Education System, New England Complex Systems Institute, Cambridge, MA.
D'Angelo, C., Touchman, S., & Clark, D. (1969), Constructivism, http://www.education.com/reference/article/constructivism/ (accessed on 04/29/15)
Heizer, J. & Render, B. (2011), Operations Management, 11th ed., Pearson, Boston.
60 Journal of Applied Business and Economics Vol. 18(1) 2016
Sampson, S. E. (2001). Understanding Service Businesses: Applying principles of the Unified Services Theory, 2nd. ed.,: John Wiley & Sons, New York.
Sampson, S. E. (2011). Introduction to P.C.N. Analysis, In: Visualizing Service Operations by Dr. Scott Sampson, Journal of Service Research, 15(2), May 2012, pp. 182-198
Journal of Applied Business and Economics Vol. 18(1) 2016 61