pcmark 7 whitepaper
TRANSCRIPT

PCMark 7 Whitepaper
Version: 1.0 May 2011
Thank you for using Futuremark products.

Minimum system requirements All systems that meet the minimum requirements are able to run the tests in the PCMark test and obtain a PCMark score.
OS: Microsoft Windows 7 Processor: 1 GHz or faster 32-bit (x86) or 64-bit (x64) processor Memory: 1 GB for x86 systems or 2GB for x64 systems Graphics: DirectX 9 compatible graphics adapter Display: 1024x600 minimum display resolution Hard drive: 10 GB free space, NTFS file system
Recommended system requirements Some tests require more powerful hardware. For the complete PCMark experience and the ability to run all tests use a PC that meets or exceeds the recommended system requirements.
OS: Windows 7 Home Premium or higher Processor: 1 GHz or faster 32-bit (x86) or 64-bit (x64) processor Memory: 1 GB for x86 systems or 2GB for x64 systems Graphics: DirectX 11 compatible graphics adapter Display: 1280x1024 display resolution Hard drive: 10 GB free space, NTFS file system
Specifically some tests require certain hardware in order to run all workloads:
• Entertainment test requires DirectX 10
• Computation test requires DirectX 10
When running these tests on a system with less than the recommended hardware, some workloads will be skipped. Scores from such systems will be lower than systems that meet the recommended requirements.
Use the Game-o-Meter to quickly and easily see whether your PC meets the requirements.

Benchmark structure PCMark 7 contains:
Performance views which consist of one or more tests.
A test consists of individual workloads that are executed one at a time in sequence. Each test gives a score.
A workload is a single element that stresses one or more components of the system being tested.
The structure of the Hardware performance view is shown below as an example.
Performance views A PC’s performance is determined by the interactions between different hardware components, the operating system and the type and amount of software running. A benchmark provides a set of performance tests that can be repeated with a high degree of accuracy on a wide range of computer hardware. PCMark 7 provides several different views of system performance. The Overall performance view includes 2 tests that give an overall measure of a system's capabilities. General performance is measured by the PCMark test, the only test that returns an official PCMark score. The Lightweight test can be used to measure the capabilities of entry level systems and mobility platforms unable to run the PCMark test, but it does not generate a PCMark score. The Common usage performance view includes 3 tests that measure a system's performances while running typical consumer applications. The Entertainment, Creativity and Productivity tests each deliver a score. The Hardware component performance view includes tests designed to measure the performance of specific components. The Computation test measures CPU and GPU computation performance and the Storage test measures the performance of the system drive and other internal and external drives in the PC.
The Common usage performance and Hardware component performance views are not available in PCMark 7 Basic Edition.
Hardware performance
view
Computation test
Video transcoding - downscaling
Video transcoding - high quality
Image manipulation
Storage test
Windows Defender
Importing pictures
Video editing Adding music Starting
applications Gaming
Windows Media Center
Tests PCMark 7 includes a range of tests which measure different dimensions of your system’s performance. In PCMark 7 Advanced Edition you can choose which tests to run. The tests contained within the Common usage and Hardware component views are unavailable in the Basic Edition. Tests consist of a number of small, individual workload tests. Different tests can contain similar workloads. In those instances, common workloads are only run once and the results are used in all appropriate test scores.
PCMark test The PCMark test is a collection of workloads that measure system performance during typical desktop usage. This is the most important test since it returns the official PCMark score for the system.
• Storage • Windows Defender • Importing pictures • Gaming
• Video Playback and transcoding • Graphics
• DirectX 9 • Image manipulation • Web browsing and decrypting
Lightweight test The Lightweight test contains a collection of workloads to measure the system performance of low performance systems during typical desktop usage. On low performance systems, such as entry level desktops, tablets and notebooks, only one application tends to be in active use most of the time and it is rare to run computationally heavy applications. The test is ideal for benchmarking systems using the Windows 7 Starter operating system and is also compatible with Windows Vista. At the end of the benchmark run the system is given a Lightweight test score.
• Storage • Starting applications • Adding music • Importing pictures
• Text editing • Image manipulation • Web browsing with 3 tabs
Entertainment test The Entertainment test is a collection of workloads that measure system performance in entertainment scenarios using mostly application workloads. Individual tests include recording, viewing, streaming and transcoding TV shows and movies, importing, organizing and browsing new music and several gaming related workloads. If the target system is not capable of running DirectX 10 workloads then those tests are skipped. At the end of the benchmark run the system is given an Entertainment test score.

• Video Playback and transcoding • Storage
• Gaming • Adding music
• Graphics • DirectX 9 • DirectX 10 texture fill • DirectX 10 color fill • DirectX 10 Parallax Occlusion Mapping (POM) • DirectX 10 GPU cloth • DirectX 10 GPU particles • DirectX 10 Perlin noise
• Web browsing with 2x3 tabs
Creativity test The Creativity test contains a collection of workloads to measure the system performance in typical creativity scenarios. Individual tests include viewing, editing, transcoding and storing photos and videos. At the end of the benchmark run the system is given a Creativity test score.
• Storage • importing pictures • video editing
• Image manipulation • Video transcoding – high quality
Productivity test The Productivity test is a collection of workloads that measure system performance in typical productivity scenarios. Individual workloads include loading web pages and using home office applications. At the end of the benchmark run the system is given a Productivity test score.
• Storage • Windows Defender • Starting applications
• Web browsing and decrypting • Productivity • Data decryption
• Text editing
Computation test The Computation test contains a collection of workloads that isolate the computation performance of the system. At the end of the benchmark run the system is given a Computation test score.
• Video transcoding – downscaling • Video transcoding – high quality

• Image manipulation
Storage test The Storage test is a collection of workloads that isolate the performance of the PC’s storage system. You can choose to test other storage devices in addition to the system drive. At the end of the benchmark run the system is given a Storage test score.
• Storage • Windows Defender • Importing pictures • Video editing • Windows Media Center • Adding music • Starting applications • Gaming
Secondary Storage test The Secondary Storage test is identical to the Storage test but allows you to specify the drive to be tested. This lets you run PCMark 7's storage tests on additional internal or external drives in addition to the system drive.

Workloads PCMark 7 contains more than 25 individual workloads which are combined in various ways to create each test. This section includes details of each workload, divided into Computation, Storage and Application categories.
Computation workloads Computation workloads stresses mostly the CPU and GPU. It is possible and probable that also system memory, chipset and storage devices factor in performance, but that effect will be minimized. Depending on the tests these workloads can be configured to behave more synthetically (using only CPU or GPU) or more application like (may generate storage system load too). We strive to be agnostic to the underlying hardware implementation as much as possible.
Data decryption Windows Cryptography API (CNG) is used to decrypt and checksum the chosen data. Decryption algorithm is acquired with a call to CNG function BCryptOpenAlgorithmProvider(BCRYPT_AES_ALGORITHM) and hashing (checksum) algorithm with a call to function BCryptOpenAlgorithmProvider(BCRYPT_SHA256_ALGORITHM) The data is processed in 1MB blocks. Each block is decrypted and then hashed. Processing is single threaded. It is up to CNG algorithm implementation use the most efficient code path on a given hardware.
result = bytes_decrypted / ( time_ in_decrypting + time_ in_hashing )
Video playback Video playback workloads measure the performance of playing back a video file. The purpose of these workloads is not to see how fast the hardware is capable of playing the content but instead to ensure that it is powerful enough to play the content with the intended frame rate without glitches. Workloads use high definition H.264 content (1080p, 30fps, 10Mbps). Video is played using Media Foundation with Windows built-in video codec which implies that playback will function in those Windows 7 editions that include H.264 codec.
Video transcoding Video transcoding workloads transcode videos by changing the resolution, framerate and bitrate of the video. Video transcoding uses Fast Transcode feature found in Windows 7 Media Foundation. Video downscaling workload (found in Entertainment and PCMark tests) source video is H.264 (1080p, 30fps, 12Mbps). The destination is H.264 (320x240, 30fps, 500kbps). High quality video transcoding workload (found in Creativity test) source video is the same as with downscaling workload. The destination is H.264 (1080p, 24fps, 10Mbps).
Image manipulation The workload uses the Windows Imaging Component (WIC). Source images are in HD Photo format. This workload simulates everyday image manipulations such as color correction, stretch, flip and rotate.

Storage workloads Storage workload category stresses mostly storage devices like HDDs or SSDs. Storage workloads use RankDisk to playback a pre-recorded trace of storage device activity. See the following section for details of the trace recordings.
Storage – Windows Defender This workload uses a trace of Windows Defender’s Quick scan of the system. Recording of activity on system drive started just before clicking Quick scan on Windows Defender and lasted until the scan finished.
Trace statistics: Elapsed Time 33.806 sec Read Operations 4764 Write Operations 129 Total Operations 4893 Data Read 44.726 MB Data Written 0.631 MB Total Data Moved 45.357 MB Read Rate 1.323 MB/s Write Rate 0.019 MB/s Total Rate 1.342 MB/s Disk Busy Time 18.906 s Flushes Received 19
Block size up to: 4kB 64kB 128kB 1MB 2MB Total
Sequential reads: 324 14 0 0 0 338
Random reads: 3276 1149 0 1 0 4426
Total reads: 3600 1163 0 1 0 4764
Sequential writes: 19 5 0 0 0 24
Random writes: 86 19 0 0 0 105
Total writes: 105 24 0 0 0 129
Total reads & writes: 3705 1187 0 1 0 4893
4k aligned 4k offset unaligned
4k length unaligned
Total
Sequential reads: 332 (98%) 6 (2%) 0 (0%) 338
Random reads: 4203 (95%) 142 (3%) 81 (2%) 4426
Total reads: 4535 (95%) 148 (3%) 81 (2%) 4764
Sequential writes: 1 (4%) 23 (96%) 0 (0%) 24
Random writes: 93 (89%) 0 (0%) 12 (11%) 105
Total writes: 94 (73%) 23 (18%) 12 (9%) 129
Total reads & writes: 4629 (95%) 171 (3%) 93 (2%) 4893

Storage – importing pictures This workload uses a trace of importing a collection of images in Windows Live Photo Gallery. A USB stick with 68 images (434 MB total) was inserted and images were imported to Windows Live Photo Gallery. Recording of activity on system drive started at the beginning of importing pictures and lasted until thumbnail images appeared on the display. During the trace Windows Live Photo Gallery copied images from USB stick to Pictures library, indexed them and created thumbnails.
Trace statistics: Elapsed Time 41.742 sec Read Operations 2677 Write Operations 842 Total Operations 3519 Data Read 54.484 MB Data Written 348.405 MB Total Data Moved 402.889 MB Read Rate 1.305 MB/s Write Rate 8.347 MB/s Total Rate 9.652 MB/s Disk Busy Time 15.883 s Flushes Received 37
Block size up to: 4kB 64kB 128kB 1MB 2MB Total
Sequential reads: 108 56 5 25 0 194
Random reads: 1557 861 27 35 3 2483
Total reads: 1665 917 32 60 3 2677
Sequential writes: 39 28 1 67 0 135
Random writes: 173 174 20 340 0 707
Total writes: 212 202 21 407 0 842
Total reads & writes: 1877 1119 53 467 3 3519
4k aligned 4k offset unaligned
4k length unaligned
Total
Sequential reads: 80 (41%) 105 (54%) 9 (5%) 194
Random reads: 1979 (80%) 445 (18%) 59 (2%) 2483
Total reads: 2059 (77%) 550 (21%) 68 (3%) 2677
Sequential writes: 80 (59%) 45 (33%) 10 (7%) 135
Random writes: 650 (92%) 6 (1%) 51 (7%) 707
Total writes: 730 (87%) 51 (6%) 61 (7%) 842
Total reads & writes: 2789 (79%) 601 (17%) 129 (4%) 3519
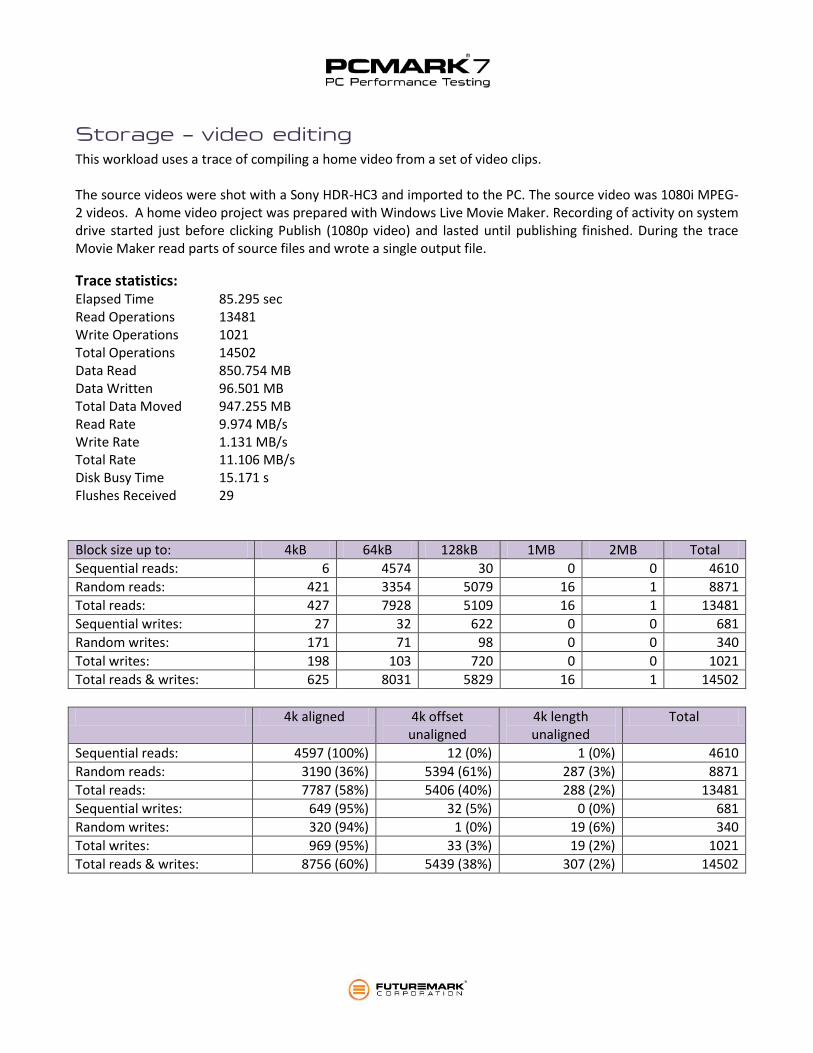
Storage – video editing This workload uses a trace of compiling a home video from a set of video clips. The source videos were shot with a Sony HDR-HC3 and imported to the PC. The source video was 1080i MPEG-2 videos. A home video project was prepared with Windows Live Movie Maker. Recording of activity on system drive started just before clicking Publish (1080p video) and lasted until publishing finished. During the trace Movie Maker read parts of source files and wrote a single output file.
Trace statistics: Elapsed Time 85.295 sec Read Operations 13481 Write Operations 1021 Total Operations 14502 Data Read 850.754 MB Data Written 96.501 MB Total Data Moved 947.255 MB Read Rate 9.974 MB/s Write Rate 1.131 MB/s Total Rate 11.106 MB/s Disk Busy Time 15.171 s Flushes Received 29
Block size up to: 4kB 64kB 128kB 1MB 2MB Total
Sequential reads: 6 4574 30 0 0 4610
Random reads: 421 3354 5079 16 1 8871
Total reads: 427 7928 5109 16 1 13481
Sequential writes: 27 32 622 0 0 681
Random writes: 171 71 98 0 0 340
Total writes: 198 103 720 0 0 1021
Total reads & writes: 625 8031 5829 16 1 14502
4k aligned 4k offset unaligned
4k length unaligned
Total
Sequential reads: 4597 (100%) 12 (0%) 1 (0%) 4610
Random reads: 3190 (36%) 5394 (61%) 287 (3%) 8871
Total reads: 7787 (58%) 5406 (40%) 288 (2%) 13481
Sequential writes: 649 (95%) 32 (5%) 0 (0%) 681
Random writes: 320 (94%) 1 (0%) 19 (6%) 340
Total writes: 969 (95%) 33 (3%) 19 (2%) 1021
Total reads & writes: 8756 (60%) 5439 (38%) 307 (2%) 14502
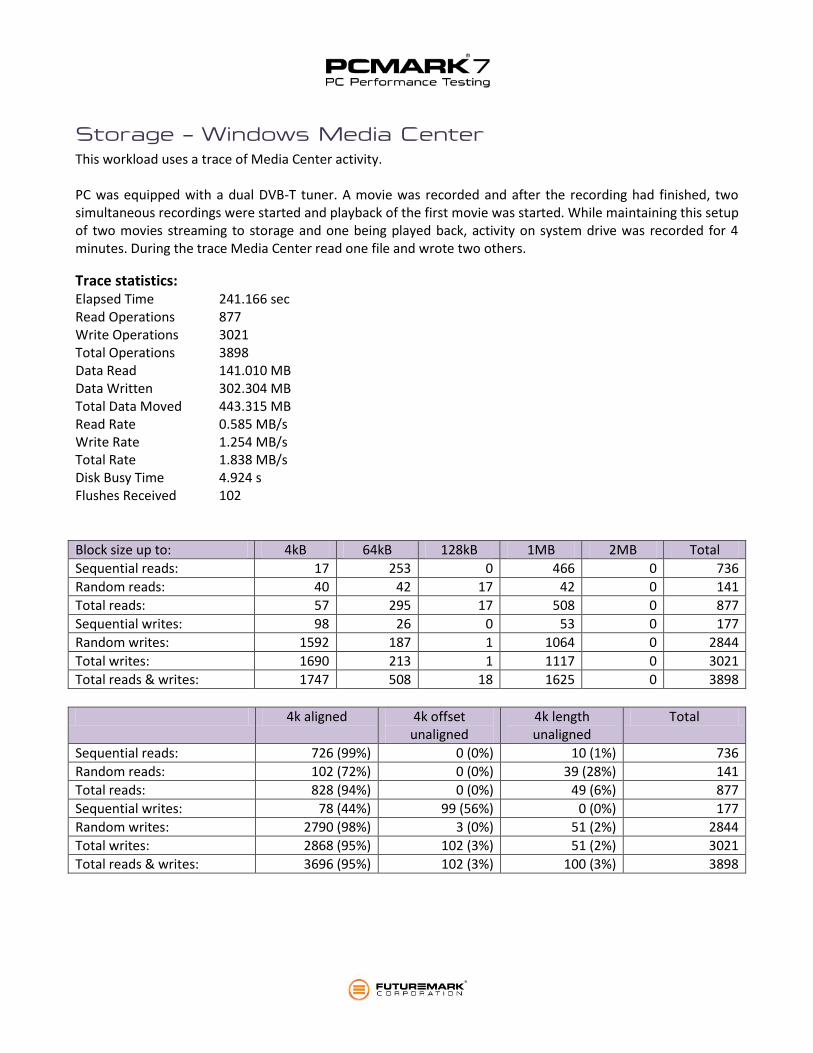
Storage – Windows Media Center This workload uses a trace of Media Center activity. PC was equipped with a dual DVB-T tuner. A movie was recorded and after the recording had finished, two simultaneous recordings were started and playback of the first movie was started. While maintaining this setup of two movies streaming to storage and one being played back, activity on system drive was recorded for 4 minutes. During the trace Media Center read one file and wrote two others.
Trace statistics: Elapsed Time 241.166 sec Read Operations 877 Write Operations 3021 Total Operations 3898 Data Read 141.010 MB Data Written 302.304 MB Total Data Moved 443.315 MB Read Rate 0.585 MB/s Write Rate 1.254 MB/s Total Rate 1.838 MB/s Disk Busy Time 4.924 s Flushes Received 102
Block size up to: 4kB 64kB 128kB 1MB 2MB Total
Sequential reads: 17 253 0 466 0 736
Random reads: 40 42 17 42 0 141
Total reads: 57 295 17 508 0 877
Sequential writes: 98 26 0 53 0 177
Random writes: 1592 187 1 1064 0 2844
Total writes: 1690 213 1 1117 0 3021
Total reads & writes: 1747 508 18 1625 0 3898
4k aligned 4k offset unaligned
4k length unaligned
Total
Sequential reads: 726 (99%) 0 (0%) 10 (1%) 736
Random reads: 102 (72%) 0 (0%) 39 (28%) 141
Total reads: 828 (94%) 0 (0%) 49 (6%) 877
Sequential writes: 78 (44%) 99 (56%) 0 (0%) 177
Random writes: 2790 (98%) 3 (0%) 51 (2%) 2844
Total writes: 2868 (95%) 102 (3%) 51 (2%) 3021
Total reads & writes: 3696 (95%) 102 (3%) 100 (3%) 3898
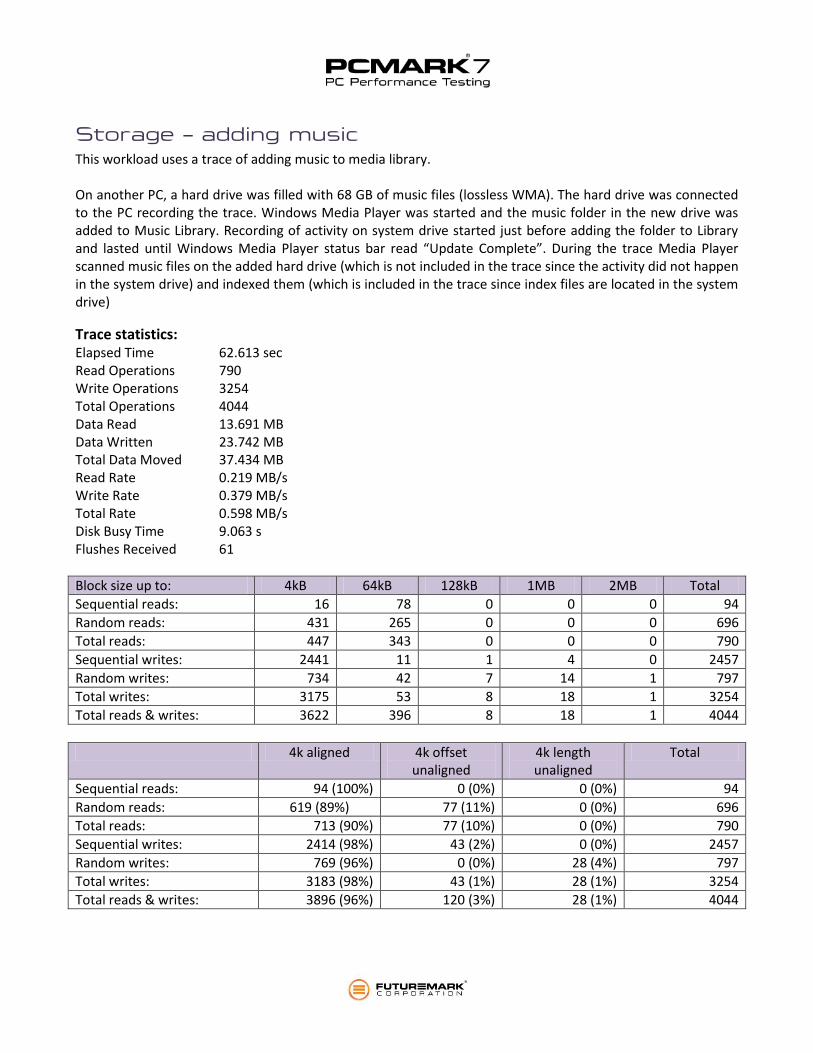
Storage – adding music This workload uses a trace of adding music to media library. On another PC, a hard drive was filled with 68 GB of music files (lossless WMA). The hard drive was connected to the PC recording the trace. Windows Media Player was started and the music folder in the new drive was added to Music Library. Recording of activity on system drive started just before adding the folder to Library and lasted until Windows Media Player status bar read “Update Complete”. During the trace Media Player scanned music files on the added hard drive (which is not included in the trace since the activity did not happen in the system drive) and indexed them (which is included in the trace since index files are located in the system drive)
Trace statistics: Elapsed Time 62.613 sec Read Operations 790 Write Operations 3254 Total Operations 4044 Data Read 13.691 MB Data Written 23.742 MB Total Data Moved 37.434 MB Read Rate 0.219 MB/s Write Rate 0.379 MB/s Total Rate 0.598 MB/s Disk Busy Time 9.063 s Flushes Received 61
Block size up to: 4kB 64kB 128kB 1MB 2MB Total
Sequential reads: 16 78 0 0 0 94
Random reads: 431 265 0 0 0 696
Total reads: 447 343 0 0 0 790
Sequential writes: 2441 11 1 4 0 2457
Random writes: 734 42 7 14 1 797
Total writes: 3175 53 8 18 1 3254
Total reads & writes: 3622 396 8 18 1 4044
4k aligned 4k offset unaligned
4k length unaligned
Total
Sequential reads: 94 (100%) 0 (0%) 0 (0%) 94
Random reads: 619 (89%) 77 (11%) 0 (0%) 696
Total reads: 713 (90%) 77 (10%) 0 (0%) 790
Sequential writes: 2414 (98%) 43 (2%) 0 (0%) 2457
Random writes: 769 (96%) 0 (0%) 28 (4%) 797
Total writes: 3183 (98%) 43 (1%) 28 (1%) 3254
Total reads & writes: 3896 (96%) 120 (3%) 28 (1%) 4044
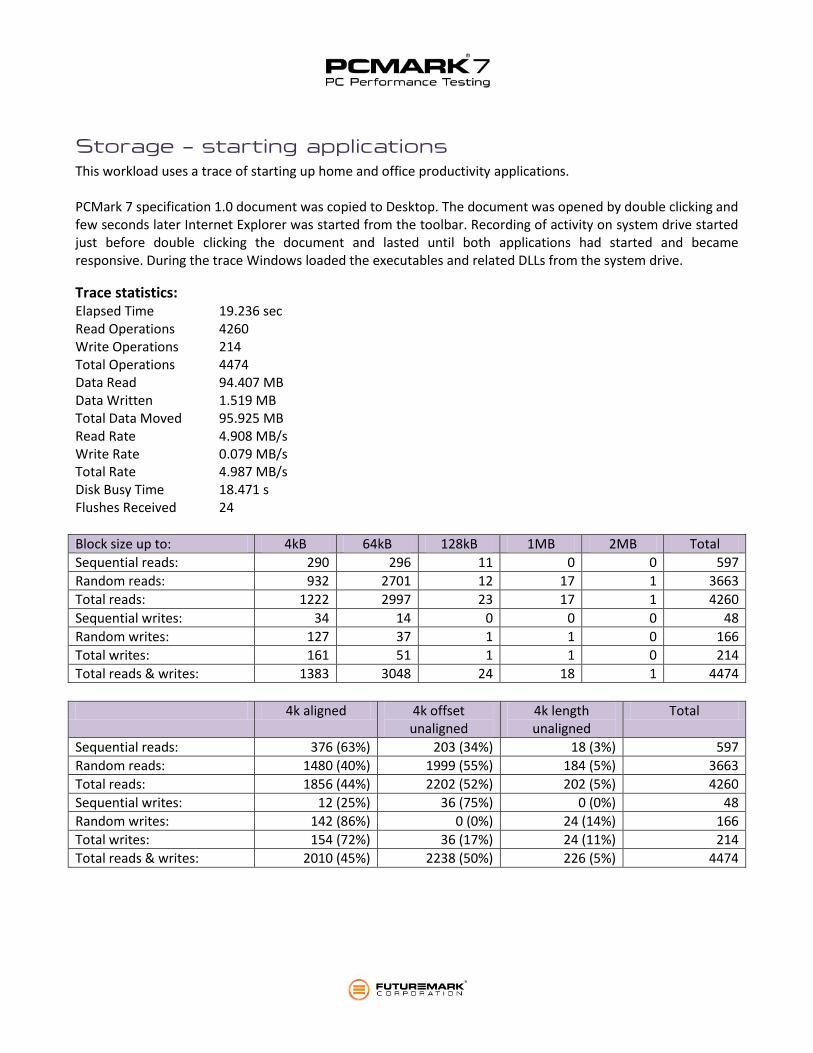
Storage – starting applications This workload uses a trace of starting up home and office productivity applications. PCMark 7 specification 1.0 document was copied to Desktop. The document was opened by double clicking and few seconds later Internet Explorer was started from the toolbar. Recording of activity on system drive started just before double clicking the document and lasted until both applications had started and became responsive. During the trace Windows loaded the executables and related DLLs from the system drive.
Trace statistics: Elapsed Time 19.236 sec Read Operations 4260 Write Operations 214 Total Operations 4474 Data Read 94.407 MB Data Written 1.519 MB Total Data Moved 95.925 MB Read Rate 4.908 MB/s Write Rate 0.079 MB/s Total Rate 4.987 MB/s Disk Busy Time 18.471 s Flushes Received 24
Block size up to: 4kB 64kB 128kB 1MB 2MB Total
Sequential reads: 290 296 11 0 0 597
Random reads: 932 2701 12 17 1 3663
Total reads: 1222 2997 23 17 1 4260
Sequential writes: 34 14 0 0 0 48
Random writes: 127 37 1 1 0 166
Total writes: 161 51 1 1 0 214
Total reads & writes: 1383 3048 24 18 1 4474
4k aligned 4k offset unaligned
4k length unaligned
Total
Sequential reads: 376 (63%) 203 (34%) 18 (3%) 597
Random reads: 1480 (40%) 1999 (55%) 184 (5%) 3663
Total reads: 1856 (44%) 2202 (52%) 202 (5%) 4260
Sequential writes: 12 (25%) 36 (75%) 0 (0%) 48
Random writes: 142 (86%) 0 (0%) 24 (14%) 166
Total writes: 154 (72%) 36 (17%) 24 (11%) 214
Total reads & writes: 2010 (45%) 2238 (50%) 226 (5%) 4474

Storage – gaming This workload uses a trace of starting up World of Warcraft. World of Warcraft was installed. A new character was created in the game. The game was closed and started again. Recording of activity on system drive started just before logging in the game. Game loaded and the new character was selected as quickly as possible. The recording was stopped right after the game world had loaded so far that the character could move in the world. During the trace the game loaded game data from the system drive.
Trace statistics: Elapsed Time 24.805 sec Read Operations 6046 Write Operations 259 Total Operations 6305 Data Read 123.233 MB Data Written 0.941 MB Total Data Moved 124.174 MB Read Rate 4.968 MB/s Write Rate 0.038 MB/s Total Rate 5.006 MB/s Disk Busy Time 18.126 s Flushes Received 85
Block size up to: 4kB 64kB 128kB 1MB 2MB Total
Sequential reads: 575 808 48 56 5 1492
Random reads: 3002 1452 47 50 3 4554
Total reads: 3577 2260 95 106 8 6046
Sequential writes: 15 4 0 0 0 19
Random writes: 227 13 0 0 0 240
Total writes: 242 17 0 0 0 259
Total reads & writes: 3819 2277 95 106 8 6305
4k aligned 4k offset unaligned
4k length unaligned
Total
Sequential reads: 1228 (82%) 256 (17%) 8 (1%) 1492
Random reads: 4050 (89%) 480 (11%) 24 (1%) 4554
Total reads: 5278 (87%) 736 (12%) 32 (1%) 6046
Sequential writes: 2 (11%) 17 (89%) 0 (0%) 19
Random writes: 163 (68%) 0 (0%) 77 (32%) 240
Total writes: 165 (64%) 17 (7%) 77 (30%) 259
Total reads & writes: 5443 (86%) 753 (12%) 109 (2%) 6305

Application workload category Application workload category stresses multiple hardware components. These workloads are designed to behave as much as possible like real world applications of the same functionality.
Text editing We use WordPad look-a-like application and perform search and replace operations on the given document. Document will be shown. We measure the time it takes to complete the search and replace operations.
Web browsing We use embedded Internet Explorer to open pages in tabs. Three tabs are opened each with their own content and we measure the time it takes to reload and render all three tabs concurrently. In Web browsing – productivity test we have static snapshots of following pages:
www.futuremark.com
service.futuremark.com/hardware/
store.futuremark.com/shop/ In Web browsing – entertainment we static snapshots of have following pages:
www.yougamers.com
www.shatteredhorizon.com
stats.shatteredhorizon.com/stats/leaderBoards.action
Graphics – DirectX 9 We use Firefly scene from 3DMark06 to measure DirectX 9 graphics performance.
Graphics – DirectX 10 We use the feature tests from 3DMark Vantage to measure DirectX 10 graphics performance.
Texture fill rate test The test draws frames by filling the screen rectangle with values read from a tiny texture using multiple texture coordinates. The texture coordinates are rotated and scaled between each frame.
Color fill rate test The test draws frames by filling the screen rectangle multiple times. The color and alpha of each corner of the screen is animated. The pixel shader is pass-through. The interpolated color is written directly to the target using alpha blending. The render target format is R16G16B16A16.
Parallax Occlusion mapping (POM) The POM shader test features a single quad shaded using the Parallax Occlusion Mapping technique. A 4k by 4k height map representing a hilly landscape is mapped on the quad and rendered with 4 point lights and 3 directional lights in a single pass, using POM self-shadowing for each light.

GPU Cloth The test renders twelve waving flags that are simulated on the GPU. The computation is done in vertex and geometry shaders and results are outputted using stream out. Each flag is modeled as a grid of vertices. Each vertex is connected to its 8 neighbors with springs. Animated wind and gravity affects the behavior of each flag.
GPU Particles The test renders GPU simulated particles, which reveal an invisible shape by colliding to its surface. There are hundreds of thousands of particles in the scene.
Perlin noise The shader math test features multiple octaves of Perlin noise evaluated in the pixel shader. Each color channel has its own noise function for added computation load.

Scores Running the PCMark test on a system gives a PCMark score, a single integer describing the overall performance of the system. The larger the PCMark score, the better the performance of the system. The PCmark test is the only test that generates an official "PCMark" score. Running the others tests generates individual test scores describing a particular aspect of the system's performance. Larger scores indicate better performance.
PCMark score = XPCMark * [geomean of the PCMark test results] Lightweight score = XLightweight * [geomean of Lightweight test results] Entertainment score = XEntertainment * [geomean of the Entertainment test results, with
the exception that a geomean of all six DX10 workload results replaces those individual results]
Creativity score = XCreativity * [geomean of the Creativity test results] Productivity score = XProductivity * [geomean of the Productivity test results] Computation score = XComputation * [geomean of the Computation test results] System storage score = XStorage * [geomean of the System storage test results] Secondary storage score = XStorage * [geomean of the Secondary storage test results]
The score coefficients (Xi) used in the formulas above were determined empirically by running the benchmark on a high-end PC system with Intel i7-980X CPU, Nvidia GTX 580 GPU and Crucial C300 SSD ) with the aim of generating score values close to 5000. The coefficients values are:
Coefficient Exact value (as a rational number) Approximate value
XPCMark 5,000 / 210,000 0.023809524
XLightweight 5,000 / 130,000 0.038461538
XEntertainment 5,000 / 2,700 1.851851852
XCreativity 5,000 / 10,000,000 0.000500000
XProductivity 5,000 / 100,000 0.050000000
XComputation 5,000 / 4,800,000 0.001041667
XStorage 5,000 / 12,000,000 0.000416667
Geomean is shorthand for geometric mean. If there are any workloads the hardware or the version of the operating system isn’t capable of running, the results of those particular workloads are 1.0. Also other workloads in that same set are not run and given results of 1.0.

Due to variance issues in a multitasking operating system and non-deterministic nature of performance characteristics with some hardware, benchmark runs are repeated three (3) times and each workload result used in score formulas are calculated from a set of five workload results. In addition to scores, the benchmark reports observed deviation (residual) in workload results and scores. One purpose of residual figures is to illustrate the fact that all hardware performance measurements are not deterministic and repeatable as one could assume from a single score figure. While some device may offer good performance in general, there may be times when its performance has lowered for some reason. Another use of residual figures could be to help in choosing between hardware components – if the ranges of expected performance figures overlap, it may be said that the performance of those components is not significantly different. The implementation of workload residual calculation is as follows: Let wi,n be workload results, i=1..N and n is the workload index. Then final workload result
wn = meani(wi,n)
and the residual of the workload result n is
rn = meani(abs(wi,n – wn))/wn
where mean() is the arithmetic mean function and abs() is the absolute value function. Score based on workload results n=1..M is
s = geomeann(wn) where geomean() is the geometric mean function. The residual of score is r = mean(rn)
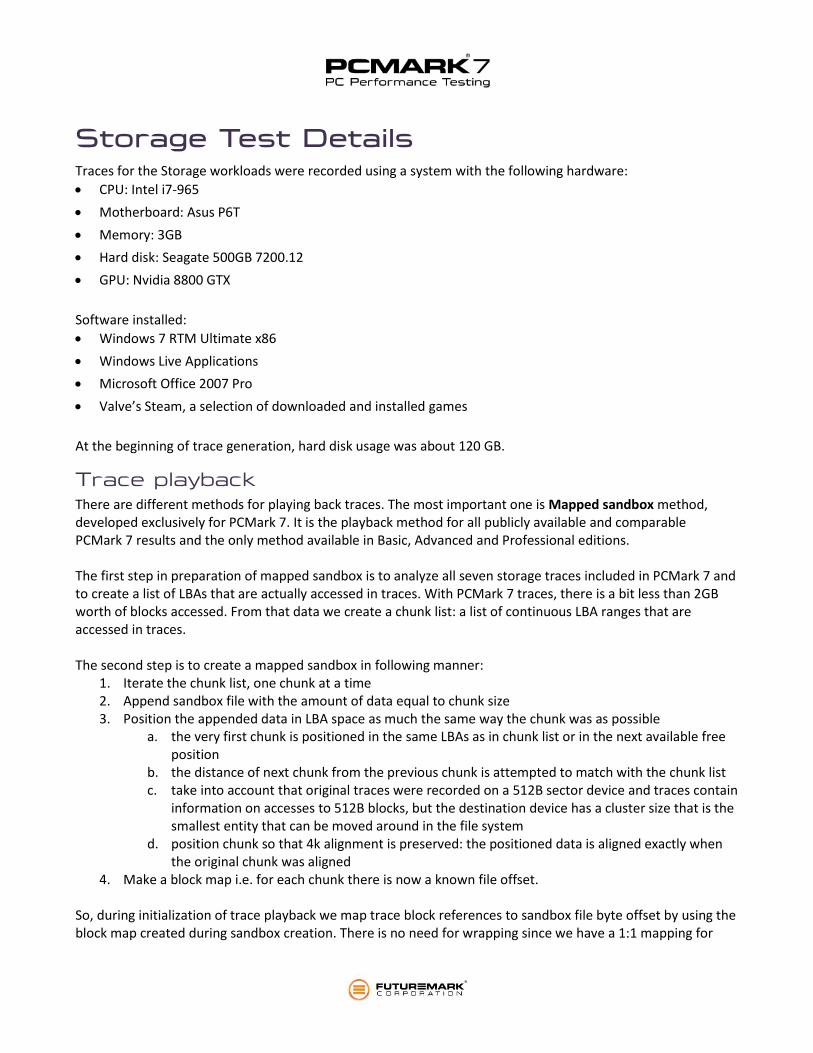
Storage Test Details Traces for the Storage workloads were recorded using a system with the following hardware:
CPU: Intel i7-965
Motherboard: Asus P6T
Memory: 3GB
Hard disk: Seagate 500GB 7200.12
GPU: Nvidia 8800 GTX
Software installed:
Windows 7 RTM Ultimate x86
Windows Live Applications
Microsoft Office 2007 Pro
Valve’s Steam, a selection of downloaded and installed games
At the beginning of trace generation, hard disk usage was about 120 GB.
Trace playback There are different methods for playing back traces. The most important one is Mapped sandbox method, developed exclusively for PCMark 7. It is the playback method for all publicly available and comparable PCMark 7 results and the only method available in Basic, Advanced and Professional editions. The first step in preparation of mapped sandbox is to analyze all seven storage traces included in PCMark 7 and to create a list of LBAs that are actually accessed in traces. With PCMark 7 traces, there is a bit less than 2GB worth of blocks accessed. From that data we create a chunk list: a list of continuous LBA ranges that are accessed in traces. The second step is to create a mapped sandbox in following manner:
1. Iterate the chunk list, one chunk at a time 2. Append sandbox file with the amount of data equal to chunk size 3. Position the appended data in LBA space as much the same way the chunk was as possible
a. the very first chunk is positioned in the same LBAs as in chunk list or in the next available free position
b. the distance of next chunk from the previous chunk is attempted to match with the chunk list c. take into account that original traces were recorded on a 512B sector device and traces contain
information on accesses to 512B blocks, but the destination device has a cluster size that is the smallest entity that can be moved around in the file system
d. position chunk so that 4k alignment is preserved: the positioned data is aligned exactly when the original chunk was aligned
4. Make a block map i.e. for each chunk there is now a known file offset. So, during initialization of trace playback we map trace block references to sandbox file byte offset by using the block map created during sandbox creation. There is no need for wrapping since we have a 1:1 mapping for
each trace LBA and sandbox offset. Ideally read and write operations targeted to mapped sandbox offsets results in access to exactly same LBAs as in the trace. In practice, however, this cannot be achieved at least with the system drive because blocks are being used by user data and we can use only free areas. The main focus is not that we would have exactly same LBAs, but that the range of LBAs would be of same magnitude (roughly 250GB). The third step is to playback each storage trace as needed (using the same sandbox file):
The sandbox file is opened with Win32 CreateFile().
The trace file is processed in order, one IO at a time.
Read operations are executed using Win32 ReadFile() in overlapped mode.
Write operations are executed using Win32 WriteFile() in overlapped mode.
Original queue depth is maintained if possible. The trace contains begin and end timestamps of each IO, so it is possible to track queue depth and try to build equal queue lengths during playback.
Idle times (when queue depth is zero) are compressed. If idle time is longer than 10ms, it is shortened to 10ms. The reason for compression is to execute the playback in a short time. On the other hand, storage devices are offered a 20s idle time for internal maintenance tasks before each trace playback.

Storage workload result calculation
Let us define terms with the example above where we have four I/O operations executed. Timestamps ti mark the beginning and ti’ mark the completion of each operation. Time can be split into distinct time windows Wi with two rules:
1. a time window ends and a next one begins each time on I/O operation either begins (ti) or ends (ti’), in
other words there is a constant queue depth in each time window
2. a time window is not defined for idle times, in other words the queue depth is at least 1
A time window has two properties: duration which we denote with D(Wi) and queue depth which we denote with Q(Wi). We define that the device is busy when there are one or more operations waiting for completion. In the example above, the device is busy from t0 to t2’ and from t3 to t3’ so busy0 := t2’ - t0 and busy1 := t3’ - t3. From this we can define by induction busy_time = sumi(busyi) = sumi(D(Wi)) Device busy time can be thought of as a measure of storage device goodness in throughput sense. Another view on device performance is to observe response times of I/O operations. Access time of each operation i is ti’ - ti and total response time can be defined as
response_time = sumi(ti’ - ti) = sumi(D(Wi) * Q(Wi))

We want to balance these two metrics and choose a weighted arithmetic mean with emphasis on busy times to get a raw performance time and a raw performance metric:
raw_performance_time = 0.25 * response_time + 0.75 * busy_time and
raw_performance = raw_performance_time / total_bytes_transferred where total bytes transferred is a constant for each storage trace. With PCMark, the questions we want to answer are not only “How fast is this storage device?” but also “What is the expected impact on user observable performance if I use this device?” We aim to measure performance that is relevant to the user using the particular PC, indicating raw performance is not sufficient. We have to take into account that in many cases disk is not fully loaded with I/Os and that there are (storage system) idle times, where PC performance is limited by other PC components or the system is simply waiting for the user. It is important to note that by looking at storage trace files itself one can’t distinct which is the case. It is a limitation of the tracing system that we do not know much about the context of each individual I/O. To figure out the amount of storage system idle time that is relevant to benchmark (i.e. not waiting for the user), we can use the original trace idle time as a starting point but we must decide what proportion of time is spent on waiting for other components by evaluating the use case in each trace. We also consider what magnitude of performance improvements can be expected for other components. We choose to be very optimistic and evaluate chosen metric idle time as low as reasonable.

Trace Original trace idle time [seconds] (percentage of trace time)
Chosen metric idle time [seconds]
Windows Defender 14.9 (44%) 7
Importing pictures 25.859 (62%) 10
Video editing 70.124 (82%) 35
Windows Media Center 236.242 (98%) 50
Adding music to library 53.55 (86%) 25
Starting applications 0.765 (4%) 0.7
Gaming 6.679 (27%) 6
After that we have decided relevant metric idle times for each trace we can define a metric that used as the primary result of storage workloads: overall_performance = total_bytes_transferred / (raw_performance_time + metric_idle_time)
Rationale of metric idle times Windows Defender use case is about scanning of bunch of files. There is no user activity during scan but strong dependence on CPU performance. We can say that required CPU performance can be improved from the setup used and choose metric idle time to about half of the original, thus 7 seconds. Importing pictures is about bringing bunch of files from external media to system drive and creating thumbnails. User activity is minimal. Idle times are a combination of waiting for the external device and CPU processing imported pictures. Since the external device used was a regular USB 2.0 flash stick, we can say that already significantly faster alternatives to external devices (USB 3.0 devices) and therefore choose the metric idle time to be significantly less than half of the original trace idle time, thus 10 seconds. Video editing is about cutting and transcoding a home video. CPU processing hogs the trace idle time. Since there are now even better video transcoding acceleration technologies, we can choose the metric idle time as about half of the original, thus 35 seconds. Windows Media Center is about recording and playback of videos. CPU processing is not significant and neither is user activity. The user is mostly happy watching the playback. Responsiveness of the application is important however and scaling of the use case to even more video streams coming in and out of storage.That is why we choose that the metric idle time is only a fraction of the original, thus 50 seconds.

Adding music is about indexing files on external device and updating the index on the system drive. The idle time can be significantly reduced by using a faster external storage device. We choose the metric idle time to be less than half of the original one, thus 25 seconds. Starting applications is about loading application executables and libraries. Since there is already not much idle time in the original trace we choose the idle time very close to it, thus 0.7 seconds. Gaming is somewhat similar to starting applications, with the exception that some time is spent also on network traffic. Since dramatic improvement in network speeds can’t be expected, we choose the metric idle time very close to the original one, thus 6 seconds.
Questions Unanswered? If you have any questions about PCMark 7 please contact Ilkka Koho, Product Manager • E-mail: [email protected] • Phone: +358-20 759 8250 (GMT+2)
Futuremark Corporation http://www.futuremark.com/
© 2011 Futuremark® Corporation. 3DMark® and PCMark® trademarks and logos, Futuremark® character names and distinctive likenesses, are the exclusive property of Futuremark Corporation. Microsoft, Windows 7,
Windows Vista, Internet Explorer, Outlook, Excel, DirectX, and Direct3D are either registered trademarks or trademarks of Microsoft Corporation in the United States and/or other countries. All other trademarks are
property of their respective companies.
All rights reserved Futuremark ® Corporation, 2011.