pci update may 2012 ross stainlay
TRANSCRIPT

PCI Coal (2012 presentation)
1
Ross Stainlay – M [email protected]
How market conditions affect PCIcoal selection and usage

Agenda
• Set the Scene (and terminology !)
• Technology and Replacement Ratio
• Trade and Consumption
• Pricing and VIU
• Concluding Remarks
2

3Source: ANZ
Iron Ore Consumption Intensity –Future Production Levels to Rise
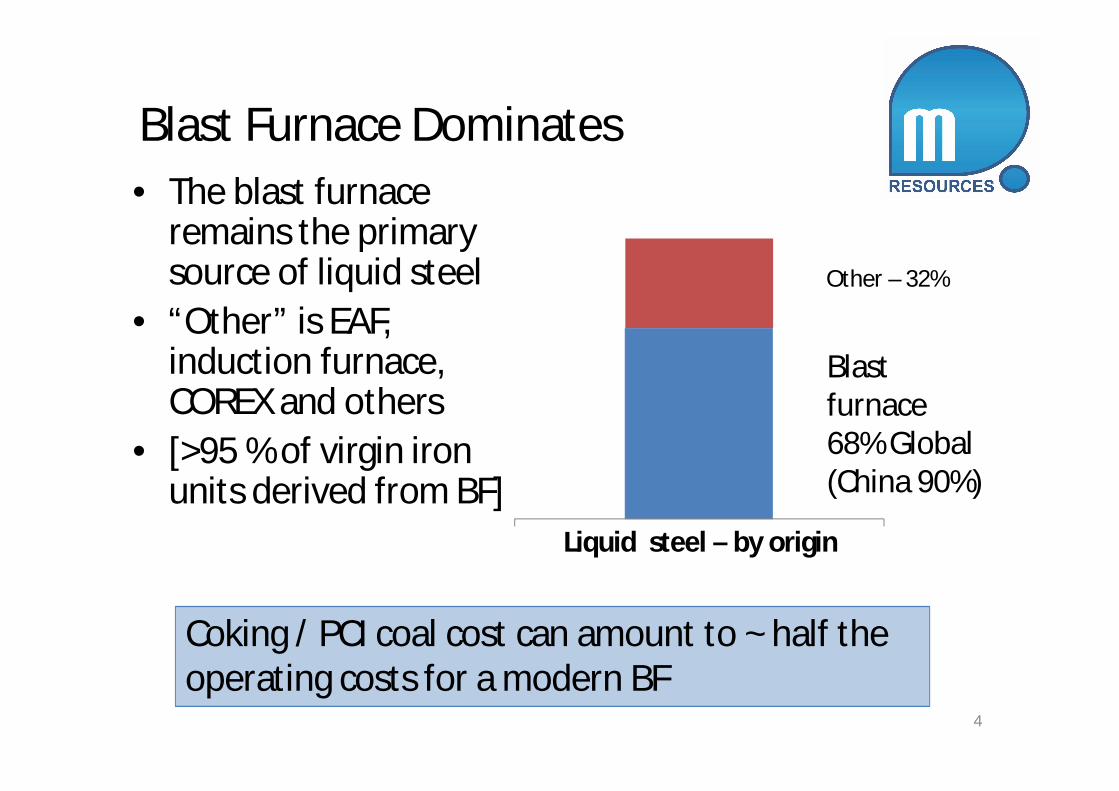
Blast Furnace Dominates
Liquid steel – by origin
Blastfurnace68% Global(China 90%)
Other – 32%
• The blast furnaceremains the primarysource of liquid steel
• “Other” is EAF,induction furnace,COREX and others
• [>95 % of virgin ironunits derived from BF]
4
Coking / PCI coal cost can amount to ~ half theoperating costs for a modern BF

BF Hot Metal Production (Mtpa)
0
200
400
600
800
1,000
1,200
1,400
1,60020
0020
0120
0220
0320
0420
0520
0620
0720
0820
0920
1020
1120
1220
1320
1420
15
2021
AsiaOceaniaAfricaS AmericaN AmericaCISOther EuropeEU-28
5
Forecast
Source – compilation

Main European Met Coal Importing CountriesJul 2005-Dec 2011
(Blast Furnace – Hot Metal Mt pm)
0
1
2
3
4
5
6
7
Aug-
05
Dec-
05
Apr-
06
Aug-
06
Dec-
06
Apr-
07
Aug-
07
Dec-
07
Apr-
08
Aug-
08
Dec-
08
Apr-
09
Aug-
09
Dec-
09
Apr-
10
Aug-
10
Dec-
10
Apr-
11
Aug-
11
Dec-
11
Mill
ions
Total EU (8 countries) Source - WSA
UK, France Germany, Turkey,Sweden/Finland, Belgium,Netherlands, Spain
6

Main South American Met Coal ImportingCountries Jul2005-Dec 2011(Blast Furnace – Hot Metal Mt pm)
0
0.5
1
1.5
2
2.5
3
3.5
4A
ug-0
5
Dec
-05
Apr
-06
Aug
-06
Dec
-06
Apr
-07
Aug
-07
Dec
-07
Apr
-08
Aug
-08
Dec
-08
Apr
-09
Aug
-09
Dec
-09
Apr
-10
Aug
-10
Dec
-10
Apr
-11
Aug
-11
Dec
-11
Mill
ions
Brazil
Argentina
7
Source - WSA

Main Asian Met Coal Importing CountriesJul 2005-Dec 2011(Blast Furnace – Hot Metal Mt pm)
0
2
4
6
8
10
12
14
16Au
g-05
Dec-
05Ap
r-06
Aug-
06De
c-06
Apr-
07Au
g-07
Dec-
07Ap
r-08
Aug-
08De
c-08
Apr-
09Au
g-09
Dec-
09Ap
r-10
Aug-
10De
c-10
Apr-
11Au
g-11
Dec-
11
Mill
ions
Taiwan
SouthKorea
India
Japan
8Source - WSA

Agenda
• Set the Scene
• Technology and Replacement Ratio
• Trade and Consumption
• Pricing and VIU
• Concluding Remarks
9
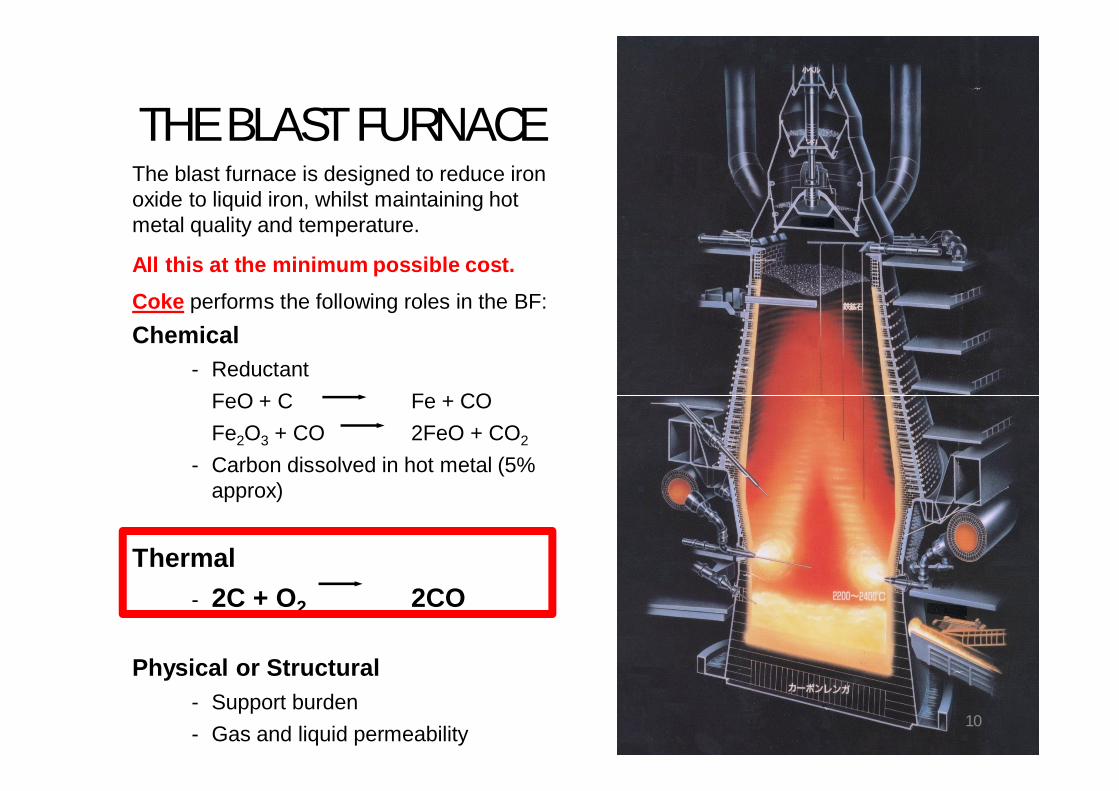
THE BLAST FURNACEThe blast furnace is designed to reduce ironoxide to liquid iron, whilst maintaining hotmetal quality and temperature.
All this at the minimum possible cost.Coke performs the following roles in the BF:Chemical
- ReductantFeO + C Fe + COFe2O3 + CO 2FeO + CO2
- Carbon dissolved in hot metal (5%approx)
Thermal- 2C + O2 2CO
Physical or Structural- Support burden- Gas and liquid permeability
10

Advantages of PCI
• PCI into the blast furnaces offers the followingadvantages for blast furnace operation:
– Coal is less expensive than coke, resulting in lower fuel costs.– Coal injection in conjunction with other parameters may
improve productivity.– A wide range of coal types can be injected.– Coal injection rates are higher than oil or natural gas, thus lower
coke rates are achieved.– Coal supplies are more stable due to extensive reserves.– Coal injection systems are less costly than new coke plants.– Coal grinding and injection systems are non-polluting, and may
offer a CO2 reduction opportunity
11

PCI Rates and Records
94
40
50
60
70
80
90
100
1995 1996 1997 1998 1999 2000
kg/thm across all BFs
Source: CRU International12
PCI records over time
– Dunkirk 143 kg/thm (1984)– Thyssen 200 kg/thm (1992)– Kobe 224 kg/thm (1998)– Baosteel 260 kg/thm (1998?)
– NKK 266 kg/thm (1998)
– Current sustainable bestpractice appears to be around200 kg/t PCI along with 285kg/t coke. With oneimportant exception ….

250
270
290
310
330
350
370
390
410
430
450
50 100 150 200 250
Coke
rate
(kg/
thm
)
PCI rate (kg/t hm) Courtesy: CoalTech
Typical relation – Coke Rate & PCIrate
13

TM
CO gas & tar
Breeze
Dry coke at BF
1 tonne dry, useful cokerequires ~ 1.5 tonne ofcoking coal – as shipped(24% VM coking coal - 10 % TM)
14
Coking Coal and Coke
1 tonne of coking coal – asshipped.

BF Input & Output – Typical JSM
COKE:370 kg/t
11-12 % ash60-65 CSR
PCI (1 to 3 coals) :130 kg/t9 % ash0.85 RR3% O21100 deg Blast T
ORE / SINTER / FLUXES1580 kg/t
70 % sinter
1 tonne hot metal+ Slag : 300kg/t
COKE BATTERIES- 125 ovens- 1.5 Mt coke pa- CMC – ½ CDQ
BF : 5150 cu m – 15.0 m dia - 4.1 Mtpa hm (11000 +tpd) - productivity 2.4
Other: TRT – bell less top– HM P 0.12 % -
Coking coal -(8-12 coals)- 520 kg
15
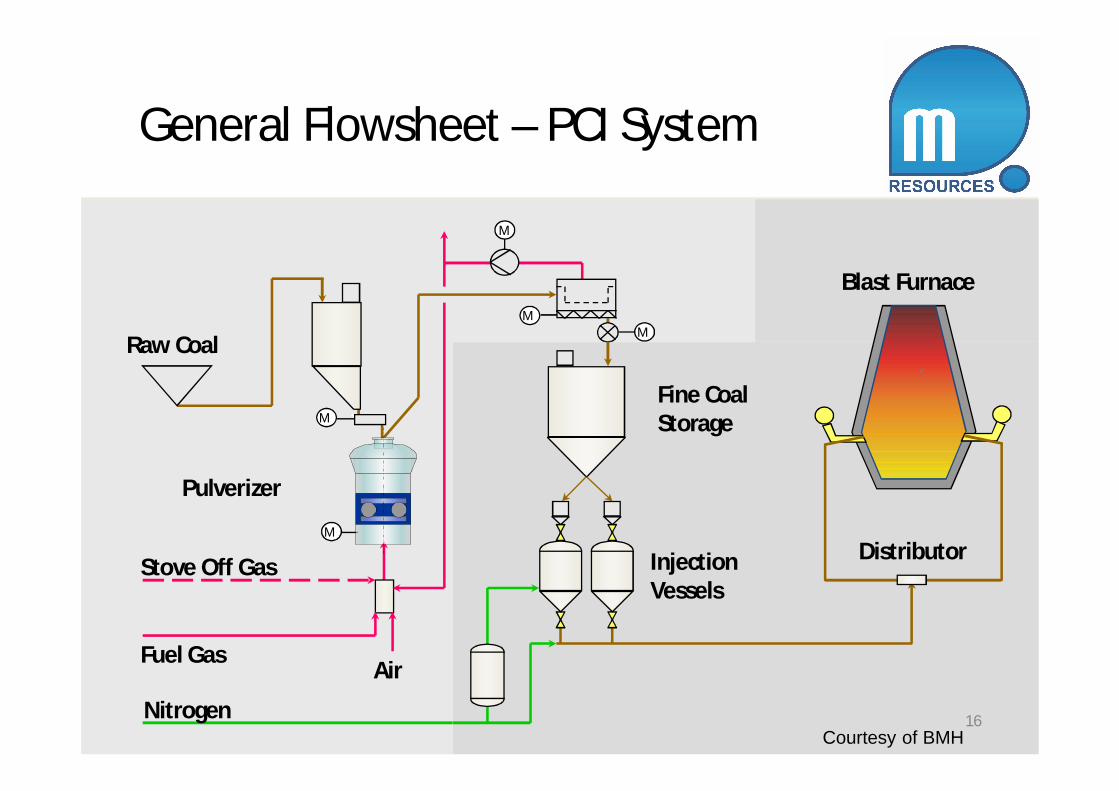
Fine CoalStorage
Fuel Gas
InjectionVessels
Pulverizer
M
MM
M
M
Distributor
Nitrogen
Raw Coal
Stove Off Gas
Blast Furnace
Air
General Flowsheet – PCI System
Courtesy of BMH16

PCI Distribution System
17

Coal Mills
18
Courtesy: BMH

19
Replacement ratio & milling
Low Volcoals
High Volcoals
100% *
140%
* Relative mill throughput30
50
70
90
110
0.6
0.7
0.8
0.9
1
72 76 80 84 88 92
HG
I
Carbon %dafCourtesy: CoalTech

Lance and Tuyere Assembly
20Courtesy: CoalTech

PCI Coal Entering the BF
A single injection lance is most common, optionsinclude double lance, oxygen annulus, pre-heating of coal
21Source: Kuttner

Pulverized Coal Injection into BlastFurnaces
Coke
PCICoal
Coke Ovens Blast Furnace Coal Grinding andInjection System
Courtesy of BMH 22

PCI Plant – Brazil
Injection capacitiesat 200 kg coal/thmüBF 2. 37 t/hüBF 3. 79 t/h
Mill Capacity:ü2 x 60 t/h
23

Components - % as received basis(high vol coal)
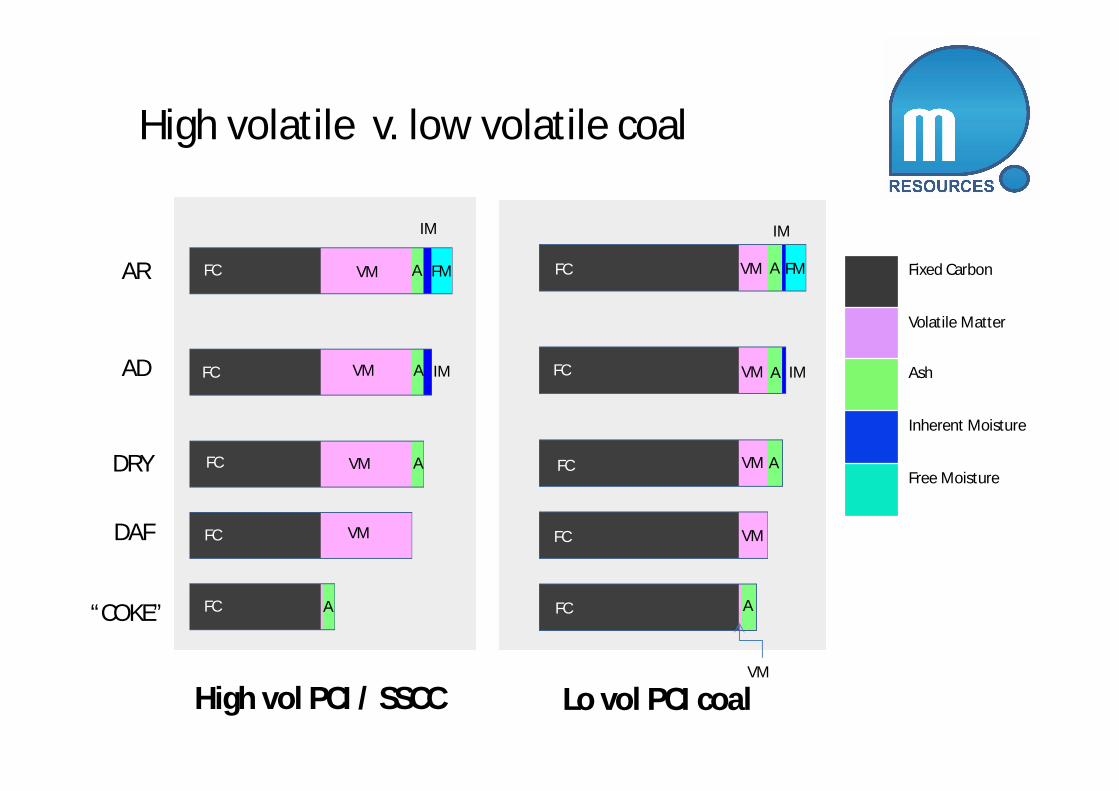
High volatile v. low volatile coal
Fixed Carbon
Volatile Matter
Ash
Inherent Moisture
Free Moisture
Lo vol PCI coalHigh vol PCI / SSCC
FC
FC
FC
FC
FC
VM
VM
VM
VM
A
A
A
A
IM
IM
FM FC
FC
FC
FC
FC
VM
VM
VM
VM
VM
A
A
A
A
IM
FM
IM
AR
AD
DRY
DAF
“COKE”

26
General coal types
0
10
20
30
40
50
60
72 76 80 84 88 92
Vola
tile
Mat
ter%
daf
Carbon %dafCourtesy: CoalTech
ThermalFuel Ratio ~ 2
Coking
Thermal
?

Coke Replacement Ratio Formulae
27Courtesy: CoalTech
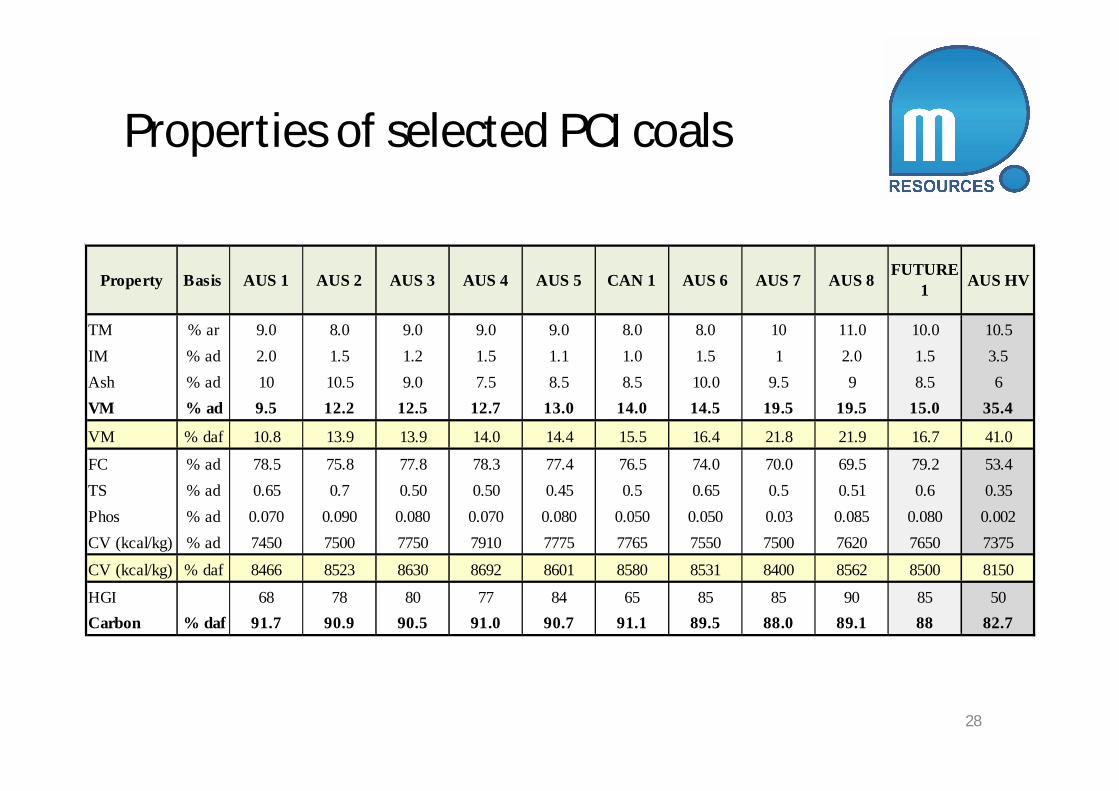
Properties of selected PCI coals
28
TM % ar 9.0 8.0 9.0 9.0 9.0 8.0 8.0 10 11.0 10.0 10.5IM % ad 2.0 1.5 1.2 1.5 1.1 1.0 1.5 1 2.0 1.5 3.5Ash % ad 10 10.5 9.0 7.5 8.5 8.5 10.0 9.5 9 8.5 6VM % ad 9.5 12.2 12.5 12.7 13.0 14.0 14.5 19.5 19.5 15.0 35.4
VM % daf 10.8 13.9 13.9 14.0 14.4 15.5 16.4 21.8 21.9 16.7 41.0
FC % ad 78.5 75.8 77.8 78.3 77.4 76.5 74.0 70.0 69.5 79.2 53.4TS % ad 0.65 0.7 0.50 0.50 0.45 0.5 0.65 0.5 0.51 0.6 0.35Phos % ad 0.070 0.090 0.080 0.070 0.080 0.050 0.050 0.03 0.085 0.080 0.002CV (kcal/kg) % ad 7450 7500 7750 7910 7775 7765 7550 7500 7620 7650 7375
CV (kcal/kg) % daf 8466 8523 8630 8692 8601 8580 8531 8400 8562 8500 8150
HGI 68 78 80 77 84 65 85 85 90 85 50Carbon % daf 91.7 90.9 90.5 91.0 90.7 91.1 89.5 88.0 89.1 88 82.7
AUS 4 AUS HVCAN 1 AUS 6AUS 5 AUS 7AUS 1 AUS 2FUTURE
1AUS 8Property Basis AUS 3

Low Vol PCI Coal High Vol PCI Coal
Low VM Coal High VM Coal
Hot Blast:Equal orSlightly Higher
Hot Blast:Equal orSlightly Lower
O2 Rate:Equal orLower
O2 Rate:Equal orHigher
Permeability:Equal orSlightly Lower
Permeability:Equal orSlightly Higher
Gas Reduction:Lower
Gas Reduction:Higher
RAFT: Higher RAFT: Lower
CombustionEfficiency: Lower
CombustionEfficiency: Higher
Fuel Ratio: LowerCoke Ratio: Lower
Fuel Ratio: HigherCoke Ratio: Higher
Top Gas Vol.: LowerCalorific Value: Lower
Top Gas Vol.: HigherCalorific Value: Higher
Dust : Equal orSlightly Higher
Dust : Equal orSlightly Lower
Impact of PCI Coal Type on BFOperation
29

The PCI advantage (4 Mtpa HM)
High Vol PCI
Coking Coal* 543 kg/tHM @ $U193/t
Yields 388 kg/tHM Coke
* 70:30 HCC : SSCC
PCI 150 kg/tHMRR 0.75 & $US135/t
Coal Cost = US$125 /tHM
= US$ 501 million pa
Savings US$ 24 million pa
Notes: All coal prices fob basis – coke blend of HCC & SSCC coalsExcludes value of by-products, coke oven gas and coke breezeBasis HCC $205, SSCC $147 /t fob. Values rounded. Fuel rate 500 kg/t
Coking Coal * 700 kg/tHM @ $US188/t
Yields 500 kg/tHM Coke
* 80:20 HCC : SSCC
Coal Cost = US$131 /tHM
= US$525 million pa
No PCI
30
Coking Coal* 511 kg/tHM @ $US193/t
Yields 365 kg/tHM Coke
* 70:30 HCC : SSCC
PCI 150 kg/tHMRR 0.90 & $US153/t
Coal Cost = US$ 122 /tHM
= US$ 487 million pa
Savings US$ 38 million pa
Low Vol PCI

Agenda
• Set the Scene
• Technology and Replacement Ratio
• Trade and Consumption
• Pricing and VIU
• Concluding Remarks
31
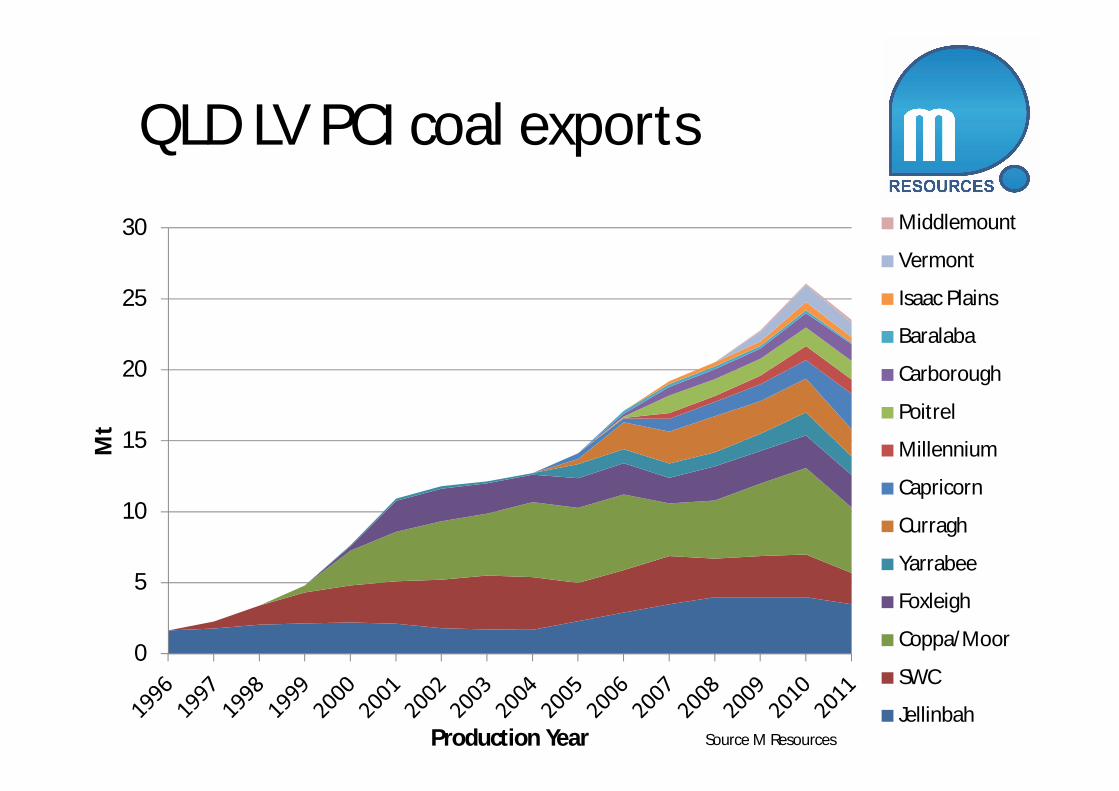
QLD LV PCI coal exports
0
5
10
15
20
25
30
Mt
Production Year
Middlemount
Vermont
Isaac Plains
Baralaba
Carborough
Poitrel
Millennium
Capricorn
Curragh
Yarrabee
Foxleigh
Coppa/Moor
SWC
JellinbahSource M Resources

PCI Coal Demand Predictions
33
0
20
40
60
80
100
120
140
Mt
PCI
Growth in demand arises from :- New blast furnaces coming on line- Installation of PCI to existing furnaces- Increased rates of injection

LV PCI – Seaborne Traded
0
5
10
15
20
25
30
35
40
45
5020
05
2006
2007
2008
2009
2010
2011
2012
2013
2014
2015
2016
2017
2018
2019
2020
Mtp
a
ROWAustralia
405 *Mt
* = all otherMet coal
Source M Resources
ROW countries include:
Canada, Russia /CIS, China
215* Mt
Forecast
34
Agenda
• Set the Scene
• Technology and Replacement Ratio
• Trade and Consumption
• Pricing and VIU
• Concluding Remarks
35

0.5
0.6
0.7
0.8
0.9
1
A B C D E F G H I J K L M N O P Q R S T U V W X Y Z AABB CC
RR(k
g/tc
oke
repl
aced
)
Coal brand
Model outcomes – ReplacementRatios – F-TeCon data
36

0
20
40
60
80
100
120
140
160
180
0.5
0.55
0.6
0.65
0.7
0.75
0.8
0.85
0.9
0.95
A C E G I K M O Q S U W Y AA CC
Calc
ulat
edpr
ice
base
don
VIU
-$/t
fob
RR(k
g/tc
oke
repl
aced
)
Coal brand
Assumed: LV PCI ~$153 /t RR 0.90
Model outcomes – ReplacementRatios – F-TeCon data
37
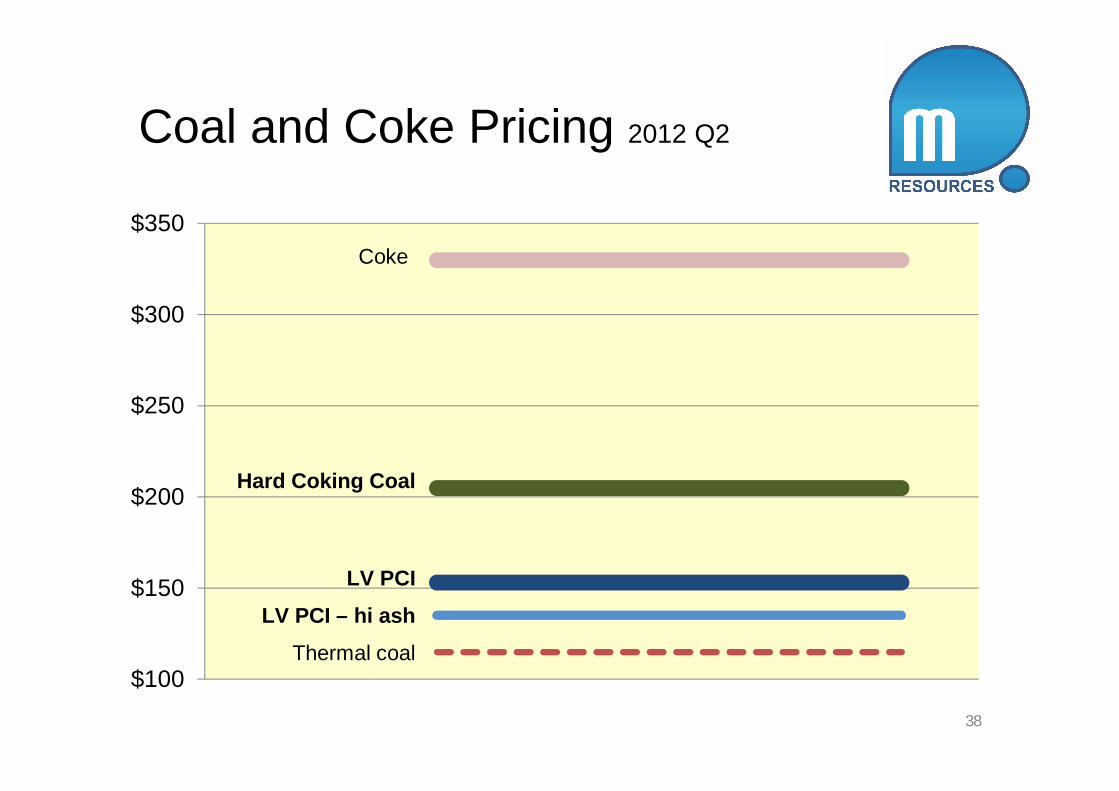
Coal and Coke Pricing 2012 Q2
$100
$150
$200
$250
$300
$350
Hard Coking Coal
LV PCI – hi ashLV PCI
Thermal coal
Coke
38

Coal Pricing 2012 Q2
$100
$120
$140
$160
$180
$200
$220
Hard Coking Coal
LV PCI – hi ash
LV PCI
Thermal coal
39

Ratio - LV PCI price to HCC price(%)
50 55 60 65 70 75 80 85 9019
9719
9819
9920
0020
0120
0220
0320
0420
0520
0620
0720
0820
0920
1020
1120
1220
1320
1420
15
2021
40Source – CRU Feb 12
f
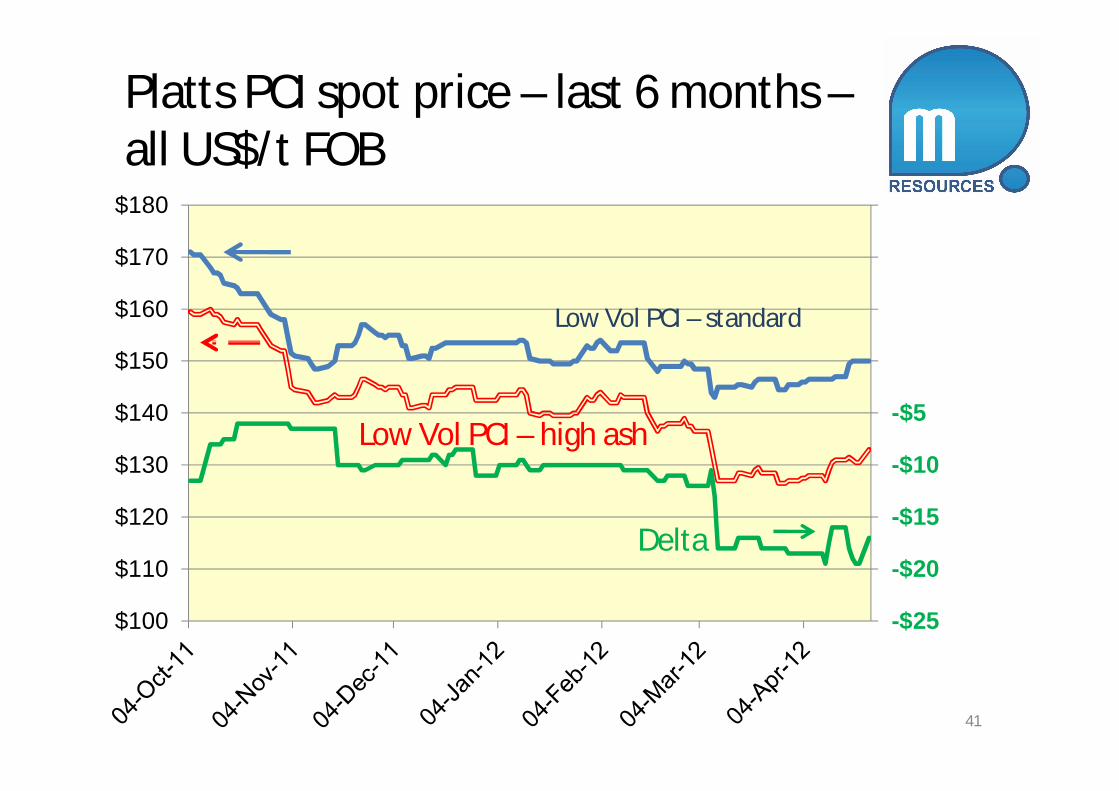
-$25
-$20
-$15
-$10
-$5
$0
$5
$10
$15
$100
$110
$120
$130
$140
$150
$160
$170
$180
Low Vol PCI – standard
Low Vol PCI – high ash
Delta
Platts PCI spot price – last 6 months –all US$/t FOB
41

Yield ash relation from coalwashability data – examples
- 10 20 30 40 50 60 70 80 90
100
- 5 10 15 20
Yiel
d-M
ass
%(c
umul
ativ
e)
Ash % (cumulative)
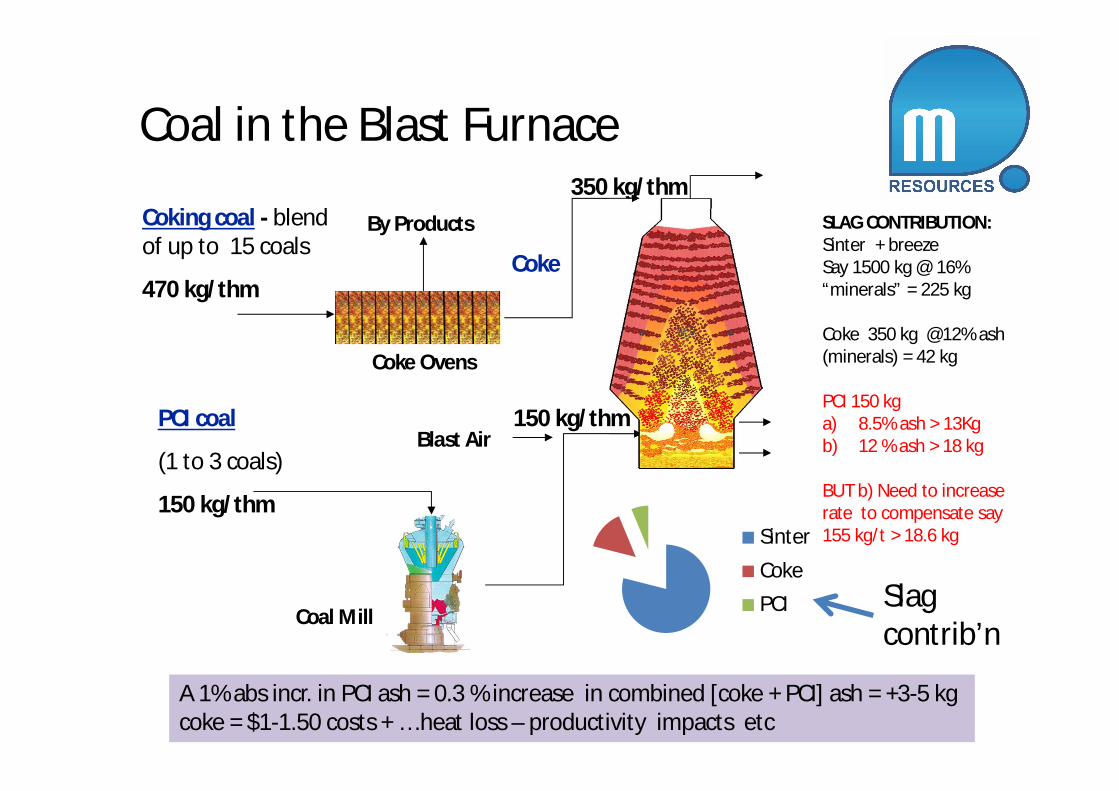
Coking coal - blendof up to 15 coals
470 kg/thm
350 kg/thm
Coke Ovens
PCI coal
(1 to 3 coals)
150 kg/thm
Coal Mill
Blast Air
By Products
Coke
150 kg/thm
SLAG CONTRIBUTION:Sinter + breezeSay 1500 kg @ 16%“minerals” = 225 kg
Coke 350 kg @12% ash(minerals) = 42 kg
PCI 150 kga) 8.5% ash > 13Kgb) 12 % ash > 18 kg
BUT b) Need to increaserate to compensate say155 kg/t > 18.6 kgSinter
CokePCI
A 1% abs incr. in PCI ash = 0.3 % increase in combined [coke + PCI] ash = +3-5 kgcoke = $1-1.50 costs + … heat loss – productivity impacts etc
Coal in the Blast Furnace
Slagcontrib’n

Prices - historical and ONEforecast
44

Recent price forecastsSource: Macquarie Bank & UBS Apr/ May 2012
50
100
150
200
250
300
2010 2011 2012 2013 2014 2015 2016 2017
USD
/tfo
b
m_HCCm_LV PCIm_SSCCm_Thermalu_HCCu_LVPCIu_SSCCu_Thermal
f Low VM PCI - $125 - $175in near term?
Agenda
• Set the Scene
• Technology and Replacement Ratio
• Trade and Consumption
• Pricing and VIU
• Concluding Remarks
46

The Future
• Demand for traded PCI coal is a function of:– BF hot metal production (coastal plants)
– PCI rate (kg/t)
– Number of BF fitted with injection
– Also depends on price competitiveness relative to alternative fuels(thermal coal, oil and gas)
• Immediate outlook is for continuing strong demand withmeasured production increases from existing mines along withnew capacity
• When BFHM production is reduced – buyers have more options.Locking in a ratio of PCI coal to HCC is simplistic
47

THANK YOU
48
TRADINGCoking coalPCIThermal
TRADINGCoking coalPCIThermal
CONSULTING
Coal qualityUtilisation andblendingValue-in-useSpecificationdevelopmentResourceevaluation
CONSULTING
Coal qualityUtilisation andblendingValue-in-useSpecificationdevelopmentResourceevaluation
Brisbane - Australiawww.mresources.com.au
Acknowledgments: CRU, MacquarieBank