pbri 2013 count report
TRANSCRIPT


The preparation of this report has been financed in
part by the Louisiana Department of Transportation
and Development Highway Safety Department.
All Greater New Orleans Pedestrian and Bicycle
Program reports can be found at:
www.norpc.org
or
www.pbriLA.org
Disclaimer
Protection of Data from Discovery & Admission into Evidence
23 U.S.C. 148(h)(4) states “Notwithstanding any other provision of law, reports, surveys, schedules, lists, or data compiled or collected for any
purpose relating to this section [HSIP], shall not be subject to discovery or admitted into evidence in a Federal or State court proceeding or
considered for other purposes in any action for damages arising from any occurrence at a location identified or addressed in the reports, surveys,
schedules, lists, or other data.”
23 U.S.C. 409 states “Notwithstanding any other provision of law, reports, surveys, schedules, lists, or data compiled or collected for the purpose
of identifying, evaluating, or planning the safety enhancement of potential accident sites, hazardous roadway conditions, or railway-highway
crossings, pursuant to sections 130, 144, and 148 of this title or for the purpose of developing any highway safety construction improvement
project which may be implemented utilizing Federal-aid highway funds shall not be subject to discovery or admitted into evidence in a Federal or
State court proceeding or considered for other purposes in any action for damages arising from any occurrence at a location mentioned or
addressed in such reports, surveys, schedules, lists, or data.”
RPC is not responsible for any errors arising from any use of or alterations made to the data nor is it responsible for third party data analysis used
to generate this document. There is no guarantee or warranty concerning the accuracy or evaluation of the data. Users should not use this data for
critical applications without a full awareness of its limitations.

i New Orleans Pedestrian and Bicycle Count Report 2013
July 2013
Contents
List of Tables ..................................................................................................ii
List of Figures ................................................................................................ iii
Acknowledgements ...................................................................................... iv
Executive Summary ...................................................................................... 1
1 .0 Introduction ........................................................................................... 3
1 .1 Orleans Parish Bicycle Network, 2005-2013 ..................................... 3
1.2 Manual Count Site Selection .............................................................. 9
1.3 Electronic Count Location .................................................................. 9
2.0 Count Observation Methodologies ...................................................... 11
2.1 Manual Counts ................................................................................. 12
2.2 Electronic Counts.............................................................................. 12
2.3 Manual Count Estimation and Extrapolation Methodology ............ 14
3.0 Manual Count Data ............................................................................... 15
3.1 Observed Count Totals: Existing Count Sites .................................... 15
3.2 Estimated Daily Traffic for Existing Manual Count Sites, 2010-2013 19
3.3 Observed Count Totals: New Count Sites......................................... 25
3.4 Commuting Patterns near Manual Count Sites ................................ 27
3.5 Mode Shares for Manual Count Sites ............................................... 30
3.6 Demographic and Behavioral Characteristics................................... 32
3.7 Impact of Bicycle Facilities on Usership ........................................... 40
4.0 Electronic Count Data ........................................................................... 44
4.1 Observed Traffic Volumes ................................................................ 44
4.2 Patterns of Use by Hour, Day, Month, and Season .......................... 47
4.3 Meteorological Variables and Traffic Volume .................................. 51
5.0 State, Regional, and National Context: Comparing the Gender Split for
Bicyclist and Pedestrian Commuters .......................................................... 56
5.1 Bicycle Commuting in New Orleans .................................................. 56
5.2 Pedestrian Commuters in New Orleans ........................................... 59
6.0 Conclusions ........................................................................................... 61
6.1 Bicycle Activity in New Orleans ........................................................ 61
6.2 Pedestrian Activity in New Orleans .................................................. 62
6.3 Jefferson Davis Trail .......................................................................... 63
6.4 Evaluating Active Transportation in New Orleans: Policy Implications
and Next Steps ........................................................................................ 63
Appendices.................................................................................................. 65
Appendix A: Manual Count Site Characteristics ................................. 66
Appendix B: Manual Count Observation Protocol ............................. 67
Appendix C: Manual Count Observation Sheets ................................ 70
Appendix D: Manual Count Weather Data ......................................... 72
Appendix E: PBRI Extrapolation Methodology ................................... 74
Appendix F: NBPD Project Count Adjustment Worksheet ................. 75
Appendix G: Additional Automatic Count Data Tables ...................... 78

ii Pedestrian Bicycle Resource Initiative (PBRI)
Regional Planning Commission for Orleans, Jefferson, Plaquemines, St. Bernard, and St. Tammany Parishes
List of Tables
Table 1: 2013 Count Site Locations ..................................................................................................................................................................................................... 10
Table 2: Observed Total Manual Count Volumes for Bicycles, Existing Count Sites, 2010-2013 ........................................................................................................ 17
Table 3: Observed Total Manual Count Volumes, Pedestrians, Existing Count Sites, 2010-2013 ....................................................................................................... 18
Table 4: Estimated Daily Traffic, Bicycles, 2010-2013, Existing Count Sites ....................................................................................................................................... 20
Table 5: Estimated Daily Traffic, Pedestrians, 2010-2013, Existing Count Sites ................................................................................................................................. 22
Table 6: 2013 Bicycle Estimated Daily Traffic ..................................................................................................................................................................................... 23
Table 7: 2013 Pedestrian Estimated Daily Traffic ............................................................................................................................................................................... 24
Table 8: Observed Total Volumes and EDT, Bicycles, 2013, New Count Sites ..................................................................................................................................... 26
Table 9: Observed Total Volumes and EDT, Pedestrians, 2013, New Count Sites ............................................................................................................................... 26
Table 10: Approximate Active Transportation Mode Share for Select Sites ....................................................................................................................................... 30
Table 11: Bicycle and Pedestrian Relative Mode Share, 2010-2013 ................................................................................................................................................... 31
Table 12: Overall Bicyclist Composition, 2010-2013 ........................................................................................................................................................................... 33
Table 13: Overall Pedestrian Composition, 2010-2013 ....................................................................................................................................................................... 34
Table 14: Bicyclist Travel Orientation and Helmet Use by Race ......................................................................................................................................................... 37
Table 15: Bicyclist Composition by Count Site, 2013........................................................................................................................................................................... 38
Table 16: Pedestrian Composition by Count Site 2013 ....................................................................................................................................................................... 39
Table 17: Change in Site Statistics by Presence of Bicycle Facilities, 2010-2013 ................................................................................................................................ 41
Table 18: Jefferson Davis Trail Average User Volumes by Month, 2010-2013 ................................................................................................................................... 46
Table 19: Jefferson Davis Trail User Volume by Day of Week ............................................................................................................................................................. 48
Table 20: Jefferson Davis Trail User Volumes by Month ..................................................................................................................................................................... 49
Table 21: Jefferson Davis Trail User Volume by Season, 2010-2013 ................................................................................................................................................... 50
Table 22: Jefferson Davis Trail Average Daily Temperature and User Volumes ................................................................................................................................. 53
Table 23: Top Cities Over 250,000 for Bicycle Commuting, 2011 ....................................................................................................................................................... 57
Table 24: Regional Bicycling Commuting Statistics, 2011 .................................................................................................................................................................. 57
Table 25: Bicycle Commuting in Louisiana, 2009-2011 ...................................................................................................................................................................... 58
Table 26: Top Cities over 250,000 for Pedestrian Commuting, 2011 .................................................................................................................................................. 59
Table 27: Regional Pedestrian Commuting Statistics, 2011 ............................................................................................................................................................... 60
Table 28: Pedestrian Commuting in Louisiana, 2009-2011 ................................................................................................................................................................ 60

iii New Orleans Pedestrian and Bicycle Count Report 2013
July 2013
List of Figures
Figure 1: Orleans Parish Bicycle Facilities, 2005 ................................................................................................................................................................................... 4
Figure 2: Orleans Parish Bicycle Facilities, 2008 ................................................................................................................................................................................... 5
Figure 3: Orleans Parish Bicycle Facilities, 2010 ................................................................................................................................................................................... 6
Figure 4: Orleans Parish Bicycle Facilities, 2012 ................................................................................................................................................................................... 7
Figure 5: Orleans Parish Bicycle Facilities, 2013 ................................................................................................................................................................................... 8
Figure 6: Map of Electronic and Manual Count Locations, 2013 ........................................................................................................................................................ 11
Figure 7: Jefferson Davis Trail Eco-Counter Installation at Conti St .................................................................................................................................................... 13
Figure 8: Detail of Eco-Counter Infrared Sensing Device .................................................................................................................................................................... 13
Figure 9: Bicyclist Estimated Daily Traffic, 2013 ................................................................................................................................................................................. 21
Figure 10: Pedestrian Estimated Daily Traffic, 2013 ........................................................................................................................................................................... 23
Figure 11: Bicycle Commuters by Census Tract, 2007-2011 ............................................................................................................................................................... 28
Figure 12: Pedestrian Commuters by Census Tract, 2007-2011 ......................................................................................................................................................... 29
Figure 13: Bicycle Commuters and Bicycle Facility Expansion, 2004-2011 ......................................................................................................................................... 43
Figure 14: Jefferson Davis Trail Average Daily Usage, 2010-2013 ...................................................................................................................................................... 45
Figure 15: Jefferson Davis Trail Users by Hour of Day ........................................................................................................................................................................ 47
Figure 16: Jefferson Davis Trail User Volume by Day of Week ........................................................................................................................................................... 48
Figure 17: Jefferson Davis Trail User Volume by Season..................................................................................................................................................................... 50
Figure 18: Temperature and Usership (Daily) ..................................................................................................................................................................................... 51
Figure 19: Temperature and Usership (Weekly) ................................................................................................................................................................................. 52
Figure 20: Temperature and Usership (Monthly) ............................................................................................................................................................................... 53
Figure 21: Precipitation and Average Daily Users by Month .............................................................................................................................................................. 54
Figure 22: Precipitation and Usership (Daily), 2012-2013 .................................................................................................................................................................. 55

iv Pedestrian Bicycle Resource Initiative (PBRI)
Regional Planning Commission for Orleans, Jefferson, Plaquemines, St. Bernard, and St. Tammany Parishes
Acknowledgements
We would like to thank the following individuals who provided
valuable data, insight, and feedback to PBRI and actively
participated in the development of this project:
Billy Fields, Phd.
Assistant Professor, Political Science
Texas State University
Lucien Bruno
Graduate Research Assistant
University of New Orleans
Karen Parsons, AICP
Principal Planner
Regional Planning Commission
Dan Jatres
Pedestrian and Bicycle Program Manager
Regional Planning Commission
And thanks to our dedicated team of manual count observers,
Tierra Anthony, Joseph Caruso, George Clark, Kristine Dickson,
Brandy Dufrene, Jacob Germain, Matthias Helfen, Mariana
Marmol, Emily Nichols, Emily Ramirez, and Sofie Strasser
Disclaimer Protection of Data from Discovery & Admission into Evidence 23 U.S.C. 148(h)(4) states “Notwithstanding any other provision of law, reports, surveys, schedules, lists, or data compiled or collected for any purpose relating to this section [HSIP], shall not be subject to discovery or admitted into evidence in a Federal or State court proceeding or considered for other purposes in any action for damages arising from any occurrence at a location identified or addressed in the reports, surveys, schedules, lists, or other data.”
23 U.S.C. 409 states “Notwithstanding any other provision of law, reports, surveys, schedules, lists, or data compiled or collected for the purpose of identifying, evaluating, or planning the safety enhancement of potential accident sites, hazardous roadway conditions, or railway-highway crossings, pursuant to sections 130, 144, and 148 of this title or for the purpose of developing any highway safety construction improvement project which may be implemented utilizing Federal-aid highway funds shall not be subject to discovery or admitted into evidence in a Federal or State court proceeding or considered for other purposes in any action for damages arising from any occurrence at a location mentioned or addressed in such reports, surveys, schedules, lists, or data.” RPC is not responsible for any errors arising from any use of or alterations made to the data nor is it responsible for third party data analysis used to generate this document. There is no guarantee or warranty concerning the accuracy or evaluation of the data. Users should not use this data for critical applications without a full awareness of its limitations.
1 New Orleans Pedestrian and Bicycle Count Report 2013
July 2013
Executive Summary
Over the last four years during which the Pedestrian Bicycle Resource Initiative at the Merritt C. Becker, Jr. University of New Orleans has conducted pedestrian and bicycle counts, New Orleans has become a recognized leader in the South, and an emerging leader nationwide, in active transportation. Over 50 miles of new bicycle facilities have been constructed, with several miles of additional facilities forthcoming in 2013 and 2014. A series of major street and sidewalk improvements was completed in the French Quarter in 2012, and Complete Streets policies at the local, regional, and state level should ensure that the needs of bicyclists and pedestrians (including transit users) are incorporated in the design and construction of all roadway projects in the future.
The data in this report expands on previous count studies conducted in 2010, 2011, and 2012 documenting active transportation demand and the impact of new facility development. Through bicycle and pedestrian count data collected at 12 manual count locations from 2010 to 2013, two additional Jefferson Parish count locations observed from 2011 to 2013, and one electronic count device installed since May, 2010, this report provides data suggesting that investments in the built environment for bicyclists and pedestrians have resulted in citywide increases in the prevalence of active transportation, particularly in areas where these investments have occurred. This report also provides baseline data for twelve new count locations (including two additional counts in Jefferson Parish) that can be used to inform investment priorities and evaluate post-intervention outcomes in safety and usage.
Overall, this report demonstrates that bicycling and walking are on the rise. Trends toward increasing numbers of bicyclists and
pedestrians at most count locations have continued. In some locations, these trends accelerated from 2012 to 2013. In others, steady, incremental increases were documented. In a very few locations, bike and/or pedestrian activity has decreased, potentially indicating relative deficiency in the infrastructure present and a consequent opportunity for future growth. In total, among existing count sites, the number of bicyclists observed has increased by 63% at the 12 core count locations since 2010, while pedestrians activity has increased by 67%.
The most notable gains and highest observed volumes for bicycles have been at CBD-adjacent “gateway” sites linking the downtown core of the city with residential Uptown neighborhoods, potentially suggesting increased bicycle commuting, as well as on major arterial corridors that include dedicated bicycle facilities (i.e. bike lanes). Overall, bicycle activity at sites with bicycle facilities has increased by 105% over four years, compared to a 56% increase at all count locations combined, and only a 23% increase at locations that have no bicycle facilities present or adjacent.
This study also documents travel behaviors and demographic trends as indicators of safety and opportunities for spatially targeted education efforts. The proportion of cyclists that are female, indicating greater acceptance of bicycling as a means of transportation and typically a more comfortable bicycling environment, has increased over previous years, as has helmet use and correct (on-street, with the flow of traffic) travel orientation. Pedestrian trends, while somewhat more volatile, reinforce the idea of New Orleans as a city where active transportation is gaining traction as a healthy, low-cost alternative to driving, with overall increases at 11 out of 12 core count sites, spread among a diverse set of demographic groups.
PBRI has also collected continuous data on use of the Jefferson Davis Parkway Trail, a multi-use path connecting several

2 Pedestrian Bicycle Resource Initiative (PBRI)
Regional Planning Commission for Orleans, Jefferson, Plaquemines, St. Bernard, and St. Tammany Parishes
neighborhoods, to track broad, long-range active transportation trends. This analysis shows a steady positive trend from year to year toward greater use of this facility, corroborating the increases observed during manual counts and providing insights into temporal shifts in use. Most notably, the trail is well-used even during weeks and months that are extremely hot, very cold, or intensely rainy: in New Orleans, biking and walking are year-round activities for many residents. This report also updates national American Community Survey Data (2011 1-year and 3-year estimates) to show that even as active transportation use has surged in many cities, New Orleans retains its position among the top cities for bicycling and walking commute mode share, improving on the preceding year’s figures to be ranked 9th highest for bicycle commuting and 13th highest for commuting by walking.
Enhancing opportunities for biking and walking is an integral component of advancing a more sustainable, muilti-modal transportation network in the New Orleans region. New Orleans’ efforts to increase the availability and quality of facilities for active transportation has been rewarded with national recognition in addition to the usage gains documented in this report. However, the city and region still have work to do in creating safe, equitable environments for bicycling and walking. Continuing issues which should be addressed by government agencies and/or future research efforts include:
Developing and funding an ongoing program for the collection of multimodal counts and mode-share analysis, including transit users
Linking count and crash data to infrastructure investment priorities and project development
Improving, but still low rates of helmet usage overall and at particular locations and among some demographic groups
Prioritizing “missing links” in the existing bike and pedestrian networks, as well as local and regional
“chokepoints” such as bridges where users are compelled to use deficient infrastructure
Evaluating impacts of specific pedestrian infrastructure investments as well as other factors contributing to pedestrian activity beyond the scope of this report
In sum, New Orleans has made significant progress toward becoming a bikeable, walkable city through investments and policies that facilitate greater active transportation use. In order to continue these trends, improve safety, and promote more sustainable and economically robust communities, the policies and programs that have resulted in such progress must be embraced and institutionalized at all levels of government and within the community, so as to promote the development of more complete, interconnected transportation networks that effectively serve all modes and all users.

3 New Orleans Pedestrian and Bicycle Count Report 2013
July 2013
1 .0 Introduction
Since 2010, the Pedestrian and Bicycle Resource Initiative (PBRI) at the University of New Orleans has conducted a series of bicycle and pedestrian counts at sites around the New Orleans area. The 2013 New Orleans Pedestrian and Bicycle Count Report continued and expanded these counts for a fourth year at a total of 27 sites, in order to build upon the existing data set, identify emerging trends, and build a foundation for future research and analysis as the New Orleans region continues to expand and improve its bicycle and pedestrian infrastructure.
The objectives of this study are to evaluate the impact of recent and planned investments in bicycle and pedestrian infrastructure on active transportation trends in the region over time, providing baseline and (where applicable) post-intervention benchmarks by which to evaluate progress toward achieving higher rates of bicycling and walking in a given community, as well as information regarding user demographics and behaviors that may impact safety outcomes and/or educational campaigns.
In addition, this expanded count study provides additional information on user volumes and characteristics for selected corridors and nodes that have been identified as areas of high pedestrian crash incidence, as evaluated in the New Orleans Multi-Tool Pedestrian Safety Study (PBRI 2013).
This report presents new data from one electronic count device and 26 manual count locations in the New Orleans metropolitan region, and compares this data to that previously collected from 2010-2012. It also provides recommendations for areas of further research and analysis based on the data collected to date, as the region continues to expand its active transportation infrastructure
and implement a “Complete Streets” approach to transportation investment.
1 .1 Orleans Parish Bicycle Network, 2005-2013
New Orleans’ rapid expansion of a bicycle infrastructure network since Hurricane Katrina in 2005 is ongoing and expected to continue with several miles of new infrastructure installed in the second half of 2013. Total bicycle facility mileage has grown from about eleven miles in 2005 to approximately 64 miles in June 2013, including bike lanes, shared lanes, bike boulevards, and off-street multi-use paths. Figures 1 - 5 illustrate the growth of this network over time.
This expansion of the bicycle network has provided an opportunity to monitor the impact of these investments on both overall active transportation activity as well as specific sites where new facilities have been installed. The 2013 count study includes several count sites located on or near existing bicycle facilities, as well as sites where future facility installation is anticipated.
Approximately 8.5 miles of new bicycle facilities were installed between April 2012 and March 2013 (when counts were conducted) including shared and dedicated lanes in the French Quarter connecting to the existing Decatur Street Count location. Several of this year’s manual count locations are located on street segments that have been identified as targets for future bicycle facility installation, including a bike lane on Esplanade Avenue that was under construction at the time of this year’s counts. It is important to continue monitoring these sites post-intervention to evaluate the impact of the new facilities on usage, as it is installed. The expanded set of count locations for which data was collected for this year’s study will enable effective continued impact analysis as several significant new facilities are finished in the next 6-12 months.

4 Pedestrian Bicycle Resource Initiative (PBRI)
Regional Planning Commission for Orleans, Jefferson, Plaquemines, St. Bernard, and St. Tammany Parishes
Figure 1: Orleans Parish Bicycle Facilities, 2005

5 New Orleans Pedestrian and Bicycle Count Report 2013
July 2013
Figure 2: Orleans Parish Bicycle Facilities, 2008

6 Pedestrian Bicycle Resource Initiative (PBRI)
Regional Planning Commission for Orleans, Jefferson, Plaquemines, St. Bernard, and St. Tammany Parishes
Figure 3: Orleans Parish Bicycle Facilities, 2010

7 New Orleans Pedestrian and Bicycle Count Report 2013
July 2013
Figure 4: Orleans Parish Bicycle Facilities, 2012

8 Pedestrian Bicycle Resource Initiative (PBRI)
Regional Planning Commission for Orleans, Jefferson, Plaquemines, St. Bernard, and St. Tammany Parishes
Figure 5: Orleans Parish Bicycle Facilities, 2013
9 New Orleans Pedestrian and Bicycle Count Report 2013
July 2013
1.2 Manual Count Site Selection
In the spring of 2010, PBRI conducted its first manual counts at 13 sites throughout the City of New Orleans, detailed in PBRI’s 2010 State of Active Transportation report.1 These counts were repeated in April and May of 2011, with the addition of counts at two new sites in Jefferson Parish, LA, at Metairie Hammond Highway near South Carrollton Avenue, and at Papworth Avenue near Veterans Boulevard, both sites where bicycle infrastructure improvements have been proposed. 2012’s count study included the same 15 sites, which were selected based on the following criteria:
• Proximity to existing or future bicycle facilities, sidewalk improvements or other infrastructure improvements
• Use as a gateway between the Central Business District (CBD) and Uptown New Orleans
• Representation of a specific neighborhood, in order to gain a more holistic understanding of active transportation trends throughout the city.
In 2013, the count study was expanded to include 12 additional count sites in Orleans and Jefferson Parish, including five sites which correspond to high pedestrian crash incidence, three sites where dedicated bicycle infrastructure is expected to be constructed in the next 12 months, two sites where bicycle infrastructure has been installed and previous data has been collected by Tulane University’s School of Public Health, and two count sites on bridges identified by local bicycle advocacy organization Bike Easy as key regional connections and critical “chokepoints” in the bicycle infrastructure network. One previous count site (Paris and Burbank) was eliminated from the 2013 count program. This expansion of the
1 Accessible at http://transportation.uno.edu/phire-content/
assets/files/PBRI-State%20of%20Active%20Transportation%202010.pdf
scope of the count study not only provides a more comprehensive view of overall walking and bicycling patterns in the New Orleans area, but also provides needed data for a variety of organizations and agencies working to better understand and improve particular aspects of active transportation in the region.
Table 1 lists the manual count sites observed in 2013, and Figure 6 maps these locations. For a detailed breakdown of count site characteristics for all 2013 manual count locations, please refer to Appendix A.
1.3 Electronic Count Location
Since 2010, an infrared electronic count device has been installed on the Jefferson Davis Trail in Mid-City, collecting continuous data on trail use from June 2010 to March 2013. The Jefferson Davis Trail is located on the median of Jefferson Davis Parkway in the Mid-City neighborhood. This trail was selected for continuous electronic data collection due to its connectivity in linking multiple neighborhoods for commuting, its proximity to recreational facilities, and its future intersection with the proposed Lafitte Greenway.
The approximately 1.5 mile facility, which connects with bike lanes from the end of the trail to Washington Avenue, serves as an important active transportation connection between neighborhoods that otherwise are physically separated by Interstate 10. In addition to housing playground equipment and neighborhood open space, this site is also located near the recreational amenities of Bayou St. John, City Park, and the Fairgrounds Race Track.

10 Pedestrian Bicycle Resource Initiative (PBRI)
Regional Planning Commission for Orleans, Jefferson, Plaquemines, St. Bernard, and St. Tammany Parishes
The electronic counter is located at the intersection of Jefferson Davis Trail and Conti St, as shown in Figure 7. A disruption to the pole to which the device is mounted resulted in a loss of data for the months of April and May 2013, therefore this report presents only ten months of data and infers overall trends based on patterns established in previous years.
Table 1: 2013 Count Site Locations
2013 Count Site Locations # Site Boundary Streets
1 Decatur St Iberville St & Canal St
2 Royal St Mandeville St & Marigny St
3 St. Claude Ave Pauline St & Independence St
4 Simon Bolivar Ave (Gateway) Clio St & Calliope St
5 Carondelet St (Gateway) Clio St & Calliope St
6 St. Charles Ave (Gateway) Clio St & Calliope St
7 Camp St (Gateway) Clio St & Calliope St
8 Magazine St (Gateway) Erato St & Calliope St
9 Magazine St (Uptown) Arabella St & Joseph St
10 Esplanade Ave N White St & N Dupre St
11 Gentilly Blvd St. Denis St & Milton St
12 Harrison Ave Gen. Diaz & Harrison Ct
13 Metairie Hammond Hwy Carrollton Ave & Seminole Ave
14 Papworth Ave Veterans Blvd & Raspberry St
15 St. Bernard Ave N Roman St and Derbigny St
16 Airline Dr Williams Blvd and Compromise St
17 Broad St Tulane Ave and Banks St
18 St. Charles Ave (Uptown) Adams St and Hillary St
19 Basin St St Louis St and Toulouse St
20 Williams Blvd Airline Dr and 9th st
21 Nashville Ave S Rocheblave Stand S Tonti St
22 Tulane Ave S Dorgenois St and Broad St
23 Loyola Ave Howard Ave and Julia St
24 S Carrollton Ave Green St and Birch St
25 St. Claude Bridge Poland Ave and Industrial Canal
26 Broad St Bridge Euphrosine St and Howard Ave
27 Jefferson Davis Trail Conti St & Lafitte St

11 New Orleans Pedestrian and Bicycle Count Report 2013
July 2013
2.0 Count Observation
Figure 6: Map of Electronic and Manual Count Locations, 2013

12 Pedestrian Bicycle Resource Initiative (PBRI)
Regional Planning Commission for Orleans, Jefferson, Plaquemines, St. Bernard, and St. Tammany Parishes
Methodologies
This section explains the methodologies utilized by PBRI in performing manual and electronic counts and attempts to qualify their accuracy and effectiveness.
2.1 Manual Counts
Manual counts for this study were completed between March 12th and May 23rd of 2013. PBRI recruited student workers from The University of New Orleans. Workers were trained by UNO Transportation Institute staff on observation protocol, and were required to satisfactorily perform a practice count to gain certification. The Observation Protocol, developed by Kathryn Parker, assistant director of the Tulane Prevention Research Center at the Tulane School of Public Health, can be found in Appendix B. PBRI methodology follows the Tulane protocol, with a few exceptions.
All counts were mid-block screenline counts, during which all counters sat in view of each other on opposite sides of the street, creating a visual “plane of observation” for users to cross and be counted. On streets with a neutral ground,2 each counter tallied users on their side of the street and their sidewalk, while one counter was designated to count users on the neutral ground. If there was no neutral ground at the count site, both counters were responsible for counting all users of the street and both sidewalks. In the case of discrepancies, an average was taken.
2 “Neutral ground” is a colloquial phrase for a median separating street
traffic; this term is used throughout this report.
Counters tallied pedestrians and bicyclists and categorized them by gender, race, and general age group (adult vs. child). Counters also distinguished bicyclists and pedestrians by their travel orientation, i.e. whether they were observed on the street, sidewalk, or neutral ground. For bicyclists, counters also noted helmet usage and right-way vs. wrong-way use, as well as use of a bike lane where applicable. Wrong way use was defined as on-street bicyclists traveling in the opposite direction of traffic. For copies of the tally sheets used by observers, see Appendix C.
Counts were performed on two days for each site, either on a Tuesday, Wednesday, or Thursday. Each day included counts from 7:00-9:00 AM and from 4:00-6:00 PM. These time periods and days of the week are based on recommendations by the National Bicycle and Pedestrian Documentation (NBPD) Project.3 Counts were generally only performed under reasonably good weather conditions (i.e. no heavy rain), although a few observations took place on days of inclement weather (Appendix D).
2.2 Electronic Counts
As mentioned above, the Jefferson Davis Trail electronic count site was equipped with an automated count device (called an Eco-Counter) that was installed in May 2010, and that has continuously recorded trail use for 32 months. This report provides an analysis of the third year of this continuous stream (excluding April and May 2013, when the device was temporarily removed due to the dislocation of the city infrastructure on which it was installed) of data to analyze temporal patterns and variability and understand patterns of use in relation to the first two years of data collected.
3 See http://bikepeddocumentation.org/ for more information

13 New Orleans Pedestrian and Bicycle Count Report 2013
July 2013
The Eco-Counters use passive infrared sensor technology to record all users. Two directional sensors (IN and OUT) count all users within a distance of 4 meters (approximately 13 feet) and record that information in a data box from which it may be retrieved via infrared or Bluetooth technology. Two key limitations to the Eco-Counters are important to note: its inability to distinguish between types of users (bicyclists vs. pedestrians) and potential undercounting due to parallel movement of users. In addition, PBRI has found that Eco-Counter accuracy is also impacted by hardware sensitivity to extreme heat. 4
In order to address these issues and the possibility of other observational error, PBRI staff calibrated the Jefferson Davis Trail machine upon installation, and has performed periodic calibration checks in the subsequent three years to evaluate accuracy. Overall, this device has been found to provide highly accurate and reliable data.5 Anticipated expansions to PBRI’s electronic count collection program in 2013 will enable similar data streams to be made available for additional trail and/or on-street locations, permitting a more accurate and comprehensive analysis of overall trends, as well as enabling greater calibration and reliability testing of manual count extrapolation techniques, as discussed below.
4 This was a major limiting factor for the now-defunct Mississippi River Trail
counter, as discussed in depth in The New Orleans Pedestrian and Bicycle Count Report, 2010-2011 5 Greater than 95% total and directional accuracy rate over four tests
Figure 7: Jefferson Davis Trail Eco-Counter Installation at Conti St
Figure 8: Detail of Eco-Counter Infrared Sensing Device
Photo credits: Taylor Marcantel, 2010

14 Pedestrian Bicycle Resource Initiative (PBRI)
Regional Planning Commission for Orleans, Jefferson, Plaquemines, St. Bernard, and St. Tammany Parishes
2.3 Manual Count Estimation and
Extrapolation Methodology
This section details the methods used to estimate daily, monthly, and yearly volumes of pedestrians and bicyclists at the observed manual count sites. Estimations were not necessary for the electronic count site because it provides a continuous stream of data. The estimations in this report are essentially extrapolations based upon the manual counts performed by PBRI and on temporal patterns of use as suggested by the NBPD Project.
The methodology for extrapolating manual counts to daily, monthly, and annual estimates is based on the methods provided by the National Bicycle and Pedestrian Documentation (NBPD) Project. NBPD methodology classifies count sites as either Multi-use Paths or Pedestrian Districts. Manual Counts are therefore classified as Pedestrian Districts, defined by the NBPD Project as “higher density pedestrian areas with some entertainment uses such as restaurants,” descriptive of nearly all 2013 count locations.
This methodology was previously employed in PBRI’s 2010 State of Active Transportation Report and the New Orleans Pedestrian and Bicycle Count Report, 2010-2011.6 As the latter document summarizes, that methodology includes the following characteristics:
• All count observation periods for a single site are separated into A.M. and P.M. counts. Bicycle and pedestrian counts from both days observed are then averaged together for a combined user average for each time period.
• These averages are used to derive a daily and weekly extrapolation for each time period based on time of the day and day of the week counts were observed.
6 Available at http://pbriLA.org/research
• Weekly extrapolations for A.M. and P.M. counts are then averaged together for each location in order to form the weekly estimate.
• This weekly estimate is multiplied by 4.33 to get the estimated monthly users. The annual estimate is then extrapolated by multiplying this monthly estimate by the monthly adjustment factor provided by the NBPD methodology.
• Estimated Daily Traffic (EDT) for manual count sites is figured by dividing the annual estimate by 365. To disaggregate bicycle and pedestrian estimates at any point, the estimate is simply multiplied by the respective ratio (bicycle vs. pedestrian) observed at the count site.
For more detailed information regarding this methodology refer to Appendices B, C, E, and F, which include a detailed methodological summary as well as the NBPD Adjustment Factors document from which the methodology is derived.
It should be noted that the extrapolation methodology provided by the NBPD Project is based on patterns of use by climate region. These patterns of use influence how much weight any given count will have depending on: the hour of the day, day of the week, and month of the year. NBPD Project methodology provides three climates to choose from, of which New Orleans is categorized into the “Very hot summer, Mild winter” category. While this climate category is the most appropriate selection available, observed trends of use from the continuous electronic counts did not precisely fit this national formula.
Extrapolations for manual counts have not been comprehensively tested for reliability and actual daily traffic volumes may vary based on land uses or user groups that deviate from NBPD’s model or circumstances unique to the New Orleans area that impact local travel patterns. The New Orleans Pedestrian and Bicycle Count

15 New Orleans Pedestrian and Bicycle Count Report 2013
July 2013
Report, 2010-2011 discusses the divergence between the NBPD Project’s patterns of use and the patterns of use observed by Eco-Counters in New Orleans in-depth, and concludes that patterns of use in New Orleans differ from all three climates modeled. Further research, potentially including expanded use of electronic counters in order to evaluate the efficacy of this extrapolation technique is necessary to better understand local patterns of use.
3.0 Manual Count Data
This section summarizes the manual count data collected in 2013 and compares this data to that collected from 2010-2012, where previous years of data exist. It presents actual total counts (observed over a period of eight hours) as well as Estimated Daily Traffic (EDT) figures, and discusses mode share, commuting patterns, and compositional statistics for bicyclists and pedestrians (i.e. gender, helmet use, travel orientation, age, and race).
3.1 Observed Count Totals: Existing Count
Sites
2013 count data show an overall 6.3% increase in the total number of bicyclists and a 14.7% increase in the number of pedestrians observed at the 12 core count sites observed since 2012 (Tables 2 and 3). Overall, counters observed 145 more cyclists at these count sites than the previous year, and 902 more pedestrians. Although not as rapid an increase in cyclists observed as the previous two years of count data, these figures suggest that ridership is increasing steadily even though planned infrastructure improvements at some of the sites have not yet been completed. Pedestrians observed have increased steadily each year at these sites, possibly reflecting both ongoing improvements to the pedestrian network as well as an overall trend toward greater levels of walking as a form of transportation or for fitness.
An approximately 12% decrease in bicyclists and 19% increase in pedestrians at the two existing Jefferson Parish sites was observed (Tables 2 and 3). However, the total user numbers at these two sites have been consistently very low so this difference actually represents a very minor variation in usage.

16 Pedestrian Bicycle Resource Initiative (PBRI)
Regional Planning Commission for Orleans, Jefferson, Plaquemines, St. Bernard, and St. Tammany Parishes
Of these 14 sites, nine experienced 2012-2013 increases in cyclists, with the strongest percentage gains at Gentilly Boulevard, Camp Street, Papworth Avenue, and Esplanade Avenue. The greatest absolute increases in cyclists observed were at Gentilly Boulevard, Camp Street, and Esplanade Avenue.
Only four sites (Harrison Avenue, Royal Street, Metairie Hammond Highway, and Papworth Avenue) have experienced longer-term declines in use from 2010 to present. Of these, Metairie Hammond Highway, Papworth Avenue, and Harrison Avenue both represent relatively low-volume sites where planned infrastructure has not yet been constructed. Royal Street, on the other hand, the only count site which has had decreasing volumes of cyclists each year of the study, is located in a neighborhood with very high rates of bicycle commuting, and may therefore indicate a displacement of users to other nearby routes with improved facilities (such as St. Claude Avenue), rather than an actual decrease in bicycle use. Notably, the sites with the highest rates of increase in cyclists observed over the four-year period were St. Claude Avenue, where a bike lane was installed in 2008, and Gentilly Boulevard, where a bike lane was installed in 2010, suggesting a clear relationship between facility construction and use (discussed further in section 3.7).
Similarly, all but two of the 14 existing count sites have experienced four-year increases in pedestrian volumes observed, though figures have been somewhat more volatile for pedestrian activity. Strong 2012-2013 percentage increases were observed at Papworth Avenue, Harrison Avenue, Carondelet Street, Magazine Street (gateway), and Simon Bolivar Avenue. The greatest absolute increase in observed pedestrians was at Decatur Street, the most heavily trafficked count location by a wide margin, followed by substantial absolute increases at Simon Bolivar Avenue, St. Charles Avenue, and Harrison Avenue.
One of the two sites with an overall decrease, Metairie Hammond Highway, has minimal and incomplete pedestrian infrastructure and also experienced inclement weather on one of the 2013 observation days, possibly accounting for the apparent decline. The other, Gentilly Boulevard, has experienced a 4% decline overall for reasons that are not known. The most rapid increases in observed pedestrians over the four year period occurred on Esplanade Avenue and Decatur Street, both of which are located in mixed-use historic districts with regular tourist traffic. Harrison Avenue, a commercial corridor that has experienced robust growth over the last several years, has also seen a very strong increase in pedestrian activity.

17 New Orleans Pedestrian and Bicycle Count Report 2013
July 2013
Table 2: Observed Total Manual Count Volumes for Bicycles, Existing Count Sites, 2010-2013
Observed Total Manual Count Volumes, Bicycles, 2010-2013, Existing Count Sites Observed Volume Absolute Change Percent Change
2010-2013 Count Sites 2010 2011 2012 2013 2010-2011
2011-2012
2012-2013
2010-2013
2010-2011
2011-2012
2012-2013
2010-2013
Harrison Ave*** 27 33 48 23 6 15 -25 -4 22.2% 45.5% -52.1% -14.8%
Gentilly Blvd* 46 69 76 173 23 7 97 127 50.0% 10.1% 127.6% 276.1%
Esplanade Ave 105 117 185 217 12 68 32 112 11.4% 58.1% 17.3% 106.7%
Royal St 377 295 281 253 -82 -14 -28 -124 -21.8% -4.7% -10.0% -32.9%
St. Claude Ave*** 96 153 266 287 57 113 21 191 59.4% 73.9% 7.9% 199.0%
Magazine St (Uptown) 38 63 95 92 25 32 -3 54 65.8% 50.8% -3.2% 142.1%
Camp St (Gateway)** 157 249 276 332 92 27 56 175 58.6% 10.8% 20.3% 111.5%
Magazine St(Gateway)** 153 223 285 266 70 62 -19 113 45.8% 27.8% -6.7% 73.9%
Decatur St**** 150 199 258 262 49 59 4 112 32.7% 29.6% 1.6% 74.7%
Simon Bolivar Ave (Gateway)** 86 150 175
161 64 25 -14 75 74.4% 16.7% -8.0% 87.2%
Carondelet St (Gateway) 87 114 103 115 27 -11 12 28 31.0% -9.6% 11.7% 32.2%
St. Charles Ave (Gateway) 191 229 269 281 38 40 12 90 19.9% 17.5% 4.5% 47.1%
Total 1513 1894 2317 2462 381 423 145 949 25.2% 22.3% 6.3% 62.7%
Observed Volume Absolute Change Percent Change
2011-2013 Count Sites
2011 2012 2013
2011-2012
2012-2013
2011-2013
2011-2012
2012-2013
2011-2013
Metairie Hammond Hwy 14 13 10 -1 -3 -4 -7.1% -23.1% -28.6%
Papworth Ave 6 4 5 -2 1 -1 -33.3% 25.0% -16.7%
Total 20 17 15 -3 -2 -5 -15.0% -11.8% -25.0%
Notes:
*Bicycle facilities installed before April, 2011 on observed segment of facility
**Bicycle facilities installed before April, 2011 on connecting segment of facility
***Bicycle facilities already present in 2010, either on observed segment or on connecting segment
****Bicycle facilities installed before March, 2013 on connecting segment of facility
Observed total volumes represent a total of eight hours of counts per site

18 Pedestrian Bicycle Resource Initiative (PBRI)
Regional Planning Commission for Orleans, Jefferson, Plaquemines, St. Bernard, and St. Tammany Parishes
Table 3: Observed Total Manual Count Volumes, Pedestrians, Existing Count Sites, 2010-2013
Observed Total Manual Count Volumes, Pedestrians, 2010-2013, Existing Count Sites Observed Volume Absolute Change Percent Change
2010-2013 Count Sites 2010 2011 2012 2013 2010-2011
2011-2012
2012-2013
2010-2013
2010-2011
2011-2012
2012-2013
2010-2013
Harrison Ave*** 124 117 164 285 -7 47 121 161 -5.6% 40.2% 73.8% 129.8%
Gentilly Blvd* 126 140 127 121 14 -13 -6 -5 11.1% -9.3% -4.7% -4.0%
Esplanade Ave 230 289 607 573 59 318 -34 343 25.7% 110.0% -5.6% 149.1%
Royal St 324 314 371 376 -10 57 5 52 -3.1% 18.2% 1.3% 16.0%
St. Claude Ave*** 230 205 536 325 -25 331 -211 95 -10.9% 161.5% -39.4% 41.3%
Magazine St (Uptown) 330 269 321 338 -61 52 17 8 -18.5% 19.3% 5.3% 2.4%
Camp St (Gateway)** 144 183 189 199 39 6 10 55 27.1% 3.3% 5.3% 38.2%
Magazine St (Gateway)** 159 187 229 334 28 42 105 175 17.6% 22.5% 45.9% 110.1%
Decatur St**** 1,313 1,902 2,547 3,053 589 645 506 1740 44.9% 33.9% 19.9% 132.5%
Simon Bolivar Ave (Gateway)** 608 433 494
692 -175 61 198 84 -28.8% 14.1% 40.1% 13.8%
Carondelet St (Gateway) 81 101 92 140 20 -9 48 59 24.7% -8.9% 52.2% 72.8%
St. Charles Ave (Gateway) 550 501 460 603 -49 -41 143 53 -8.9% -8.2% 31.1% 9.6%
Total 4219 4641 6137 7039 422 1496 902 2820 10.0% 32.2% 14.7% 66.8%
Observed Volume Absolute Change Percent Change
2011-2013 Count Sites
2011 2012 2013
2011-2012
2012-2013
2011-2013
2011-2012
2012-2013
2011-2013
Metairie Hammond Hwy 20 32 7 12 -25 -13 60.0% -78.1% -65.0%
Papworth Ave 21 15 49 -6 34 28 -28.6% 226.7% 133.3%
Total 41 47 56 6 9 15 14.6% 19.1% 36.6%
Notes:
*Bicycle facilities installed before April, 2011 on observed segment of facility
**Bicycle facilities installed before April, 2011 on connecting segment of facility
***Bicycle facilities already present in 2010, either on observed segment or on connecting segment
****Bicycle facilities installed before March, 2013 on connecting segment of facility
Observed total volumes represent a total of eight hours of counts per site

19 New Orleans Pedestrian and Bicycle Count Report 2013
July 2013
3.2 Estimated Daily Traffic for Existing
Manual Count Sites, 2010-2013
In order to provide context to the numbers and allow for comparison of data with other count studies, count volumes observed by PBRI counters have been extrapolated to Estimated Daily Traffic (EDT) figures (Tables 4 and 5; Figures 9 and 10). This methodology was outlined above and is further elaborated in Appendix E.
Extrapolation of the data to a 24-hour period, while revealing trends identical to direct observations, somewhat reduces the impact of fluctuations observed during the eight hours of count collection on overall percent change, as higher usage rates during peak morning and afternoon hours would not necessarily translate to correspondingly higher rates of use at off peak times. For bicycles, a slight 2.6% EDT increase is calculated from 2012-2013 among the 12 core count sites, resulting in a 55.9% total increase from 2012-2013. For pedestrians, a 12.2% EDT increase is documented in those 12 sites from 2012-2013 for a total increase of 51.3% from 2010-2013.
Overall, bicycling trends have been more stable than pedestrian trends, with fewer rapid gains and decreases from year to year. However, both modes have experienced a four-year increase at most locations, with overall trends more apparent over this longer data range despite such volatility.
2012 Estimated Daily Traffic, Ranked
Overall, the top sites for estimated daily bicycle traffic in 2013 were St. Charles Avenue (Uptown), Camp Street (CBD gateway), St. Charles Avenue (CBD gateway), Loyola Avenue, and Magazine Street (CBD gateway) (Table 6). Just below these are a cluster of count locations in the French Quarter, Marigny, Bywater, and Bayou St. John neighborhoods. This is consistent with previous data suggesting strong rates of ridership into and out of the CBD and in bicycle-friendly downtown neighborhoods. In addition, the addition of new count sites with very high volumes of bicycle traffic demonstrates that bicycle activity is widespread, and demand for the new facilities on St. Charles Avenue, Loyola Avenue, and Esplanade Avenue is strong. Suburban and residential locations have the lowest bicycle EDT, consistent with previous years of data, while Uptown, Mid-City, Central City, and bridge locations tend to fall in the middle of the range.
As in previous years, Decatur Street’s very high pedestrian EDT easily surpasses any other count site, while Simon Bolivar Avenue has surpassed Esplanade Avenue for the second highest figure (Table 7). High pedestrian EDT strongly corresponds elsewhere to major activity centers (such as the vicinity of Tulane and Broad), or mixed-use arterials with commercial attractions, pedestrian amenities such as trees, and/or transit. Again, the lowest pedestrian EDTs were found in environments that are clearly inhospitable to pedestrians, including the Airline/Williams intersection and both bridges, as well as suburban residential count locations with minimal pedestrian attractors.

20 Pedestrian Bicycle Resource Initiative (PBRI)
Regional Planning Commission for Orleans, Jefferson, Plaquemines, St. Bernard, and St. Tammany Parishes
Table 4: Estimated Daily Traffic, Bicycles, 2010-2013, Existing Count Sites
Estimated Daily Traffic (EDT), Bicycles, 2010-2013, Existing Count Sites EDT Absolute Change Percent Change
2010-2013 Count Sites 2010 2011 2012 2013 2010-2011
2011-2012
2012-2013
2010-2013
2010-2011
2011-2012
2012-2013
2010-2013
Harrison Ave*** 71 87 150 68 16 63 -82 -3 22.5% 72.4% -54.7% -4.2%
Gentilly Blvd* 151 217 250 505 66 33 255 354 43.7% 15.2% 102.0% 234.4%
Esplanade Ave 330 332 557 739 2 225 182 409 0.6% 67.8% 32.7% 123.9%
Royal St 1,056 901 832 712 -155 -69 -120 -344 -14.7% -7.7% -14.4% -32.6%
St. Claude Ave*** 437 395 824 827 -42 429 3 390 -9.6% 108.6% 0.4% 89.2%
Magazine St (Uptown) 121 163 262 263 42 99 1 142 34.7% 60.7% 0.4% 117.4%
Camp St (Gateway)** 598 850 1,073 1,202 252 223 129 604 42.1% 26.2% 12.0% 101.0%
Magazine St (Gateway)** 471 783 955 857 312 172 -98 386 66.2% 22.0% -10.3% 82.0%
Decatur St 490 586 775 754 96 189 -21 264 19.6% 32.3% -2.7% 53.9%
Simon Bolivar Ave (Gateway)** 332 565 638 579 233 73 -59 247 70.2% 12.9% -9.2% 74.4%
Carondelet St (Gateway) 322 423 376 407 101 -47 31 85 31.4% -11.1% 8.2% 26.4%
St. Charles Ave (Gateway) 665 748 977 953 83 229 -24 288 12.5% 30.6% -2.5% 43.3%
Total 5,044 6,050 7,669 7,866 1,006 1,619 197 2,822 19.9% 26.8% 2.6% 55.9%
EDT Absolute Change Percent Change
2011-2013 Count Sites
2011 2012 2013
2011-2012
2012-2013
2011-2013
2011-2012
2012-2013
2011-2013
Metairie Hammond Hwy n/a 41 50 26 9 -24 -15 22.0% -48.0% -36.6%
Papworth Ave n/a 19 11 15 -8 4 -4 -42.1% 36.4% -21.1%
Total 60 61 41 1 -20 -19 1.7% -32.8% -31.7%
Notes:
*Bicycle facilities installed before April, 2011 on observed segment of facility
**Bicycle facilities installed before April, 2011 on connecting segment of facility
***Bicycle facilities already present in 2010, either on observed segment or on connecting segment
Observed total volumes represent a total of eight hours of counts per site

21 New Orleans Pedestrian and Bicycle Count Report 2013
July 2013
Figure 9: Bicyclist Estimated Daily Traffic, 2013

22 Pedestrian Bicycle Resource Initiative (PBRI)
Regional Planning Commission for Orleans, Jefferson, Plaquemines, St. Bernard, and St. Tammany Parishes
Table 5: Estimated Daily Traffic, Pedestrians, 2010-2013, Existing Count Sites
Estimated Daily Traffic (EDT), Pedestrians, 2010-2013, Existing Count Sites EDT Absolute Change Percent Change
2010-2013 Count Sites 2010 2011 2012 2013 2010-2011
2011-2012
2012-2013
2010-2013
2010-2011
2011-2012
2012-2013
2010-2013
Harrison Ave*** 325 307 514 844 -18 207 330 519 -5.5% 67.4% 64.2% 159.7%
Gentilly Blvd* 412 441 418 353 29 -23 -65 -59 7.0% -5.2% -15.6% -14.3%
Esplanade Ave 723 819 1,828 1,951 96 1,009 123 1,228 13.3% 123.2% 6.7% 169.8%
Royal St 907 959 1,098 1,059 52 139 -39 152 5.7% 14.5% -3.6% 16.8%
St. Claude Ave*** 1,047 529 1,661 937 -518 1,132 -724 -110 -49.5% 214.0% -43.6% -10.5%
Magazine St (Uptown) 1,054 696 885 965 -358 189 80 -89 -34.0% 27.2% 9.0% -8.4%
Camp St (Gateway)** 548 624 735 721 76 111 -14 173 13.9% 17.8% -1.9% 31.6%
Magazine St (Gateway)** 490 657 767 1,076 167 110 309 586 34.1% 16.7% 40.3% 119.6%
Decatur St 4,289 5,600 7,650 8,782 1,311 2,050 1,132 4,493 30.6% 36.6% 14.8% 104.8%
Simon Bolivar Ave (Gateway)**
2,345 1,631 1,800 2,490 -714 169 690 145 -30.4% 10.4% 38.3% 6.2%
Carondelet St (Gateway) 300 375 336 495 75 -39 159 195 25.0% -10.4% 47.3% 65.0%
St. Charles Ave (Gateway) 1,915 1,635 1,671 2,045 -280 36 374 130 -14.6% 2.2% 22.4% 6.8%
Total 14,355 14,273 19,363 21,718 -82 5,090 2,355 7,363 -0.6% 35.7% 12.2% 51.3%
EDT Absolute Change Percent Change
2011-2013 Count Sites
2011 2012 2013
2011-2012
2012-2013
2011-2013
2011-2012
2012-2013
2011-2013
Metairie Hammond Hwy n/a 58 123 18 65 -105 -40 112.1% -85.4% -69.0%
Papworth Ave n/a 66 42 145 -24 103 79 -36.4% 245.2% 119.7%
Total 124 165 163 41 -2 39 33.1% -1.2% 31.5%
Notes: *Bicycle facilities installed before April, 2011 on observed segment of facility
**Bicycle facilities installed before April, 2011 on connecting segment of facility
***Bicycle facilities already present in 2010, either on observed segment or on connecting segment
Observed total volumes represent a total of eight hours of counts per site

23 New Orleans Pedestrian and Bicycle Count Report 2013
July 2013
Figure 10: Pedestrian Estimated Daily Traffic, 2013

24 Pedestrian Bicycle Resource Initiative (PBRI)
Regional Planning Commission for Orleans, Jefferson, Plaquemines, St. Bernard, and St. Tammany Parishes
Table 6: 2013 Bicycle Estimated Daily Traffic Table 7: 2013 Pedestrian Estimated Daily Traffic
2013 Bicycle Estimated Daily Traffic
Rank, by EDT
Count Site EDT 2013 2012 2011 2010
St. Charles Ave (Uptown) 1,338 1 n/a n/a n/a
Camp St (Gateway) 1,202 2 1 2 3
St. Charles Ave (Gateway) 953 3 2 4 2
Loyola Ave 892 4 n/a n/a n/a
Magazine St (Gateway) 857 5 3 3 5
St. Claude Ave 827 6 5 8 6
Decatur St 754 7 6 5 4
Esplanade Ave 739 8 8 9 8
Royal St 712 9 4 1 1
South Carrollton Ave 613 10 n/a n/a n/a
Simon Bolivar Ave (Gateway) 579 11 7 6 7
Gentilly Blvd 505 12 11 10 10
Carondelet St (Gateway) 407 13 9 7 9
Broad St 376 14 n/a n/a n/a
St. Claude Bridge 332 15 n/a n/a n/a
Basin St 322 16 n/a n/a n/a
St. Bernard Ave 288 17 n/a n/a n/a
Magazine St (Uptown) 263 18 10 11 11
Tulane Ave 263 19 n/a n/a n/a
Broad St Bridge 186 20 n/a n/a n/a
Nashville Ave 124 21 n/a n/a n/a
Harrison Ave 68 22 12 12 12
Airline Dr 36 23 n/a n/a n/a
Williams Blvd 28 24 n/a n/a n/a
Metairie Hammond Hwy 26 25 14 13 n/a
Papworth Ave 15 26 15 15 n/a
2013 Pedestrian Estimated Daily Traffic Rank, by EDT
Count Site EDT 2013 2012 2011 2010
Decatur St 8,782 1 1 1 1
Simon Bolivar Ave (Gateway) 2,490 2 3 3 2
St. Charles Ave (Gateway) 2,045 3 4 2 3
Esplanade Ave 1,951 4 2 5 7
Tulane Ave 1,731 5 n/a n/a n/a
Broad St 1,652 6 n/a n/a n/a
Loyola Ave 1,620 7 n/a n/a n/a
Basin St 1,344 8 n/a n/a n/a
St. Charles Ave (Uptown) 1,304 9 n/a n/a n/a
Magazine St (Gateway) 1,076 10 8 7 9
Royal St 1,059 11 6 4 6
Magazine St (Uptown) 965 12 7 6 4
St. Claude Ave 937 13 5 9 5
South Carrollton Ave 919 14 n/a n/a n/a
Harrison Ave 844 15 10 12 11
St. Bernard Ave 807 16 n/a n/a n/a
Camp St (Gateway) 721 17 9 8 8
Carondelet St (Gateway) 495 18 12 11 12
Gentilly Blvd 353 19 11 10 10
St. Claude Avenue Bridge 263 20 n/a n/a n/a
Williams Blvd 209 21 n/a n/a n/a
Nashville Ave 177 22 n/a n/a n/a
Airline Dr 163 23 n/a n/a n/a
Papworth Ave 145 24 15 14 n/a
Broad St Bridge 99 25 n/a n/a n/a
Metairie Hammond Hwy 18 26 14 15 n/a

25 New Orleans Pedestrian and Bicycle Count Report 2013
July 2013
3.3 Observed Count Totals: New Count Sites
The 12 additional count sites included in the 2013 study indicate a wide range of usage levels for these facilities, ranging from very low bicycle use at the Jefferson Parish thoroughfares of Airline Drive and Williams Boulevard, to very high usage at St. Charles Avenue (Uptown), Loyola Avenue, and South Carrollton Avenue, all of which have recently-installed dedicated bike lanes (Table 8). Pedestrian patterns are similar, with low volumes in Jefferson Parish and at the residential Nashville Avenue count location, and high volumes on major arterials including Broad Street, Tulane Avenue, Loyola Avenue, St. Charles Avenue, and Basin Street (Table 9).
Notably, bicycle and pedestrian volumes at the St. Claude Avenue and Broad Street Bridge count sites, while relatively low, still represent a significant number of users given the inhospitable nature of both facilities, with estimated daily traffic (discussed below) of 332 bicyclists and 263 pedestrians per day on the St. Claude Bridge, and 186 bicyclists and 99 pedestrians estimated to cross the Broad Street Bridge each day.
Data from Williams Blvd, Airline Drive, Loyola Avenue, Tulane Avenue, and Broad Street (in addition to Simon Bolivar Avenue from the existing count locations) informs user trends for three key pedestrian crash hot spots (See: New Orleans Multi-Tool Pedestrian Safety Study, PBRI 2013). While bicycle volumes are relatively low at the two Jefferson Parish sites, crash incidences are among the highest in the region, suggesting that the existing pedestrian infrastructure is insufficient to safely allow access to this commercial hub. Similarly, substantial user volumes at the remaining two hot spots (Tulane/Broad and Loyola/Calliope) suggest that crashes are a function of high pedestrian demand in these areas, and infrastructure (particularly at intersections) that is insufficiently equipped to prioritize pedestrian needs accordingly.
Data for Basin Street, St. Bernard Avenue, and Nashville Avenue represents baseline data by which to evaluate future impacts resulting from the construction of new bicycle and improved pedestrian infrastructure expected to be completed later in 2013. In addition, user volumes for Tulane Avenue and South Broad Street may be useful in informing future anticipated improvements to these corridors in the coming years.

26 Pedestrian Bicycle Resource Initiative (PBRI)
Regional Planning Commission for Orleans, Jefferson, Plaquemines, St. Bernard, and St. Tammany Parishes
Table 8: Observed Total Volumes and EDT, Bicycles, 2013, New Count Sites Table 9: Observed Total Volumes and EDT, Pedestrians, 2013, New Count Sites
Observed Total Manual Count Volumes and Estimated Daily Traffic (EDT), Bicycles, 2013, New Count Sites
Count Site 2013 Observed
Volume 2013 Estimated
EDT
Williams Blvd 9 28
Airline Dr 10 36
Loyola Ave* 267 892
Tulane Ave 71 263
S Broad St 112 376
St. Charles Ave (Uptown)* 441 1,338
St. Bernard Ave 88 288
Basin St 99 322
Nashville Ave 37 124
South Carrollton Ave* 206 613
Broad St Bridge 57 186
St. Claude Ave Bridge* 105 332
Notes: *Bicycle facilities installed before March 2013 on observed segment of facility
**Bicycle facilities installed before March 2013 on connecting segment of facility
Observed total volumes represent a total of eight hours of counts per site
Observed Total Manual Count Volumes and Estimated Daily Traffic (EDT), Pedestrians, 2013, New Count Sites
Count Site 2013 Observed
Volume 2013 Estimated
EDT
Williams Blvd 68 209
Airline Dr 45 163
Loyola Ave* 485 1,620
Tulane Ave 468 1,731
S Broad St 492 1,652
St. Charles Ave (Uptown)* 430 1,304
St. Bernard Ave 247 807
Basin St 413 1,344
Nashville Ave 53 177
South Carrollton Ave* 309 919
Broad St Bridge 31 99
St. Claude Ave Bridge* 81 263
Notes: *Bicycle facilities installed before March 2013 on observed segment of facility
**Bicycle facilities installed before March 2013 on connecting segment of facility
Observed total volumes represent a total of eight hours of counts per site

27 New Orleans Pedestrian and Bicycle Count Report 2013
July 2013
3.4 Commuting Patterns near Manual Count
Sites
Utilizing census tract-level data from the American Community Survey 2007-2011 five year estimates, commuting patterns were mapped in Figures 11 and 12. Active transportation commutes have increased slightly overall citywide from the previous year, but census-tract level patterns remain relatively stable. As in previous years analyzed, count sites with high observed volumes tend to be located in or near census tracts with higher rates of active transportation commuting.
The manual count sites with the highest 2013 bicyclist EDT (St. Charles Avenue, the CBD gateways of Camp Street, St. Charles Avenue, Loyola Avenue, and Magazine Street, as well as St. Claude Avenue in the Marigny/Bywater area) are within or adjacent to the census tracts with the highest rates of 2007-2011 bicyclist commuting (6% or more). One exception exists at the Gentilly Boulevard count location, where high 2013 ridership was observed, but 2011 bicyclist mode share for commuting is low.
Conversely, the lowest EDT sites (Papworth Avenue and Metairie Hammond Highway in Metairie, as well as Harrison Avenue and Nashville Avenue in Lakeview and Uptown, respectively) are near census tracts with low rates of commuting by bicycle (zero to 5%). Again, there are exceptions to this trend that were not observed in previous years of this study, such as a relatively high rate of bicycle commuting in the vicinity of Airline Drive and Williams Boulevard, but low rates of observed use, potentially indicating that cyclists are selecting alternate, more bike-friendly routes for their work trips.
For pedestrians, correlations between commute mode and observed use are difficult to discern, as in previous years. Land uses,
neighborhood demographics, and infrastructure may all play a role in pedestrian activity observed. Although some sites in or adjacent to census tracts with high rates of pedestrian commuting (e.g. Decatur Street and St. Charles Avenue, as well as some CBD gateway sites) also represent areas of high observed pedestrian totals, this is not consistently the case. Other sites with high observed numbers of pedestrians likely reflect non-work pedestrian trips (e.g. shopping, recreation, and public services)
As observed in previous iterations of this count report, it is important to note that 5-year ACS estimates for the 2007-2011 period include years of rapid transition in New Orleans following Hurricane Katrina. It is therefore difficult to clearly discern trends in active transportation commuting at this geographic scale and draw relationships to PBRI count observations, due to the small sample sizes and high margins of error involved. Figure 13 in section 3.7 further examines the relationships between commute mode share, observed count volumes, and facility construction from 2004-2011.

28 Pedestrian Bicycle Resource Initiative (PBRI)
Regional Planning Commission for Orleans, Jefferson, Plaquemines, St. Bernard, and St. Tammany Parishes
Figure 11: Bicycle Commuters by Census Tract, 2007-2011

29 New Orleans Pedestrian and Bicycle Count Report 2013
July 2013
Figure 12: Pedestrian Commuters by Census Tract, 2007-2011

30 Pedestrian Bicycle Resource Initiative (PBRI)
Regional Planning Commission for Orleans, Jefferson, Plaquemines, St. Bernard, and St. Tammany Parishes
3.5 Mode Shares for Manual Count Sites
The New Orleans Pedestrian and Bicycle Count Report, 2010-2011 examined mode share by comparing active transportation count data with automobile Average Daily Traffic (ADT) data collected by the New Orleans Regional Planning Commission at locations proximate to manual count sites. This analysis has been updated to include new count sites as well as more recent automobile count figures from both the Regional Planning Commission and Louisiana Department of Transportation and Development (Table 10). Using this data, we can construct a rough approximation of the mode share of selected facilities.
Notably, transit riders are not accounted for in this analysis. In addition, the bicycle and pedestrian EDT figures have an unknown margin of error as noted above, and motor vehicle counts are not necessarily from the same year as bicycle and pedestrian counts. Future data collection efforts should attempt to refine upon this analysis in order to more accurately capture all road users, including transit riders, and to coordinate the timing and location of future counts.
Combining estimated daily traffic for bicycling and walking with automobile ADT reveals that active transportation may account for a substantial percentage of overall daily traffic, particularly at points of entry and exit to the CBD. The highest active transportation mode shares are at Camp Street with 28%, up from 23% in 2011, and Magazine Street with 15.8%, an increase from 12.3% in 2011. Very low estimated mode shares are found in Jefferson Parish, and on the St. Claude Bridge. Elsewhere, active transportation mode shares fail to reach the levels found in and approaching downtown, but tend to be higher than the figures for ACS commute mode share described above, which only capture trips to and from employment.
Table 10: Approximate Active Transportation Mode Share for Select Sites
Approximate Mode Share for Select Sites
2013 Bicycle/ Pedestrian
EDT Motorized Vehicle ADT Total
# % # Year % #
Camp St (Gateway) 1,923 27.9% 4,960 2009 72.1% 6,883
Magazine St (Gateway)
1,933 15.8% 10,287 2009 84.2% 12,220
St. Charles Ave (Uptown)
2,642 12.9% 17,839 2008 87.1% 20,481
Simon Bolivar Ave (Gateway)
3,069 11.5% 23,579 2009 88.5% 26,648
Loyola Ave 2,512 9.6% 23,579 2009 90.4% 26,091
St. Charles Ave (Gateway)
2,998 9.3% 29,180 2009 90.7% 32,178
Tulane Ave 1,994 8.5% 21,451 2010 91.5% 23,445
S Broad St 2,028 8.0% 23,244 2008 92.0% 25,272
St. Claude Ave 1,764 6.9% 23,714 2008 93.1% 25,478
S Carrollton Ave 1,532 6.0% 23,926 2008 94.0% 25,458
Gentilly Blvd 858 4.0% 20,366 2008 96.0% 21,224
Williams Blvd 237 2.5% 9,423 2011 97.5% 9,660
St. Claude Ave Bridge 595 1.6% 36,644 2010 98.4% 37,239
Airline Dr 199 0.7% 26,372 2011 99.3% 26,571
Metairie Hammond Hwy
44 0.3% 16,126 2011 99.7% 16,170
Source http://www.norpc.org/traffic_counts.html; http://www.dotd.la.gov/highways/tatv/default.asp

31 New Orleans Pedestrian and Bicycle Count Report 2013
July 2013
Table 11: Bicycle and Pedestrian Relative Mode Share, 2010-2013
Table 11 shows the relative mode shares for bicyclists
and pedestrians at each count site from 2010-2013. As in
previous years, the majority of count sites have a greater
share of pedestrians than bicyclists. The exceptions to
this in 2013 are the Broad St Bridge, Camp Street,
Gentilly Blvd, Metairie Hammond Highway, the St. Claude
Bridge, and St. Charles Avenue (Uptown), which were
observed to have a greater number of bicyclists than
pedestrians. Sites with very high relative pedestrian
mode shares include Harrison Avenue and Decatur Street
(both active commercial areas), Papworth Avenue and
Williams Blvd (both of which had very low numbers of
both), and Tulane Avenue (located at a transit hub and
proximal to numerous public services and other
pedestrian attractors. These figures are largely consistent
with previous years of data, except where large increases
or decreases in only one mode (such as Gentilly Blvd and
St. Claude Avenue).
Bicycle and Pedestrian Relative Mode Share, 2010-2013 2013 2012 2011 2010
Site %
Bike % Ped %
Bike %
Ped %
Bike % Ped %
Bike %
Ped
Broad St Bridge 65% 35% n/a n/a n/a n/a n/a n/a
Camp St (Gateway) 63% 37% 59% 41% 58% 42% 52% 48%
Gentilly Blvd 59% 41% 37% 63% 33% 67% 27% 73%
Metairie Hammond Hwy 59% 41% 29% 71% 41% 59% n/a n/a
St. Claude Ave Bridge 56% 44% n/a n/a n/a n/a n/a n/a
St. Charles Ave (Uptown) 51% 49% n/a n/a n/a n/a n/a n/a
St. Claude Ave 47% 53% 33% 67% 43% 57% 29% 71%
Carondelet St (Gateway) 45% 55% 53% 47% 53% 47% 52% 48%
Magazine St (Gateway) 44% 56% 55% 45% 54% 46% 49% 51%
Nashville Ave 41% 59% n/a n/a n/a n/a n/a n/a
Royal St 40% 60% 43% 57% 48% 52% 54% 46%
South Carrollton Ave 40% 60% n/a n/a n/a n/a n/a n/a
Loyola Ave 36% 64% n/a n/a n/a n/a n/a n/a
St. Charles Ave (Gateway) 32% 68% 37% 63% 31% 69% 26% 74%
Esplanade Ave 27% 73% 23% 77% 29% 71% 31% 69%
St. Bernard Ave 26% 74% n/a n/a n/a n/a n/a n/a
Magazine St (Uptown) 21% 79% 23% 77% 19% 81% 10% 90%
Basin St 19% 81% n/a n/a n/a n/a n/a n/a
Simon Bolivar Ave (Gateway) 19% 81% 26% 74% 26% 74% 12% 88%
S Broad St 19% 81% n/a n/a n/a n/a n/a n/a
Airline Dr 18% 82% n/a n/a n/a n/a n/a n/a
Tulane Ave 13% 87% n/a n/a n/a n/a n/a n/a
Williams Blvd 12% 88% n/a n/a n/a n/a n/a n/a
Papworth Ave 9% 91% 21% 79% 22% 78% n/a n/a
Decatur St 8% 92% 9% 91% 9% 91% 10% 90%
Harrison Ave 7% 93% 23% 77% 22% 78% 18% 82%

32 Pedestrian Bicycle Resource Initiative (PBRI)
Regional Planning Commission for Orleans, Jefferson, Plaquemines, St. Bernard, and St. Tammany Parishes
3.6 Demographic and Behavioral
Characteristics
This section summarizes the user characteristics of bicyclists and pedestrians observed in 2013, including gender, age category (adult versus child), race, travel orientation, and helmet use for bicyclists (Tables 12 and 13). Gender, helmet use, and travel orientation are important indicators of bicyclist safety and perceptions toward bicycling, while age group and race illustrate demographic variances in usership and highlight potential opportunities to target future safety and educational campaigns to the groups and neighborhoods that could best benefit from them.
Tables 15 and 16 break down these attributes by count location for bicycles and pedestrians respectively, highlighting how various characteristics shift dramatically by location.
Gender
As has been widely documented in the literature, the proportion of female bicyclists is a strong indicator of the perceived safety and bicycle-friendliness of a location. Higher percentages of women and girls indicate a more comfortable cycling environment for all users. To some extent, this may also be true of high female pedestrian activity in a given area, although less research exists documenting this subject. After three years of relatively stable ratios of males to females at the 14 core count sites (including the two Jefferson Parish sites for which counts began in 2011), 2013 saw a notable increase in female bicyclists and a sharp spike in female pedestrians. Female bicyclists increased from 28% of all cyclists at these sites to 31.1%, while female pedestrians increased from 42.4% of the total to 58.1%. As noted above, pedestrian count figures have tended to be more volatile than cyclist counts, therefore it is unclear whether
this jump is indicative of a major shift in active transportation among women, or simply a circumstantial anomaly.
Notably, inclusion of the 12 new count sites in 2013 in these summary statistics reflects a much smaller overall change in the gender breakdown of users, with females representing 28.7% of all cyclists and 40.6% of all pedestrians counted, consistent with previous years of data for the smaller dataset. Increases at this core set of count sites, however, suggest that after several years of stagnation, active transportation use among women may be on the rise in the New Orleans area. Sites with the highest female bicyclist percentage include Metairie Hammond Highway (although again, this site has very low overall bicycle volumes), Harrison Avenue, St. Charles Avenue (Uptown), and Camp Street. Very low percentages of female cyclists are found at Airline Drive, the Broad Street Bridge, and Loyola Avenue. The last of these is surprising, as the literature has shown that female ridership tends to be higher on corridors with dedicated bicycle facilities, as Loyola now has. Future count studies should continue to track this facility for demographic shifts over time.
Count locations with the highest percentage of female pedestrians include Magazine Street, St. Charles Avenue, and Nashville Avenue, with women and girls constituting greater than 50% of users. Low female pedestrian percentage sites include Metairie Hammond Highway, the Broad Street Bridge, and Simon Bolivar Avenue each with less than 25% of users identified as female.

33 New Orleans Pedestrian and Bicycle Count Report 2013
July 2013
Table 12: Overall Bicyclist Composition, 2010-2013
Overall Bicyclist Composition, 2010-2013 Continuing Count Sites, 2010-2013 All 2013 Count Sites
Percent of Total Percentage Point Change Percent of Total
2010 2011 2012 2013 2012-2013 2010-2013 2013
Male Bicyclists 72.9% 72.1% 72.3% 69.0% -3.3% -4.0% 71.3%
Female Bicyclists 27.1% 27.9% 28.0% 31.1% 3.0% 4.0% 28.7%
White Bicyclists 70.3% 72.5% 73.1% 73.9% 0.8% 3.6% 69.7%
Black Bicyclists 19.3% 20.5% 21.7% 21.5% -0.1% 2.3% 25.7%
Other Bicyclists 8.7% 7.0% 5.2% 4.6% -0.7% -4.2% 4.6%
Adult Bicyclists n/a 98.7% 98.4% 98.1% -0.3% n/a 98.1%
Youth Bicyclists n/a 1.3% 1.6% 1.5% -0.1% n/a 1.9%
Helmet Users 10.4% 16.3% 15.8% 20.9% 5.1% 10.5% 23.0%
Travel Orientation:
Street - Right Way 75.5% 73.9% 80.2% 82.1% 2.0% 6.7% 81.0%
Street - Wrong Way 11.6% 9.7% 7.9% 7.3% -0.6% -4.3% 7.0%
Sidewalk 12.6% 16.1% 11.6% 10.4% -1.2% -2.2% 11.8%
Neutral Ground 0.4% 0.3% 0.3% 0.2% -0.1% -0.2% 0.2%
Notes: in 2010, At Harrison Ave site, race/ethnicity wasn't included in one of the four counts. Adult/Youth data not available for 2010.

34 Pedestrian Bicycle Resource Initiative (PBRI)
Regional Planning Commission for Orleans, Jefferson, Plaquemines, St. Bernard, and St. Tammany Parishes
Table 13: Overall Pedestrian Composition, 2010-2013
Overall Pedestrian Composition, 2010-2013
Existing Count Sites, 2010-2013 All 2013 Count Sites
Percent of Total Percentage Point Change Percent of Total
2010 2011 2012 2013 2012-2013 2010-2013 2013
Male Pedestrians 60.0% 60.3% 57.6% 41.9% -15.7% -18.1% 59.4%
Female Pedestrians 40.0% 39.7% 42.4% 58.1% 15.7% 18.1% 40.6%
White Pedestrians 57.1% 65.5% 62.0% 67.0% 5.0% 9.9% 58.4%
Black Pedestrians 32.0% 28.1% 31.2% 27.6% -3.6% -4.4% 36.1%
Other Pedestrians 8.1% 6.3% 6.8% 5.4% -1.4% -2.8% 5.5%
2011-2013
Adult Pedestrians n/a 96.4% 96.1% 96.2% 0.1% -0.2% 95.4%
Youth Pedestrians n/a 3.6% 3.9% 3.8% -0.1% 0.2% 4.6%
Travel Orientation: 2011-2013
Sidewalk n/a 92.6% 92.9% 92.7% -0.2% 0.1% 91.3%
Street n/a 4.7% 4.8% 4.9% 0.1% 0.3% 4.8%
Neutral Ground n/a 2.8% 2.3% 2.4% 0.1% -0.4% 3.9%
Notes: in 2010, race/ethnicity wasn't included in one of the four counts at Harrison Avenue. No data on travel orientation was collected for pedestrians in 2010. Adult/Youth data not available for 2010.

35 New Orleans Pedestrian and Bicycle Count Report 2013
July 2013
Race
Racial characteristics of users, categorized as “black,” “white,” or “other,” did not diverge substantially from data collected in previous years. These categories, assigned by the student observers, are highly subjective and used here for descriptive purposes only.
Among the existing 14 count sites, 73.9% of cyclists were identified as white 21.5% as black, and 4.6% as other. Over the four year period from 2010-2013, this reflects a slight increase in the percentage of white and black bicyclists, and a slight decrease in those identified as “other.” Among all 26 count locations, a slightly smaller percentage were identified as white (69.7%) and a greater percentage were identified as black (25.7%), likely reflective in part of the demographics of the neighborhoods surrounding the new count locations.
Similarly, pedestrian race statistics appear to be even more closely tied to the specific demographic characteristics of the neighborhoods adjacent to the count sites. Among the 14 existing count sites, there was a 5% increase in 2013 in the percentage of white pedestrians identified, with corresponding decreases in those identified as black or other. This is consistent with four-year trends indicating a greater percentage of pedestrians that are white overall. As with cyclists however, when all 26 count locations for 2013 are included, we see a greater share of pedestrians identified as black (36.1%).
Age
As in previous years of data, the percentage of bicyclists and pedestrians identified as youths, i.e. 14 or younger, remains very small, at 1.5% of bicyclists and 3.8% of pedestrians. Observers are instructed in techniques for assessing age category, however it remains a subjective determination. Exceptions include Harrison
Avenue, where 21.7% of all cyclists observed were identified as youths. Notably, relatively high percentages of youth cyclists were identified at Nashville Avenue (5.4%) and St. Bernard Avenue (4.5%), on segments where future bicycle facilities are planned. In addition, 4.5% of cyclists crossing the St. Claude Avenue Bridge, a gap point in the St. Claude bicycle lane on either side of the bridge, of were identified as youths. Each of these three corridors would more safely serve their existing young users through the provision of dedicated bicycle facilities. Among pedestrians, Metairie Hammond Highway, St. Bernard Avenue, St. Claude Avenue, and the St. Claude Avenue bridge all noted percentages of youths greater than 15%, the latter three of which are all within walking distance of one or more schools.
Helmet Use
Although helmet use is not mandatory among adults in Louisiana, helmet use is an important indicator of bicyclist safety. After a slight decrease in helmet use from 2011 to 2012, the percentage of cyclists wearing helmets observed at the 14 existing count sites increased by 5.1% in 2013 to 20.9%, an overall 10.5% increase over the four year period from 2010 to 2013. Among all 26 count sites, the total percentage of helmet wearers was 23%, an encouraging trend, though still well below leading cities for cycling nationwide. The highest rates of helmet use were observed at Harrison Avenue (60.9%), Papworth Avenue (60%), St. Charles Avenue (Uptown) (44%), Nashville Avenue (43.2%), Metairie Hammond Highway (40%), and Gentilly Boulevard (32.4%). Very low rates of helmet use were observed at Airline Drive (0%), Williams Boulevard (0%), Simon Bolivar Avenue (6.2%), Tulane Avenue (8.5%), and Broad St (8.9%). Areas with particularly low helmet use rates should be identified as targets for future campaigns promoting cyclist safety.

36 Pedestrian Bicycle Resource Initiative (PBRI)
Regional Planning Commission for Orleans, Jefferson, Plaquemines, St. Bernard, and St. Tammany Parishes
Travel Orientation
Travel orientation describes the direction and surface on which pedestrians and bicyclists are traveling. Bicyclists were sorted into the following categories for travel orientation: Right Way Riders (traveling in the street with the flow of traffic); Wrong Way Riders (traveling in the street against the flow of traffic); Sidewalk Riders; and Neutral Ground (median) Riders. Pedestrians are categorized as traveling on the sidewalk (or, in the case of Papworth Avenue which lacks sidewalks, on the curb), in the street, or on the Neutral Ground. Bicycling in the wrong direction or on the sidewalk or neutral ground, in addition to being illegal, significantly reduces safety for cyclists, drivers, and pedestrians alike, while pedestrians observed in the street may indicate gaps or inadequacies in the pedestrian infrastructure in the area.
Among bicyclists at the 14 existing count sites, there was a 2% increase in right-way, on-street riding (from 80.2% to 82.1%) from 2012 to 2013 and a corresponding decrease in each other category. Over the four-year period from 2010-2013, right-way riding increased by 6.7%, an encouraging trend. In particular, wrong-way on-street riding has decreased by 4.3%, while sidewalk riding has decreased at a slower rate. Among all 26 count locations, right-way riding is slightly lower at 81%, with slightly higher rates of sidewalk riding. Cyclist use of the neutral ground, where applicable, remains very low at .2%. Where dedicated bike lanes exist, their use is very high among on-street riders (87-99%), with most exceptions observed outside of the lane due to obstructions or in preparation for a left turn.
Sites with the highest rates of right-way, on-street cycling include: Nashville Avenue (100%), St. Charles Avenue (Uptown) (99.1%), Esplanade Avenue (90.8%), South Carrollton Avenue (90.8%), and Royal Street (90.5%). Count locations with the highest rates of wrong-way, on-street cycling include: Airline Drive (40%), Metairie
Hammond highway (30%), Papworth Avenue (20%), Simon Bolivar Avenue (26.1%) and St. Bernard Avenue (23.9%). A high percentage of sidewalk cycling was observed on Williams Boulevard (100%), Tulane Avenue (50.7%), Airline Drive (50%), Harrison Avenue (43.5%), and Broad Street (33%).
Among pedestrians at the existing 14 count locations, sidewalk use decreased by a tiny margin (0.2%), for an overall 0.1% increase from 2011-2013 (the years for which pedestrian travel orientation was collected). Neutral ground and street travel have remained similarly stable, with a 0.4% decrease in neutral ground use over the three year period, perhaps attributable to the Regional Transit Authority’s 2012 campaign to reduce streetcar collisions by discouraging walking and jogging on the tracks. Among all 26 count sites, on-street travel orientation is comparable at 4.8%, while neutral ground travel makes up a higher percentage of the total (due to the inclusion of several more streets that have medians) at 3.9%. A few sites in particular have very high rates of non-sidewalk pedestrian travel orientation. On Metairie Hammond Highway, an absence of concrete sidewalks left 100% of pedestrians walking on the street, while 17.6% of pedestrians at Simon Bolivar Avenue, 17.8% at Airline Drive, and 17.1% at Carondelet Street were observed walking in the roadway. Significant use of the neutral ground occurred at St. Charles Avenue (Uptown) (28.8%), Harrison Avenue (15.4%, where the neutral ground is used for parking), and South Carrollton Avenue (15.2%).
As identified in the New Orleans Pedestrian and Bicycle Count Report 2012, there remain clear correlations between bicyclist race and travel orientation/helmet use (Table 14). Right-way, on street ridership among both black and white cyclists increased in 2013 to 63.3% and 88.2% respectively, while correct travel orientation for those identified as “other” dropped to 67.9%. Both cyclists identified as “other” and black continue to be observed riding against traffic or on the sidewalk at greater rates than white cyclists.

37 New Orleans Pedestrian and Bicycle Count Report 2013
July 2013
In addition, disparities in helmet use remain sharp; while helmet use increased significantly from 2012 to 2013 among white riders, helmet use among cyclists identified as black and “other” has held steady or even decreased. Targeting future education efforts to the areas and populations at an increased safety risk from lack of helmet use or improper travel orientation is recommended to counteract these findings.
Table 14: Bicyclist Travel Orientation and Helmet Use by Race
Bicyclist Travel Orientation and Helmet Use by Race
White Black Other
2012 2013 2012 2013 2012 2013
Right Way 87.2% 88.2% 58.2% 63.3% 74.2% 67.9%
Wrong Way/Sidewalk/Neutral Ground 12.8% 11.8% 41.8% 36.7% 25.8% 32.1%
Helmet Use 20.1% 31.6% 2.3% 2.0% 10.5% 6.0%

38 Pedestrian Bicycle Resource Initiative (PBRI)
Regional Planning Commission for Orleans, Jefferson, Plaquemines, St. Bernard, and St. Tammany Parishes
Table 15: Bicyclist Composition by Count Site, 2013
Bicyclist Composition, by Count Site, 2013 (Ordered by EDT)
Gender Race Age Group Helmet Use Travel Orientation
Site Female Male White Black Other Adult Youth %
Street- Right Way
Street- Wrong
Way Sidewalk Neutral Ground
Bike Lane Use (of
on-street riders)
St. Charles Ave (Uptown)* 41.0% 59.0% 88.0% 8.4% 3.6% 98.2% 1.8% 44.0% 99.1% 0.2% 0.7% 0.0% 98.6%
Camp St (Gateway)**** 40.7% 59.3% 87.7% 8.7% 3.6% 99.4% 0.6% 22.6% 84.3% 0.0% 15.7%
St. Charles Ave (Gateway) 27.1% 73.0% 78.3% 18.5% 3.2% 98.6% 1.4% 27.4% 86.5% 1.4% 10.7% 1.4%
Loyola Ave* 9.7% 90.3% 45.7% 49.8% 4.5% 98.1% 1.9% 22.9% 74.9% 10.5% 13.9% 0.8% 86.8%
Magazine St (Gateway)**** 35.3% 64.7% 82.7% 9.4% 7.9% 99.6% 0.4% 24.4% 82.3% 6.8% 10.9%
St. Claude Ave***** 31.7% 68.3% 59.2% 37.3% 3.5% 97.6% 2.4% 16.4% 87.5% 7.7% 4.5% 0.4% 96.3%
Decatur St**** 28.6% 71.4% 69.5% 20.2% 10.3% 98.5% 1.5% 11.8% 77.1% 5.7% 17.2%
Esplanade Ave 31.3% 68.7% 86.2% 10.6% 3.2% 99.5% 0.5% 28.1% 90.8% 0.9% 8.3% 0.0%
Royal St 33.2% 66.8% 90.5% 5.1% 4.4% 97.1% 2.9% 13.4% 90.5% 7.9% 1.6%
S Carrollton Ave* 27.7% 72.8% 71.4% 21.4% 7.3% 100.0% 0.0% 26.2% 90.8% 1.9% 7.3% 0.0% 98.9%
Simon Bolivar Ave (Gateway)**** 11.8% 88.2% 18.0% 81.4% 6.2% 98.1% 1.9% 6.2% 55.3% 26.1% 18.6% 0.0%
Gentilly Blvd*** 34.1% 65.9% 75.1% 21.1% 1.7% 97.1% 2.9% 32.4% 85.0% 14.6% 0.6% 0.0% 96.5%
Carondelet St (Gateway) 22.6% 77.4% 59.1% 31.3% 9.6% 97.4% 2.6% 13.9% 72.2% 20.9% 7.0%
S Broad St 10.7% 89.3% 37.5% 56.3% 6.3% 96.4% 3.6% 8.9% 51.8% 13.4% 33.0%
Basin St 25.3% 74.8% 58.6% 34.3% 7.1% 97.0% 3.0% 23.2% 71.7% 17.2% 11.1% 0.0%
St. Claude Bridge** 20.0% 75.2% 58.1% 41.0% 1.0% 95.2% 4.8% 11.4% 71.4% 0.0% 28.6%
St. Bernard Ave 21.0% 79.0% 61.0% 38.0% 1.0% 95.5% 4.5% 14.8% 59.1% 23.9% 17.1%
Magazine St (Uptown) 26.1% 73.9% 76.1% 22.8% 1.1% 97.8% 2.2% 27.2% 76.1% 4.4% 19.6%
Tulane Ave 16.9% 83.1% 50.7% 47.9% 1.4% 98.6% 1.4% 8.5% 43.7% 5.6% 50.7%
Broad St Bridge 8.8% 91.2% 35.1% 49.1% 15.8% 100.0% 0.0% 12.3% 70.2% 8.8% 21.1%
Nashville Ave 35.1% 64.9% 78.4% 16.2% 5.4% 94.6% 5.4% 43.2% 100.0% 0.0% 0.0% 0.0%
Harrison Ave***** 43.5% 56.5% 91.3% 8.7% 0.0% 78.3% 21.7% 60.9% 56.5% 0.0% 43.5%
Airline Dr 0.0% 100.0% 20.0% 80.0% 0.0% 90.0% 10.0% 0.0% 10.0% 40.0% 50.0%
Williams Blvd 11.1% 88.9% 22.2% 66.7% 11.1% 100.0% 0.0% 0.0% 0.0% 0.0% 100.0%
Metairie Hammond Hwy 70.0% 30.0% 100.0% 0.0% 0.0% 90.0% 10.0% 40.0% 70.0% 30.0% 0.0%
Papworth Ave 20.0% 80.0% 80.0% 20.0% 0.0% 100.0% 0.0% 60.0% 80.0% 20.0% 0.0%
Notes: *Bicycle facilities installed before March 2013 on observed segment of facility ; **Bicycle facilities installed before March 2013 on connecting segment of facility
***Bicycle facilities installed before April, 2011 on observed segment of facility ; ****Bicycle facilities installed before April, 2011 on connecting segment of facility
*****Bicycle facilities already present in 2010, either on observed segment or on connecting segment

39 New Orleans Pedestrian and Bicycle Count Report 2013
July 2013
Table 16: Pedestrian Composition by Count Site 2013
Pedestrian Composition, by Count Site, 2013 (Ordered by EDT) Gender Race Age Group Travel Orientation
Site Female Male White Black Other Adult Youth Sidewalk Street Neutral Ground
Decatur St 47.2% 52.7% 80.4% 13.1% 6.5% 98.1% 1.9% 98.7% 1.3%
Simon Bolivar Ave (Gateway) 24.1% 75.9% 3.8% 94.8% 1.5% 96.7% 3.3% 78.3% 17.6% 4.1%
St. Charles Ave (Gateway) 31.7% 68.3% 70.5% 25.2% 4.3% 98.2% 1.8% 85.4% 2.2% 12.4%
Esplanade Ave 47.0% 53.1% 73.0% 21.6% 5.4% 96.2% 3.8% 94.9% 4.5% 0.5%
Tulane Ave 36.8% 63.3% 29.7% 65.7% 4.7% 96.4% 3.6% 94.9% 4.9% 0.2%
S Broad St 34.8% 65.2% 13.4% 79.7% 6.9% 93.3% 6.7% 93.3% 4.9% 1.8%
Loyola Ave 34.0% 66.0% 32.8% 61.0% 6.2% 97.5% 2.5% 94.0% 3.7% 2.3%
Basin St 33.4% 66.6% 42.4% 55.0% 2.7% 93.5% 6.5% 86.9% 5.8% 7.3%
St. Charles Ave (Uptown) 52.8% 47.2% 84.9% 7.9% 7.2% 98.4% 1.6% 68.4% 2.8% 28.8%
Magazine St (Gateway) 34.7% 65.3% 75.8% 18.0% 6.3% 97.9% 2.1% 94.3% 5.7%
Royal St 37.5% 62.5% 85.9% 9.8% 4.3% 97.3% 2.7% 93.9% 6.1%
Magazine St (Uptown) 62.7% 37.3% 88.2% 7.4% 4.4% 95.3% 4.7% 97.0% 3.0%
St. Claude Ave 36.3% 63.7% 13.5% 85.2% 1.2% 81.5% 18.5% 80.9% 13.2% 5.9%
S Carrollton Ave 46.3% 53.7% 68.9% 18.8% 12.3% 96.4% 3.6% 82.2% 2.6% 15.2%
Harrison Ave 37.5% 62.5% 86.0% 6.3% 7.7% 90.9% 9.1% 80.7% 3.9% 15.4%
St. Bernard Ave 25.9% 74.1% 5.7% 94.3% 0.0% 76.1% 23.9% 95.6% 3.6% 0.8%
Camp St (Gateway) 38.7% 61.3% 67.3% 23.6% 9.1% 98.5% 1.5% 99.0% 1.0%
Carondelet St (Gateway) 35.0% 65.0% 50.7% 40.0% 9.3% 93.6% 6.4% 82.9% 17.1%
Gentilly Blvd 46.3% 53.7% 14.9% 83.5% 1.7% 85.1% 14.9% 95.0% 5.0% 0.0%
St. Claude Ave Bridge 27.2% 72.8% 18.5% 80.3% 1.2% 82.7% 17.3% 95.1% 4.9%
Williams Blvd 30.9% 69.1% 27.9% 70.6% 1.5% 85.3% 14.7% 89.7% 4.4% 5.9%
Nashville Ave 56.6% 43.3% 66.0% 20.8% 13.2% 96.2% 3.8% 90.6% 9.4% 0.0%
Airline Dr 44.4% 55.6% 11.1% 86.7% 1.1% 86.7% 13.3% 77.8% 17.8% 4.4%
Papworth Ave 46.9% 53.1% 77.6% 14.3% 8.2% 100.0% 0.0% 93.9% 6.1%
Broad St Bridge 16.1% 83.9% 32.3% 58.1% 9.7% 90.3% 9.7% 83.9% 16.1%
Metairie Hammond Hwy 14.3% 85.7% 100.0% 0.0% 0.0% 71.4% 28.6% 0.0% 100.0%

40 Pedestrian Bicycle Resource Initiative (PBRI)
Regional Planning Commission for Orleans, Jefferson, Plaquemines, St. Bernard, and St. Tammany Parishes
3.7 Impact of Bicycle Facilities on Usership
Previous PBRI pedestrian and bicycle count reports have attempted to provide a preliminary evaluation of the impacts of new facility construction on active transportation in the New Orleans area by looking at relative change in bicyclist and pedestrian Estimated Daily Traffic, as well as the percentage change in helmet use, female cyclists, and right-way travel at locations with or adjacent to bicycle facilities compared to sites with no facilities present or nearby. Relative change for each category from 2010-2013 is displayed in Table 17. Figures in this evaluation differ from those identified in the New Orleans Pedestrian and Bicycle Count Report 2012 due to changes in facility presence (Decatur Street) and the elimination of Paris/Burbank, Metairie Hammond Highway, and Papworth Avenue from the dataset.
In the first column of Table 17, “Bike Facilities Present” includes those count sites among the 12 core sites which have been counted since 2010 that have any type of marked bicycle facility along the actual segment under observation, including bike lanes and shared use lane markings. These sites include Camp Street (Shared use lane), Magazine Street (Gateway, shared use lane), Gentilly Boulevard (bike lane), and St. Claude Avenue (bike lane). The next column, “bike facilities present or adjacent,” includes these four count locations, as well as Simon Bolivar Avenue (connection to Loyola Avenue bike lane), Harrison Avenue (connection to Harrison Avenue bike facilities at City Park), and Decatur Street (connection to shared use lane marking on contiguous blocks of Decatur Street, installed in 2012).
All other count locations are included in the third column, where no bicycle facilities are currently present or adjacent. Sites with bicycle facilities present or adjacent saw their bicycle EDT increase at a much more rapid rate than those with no nearby bicycle facilities
from 2010 to 2013, although the rate of increase was much slower in all categories from 2012-2013. This difference is particularly pronounced for count locations where bicycle facilities are present on the observed segment, with a 104.6% four-year increase, compared to an 87.9% increase for those with facilities present or adjacent, and only 23.3% increase at locations with no facilities present or nearby.
Trends describing the relationship between presence of bicycle facilities and cyclist behavior are difficult to discern from this data, and may require additional years of data collection and inclusion of a greater number of count locations in this analysis to identify strong correlations. However, it is notable that helmet use has increased by 13.9% at locations where facilities exist, exceeding increases over the four-year period for all other count locations. Interestingly, from 2012 to 2013, helmet use increased by the greatest margin (8.1%) at locations with no facilities at all, potentially indicating a more widespread acceptance of helmet use and/or greater mobility of more cautious cyclists, previously reluctant to travel on roadways without marked facilities.

41 New Orleans Pedestrian and Bicycle Count Report 2013
July 2013
Table 17: Change in Site Statistics by Presence of Bicycle Facilities, 2010-2013
Change in Site Statistics by Presence of Bicycle Facilities 2010-2013
Bike Facilities Present
Bike Facilities Present or Adjacent
No Nearby Bicycle Facilities
All Facilities
Percent Change in Bicyclist EDT
2010-2011 35.5% 36.6% 2.9% 19.9%
2011-2012 38.2% 33.9% 17.0% 26.8%
2012-2013 9.3% 2.7% 2.3% 2.6%
2010-2013 104.6% 87.9% 23.3% 55.9%
Percent Change in Helmet Use
2010-2011 6.0% 6.8% 5.0% 5.7%
2011-2012 2.9% 0.6% -2.5% -0.7%
2012-2013 5.0% 3.6% 8.1% 5.4%
2010-2013 13.9% 11.0% 10.6% 10.4%
% Point Change in Percentage of Female Cyclists
2010-2011 -1.7% 0.8% 2.0% 1.3%
2011-2012 0.0% 0.0% 1.3% 0.5%
2012-2013 6.3% 4.7% -1.0% 2.4%
2010-2013 4.6% 5.4% 2.3% 4.2%
% Change in Percentage of Cyclist Right Way Travel
2010-2011 -1.9% -2.7% 0.8% -1.5%
2011-2012 10.7% 9.2% 4.4% 7.1%
2012-2013 3.5% 0.2% 4.0% 1.7%
2010-2013 12.2% 6.7% 9.2% 7.2%
Percent Change in Pedestrian EDT
2010-2011 -9.9% 3.5% -8.5% -0.6%
2011-2012 59.1% 38.4% 29.8% 35.7%
2012-2013 -13.8% 12.2% 12.0% 12.2%
2010-2013 23.6% 60.8% 33.0% 51.3%

42 Pedestrian Bicycle Resource Initiative (PBRI)
Regional Planning Commission for Orleans, Jefferson, Plaquemines, St. Bernard, and St. Tammany Parishes
The data also suggest that presence of facilities or proximity to facilities has a slight positive impact on the percentage of female cyclists, with a 5.4 percentage point increase in the percentage of female cyclists at such sites, compared to a 2.3 percentage point increase at sites with no nearby facilities. This trend was particularly clear from 2012-2013, where sites with facilities saw the greatest increase, followed by sites with facilities present or adjacent, whereas sites with no nearby facilities actually experienced a percentage point decrease in the percentage of females cycling.
Travel orientation trends show similar results, though these are complicated by the fact that travel orientation appears to also be closely related to demographic composition of neighborhoods; wrong-way travel persists in some areas even with the installation of bike lanes. However, overall, right-way travel has increased by the greatest margin at sites with facilities present, whereas proximity to nearby facilities appears to have minimal impact. Continued efforts to encourage correct travel orientation are needed to continue progress toward higher rates of right-way travel, and to avoid safety issues related to improper use of streets and sidewalks.
On the other hand, pedestrian EDT increased substantially over the four-year period at all count sites, without any clearly discernible relationship to presence or absence of bicycle facilities, suggesting that although a “complete streets” approach to roadway design that provides space for cyclists is known to improve the pedestrian environment and safety as well, pedestrian behavior appears to be more closely linked to other factors such as land use, perceived safety, transit access, and pedestrian infrastructure.
Finally, it is increasingly well-documented that construction of bicycle facilities is likely to have an impact on either overall mode share, travel patterns, or both, although this correlation is impacted by numerous other variables and not always easy to isolate
directly.7 Analysis of shifts in census-tract level active transportation commute mode share relative to expansions in the bicycle infrastructure network in New Orleans from 2004-2011 (Figure 13), based on available Census and American Community Survey Data, reflects the complexity of this relationship. In some instances, commute mode share appears to have increased with the provision of new facilities (e.g. Lower Garden District near Magazine and Camp Street shared lane markings, and the Marigny and Bywater neighborhoods).
In other cases, new infrastructure does not yet appear to have impacted mode share significantly (e.g. Gentilly and Lakeview neighborhoods), though this may reflect a lag time between facility construction and changes in residents’ habits. In one case (New Orleans CBD and Warehouse District), active transportation use appears to have actually dropped just as facilities were developed; however this is likely attributable to anomalous data in the years immediately following Hurricane Katrina in 2005-2009, rather than a direct impact of bicycle facility installation. Future years of ACS data should help better clarify the spatial relationships between facility construction and long-term modal shifts.
7 See for example: Douma, F. and Cleveland, F. (2008). The Impact of
Bicycling Facilities on Commute Mode Share (http://www.lrrb.org/PDF/200833.pdf); Krizek, K., Barnes, G., and Thompson, K. (2009). Analyzing the Effect of Bicycle Facilities on Commute Mode Share over Time, Journal of Urban Planning and Development 135:2.
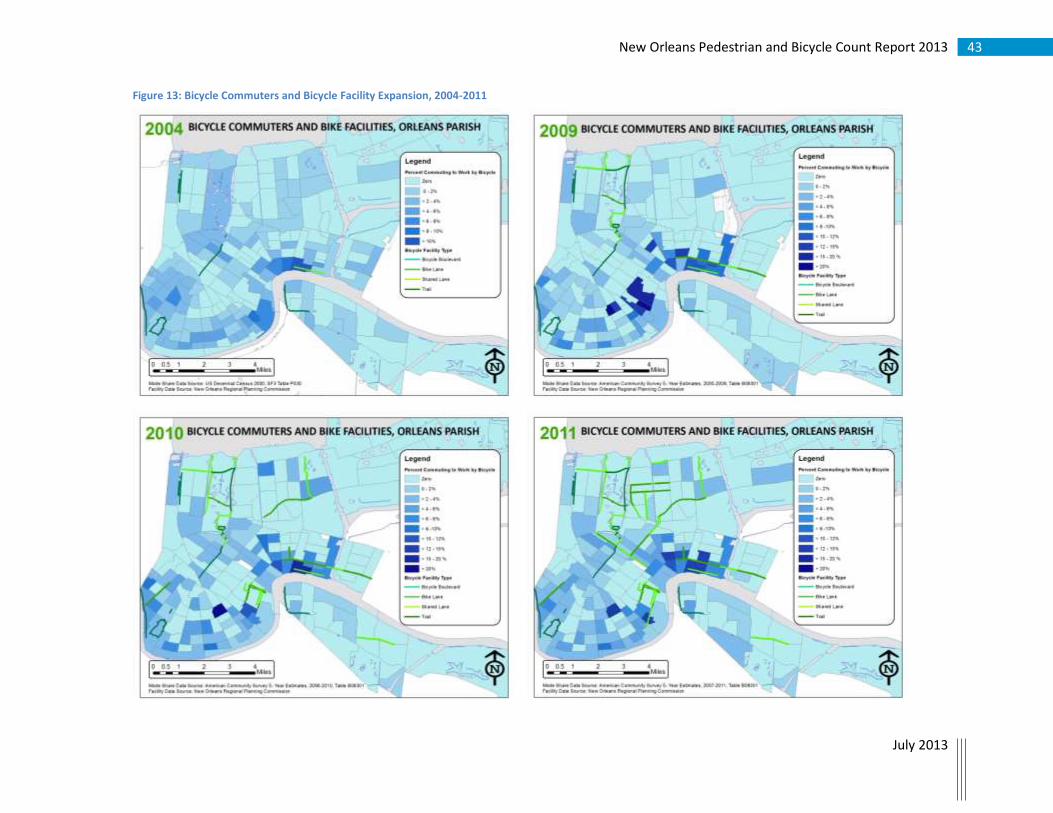
43 New Orleans Pedestrian and Bicycle Count Report 2013
July 2013
Figure 13: Bicycle Commuters and Bicycle Facility Expansion, 2004-2011
44 Pedestrian Bicycle Resource Initiative (PBRI)
Regional Planning Commission for Orleans, Jefferson, Plaquemines, St. Bernard, and St. Tammany Parishes
4.0 Electronic Count Data
This section analyzes count data from the Jefferson Davis Trail Eco-Counter from June 2010 through March 2013. This data was analyzed based on temporal and meteorological variables. For additional detailed data tables, refer to Appendix G.
4.1 Observed Traffic Volumes
Figure 14 and Table 18 show the monthly and annual average daily traffic volumes observed on the Jefferson Davis Trail from June 2010 to March 2013. Due to dislocation and subsequent temporary de-installation of the electronic count device during the months of April and May, 2013, a total usership figure for the third year of the device’s operation is not available. However, by excluding those two months and evaluating usership based on a ten-month period for each year, we see that average daily usage has continued to increase from an average of 491 for June-March of 2012 to 505 in 2013, or 2.8% more users per day. Notably, the two months for which data is excluded are historically the most heavily trafficked of the year due to numerous festivals and events taking place at or near the count location, and it is reasonable to assume that figures comparable to or greater than previous years would have been expected in 2013 if the device were operational. Overall, since installation in 2010, average daily use of the Jefferson Davis Trail (again, using 10-month figures) has increased by 19.7%.
In 2012-2013, user volumes were highest in October, March, and February, consistent with previous years excluding the peak months of April and May. The lowest volumes were recorded in August, July, and December. The Eco-Counter observed more users in every
month of the third year of operation than were recorded the previous year except for August, September, and January, with the largest increases (greater than 18%) in user volume occurring in October, February, and December. These variations in user volume may be attributable to more favorable or unfavorable weather patterns (discussed below) as well as to temporally variable events such as carnival season.
Overall, this trail experienced consistent user volumes year-round, with an average use rate of 505 users per day, a figure which would be higher if data from the months of April and May were available. From the 34 months of data available, trail usage appears to be continuing to increase, although at a slower rate than in the first two years. This Eco-Counter, now reinstalled, should continue to be regularly monitored to see whether volumes continue to increase or new trends emerge.

45 New Orleans Pedestrian and Bicycle Count Report 2013
July 2013
0
100
200
300
400
500
600
700
800
900
Ave
rage
Dai
ly U
sage
Jefferson Davis Trail Average Daily Usage, 2010-2013
2010-2011 2011-2012 2012-2013
Figure 14: Jefferson Davis Trail Average Daily Usage, 2010-2013

46 Pedestrian Bicycle Resource Initiative (PBRI)
Regional Planning Commission for Orleans, Jefferson, Plaquemines, St. Bernard, and St. Tammany Parishes
Table 18: Jefferson Davis Trail Average User Volumes by Month, 2010-2013
Jefferson Davis Trail User Volumes, 2010-2013, by Month
Total Usage Average Daily Usage
Month 2010-2011 2011-2012 2012-2013 Absolute Change,
2010-2013
Percent Change,
2010-2013 2010-2011 2011-2012 2012-2013
Absolute Change,
2010-2013
Percent Change,
2010-2013
June 11,648 11,733 13,740 2,092 18.0% 388 391 458 70 18.0%
July 12,506 13,053 13,273 767 6.1% 403 421 428 25 6.1%
August 10,945 13,471 12,719 1,774 16.2% 353 435 410 57 16.2%
September 13,191 17,719 16,278 3,087 23.4% 440 591 543 103 23.4%
October 15,755 19,752 20,330 4,575 29.0% 508 637 656 148 29.0%
November 10,975 14,117 15,146 4,171 38.0% 366 471 505 139 38.0%
December 11,502 11,715 13,867 2,365 20.6% 371 378 447 76 20.6%
January 12,245 15,806 14,057 1,812 14.8% 395 510 453 58 14.8%
February 12,301 14,080 16,215 3,914 31.8% 439 486 579 140 31.8%
March 17,188 18,256 17,978 790 4.6% 554 589 580 25 4.6%
10-Month Total 128,256 149,702 153,603 25,347 19.8% 422 491 505 83 19.7%
April 18,946 19,449 n/a n/a n/a 632 720 n/a n/a n/a
May 22,128 24,256 n/a n/a n/a 714 783 n/a n/a n/a
Total 169,330 193,407 n/a n/a n/a 464 534 n/a n/a n/a
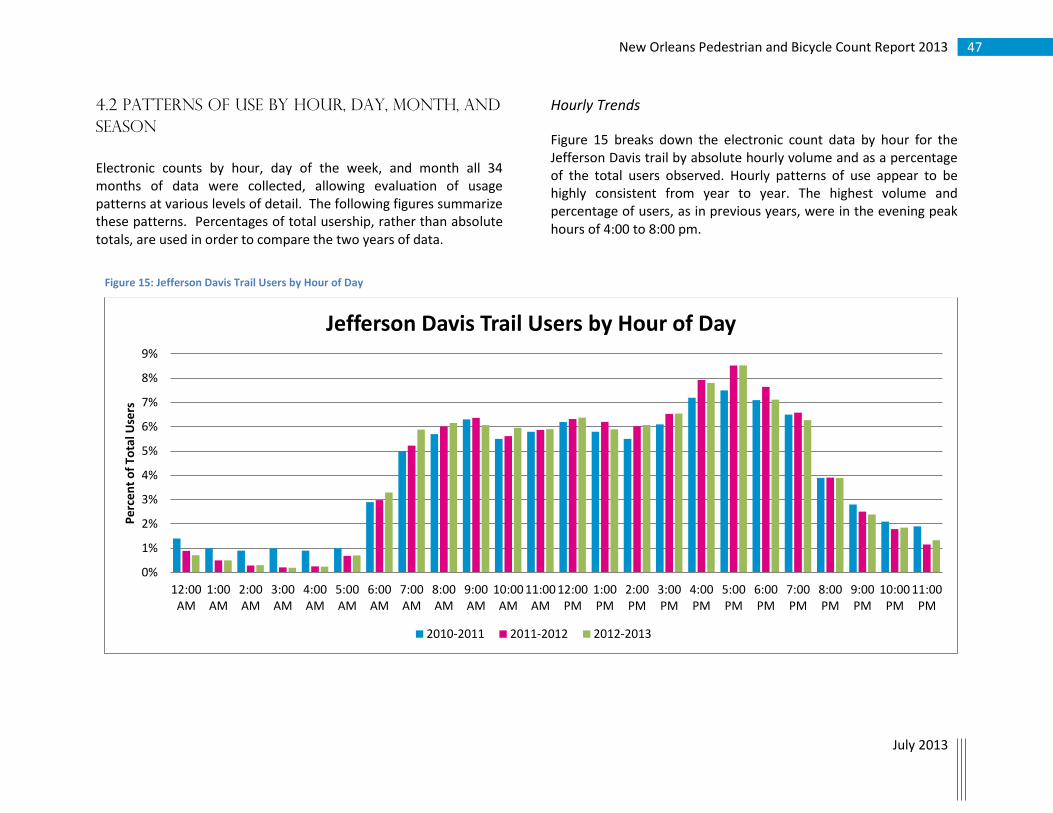
47 New Orleans Pedestrian and Bicycle Count Report 2013
July 2013
4.2 Patterns of Use by Hour, Day, Month, and
Season
Electronic counts by hour, day of the week, and month all 34 months of data were collected, allowing evaluation of usage patterns at various levels of detail. The following figures summarize these patterns. Percentages of total usership, rather than absolute totals, are used in order to compare the two years of data.
Hourly Trends
Figure 15 breaks down the electronic count data by hour for the Jefferson Davis trail by absolute hourly volume and as a percentage of the total users observed. Hourly patterns of use appear to be highly consistent from year to year. The highest volume and percentage of users, as in previous years, were in the evening peak hours of 4:00 to 8:00 pm.
0%
1%
2%
3%
4%
5%
6%
7%
8%
9%
12:00AM
1:00AM
2:00AM
3:00AM
4:00AM
5:00AM
6:00AM
7:00AM
8:00AM
9:00AM
10:00AM
11:00AM
12:00PM
1:00PM
2:00PM
3:00PM
4:00PM
5:00PM
6:00PM
7:00PM
8:00PM
9:00PM
10:00PM
11:00PM
Pe
rce
nt
of
Tota
l Use
rs
Jefferson Davis Trail Users by Hour of Day
2010-2011 2011-2012 2012-2013
Figure 15: Jefferson Davis Trail Users by Hour of Day

48 Pedestrian Bicycle Resource Initiative (PBRI)
Regional Planning Commission for Orleans, Jefferson, Plaquemines, St. Bernard, and St. Tammany Parishes
Weekly Trends
As in previous years, 2013-2013 weekly trends indicate a relatively even distribution of use across each day of the week, with a slightly higher percentage of users on Fridays and Saturdays (Figure 16 and Table 19). Interestingly, Sunday user volumes decreased proportionally in the third year of data collection, potentially due to the exclusion of April and May data, when weekend events and festivals contributed significantly to weekend usership in previous years.
Table 19: Jefferson Davis Trail User Volume by Day of Week
Jefferson Davis Trail Volume by Day of Week
Absolute # % of Total
Average Daily Users
Monday
20,653 13.4% 480
Tuesday
21,826 14.2% 508
Wednesday
21,200 13.8% 493
Thursday
22,639 14.7% 526
Friday
23,493 15.3% 534
Saturday
25,098 16.3% 570
Sunday
18,694 12.2% 425
10 Month Total
153,603 100.0% 505
0%
2%
4%
6%
8%
10%
12%
14%
16%
18%
Jefferson Davis Trail User Volume by Day of Week
2010-2011 2011-2012 2012-2013
Figure 16: Jefferson Davis Trail User Volume by Day of Week

49 New Orleans Pedestrian and Bicycle Count Report 2013
July 2013
Monthly and Seasonal Trends
Tables 20 and 21 and Figure 17 break down Jefferson Davis Trail data by month of the year and by season8 for each year observed. Unsurprisingly, user volumes were highest during the fall for the third year of data (Spring 2013 is excluded due to incomplete data), corresponding with mild average daily temperatures and moderate rainfall (discussed below). Trail usership was greater in the fall and winter of 2012-2013 than in previous years, though slightly lower in summer, 2012 than the previous year.
Table 20: Jefferson Davis Trail User Volumes by Month
8 Spring season calculated based on the first 20 days of June of the
preceding year, plus data from Spring Equinox of the following year through May 31st
Jefferson Davis Trail User Volumes by Month
Total Users % of Annual Volume Average Daily Users Average Daily Temperature
Total Precipitation (in)
June, 2012 13,740 8.9% 458 83 3.2
July, 2012 13,273 8.6% 428 84 11.6
August, 2012 12,719 8.3% 410 83 18.6
September, 2012 16,278 10.6% 543 81 3.0
October, 2012 20,330 13.2% 656 70 0.4
November, 2012 15,146 9.9% 505 61 2.5
December, 2012 13,867 9.0% 447 59 5.1
January, 2013 14,057 9.2% 453 57 6.4
February, 2013 16,215 10.6% 579 58 7.2
March, 2013 17,978 11.7% 580 59 1.1
10 Month Total 153,603 100.0% 505 69 59.1

50 Pedestrian Bicycle Resource Initiative (PBRI)
Regional Planning Commission for Orleans, Jefferson, Plaquemines, St. Bernard, and St. Tammany Parishes
Table 21: Jefferson Davis Trail User Volume by Season, 2010-2013
Jefferson Davis Trail User Volumes by Season
Absolute # Average Daily Users Average Daily Temp Total Precip. (in)
Summer 2010 35,099 382 85 24.0
Summer 2011 43,776 466 84 31.0
Summer 2012 42,875 456 83 32.0
Fall 2010 39,921 439 65 3.8
Fall 2011 46,550 517 66 4.3
Fall 2012 49,880 554 66 7.8
Winter 2010-2011 36,048 401 56 14.4
Winter 2011-2012 44,224 497 63 8.3
Winter 2012-2013 45,245 508 57 15.8
Spring 2011 58,262 633 77 9.1
Spring 2012 58,857 654 78 17.8
Spring 2013 n/a n/a 72 23.4
0
20,000
40,000
60,000
80,000
Winter Spring Summer Fall
Jefferson Davis Trail User Volume by Season
2010-2011 2011-2012 2012-2013
Figure 17: Jefferson Davis Trail User Volume by Season

51 New Orleans Pedestrian and Bicycle Count Report 2013
July 2013
4.3 Meteorological Variables and Traffic
Volume
As previously identified in the New Orleans Pedestrian and Bicycle Count Report, 2010-2011, significant correlations appear to exist between temperature, precipitation, and active transportation activity. This section continues to track these relationships between electronic counts at the Jefferson Davis Trail and average daily temperatures and precipitation at the daily, weekly, and monthly scale. Temperature and precipitation data were obtained from The Weather Underground historical database.
Temperature
Table 22 and Figures 18, 19, and 20 illustrate the relationship between average temperatures and user volumes at the daily, weekly, and monthly level. Average daily temperatures are used for this analysis. Daily volumes (Figure 18) follow a similar overall pattern, though there are several outliers corresponding to special event days which vary by year, and are missing from spring 2013. At this level, it is difficult to discern a clear relationship between temperature and usership; trail usage is relatively consistent from a range of 40 degrees Fahrenheit to 90 degrees, with a number of higher usage days occurring when weather is between 70 and 80 degrees.
0
500
1000
1500
2000
2500
3000
3500
30 40 50 60 70 80 90 100
Dai
ly U
sers
Temperature (degrees Farenheit)
Temperature and Usership (Daily)
2010-2011
2011-2012
2012-2013
Figure 18: Temperature and Usership (Daily)

52 Pedestrian Bicycle Resource Initiative (PBRI)
Regional Planning Commission for Orleans, Jefferson, Plaquemines, St. Bernard, and St. Tammany Parishes
Weekly analysis (Figure 19) further illuminates that as in previous
years, the highest weekly volumes tend to occur in weeks where the
average temperature ranges from approximately 60 to 80 degrees.
Weeks with higher or lower average temperatures are more likely
to have lower volumes. Therefore, this range of temperatures can
be said to represent a threshold at which user volumes peak and
then decline in either direction (higher or lower temperatures).
At the monthly level (Figure 20, Table 22) these patterns remain
consistent. Early spring temperatures in 2013 (February and March)
were cooler than recent years, though use remained high. Similarly,
mild weather in winter months of 2012-2013 appears to have
resulted in higher average user volumes than in previous years.
Overall, the relationship between temperature and usership of the
Jefferson Davis Trail appears to be relatively stable. For additional
detailed data tables not presented here, see Appendix G.
0
200
400
600
800
1000
1200
1400
1600
0 10 20 30 40 50 60 70 80 90 100
Ave
rage
Dai
ly U
sers
Average Daily Temperature (Degrees Farenheit)
Temperature and Usership (Weekly)
2010-2011
2011-2012
2012-2013
Figure 19: Temperature and Usership (Weekly)

53 New Orleans Pedestrian and Bicycle Count Report 2013
July 2013
Table 22: Jefferson Davis Trail Average Daily Temperature and User Volumes
Jefferson Davis Trail Average Daily Temperature and User Volumes 2010-2011 2011-2012 2012-2013
Month Average Daily
Users Average Daily Temperature
Average Daily Users
Average Daily Temperature
Average Daily Users
Average Daily Temperature
June 388 84 391 85 458 83
July 403 85 421 84 428 84
Autust 353 85 435 88 410 83
September 440 82 591 79 543 81
October 508 72 637 70 656 70
November 366 63 471 64 505 61
December 371 52 378 58 447 59
January 395 51 510 61 453 57
February 439 57 486 61 579 58
March 554 67 589 71 580 59
April 632 74 720 73 n/a 68
May 714 78 782 80 n/a 74
0
200
400
600
800
1000
0 10 20 30 40 50 60 70 80 90 100
Ave
rage
Dai
ly U
sers
Average Daily Temperature (Degrees Farenheit)
Temperature and Usership (Monthly)
2010-2011
2011-2012
2012-2013
Figure 20: Temperature and Usership (Monthly)

54 Pedestrian Bicycle Resource Initiative (PBRI)
Regional Planning Commission for Orleans, Jefferson, Plaquemines, St. Bernard, and St. Tammany Parishes
Precipitation
Precipitation can also be used as a variable by which to evaluate active transportation facility use. Precipitation in the New Orleans area tends to be highest during the summer months and early autumn, months which also experienced some the lowest user volumes on the Jefferson Davis Trail in 2012-2013 (Figure 21). However, at the monthly level of analysis, clear correlations between precipitation and user volumes do not emerge.
The relationship between precipitation and user volumes is clearer at the daily level, as daily variation in precipitation is high. Figure 22 shows that the days with the highest amount of precipitation tend to fall nearer to the bottom or middle of the range, with the day experiencing the greatest precipitation (during Hurricane Isaac) resulting in zero trail use at all. Similarly, almost all of the days in this ten-month period with very high average daily usership correspond to days with little or no rain.
0
100
200
300
400
500
600
700
800
900
0
2
4
6
8
10
12
14
16
18
20
June July August September October November December January February March April May
Ave
rage
Dai
ly U
sers
Pre
cip
itat
ion
(in
.)
Precipitation and Average Daily Users by Month
Precipitation, 2011-2012 Precipitation, 2012-2013 Average Daily Users, 2011-2012 Average Daily Users, 2012-2013
Figure 21: Precipitation and Average Daily Users by Month

55 New Orleans Pedestrian and Bicycle Count Report 2013
July 2013
0
500
1000
1500
2000
2500
3000
0.00 1.00 2.00 3.00 4.00 5.00 6.00 7.00 8.00 9.00
Precipitation and Usership (Daily), 2012-2013
Figure 22: Precipitation and Usership (Daily), 2012-2013

56 Pedestrian Bicycle Resource Initiative (PBRI)
Regional Planning Commission for Orleans, Jefferson, Plaquemines, St. Bernard, and St. Tammany Parishes
5.0 State, Regional, and National
Context: Comparing the Gender Split
for Bicyclist and Pedestrian
Commuters
This section provides an update to evaluations of commute data from the U.S. Census and American Community Survey (ACS) found in previous PBRI Pedestrian and Bicycle Count Reports, evaluating New Orleans progress as an active transportation leader relative to its context in the state of Louisiana, the Southern region of the United States, and the nation overall. This report updates this information with 2011 ACS data.
5.1 Bicycle Commuting in New Orleans
As noted above, rates of female bicyclists are often examined as an indicator of the overall safety, comfort, and popularity of bicycling for a given area. This section compares New Orleans’ percentages of total and female bicycle commuters respectively to national leaders in active transportation, the South Region (as defined by the U.S. Census), and other cities in Louisiana.
Comparing Female Bicyclists with National Leaders in Active Transportation
New Orleans has regained its 2009 position within the top ten cities in the country with a population over 250,000 in terms of the overall percentage of bicycle commuters, in 9th place with 2.39% (Table 23). Among bicycle commuters in 2011, 45.6% were female, a greater percentage than all but one other top bicycle commuting city. Notably, this is a sharp increase from the 26% of bike
commuters that were identified as female in the 2010 ACS, reflecting relatively high variability and margins of error in one-year sample data on commute mode. This percentage is also considerably higher than the 27.9% of cyclists identified as female in PBRI’s own observations in 2011. However, in four of the last six years, New Orleans has been in the top ten cities for bicycle commuting, even as other cities have also invested in new bicycle infrastructure and strongly promoted active transportation options.
Comparing Female Bicyclists at the Regional Level
Regional figures, as illustrated in Table 24, show that New Orleans had the second highest overall mode share for bicyclists in South Region cities over 250,000, after slipping from first to third in 2010. New Orleans also had the highest rate of female bicyclists among top bicycling cities (over 250,000) in the region, up from 5th place in the previous two years. As in 2010, however, the South Region had both the lowest bicycle mode share and rate of female bicyclists in 2011 compared to other regions in the country.

57 New Orleans Pedestrian and Bicycle Count Report 2013
July 2013
Table 23: Top Cities Over 250,000 for Bicycle Commuting, 2011
Table 24: Regional Bicycling Commuting Statistics, 2011
Regional Bicycling Commuting Statistics, 2011
Geography Bicycle Mode
Share
Percent of bike commuters who are
female
West Region 1.16% 27.95%
Midwest Region 0.47% 26.86%
Northeast Region 0.47% 26.36%
South Region 0.35% 23.69%
Washington, DC 3.31% 38.83%
New Orleans, LA 2.39% 45.63%
PBRI Findings, 2011 n/a 27.90%
Austin, TX 2.01% 26.94%
Lexington-Fayette, KY 1.93% 26.76%
Atlanta, GA 1.58% 19.56%
Miami, FL 0.91% 41.21%
Baltimore, MD 0.83% 30.89%
Raleigh, NC 0.45% 22.37%
Virginia Beach, VA 0.45% 23.37%
Tulsa, OK 0.44% 7.71%
United States 0.59% 26.93%
Notes
Selected cities in the South Region represent the 10 highest bicycle commuting rates for cities over 250,000
Total commuting population excludes those that work at home
Source U.S. Census Bureau, 2011 American Community Survey, Table B08006
Top Cities over 250,000 for Bicycle Commuting, 2011
Overall Rank City
Bicycle Mode Share
Percent of bike commuters who
are female
1 Portland, OR 6.83% 36.97%
2 San Francisco, CA 3.73% 29.09%
3 Seattle, WA 3.68% 30.31%
4 Minneapolis, MN 3.57% 32.74%
5 Washington, DC 3.31% 38.83%
6 Oakland, CA 3.29% 36.21%
7 Tucson, AZ 2.86% 27.08%
8 Denver, CO 2.58% 29.68%
9 New Orleans, LA 2.39% 45.63%
PBRI Findings, 2011 n/a 27.90%
10 Sacramento, CA 2.30% 39.44%
11 Austin, TX 2.01% 26.94%
12 Lexington, KY 1.93% 26.76%
13 Philadelphia, PA 1.83% 45.92%
14 Boston, MA 1.81% 23.43%
15 Tampa, FL 1.60% 1.64%
Note Total commuting population excludes those that work at
home
Source U.S. Census Bureau, 2011 American Community Survey, Table B08006
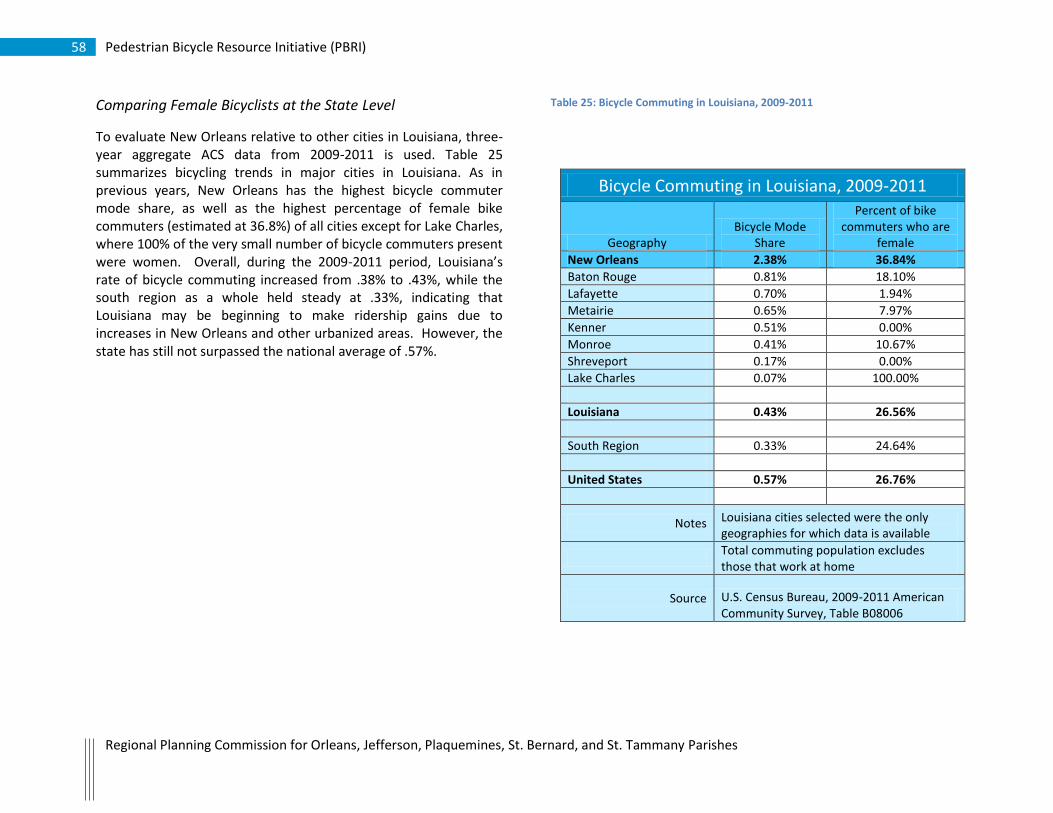
58 Pedestrian Bicycle Resource Initiative (PBRI)
Regional Planning Commission for Orleans, Jefferson, Plaquemines, St. Bernard, and St. Tammany Parishes
Comparing Female Bicyclists at the State Level
To evaluate New Orleans relative to other cities in Louisiana, three-year aggregate ACS data from 2009-2011 is used. Table 25 summarizes bicycling trends in major cities in Louisiana. As in previous years, New Orleans has the highest bicycle commuter mode share, as well as the highest percentage of female bike commuters (estimated at 36.8%) of all cities except for Lake Charles, where 100% of the very small number of bicycle commuters present were women. Overall, during the 2009-2011 period, Louisiana’s rate of bicycle commuting increased from .38% to .43%, while the south region as a whole held steady at .33%, indicating that Louisiana may be beginning to make ridership gains due to increases in New Orleans and other urbanized areas. However, the state has still not surpassed the national average of .57%.
Table 25: Bicycle Commuting in Louisiana, 2009-2011
Bicycle Commuting in Louisiana, 2009-2011
Geography Bicycle Mode
Share
Percent of bike commuters who are
female
New Orleans 2.38% 36.84%
Baton Rouge 0.81% 18.10%
Lafayette 0.70% 1.94%
Metairie 0.65% 7.97%
Kenner 0.51% 0.00%
Monroe 0.41% 10.67%
Shreveport 0.17% 0.00%
Lake Charles 0.07% 100.00%
Louisiana 0.43% 26.56%
South Region 0.33% 24.64%
United States 0.57% 26.76%
Notes Louisiana cities selected were the only geographies for which data is available
Total commuting population excludes those that work at home
Source U.S. Census Bureau, 2009-2011 American Community Survey, Table B08006
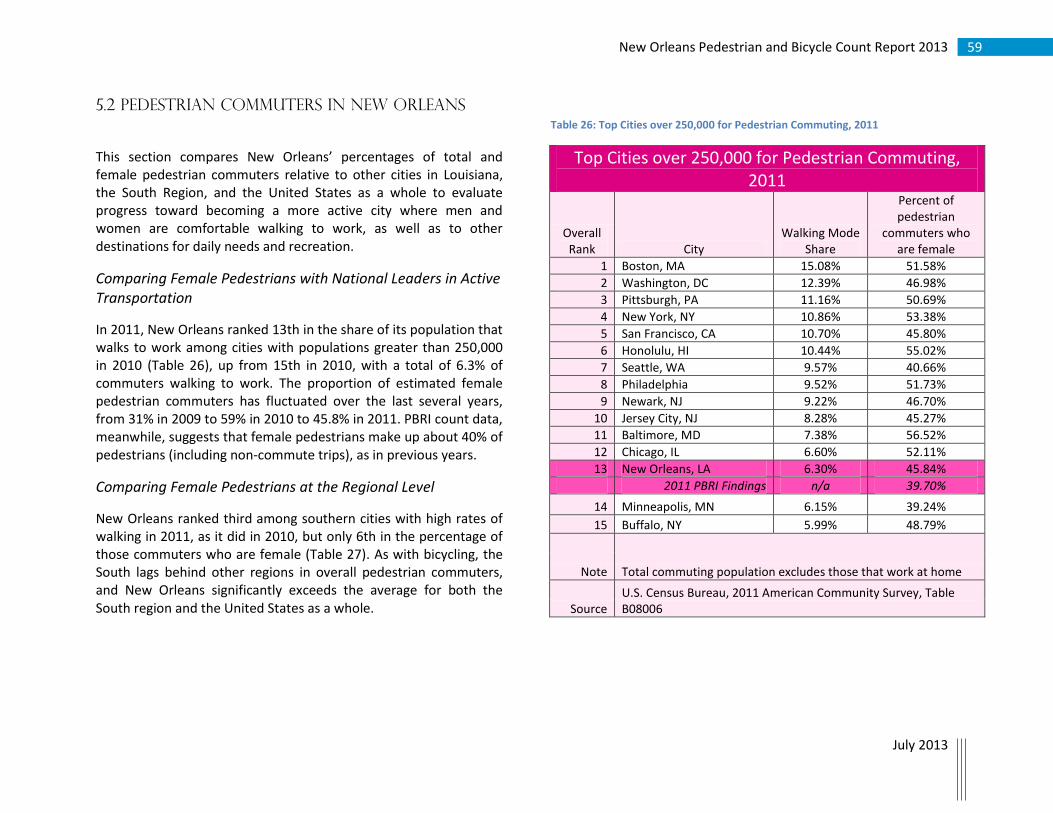
59 New Orleans Pedestrian and Bicycle Count Report 2013
July 2013
5.2 Pedestrian Commuters in New Orleans
This section compares New Orleans’ percentages of total and female pedestrian commuters relative to other cities in Louisiana, the South Region, and the United States as a whole to evaluate progress toward becoming a more active city where men and women are comfortable walking to work, as well as to other destinations for daily needs and recreation.
Comparing Female Pedestrians with National Leaders in Active Transportation
In 2011, New Orleans ranked 13th in the share of its population that walks to work among cities with populations greater than 250,000 in 2010 (Table 26), up from 15th in 2010, with a total of 6.3% of commuters walking to work. The proportion of estimated female pedestrian commuters has fluctuated over the last several years, from 31% in 2009 to 59% in 2010 to 45.8% in 2011. PBRI count data, meanwhile, suggests that female pedestrians make up about 40% of pedestrians (including non-commute trips), as in previous years.
Comparing Female Pedestrians at the Regional Level
New Orleans ranked third among southern cities with high rates of walking in 2011, as it did in 2010, but only 6th in the percentage of those commuters who are female (Table 27). As with bicycling, the South lags behind other regions in overall pedestrian commuters, and New Orleans significantly exceeds the average for both the South region and the United States as a whole.
Table 26: Top Cities over 250,000 for Pedestrian Commuting, 2011
Top Cities over 250,000 for Pedestrian Commuting, 2011
Overall Rank City
Walking Mode Share
Percent of pedestrian
commuters who are female
1 Boston, MA 15.08% 51.58%
2 Washington, DC 12.39% 46.98%
3 Pittsburgh, PA 11.16% 50.69%
4 New York, NY 10.86% 53.38%
5 San Francisco, CA 10.70% 45.80%
6 Honolulu, HI 10.44% 55.02%
7 Seattle, WA 9.57% 40.66%
8 Philadelphia 9.52% 51.73%
9 Newark, NJ 9.22% 46.70%
10 Jersey City, NJ 8.28% 45.27%
11 Baltimore, MD 7.38% 56.52%
12 Chicago, IL 6.60% 52.11%
13 New Orleans, LA 6.30% 45.84%
2011 PBRI Findings n/a 39.70%
14 Minneapolis, MN 6.15% 39.24%
15 Buffalo, NY 5.99% 48.79%
Note Total commuting population excludes those that work at home
Source U.S. Census Bureau, 2011 American Community Survey, Table B08006

60 Pedestrian Bicycle Resource Initiative (PBRI)
Regional Planning Commission for Orleans, Jefferson, Plaquemines, St. Bernard, and St. Tammany Parishes
Table 27: Regional Pedestrian Commuting Statistics, 2011
Comparing Female Pedestrians at the State Level
As with bicycling data, state-level comparisons were conducted using 2009-2011 3-Year ACS estimates. Table 28 summarizes the resulting pedestrian commuting patterns in Louisiana. New Orleans had the highest mode share for pedestrian commuting in the state, as in previous years, and a slightly above average rate of female pedestrians relative to other cities and the state as a whole. Louisiana’s overall rate of pedestrian commuters and female pedestrians, at 2.04% and 44.65% respectively, is slightly higher than the southern regional average, but again lags behind national averages.
Table 28: Pedestrian Commuting in Louisiana, 2009-2011
Pedestrian Commuting in Louisiana, 2009-2011 Geography Walking Mode Share % of pedestrians who are female
New Orleans 5.78% 46.81%
Baton Rouge 4.00% 52.71%
Lake Charles 3.04% 65.11%
Shreveport 2.15% 30.68%
Metairie 2.05% 27.21%
Lafayette 1.71% 36.73%
Kenner 1.67% 40.00%
Monroe 1.02% 46.03%
Louisiana 2.04% 44.65%
South Region 1.93% 42.94%
United States 2.94% 46.31%
Notes Louisiana cities selected were the only geographies for which data is available
Total commuting population excludes those that work at home
Source U.S. Census Bureau, 2009-2011 American Community Survey, Table B08006
Regional Pedestrian Commuting Statistics, 2011
Geography Walking Mode
Share
Percent of pedestrian
commuters who are female
West Region 3.12% 46.14%
Northeast Region 4.90% 49.83%
Midwest Region 2.77% 45.17%
South Region 1.93% 43.53%
Washington, DC 12.39% 46.98%
Baltimore 7.38% 56.52%
New Orleans 6.30% 45.84%
PBRI Findings, 2011 n/a 39.70%
Atlanta 5.02% 34.42%
Miami 4.44% 50.80%
Lexington, KY 3.56% 56.18%
Virginia Beach, VA 3.12% 30.08%
Austin 2.98% 46.45%
Corpus Christi, TX 2.93% 63.21%
Louisville, KY 2.49% 44.88%
United States 2.94% 46.45%
Notes
Selected cities in the South Region represent the 10 highest commuting rates for cities over 250,000
Total commuting population excludes those that work at home
Source U.S. Census Bureau, 2011 American Community Survey, Table B08006

61 New Orleans Pedestrian and Bicycle Count Report 2013
July 2013
6.0 Conclusions
This section synthesizes the trends and data presented in this report and evaluates possible directions for future study, in order to promote New Orleans as a regional and national leader in active transportation.
6.1 Bicycle Activity in New Orleans
The total number of observed bicyclists at the 12 2010-2013 count sites increased by 6.3% from 2012 to 2013, a much slower rate of increase than was observed in the previous two years of the study. However, over the four year study period to-date, bicycle use at these 12 sites has increased by a total of 63%. When the data is extrapolated into Estimated Daily Traffic (EDT) figures to adjust for temporal variations, an overall 56% increase in bicycle activity at these sites is reported. As discussed in the New Orleans Pedestrian and Bicycle Count Report, 2010-2011, New Orleans’ EDT figures at many manual count sites city wide have been found to be relatively low compared to national leaders in active transportation, despite a high reported rate of commuting to work by bicycle as documented by the American Community Survey. This continued upward trend in cyclists observed indicates that bicycling is becoming more popular for both work and non-work trips.
High bicycle volumes continue to be observed at sites located near the Central Business District, though rates of increase have varied substantially by site from year to year, with the strongest increases observed at Camp Street and Magazine Street over a four-year period. 2011 ACS data corroborates this finding, with increased
bicycle commuters reported in the census tracts immediately adjacent to these count locations.
At the 12 new count locations, baseline data was established for comparison to 1) future post-facility construction studies; 2) existing datasets collected by other organizations documenting pre- and post-facility construction change; and 3)crash data and built environment audit data (as documented in the New Orleans Multi-Tool Pedestrian Safety Study (PBRI 2013) in order to better understand active transportation patterns and potential concerns in locations identified as crash hot spots or hazardous connections in the active transportation network. Preliminary analysis of this data indicates that active transportation use where new facilities have been constructed is very strong, while there is significant opportunity for growth—particularly in cycling—on count locations slated for future improvements. Moreover, considerable demand exists for biking and/or walking on facilities identified as potentially hazardous (Tulane Avenue at Broad Street, Loyola Avenue and Simon Bolivar Avenue at Calliope Street, Williams Boulevard at Airline Drive, and the Broad Street and St. Claude Avenue bridges). Improvements to each of these should be considered in order to improve safety outcomes for existing users as well as to encourage greater active transportation use. Follow up counts at each of these locations should be conducted in order to capture impacts of any improvements, and/or to track increasing or decreasing user demand.
Efforts to approximate mode share calculations at sites for which data is available reveal that if EDT projections are accurate, up to 28% of traffic (excluding transit users) is comprised of bicyclists and pedestrians at the Camp Street count location, while active transportation mode shares above 10% exist at three additional locations.

62 Pedestrian Bicycle Resource Initiative (PBRI)
Regional Planning Commission for Orleans, Jefferson, Plaquemines, St. Bernard, and St. Tammany Parishes
Indicators of safe cycling behavior appear to be on the rise, with a substantial increase in helmet use (21% of existing count sites, 23% of all count sites observed) though this figure still doesn’t approach the high rates of helmet use of national leaders in cycling such as Portland (77% helmet use) and Minneapolis (64% helmet use).9 In addition, right-way, on-street travel has continued to incrementally increase each, for a four-year improvement from 75.5% in 2010 to 82.1% in 2013. This indicates that regional educational campaigns emphasizing correct travel orientation and safe cyclist behavior may be having an impact. However, apparent correlations between race and cyclist behavior indicate that continued education, particularly targeting groups observed to ride illegally and/or without a helmet, may be helpful in advancing these positive trends among all demographic groups.
In addition, the percentage of bicyclists that are female, as well as the total number of female cyclists, has increased to just over 31% in 2013 among existing count locations (29% including all 2013 count sites). While encouraging, increases in the proportion of women cycling have been slow and New Orleans continues to lag behind many national bicycling leaders. Notably, however, ACS commute data indicates a higher proportion of those that commute to work by bicycle are women at 46%.
Finally, 2013 data continues to demonstrate that presence of bicycle facilities has an impact on the number of cyclists likely on a given facility. Overall, bicyclist EDT has increased by 105% at locations where facilities exist, compared to just 23% at locations with no facilities present or nearby. Not only are there more cyclists at sites where improvements have been made, but they are safer cyclists as well: helmet use has increased more rapidly at sites with
9 Bike Walk Twin Cities. 2010. Pedestrian and Biccyle Count Report: Bike
Walk Twin Cities 2009; Portland Bureau of Transportation. 2010. Portland Bicycle Count Report 2010.
bicycle facilities, the proportion of female cyclists has increased more substantially, and the change in the percentage of cyclists who travel on-street and in the direction of traffic has increased by a greater margin.
6.2 Pedestrian Activity in New Orleans
Total observed volumes of pedestrians, as well as Estimated Daily Traffic (EDT), at manual count sites observed from 2010-2013 has also increased steadily from year to year, with a 15% increase from 2012 to 2013 and a four-year total increase in pedestrians observed of 67%, or an adjusted increase in EDT of 51% over the same period. New pedestrian count data for 12 additional locations was collected, demonstrating significant pedestrian activity at several locations identified as crash hot spots, indicating a need for infrastructure improvements to reduce pedestrian/vehicle conflict.
In addition, this data supports the need for pedestrian improvements as well as planned bicycle improvements at certain locations, as there are more pedestrians currently using these segments than bicycles. Required ADA retrofits accompanying planned roadway projects at these locations will benefit these users, but additional improvements to signalized and un-signalized intersections as well as sidewalk repairs are recommended in order to maximize the impact of these investments for all users.
The percentage of female pedestrians observed in 2013 increased substantially among existing count sites to 58%, though it remains around 40% for all count locations observed, closer to the 46% of pedestrian commuters that are female reported by the 2007-2011 ACS. New Orleans continues to be a national leader for walking to work, and the percentage of such commuters that are women. Travel orientation remains stable at above 90% traveling on

63 New Orleans Pedestrian and Bicycle Count Report 2013
July 2013
sidewalks, with the remaining pedestrians mostly concentrated at a couple of count locations.
Pedestrian activity does not appear to correlate to bicycle facility construction, although some pedestrian infrastructure improvements (such as ADA-compliant curb ramps) often accompany such projects. Future studies should more closely evaluate the drivers of pedestrian activity, including land use relationships, variations in pedestrian infrastructure, and pedestrian-specific amenities and disamenities (e.g. lighting, vacancy, and shade) in order to better understand pedestrian travel behavior and facilitate continued increases in active transportation via walking.
6.3 Jefferson Davis Trail
The electronic counter located on the Jefferson Davis Trail at Conti St includes data for both bicycles and pedestrians, combined. On average, the counter recorded 505 users per day—a 2.8% increase from the previous year of data collected during the same 10-month period. This reflects a decrease from the 2011-2012 annual daily average due to a loss of data during the two months of historically peak activity, April and May. Over the three years of the device’s operation, clear and stable temporal trends have been identified. Average Daily Traffic (ADT) is variable by season with the highest ADT volumes occurring during the spring season and the lowest occurring during the summer. Usership spikes sharply during festivals and sporting events in the Mid-City area and tends to be higher on weekends, but very seldom declines below about 300 users per day. Hourly patterns of use reveal relatively consistent use throughout daylight hours, with a peak in activity in the late afternoon and early evening. Predictable relationships exist
between weather and usership, with the highest usership occurring on mild days with little or no rainfall. Importantly though, except in very extreme circumstances, inclement weather does not completely inhibit use. Regular trail users appear to exist year-round, regardless of temperature or precipitation.
Though this data stream has not revealed any notable changes in user patterns over the last three years (other than a steady increase in overall use), it is a valuable resource for long-term, continuous data collection and is the only such device currently installed in the New Orleans area collecting data on active transportation activity. Installation of additional count devices in the future would significantly enhance our understanding of differences in biking and walking patterns across different locations, as well as provide greater insight into overall trends in active transportation use regionwide.
6.4 Evaluating Active Transportation in
New Orleans: Policy Implications and Next
Steps
After four years of study, some clear trends are beginning to emerge about the state of active transportation in the New Orleans area and the impacts of the City and region’s efforts to build and enhance infrastructure and improve safety outcomes through education. An aggressive program of bicycle network expansion has been rewarded with increased bicycling and safer cyclist behavior, particularly in areas where such improvements have occurred.
These increases have not necessarily happened evenly, or immediately: where new facilities are constructed use may increase immediately reflecting latent demand among more hesitant users,

64 Pedestrian Bicycle Resource Initiative (PBRI)
Regional Planning Commission for Orleans, Jefferson, Plaquemines, St. Bernard, and St. Tammany Parishes
or it may take a few years for impacts to be fully realized as residents and commuters adjust their transportation habits in response to new options. In addition, it is important to note than disconnected segments of bicycle facilities are likely not sufficient to encourage additional cyclists; impacts on usership also depend on the development of a contiguous network of linked facilities, creating safer, more comfortable access to various neighborhoods and destinations.
National data indicate that New Orleans leads the state, as well as the South region, in active transportation, and is an emerging leader nationally, ranked high for biking and walking mode share. As more and more connections between existing facilities for cyclists are developed, New Orleans has the opportunity to maintain and improve its reputation as a bikeable city.
Decision-making processes regarding the prioritization and placement of future bike facilities, as well as improvements to the pedestrian environment, should take quantitative data sources (including this report) into account. Additionally, effective fulfillment of the Complete Streets policy approaches now codified at the state, regional, and local level in New Orleans depends on access to multimodal user data in order to ensure that investment impacts are maximized, and the needs of all potential user groups. Continuing to enhance opportunities for active transportation will promote a healthier, more equitable, and more sustainable city and region. Initial efforts in the last five years have already begun to yield substantial results. Future research efforts should continue to evaluate the results of ongoing infrastructure and educational investments that promote active transportation, and should advance efforts to prioritize key bicycling, walking, and multi-modal connections throughout the region.

65 New Orleans Pedestrian and Bicycle Count Report 2013
July 2013
Appendices
A. Manual Count Site Characteristics
B. Manual Count Observation Protocol
C. Manual Count Observation Sheets
D. Manual Count Weather Data
E. PBRI Extrapolation Methodology
F. NBPD Project Count Adjustment Worksheet
G. Additional Automatic Count Data Tables

66 Pedestrian Bicycle Resource Initiative (PBRI)
Regional Planning Commission for Orleans, Jefferson, Plaquemines, St. Bernard, and St. Tammany Parishes
Appendix A: Manual Count Site Characteristics 2013 Manual Count Site Characteristics
Site Neighborhood Facility Type On-Street
Parking Bicycle Infrastructure Improvements Year
Installed CBD
Gateway
Decatur St French Quarter 1-lane, One-Way One Side Connecting segment with sharrows 2013
Royal St Marigny 1-lane, One-Way Both Sides
St. Claude Ave Bywater 4-Lane, Divided Both Sides Bike Lanes 2008
Simon Bolivar Ave Central City 4-Lane, Divided Both Sides
Connecting segment with sharrows and bike lanes
2010 X
Carondelet St Central City 2-Lane, One Way Both Sides* X
St. Charles Ave Central City 4-Lane, Divided Both Sides X
Camp St Lower Garden District 2-Lane, One Way One Side Connecting segment with sharrows 2010 X
Magazine St Lower Garden District 2-Lane, One Way Both Sides Connecting segment with sharrows 2010 X
Magazine St (Uptown) Uptown 2-Lane None
Esplanade Ave Mid-City 2-Lane, Divided Both Sides Bike Lanes 2013
Gentilly Blvd Gentilly 4-Lane, Divided None Buffered Bike Lanes 2010
Harrison Ave Lakeview 4-Lane, Divided Both Sides Connecting segment with bike lanes 2009
Metairie Hammond Hwy Bucktown 2-Lane None
Papworth Ave Metairie 2-Lane None
Williams Blvd Kenner 4-Lane, Divided None
Airline Dr Kenner 4-Lane, Divided None
Loyola Ave CBD 6-Lane, Divided One Side
Bike Lanes (upgraded from sharrows installed in 2010)
2012 X
Tulane Ave Tulane/Gravier 6-Lane, Divided Both Sides
S Broad St Tulane Gravier 6-Lane, Divided Both Sides
St. Charles Ave (Uptown) Uptown 2-Lane, Divided Both Sides Bike Lanes 2013
St. Bernard Ave Seventh Ward 4-Lane, Divided Both Sides
Basin St Treme/Lafitte 6-Lane, Divided Both Sides
Nashville Ave Fountainbleu 4-Lane, Divided Both Sides
S Carrollton Ave East Carrollton/Audubon 2-Lane, Divided Both Sides Bike Lanes 2010
Broad St Bridge Tulane/Gravier 4-Lane, Divided Bridge None
St. Claude Bridge Bywater/Holy Cross 4-Lane, Divided Bridge None
Sharrows; Connecting segment with bike lanes
2008
Notes:
Orleans Parish neighborhood classification derived from New Orleans City Planning Commission.
*One side of the block observed on Carondelet has an off-street parking strip immediately perpendicular to the road.

67 New Orleans Pedestrian and Bicycle Count Report 2013
July 2013
Appendix B: Manual Count Observation Protocol
Bike Ped Observation Protocol
Rationale
In 2009-2011, the city of New Orleans Department of Public Works and the State of Louisiana Department of Transportation installed approximately fifty miles of bicycle lanes in New Orleans. These bike lanes run through several neighborhoods in New Orleans. We would like to examine the effect of bike lanes on ridership and pedestrian behavior in New Orleans.
Summary
This data collection method was created by Kathryn Parker, MPH. The data collection sheet is based upon examples of other pedestrian and bicycle data collection methods from the United States Department of Transportation.10 The method is based upon two individuals counting
Training and Certification
All observers will read this protocol with the trainer and then practice near the corner of N. Rampart and Canal Streets. Observers will be certified with 80% agreement with the trainer after 30 minutes of observation.
Codes and Recoding
Intersection: Usually, this will be Broad and Lafitte; etc.
Temperature: Observers will leave this section blank. The temperature will be filled out by the project manager using the average hour weather data from www.wunderground.com
Rain: Observers will record if there are any rain showers.
Observer Name: Observers will record their first and last name
Hour: example: 7:00-8:00am will read: 7:00am. Only one hour should be indicated per time slot. If the observer sees that they are running out of room, they may use a time slot for every half hour or less.

68 Pedestrian Bicycle Resource Initiative (PBRI)
Regional Planning Commission for Orleans, Jefferson, Plaquemines, St. Bernard, and St. Tammany Parishes
bicycle riders on the street, sidewalk and neutral ground before and after the installation of bike lanes. The counts of pedestrians will also be made. The data can be analyzed to find the number of cyclists by direction of travel, specific location, (i.e. street, sidewalk or neutral ground) gender, race and approximate age.
Observation Areas
Each group of streets will have different observation areas. These areas will be provided on maps we give to you.
Two observers should stand or sit at the designated location as indicated by the observation area maps. One observer should be located at each side of the street, within eyesight of the other observer.
Training and Certification
All observers will read this protocol with the trainer and then practice near the corner of N. Rampart and Canal Streets. Observers will be certified with 80% agreement with the trainer after 30 minutes of observation.
Codes and Recoding
Intersection: Usually, this will be Broad and Lafitte; etc.
Temperature: Observers will leave this section blank. The temperature will be filled out by the project manager using the average hour weather data from www.wunderground.com
Rain: Observers will record if there are any rain showers.
Observer Name: Observers will record their first and last name
Comments: Observers should note if there are any unusual circumstances affecting lane usage, such as cars parked on the bike lane or unsafe riding conditions. It should also be noted if another observer substitutes counting by adding their name and the time they observed under comments (i.e., for a bathroom break).
___________________________________________________________
1Schneider, Robert; Patton, Robert; Toole, Jennifer; Raborn, Craig. Pedestrian and Bicycle Data Collection in United States Communities: Quantifying Use, Surveying Users, and Documenting Facility Extent. January 2005. Pedestrian and Bicycle Information Center,

69 New Orleans Pedestrian and Bicycle Count Report 2013
July 2013
Hour: example: 7:00-8:00am will read: 7:00am. Only one hour should be indicated per time slot. If the observer sees that they are running out of room, they may use a time slot for every half hour or less.
Comments: Observers should note if there are any unusual circumstances affecting lane usage, such as cars parked on the bike lane or unsafe riding conditions. It should also be noted if another observer substitutes counting by adding their name and the time they observed under comments (i.e., for a bathroom break).

70 Pedestrian Bicycle Resource Initiative (PBRI)
Regional Planning Commission for Orleans, Jefferson, Plaquemines, St. Bernard, and St. Tammany Parishes
Appendix C: Manual Count Observation Sheets

71 New Orleans Pedestrian and Bicycle Count Report 2013
July 2013
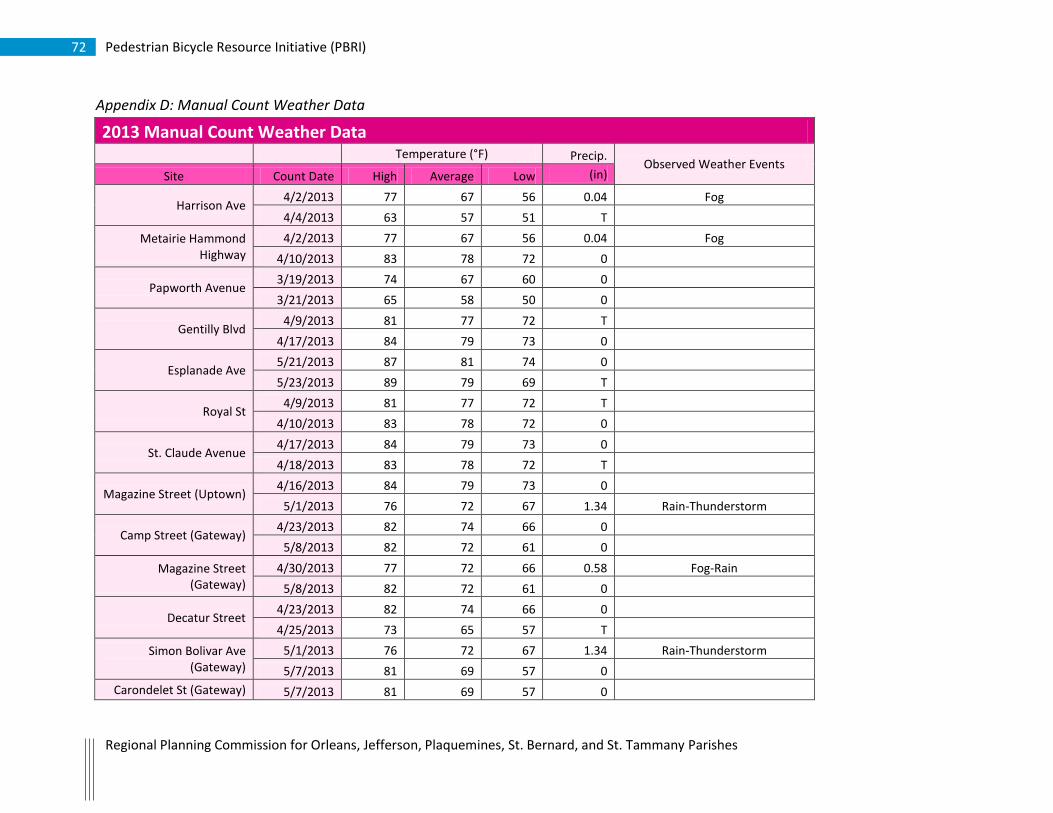
72 Pedestrian Bicycle Resource Initiative (PBRI)
Regional Planning Commission for Orleans, Jefferson, Plaquemines, St. Bernard, and St. Tammany Parishes
Appendix D: Manual Count Weather Data
2013 Manual Count Weather Data Temperature (°F) Precip.
Observed Weather Events Site Count Date High Average Low (in)
Harrison Ave 4/2/2013 77 67 56 0.04 Fog
4/4/2013 63 57 51 T
Metairie Hammond Highway
4/2/2013 77 67 56 0.04 Fog
4/10/2013 83 78 72 0
Papworth Avenue 3/19/2013 74 67 60 0
3/21/2013 65 58 50 0
Gentilly Blvd 4/9/2013 81 77 72 T
4/17/2013 84 79 73 0
Esplanade Ave 5/21/2013 87 81 74 0
5/23/2013 89 79 69 T
Royal St 4/9/2013 81 77 72 T
4/10/2013 83 78 72 0
St. Claude Avenue 4/17/2013 84 79 73 0
4/18/2013 83 78 72 T
Magazine Street (Uptown) 4/16/2013 84 79 73 0
5/1/2013 76 72 67 1.34 Rain-Thunderstorm
Camp Street (Gateway) 4/23/2013 82 74 66 0
5/8/2013 82 72 61 0
Magazine Street (Gateway)
4/30/2013 77 72 66 0.58 Fog-Rain
5/8/2013 82 72 61 0
Decatur Street 4/23/2013 82 74 66 0
4/25/2013 73 65 57 T
Simon Bolivar Ave (Gateway)
5/1/2013 76 72 67 1.34 Rain-Thunderstorm
5/7/2013 81 69 57 0
Carondelet St (Gateway) 5/7/2013 81 69 57 0

73 New Orleans Pedestrian and Bicycle Count Report 2013
July 2013
5/9/2013 83 74 65 0
St. Charles Avenue (Gateway)
5/14/2013 82 71 59 0
5/15/2013 82 72 62 0
St. Bernard Avenue 3/12/2013 66 57 47 0
3/13/2013 67 56 44 0
Airline Drive 3/13/2013 67 56 44 0
3/21/2013 65 58 50 0
Broad St 3/12/2013 66 57 47 0
3/14/2013 66 57 48 0
St. Charles Avenue 3/19/2013 74 67 60 0
3/28/2013 68 55 42 0
Basin St 3/19/2013 74 67 60 0
3/21/2013 65 58 50 0
Williams Blvd 3/26/2013 56 49 41 0
3/27/2013 60 50 40 0
Nashville Ave 3/26/2013 56 49 41 0
3/27/2013 60 50 40 0
Tulane Ave 3/26/2013 56 49 41 0
3/28/2013 68 55 42 0
Loyola Ave 4/2/2013 77 67 56 0.04 Fog
4/4/2013 63 57 51 T
South Carrollton Ave 5/21/2013 87 81 74 0
5/22/2013 79 74 69 0.13
St. Claude Bridge 5/15/2013 82 72 62 0
5/16/2013 83 74 65 T
Broad St Bridge 5/14/2013 82 71 59 0
5/16/2013 83 74 65 T
Source: The Weather Undergound

74 Pedestrian Bicycle Resource Initiative (PBRI)
Regional Planning Commission for Orleans, Jefferson, Plaquemines, St. Bernard, and St. Tammany Parishes
Appendix E: PBRI Extrapolation Methodology Manual Counts were performed at 15 sites in Orleans and Jefferson Parish, LA. Each count site represents a total of four observation periods: two AM counts
(7-9 AM) and two PM counts (4-6 PM). For all sites, with the exception of the Paris and Burbank intersection count, two volunteers observed from opposite
sides of the street, creating a “plane” of observation. Observers differentiated between pedestrians and bicyclists and noted gender, race, age group, helmet
use, and travel orientation. With the data collected by PBRI student workers, the following extrapolation method, derived from the National Bicycle and
Pedestrian Documentation (NBPD) Project, was used to estimate daily, weekly, monthly, and annual traffic volumes of pedestrians and bicyclists.
PBRI Extrapolation Methodology
Divide counts into AM and PM sessions. There should be two, 2-hour counts for each session.
Come up with separate bicycle and pedestrian averages for AM and PM sessions. (i.e. for AM bicycle average, add both 2-hour AM bicycle counts and
divide by the amount of hours observed, which should be four.)
Add the bicycle and pedestrian averages together for a total user average. Then, multiply this number by 1.05 (this multiplier accounts for traffic
between 11pm and 6am which is rarely manually counted and assumed to make up 5% of all daily volume).
To calculate the daily volume, note the time (hours) that were observed for AM and PM counts. These should always be 7-9am for AM counts and 4-
6pm for PM counts. Also note the month of the year. Use the NBPD Project extrapolation formula to find the corresponding adjustment factors for
the time period and month. For our purposes, all manual counts are PED trails and should have been observed on a weekday. Divide total user
averages by their appropriate adjustment factor to get the daily user average.
For weekly volumes, determine the days that the AM and PM counts were observed. They may be the same or different. Use NBPD Project
methodology to find the correct adjustment factor(s) for the AM and PM counts. If, for example, one AM count (2 hours) was taken on a Tuesday and
the other count (2 hours) was taken on a Thursday, take the average of the two adjustment factors and apply it. Divide the AM and PM session daily
user averages by their appropriate adjustment factor to get the weekly averages for AM and PM sessions.
At this point, average the weekly user averages for the AM and PM sessions together since all unique data attributes have now been accounted for.
Get the monthly user average by multiplying the combined AM and PM weekly average by 4.33 (the number of weeks in a year).
In order to get the annual estimate, note the month that the counts were observed. This is done to account for seasonal variation in use. Use NBPD
Project methodology to find the respective adjustment factor for the month observed under our climate pattern and divide the monthly user average
by this number. NBPD methodology provides 3 climates to choose from. For New Orleans, choose “very hot summer, mild winter.” Climate is
accounted for because it affects monthly patterns.
To get monthly or daily averages from the annual estimate above, simply divide by 12 or 365 respectively.
In order to get individual bicycle and pedestrian averages, multiply the desired average (daily, weekly, monthly, or annual) by the bicycle or pedestrian
percentage observed from the manual counts at that site.

75 New Orleans Pedestrian and Bicycle Count Report 2013
July 2013
Appendix F: NBPD Project Count Adjustment Worksheet

76 Pedestrian Bicycle Resource Initiative (PBRI)
Regional Planning Commission for Orleans, Jefferson, Plaquemines, St. Bernard, and St. Tammany Parishes

77 New Orleans Pedestrian and Bicycle Count Report 2013
July 2013

78 Pedestrian Bicycle Resource Initiative (PBRI)
Regional Planning Commission for Orleans, Jefferson, Plaquemines, St. Bernard, and St. Tammany Parishes
Appendix G: Additional Automatic Count Data Tables
Jefferson Davis Trail Observed Volume by Hour of Day Absolute # % of Total Average Hourly Users
12:00 AM 1,111 0.7% 4
1:00 AM 784 0.5% 3
2:00 AM 468 0.3% 2
3:00 AM 308 0.2% 1
4:00 AM 378 0.2% 1
5:00 AM 1,094 0.7% 4
6:00 AM 5,135 3.3% 17
7:00 AM 9,170 5.9% 30
8:00 AM 9,597 6.2% 31
9:00 AM 9,451 6.1% 31
10:00 AM 9,283 6.0% 30
11:00 AM 9,195 5.9% 30
12:00 PM 9,938 6.4% 32
1:00 PM 9,191 5.9% 30
2:00 PM 9,462 6.1% 31
3:00 PM 10,200 6.5% 33
4:00 PM 12,162 7.8% 39
5:00 PM 13,291 8.5% 43
6:00 PM 11,093 7.1% 36
7:00 PM 9,780 6.3% 32
8:00 PM 6,067 3.9% 20
9:00 PM 3,722 2.4% 12
10:00 PM 2,877 1.8% 9
11:00 PM 2,070 1.3% 7
10-Month Total 155,827 100.0% 22.2

79 New Orleans Pedestrian and Bicycle Count Report 2013
July 2013
Jefferson Davis Trail Observed Volume by Week
Week of Absolute # % of Total Average Daily Users
Average Daily Temp
Total Weekly Precipitation (in)
Fri 01 Jun 2012 3299 2.12% 471 81 0.1
Fri 08 Jun 2012 2998 1.92% 428 80 2.1
Fri 15 Jun 2012 3452 2.22% 493 81 1
Fri 22 Jun 2012 3087 1.98% 441 88 0
Fri 29 Jun 2012 3141 2.02% 449 85 0.3
Fri 06 Jul 2012 2811 1.80% 402 83 3.2
Fri 13 Jul 2012 2687 1.72% 384 83 3.2
Fri 20 Jul 2012 3515 2.26% 502 82 4.1
Fri 27 Jul 2012 2840 1.82% 406 85 0.8
Fri 03 Aug 2012 2910 1.87% 416 84 2.5
Fri 10 Aug 2012 3131 2.01% 447 84 1.2
Fri 17 Aug 2012 3115 2.00% 445 80 4.3
Fri 24 Aug 2012 2381 1.53% 340 81 10.6
Fri 31 Aug 2012 3151 2.02% 450 85 0
Fri 07 Sep 2012 4197 2.69% 600 81 0.2
Fri 14 Sep 2012 4134 2.65% 591 79 1.5
Fri 21 Sep 2012 4190 2.69% 599 79 0.2
Fri 28 Sep 2012 3629 2.33% 518 75 1.1
Fri 05 Oct 2012 4543 2.92% 649 71 0
Fri 12 Oct 2012 4262 2.74% 609 75 0.4
Fri 19 Oct 2012 5335 3.42% 762 71 0
Fri 26 Oct 2012 4194 2.69% 599 62 0
Fri 02 Nov 2012 3712 2.38% 530 65 1.3
Fri 09 Nov 2012 3556 2.28% 508 60 0.1
Fri 16 Nov 2012 3654 2.34% 522 60 0
Fri 23 Nov 2012 3010 1.93% 430 57 1
Fri 30 Nov 2012 3814 2.45% 545 66 2.9
Fri 07 Dec 2012 3155 2.02% 451 59 0.3
Fri 14 Dec 2012 3466 2.22% 495 62 0.4
Fri 21 Dec 2012 2868 1.84% 410 55 1
Fri 28 Dec 2012 2274 1.46% 325 51 1.1
Fri 04 Jan 2013 2187 1.40% 312 55 3.4

80 Pedestrian Bicycle Resource Initiative (PBRI)
Regional Planning Commission for Orleans, Jefferson, Plaquemines, St. Bernard, and St. Tammany Parishes
Fri 11 Jan 2013 2715 1.74% 388 56 1.6
Fri 18 Jan 2013 3818 2.45% 545 54 0
Fri 25 Jan 2013 4179 2.68% 597 63 0.9
Fri 01 Feb 2013 4049 2.60% 578 59 2.8
Fri 08 Feb 2013 5350 3.43% 764 61 0.5
Fri 15 Feb 2013 3616 2.32% 517 54 0.4
Fri 22 Feb 2013 3200 2.05% 457 58 3.6
Fri 1 Mar 2013 3537 2.27% 505 53 0
Fri 8 Mar 2012 4150 2.66% 593 59 0.7
Fri 15 Mar 2012 4466 2.87% 638 65 0.1
Fri 22 Mar 2012 4058 2.60% 580 58 0
Fri 29 Mar 2012 3991 2.56% 570 64 2.3
10-Month Total 155827 100.00% 506 69 61.2