payroll department benchmarks and · pdf filepayroll department benchmarks and analysis...
TRANSCRIPT

Essential research and metrics on payroll operations, resources and performance
PAYROLL DEPARTMENT BENCHMARKS AND ANALYSIS 2015–2016

A
Payroll DepartmentBenchmarks and
Analysis 2015-2016
�2015 The Bureau of National Affairs, Inc. • Arlington, Virginia
Payroll Department Benchmarks and Analysis 2015-2016
ISBN 978-1-63359-058-8
‘‘This publication is designed to provide accurate and authoritative information in regard to thesubject matter covered. It is sold with the understanding that the publisher is not engaged inrendering legal, accounting or other professional service. If legal advice or other expert assistanceis required, the services of a competent professional person should be sought.’’ − From aDeclaration of Principles, jointly adopted by a Committee of the American Bar Association and aCommittee of Publishers and Associations.
For inquiries about purchasing multiple copies of this report, pleasecontact:
Matthew Sottong, Surveys Manager([email protected])

s Table of Contents
List of Figures ..................................................................................................... vi
Acknowledgements .............................................................................................. xiii
About the Authors ............................................................................................... xiv
Executive Summary ............................................................................................. xv
Introduction
Overview ............................................................................................................. 3
Definitions of Terms ............................................................................................. 4
Study Design, Methodology and Presentation ....................................................... 5
Profile of Participating Employers ........................................................................ 6
Chapter 1—Payroll Operations and Parameters
Overview ............................................................................................................. 11
Oversight of the Payroll Department ..................................................................... 12
Domestic and International Operations ................................................................. 14
Pay Cycles .......................................................................................................... 17
Tax Deposits ........................................................................................................ 20
Time-Worked Submissions .................................................................................... 21
Chapter 2—Payroll Systems, Automation and Outsourcing
Overview ............................................................................................................. 25
Forms of Payment and Pay Advice ........................................................................ 26
Time-Worked Submission Methods ....................................................................... 29
Payroll Automation and Technology ...................................................................... 31
Perspectives on Payroll Automation and Technology ............................................. 34
Payroll Outsourcing .............................................................................................. 40
Perspectives on Payroll Outsourcing Initiatives .................................................... 46
�2015 The Bureau of National Affairs, Inc. • Arlington, Virginia iii

Chapter 3—Payroll Department Staffing
Overview ............................................................................................................. 49
Payroll Department Staff Ratios ........................................................................... 50
Notes on the Calculation of Payroll Staff Ratios .................................................. 55
Summary of Payroll Staff Ratios in Charts and Tables ......................................... 56
Payroll Staff Composition, Specialists and Changes .............................................. 67
Chapter 4—Payroll Department Budgets
Overview ............................................................................................................. 73
Separate Payroll Department Budgets .................................................................. 74
Budgeted Changes in Payroll Department Expenditures ........................................ 78
Payroll Department Expenditures per Employee .................................................... 83
Payroll Department Expenditures per Payment ..................................................... 94
Payroll Department Staff Salaries ........................................................................ 105
Chapter 5—Routine Payroll Transactions
Overview ............................................................................................................. 109
New Hire Enrollment in Payroll System ................................................................. 110
Payroll System Cutoff to Payday .......................................................................... 122
Garnishment Orders ............................................................................................. 134
Removal of Terminated Employees from Payroll System ........................................ 145
Chapter 6— Payroll Errors, Inquiries and Fraud
Overview ............................................................................................................. 159
Errors in Time-Worked Submissions ...................................................................... 160
Incidence of Payroll Processing Errors .................................................................. 173
A Few Notes on Payroll Processing Error Rates ................................................... 182
Cost of Payroll Processing Errors ......................................................................... 187
Resolution of Payroll Errors .................................................................................. 188
Payroll Department Benchmarks and Analysis 2015-2016
iv � 2015 The Bureau of National Affairs, Inc. • Arlington, Virginia

Incidence of Manual Payments ............................................................................. 198
Incidence of Payroll Inquiries ................................................................................ 209
Cost of Payroll Inquiries ....................................................................................... 220
Resolution of Payroll Inquiries .............................................................................. 221
Payroll Fraud ....................................................................................................... 223
Chapter 7—Payroll Evaluation and Cost Containment
Overview ............................................................................................................. 227
Benchmarking the Payroll Department ................................................................. 228
Cost Containment and Efficiency Initiatives .......................................................... 230
Perspectives on Cost Containment, Efficiency Initiatives ...................................... 233
�2015 The Bureau of National Affairs, Inc. • Arlington, Virginia v
s List of Figures
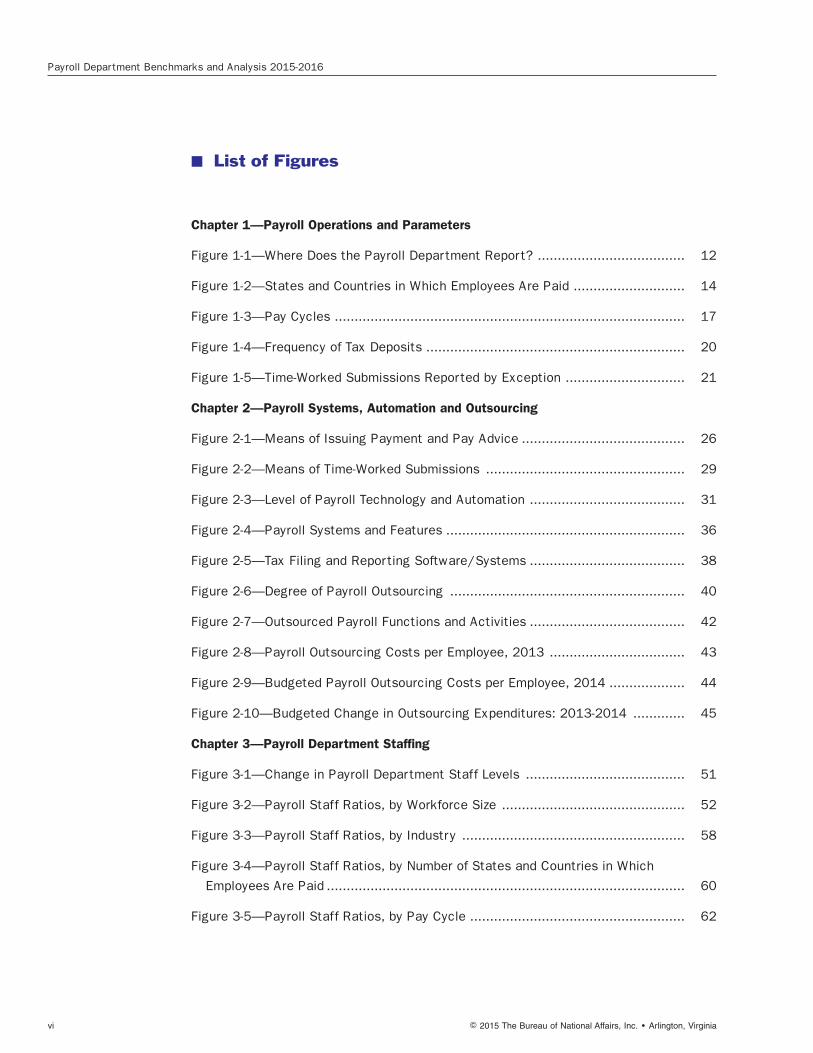
Chapter 1—Payroll Operations and Parameters
Figure 1-1—Where Does the Payroll Department Report? ..................................... 12
Figure 1-2—States and Countries in Which Employees Are Paid ............................ 14
Figure 1-3—Pay Cycles ........................................................................................ 17
Figure 1-4—Frequency of Tax Deposits ................................................................. 20
Figure 1-5—Time-Worked Submissions Reported by Exception .............................. 21
Chapter 2—Payroll Systems, Automation and Outsourcing
Figure 2-1—Means of Issuing Payment and Pay Advice ......................................... 26
Figure 2-2—Means of Time-Worked Submissions .................................................. 29
Figure 2-3—Level of Payroll Technology and Automation ....................................... 31
Figure 2-4—Payroll Systems and Features ............................................................ 36
Figure 2-5—Tax Filing and Reporting Software/Systems ....................................... 38
Figure 2-6—Degree of Payroll Outsourcing ........................................................... 40
Figure 2-7—Outsourced Payroll Functions and Activities ....................................... 42
Figure 2-8—Payroll Outsourcing Costs per Employee, 2013 .................................. 43
Figure 2-9—Budgeted Payroll Outsourcing Costs per Employee, 2014 ................... 44
Figure 2-10—Budgeted Change in Outsourcing Expenditures: 2013-2014 ............. 45
Chapter 3—Payroll Department Staffing
Figure 3-1—Change in Payroll Department Staff Levels ........................................ 51
Figure 3-2—Payroll Staff Ratios, by Workforce Size .............................................. 52
Figure 3-3—Payroll Staff Ratios, by Industry ........................................................ 58
Figure 3-4—Payroll Staff Ratios, by Number of States and Countries in Which
Employees Are Paid .......................................................................................... 60
Figure 3-5—Payroll Staff Ratios, by Pay Cycle ...................................................... 62
Payroll Department Benchmarks and Analysis 2015-2016
vi � 2015 The Bureau of National Affairs, Inc. • Arlington, Virginia

Figure 3-6—Payroll Staff Ratios, by Percentage of Workforce Receiving Electronic
Pay Advice ....................................................................................................... 63
Figure 3-7—Payroll Staff Ratios, by Percentage of Time-Worked Submissions Filed
Electronically ................................................................................................... 64
Figure 3-8—Payroll Staff Ratios, by Level of Technology and Automation in Payroll . 65
Figure 3-9— Payroll Staff Ratios, by Level of Outsourcing ..................................... 66
Figure 3-10—Composition of Payroll Department Staff ......................................... 67
Chapter 4—Payroll Department Budgets
Figure 4-1—Payroll Department Budgets, by Workforce Size ................................. 74
Figure 4-2—Payroll Department Budgets, by Industry ........................................... 76
Figure 4-3—Budgeted Change in Payroll Department Expenditures, 2013-2014 .... 78
Figure 4-4—Budgeted Change in Payroll Department Expenditures, by Workforce
Size ................................................................................................................. 79
Figure 4-5—Budgeted Change in Payroll Department Expenditures, by Select
Industry Classifications .................................................................................... 81
Figure 4-6—Budgeted Payroll Department Expenditure per Employee, by Work-
force Size ......................................................................................................... 83
Figure 4-7—Budgeted Payroll Department Expenditure per Employee, by Industry . 85
Figure 4-8—Budgeted Payroll Department Expenditure per Employee, by Number
of States and Countries in Which Employees Are Paid ....................................... 87
Figure 4-9—Budgeted Payroll Department Expenditure per Employee, by Pay
Cycle ............................................................................................................... 89
Figure 4-10—Budgeted Payroll Department Expenditure per Employee, by Per-
centage of Workforce Receiving Electronic Pay Advice ...................................... 90
Figure 4-11—Budgeted Payroll Department Expenditure per Employee, by Per-
centage of Time-Worked Submissions Filed Electronically .................................. 91
Figure 4-12—Budgeted Payroll Department Expenditure per Employee, by Level of
Technology and Automation in Payroll ............................................................... 92
Figure 4-13—Budgeted Payroll Department Expenditure per Employee, by Degree
of Outsourcing .................................................................................................. 93
�2015 The Bureau of National Affairs, Inc. • Arlington, Virginia vii

Figure 4-14—Payroll Department Expenditure per Payment, by Workforce Size ..... 94
Figure 4-15—Payroll Department Expenditure per Payment, by Industry ................ 96
Figure 4-16—Payroll Department Expenditure per Payment, by Number of States
and Countries in Which Employees Are Paid ...................................................... 98
Figure 4-17—Payroll Department Expenditure per Payment, by Pay Cycle ............. 100
Figure 4-18—Payroll Department Expenditure per Payment, by Percentage of
Workforce Receiving Electronic Pay Advice ....................................................... 101
Figure 4-19—Payroll Department Expenditure per Payment, by Percentage of
Time-Worked Submissions Filed Electronically ................................................... 102
Figure 4-20—Payroll Department Expenditure per Payment, by Level of Technol-
ogy and Automation in Payroll ........................................................................... 103
Figure 4-21—Payroll Department Expenditure per Payment, by Degree of Out-
sourcing ........................................................................................................... 104
Chapter 5—Routine Payroll Transactions
Figure 5-1—Business Days from Hire Date to Payroll System Entry, by Workforce
Size ................................................................................................................. 111
Figure 5-2—Business Days from Hire Date to Payroll System Entry, by Industry .... 113
Figure 5-3—Business Days from Hire Date to Payroll System Entry, by Number of
States and Countries in Which Employees Are Paid ........................................... 115
Figure 5-4—Business Days from Hire Date to Payroll System Entry, by Pay Cycle .. 117
Figure 5-5—Business Days from Hire Date to Payroll System Entry, by Percentage
of Time-Worked Submissions Filed Electronically ............................................... 118
Figure 5-6—Business Days from Hire Date to Payroll System Entry, by Payroll
Automation and Features .................................................................................. 119
Figure 5-7—Business Days from Hire Date to Payroll System Entry, by Degree of
Outsourcing ..................................................................................................... 121
Figure 5-8—Business Days from Payroll System Cutoff to Payday, by Workforce
Size ................................................................................................................. 123
Figure 5-9—Business Days from Payroll System Cutoff to Payday, by Industry ....... 125
Payroll Department Benchmarks and Analysis 2015-2016
viii � 2015 The Bureau of National Affairs, Inc. • Arlington, Virginia

Figure 5-10—Business Days from Payroll System Cutoff to Payday, by Number of
States and Countries in Which Employees Are Paid ........................................... 127
Figure 5-11—Business Days from Payroll System Cutoff to Payday, by Pay Cycle .. 129
Figure 5-12—Business Days from Payroll System Cutoff to Payday, by Percentage
of Time-Worked Submissions Filed Electronically ............................................... 130
Figure 5-13—Business Days from Payroll System Cutoff to Payday, by Payroll
Automation and Features .................................................................................. 131
Figure 5-14—Business Days from Payroll System Cutoff to Payday, by Degree of
Outsourcing ..................................................................................................... 133
Figure 5-15—Business Days from Garnishment Order to Withholding, by Workforce
Size ................................................................................................................. 135
Figure 5-16—Business Days from Garnishment Order to Withholding, by Industry .. 136
Figure 5-17—Business Days from Garnishment Order to Withholding, by Number of
States and Countries in Which Employees Are Paid ........................................... 139
Figure 5-18— Business Days from Garnishment Order to Withholding, by Pay
Cycle ............................................................................................................... 140
Figure 5-19—Business Days from Garnishment Order to Withholding, by Percent-
age of Time-Worked Submissions Filed Electronically ......................................... 141
Figure 5-20— Business Days from Garnishment Order to Withholding, by Payroll
Automation and Features .................................................................................. 143
Figure 5-21—Business Days from Garnishment Order to Withholding, by Degree of
Outsourcing ..................................................................................................... 144
Figure 5-22—Business Days from Termination to Removal from Payroll System, by
Workforce Size ................................................................................................. 146
Figure 5-23—Business Days from Termination to Removal from Payroll System, by
Industry ........................................................................................................... 147
Figure 5-24—Business Days from Termination to Removal from Payroll System, by
Number of States and Countries in Which Employees Are Paid ........................... 150
Figure 5-25—Business Days from Termination to Removal from Payroll System, by
Pay Cycle ......................................................................................................... 151
�2015 The Bureau of National Affairs, Inc. • Arlington, Virginia ix

Figure 5-26—Business Days from Termination to Removal from Payroll System, by
Percentage of Time-Worked Submissions Filed Electronically ............................. 152
Figure 5-27—Business Days from Termination to Removal from Payroll System, by
Payroll Automation and Features ...................................................................... 154
Figure 5-28—Business Days from Termination to Removal from Payroll System, by
Degree of Outsourcing ...................................................................................... 155
Chapter 6—Payroll Errors, Inquiries and Fraud
Figure 6-1—Time-Worked Submission Errors, by Workforce Size ............................ 161
Figure 6-2—Time-Worked Submission Errors, by Industry ...................................... 163
Figure 6-3—Time-Worked Submission Errors, by Number of States and Countries
in Which Employees Are Paid ............................................................................ 165
Figure 6-4—Time-Worked Submission Errors, by Pay Cycle .................................... 167
Figure 6-5—Time-Worked Submission Errors, by Percentage of Time-Worked Sub-
missions Filed Electronically ............................................................................. 168
Figure 6-6—Time-Worked Submission Errors, by Payroll Automation and Features . 171
Figure 6-7—Time-Worked Submission Errors, by Degree of Outsourcing ................. 172
Figure 6-8—Payroll Processing Error Rates, by Workforce Size .............................. 174
Figure 6-9—Payroll Processing Error Rates, by Industry ........................................ 176
Figure 6-10—Payroll Processing Error Rates, by Number of States and Countries
in Which Employees Are Paid ............................................................................ 179
Figure 6-11—Payroll Processing Error Rates, by Pay Cycle ................................... 180
Figure 6-12—Payroll Processing Error Rates, by Percentage of Time-Worked Sub-
missions Filed Electronically ............................................................................. 183
Figure 6-13—Payroll Processing Error Rates, by Payroll Automation and Features . 185
Figure 6-14—Payroll Processing Error Rates, by Degree of Outsourcing ................ 186
Figure 6-15—Average Business Days to Resolve Payroll Error, by Workforce Size .. 189
Figure 6-16—Average Business Days to Resolve Payroll Error, by Industry ............ 191
Figure 6-17—Average Business Days to Resolve Payroll Error, by Number of
States and Countries in Which Employees Are Paid ........................................... 193
Payroll Department Benchmarks and Analysis 2015-2016
x � 2015 The Bureau of National Affairs, Inc. • Arlington, Virginia

Figure 6-18—Average Business Days to Resolve Payroll Error, by Pay Cycle .......... 194
Figure 6-19—Average Business Days to Resolve Payroll Error, by Percentage of
Time-Worked Submissions Filed Electronically ................................................... 195
Figure 6-20—Average Business Days to Resolve Payroll Error, by Payroll Automa-
tion and Features ............................................................................................. 196
Figure 6-21—Average Business Days to Resolve Payroll Error, by Degree of Out-
sourcing ........................................................................................................... 197
Figure 6-22—Incidence of Manual Payments, by Workforce Size ........................... 199
Figure 6-23—Incidence of Manual Payments, by Industry ..................................... 201
Figure 6-24—Incidence of Manual Payments, by Number of States and Countries
in Which Employees Are Paid ............................................................................ 203
Figure 6-25—Incidence of Manual Payments, by Pay Cycle ................................... 205
Figure 6-26—Incidence of Manual Payments, by Percentage of Time-Worked Sub-
missions Filed Electronically ............................................................................. 206
Figure 6-27—Incidence of Manual Payments, by Payroll Automation and Features . 207
Figure 6-28—Incidence of Manual Payments, by Degree of Outsourcing ................ 208
Figure 6-29—Payroll-Related Inquiries per Employee, by Workforce Size ................ 210
Figure 6-30—Payroll-Related Inquiries per Employee, by Industry .......................... 212
Figure 6-31—Payroll-Related Inquiries per Employee, by Number of States and
Countries in Which Employees Are Paid ............................................................ 214
Figure 6-32—Payroll-Related Inquiries per Employee, by Pay Cycle ........................ 215
Figure 6-33—Payroll-Related Inquiries per Employee, by Percentage of Time-
Worked Submissions Filed Electronically ........................................................... 216
Figure 6-34—Payroll-Related Inquiries per Employee, by Payroll Automation and
Features .......................................................................................................... 218
Figure 6-35—Payroll-Related Inquiries per Employee, by Degree of Outsourcing ..... 219
Figure 6-36—Average Business Days to Resolve a Payroll Inquiry, by Workforce
Size ................................................................................................................. 221
Figure 6-37—Incidence of Payroll Fraud ............................................................... 223
�2015 The Bureau of National Affairs, Inc. • Arlington, Virginia xi

Chapter 7—Payroll Evaluation and Cost Containment
Figure 7-1—Does the Payroll Department Benchmark its Performance? ................ 228
Figure 7-2—Sources of Benchmarking Metrics ..................................................... 229
Figure 7-3—Cost Containment and Efficiency Initiatives ....................................... 231
Payroll Department Benchmarks and Analysis 2015-2016
xii � 2015 The Bureau of National Affairs, Inc. • Arlington, Virginia
s Acknowledgements
We wish to extend our thanks to the many payroll executives and professionalswho participated in this year’s Payroll Benchmarks survey. This report would nothave been possible without their willingness to complete the comprehensivesurvey questionnaire, despite their considerable professional duties andobligations. We are very grateful for their participation.
We also would like to thank Michael Baer of Bloomberg BNA for his invaluableassistance during the research and questionnaire design phases of the project, aswell as for his perspective on the report’s content and analysis.
As always, we are indebted to Fonda Jarrett and Mike Wright of Bloomberg BNAfor their diligent, conscientious and professional work on the design, layout andpublication of this report.
�2015 The Bureau of National Affairs, Inc. • Arlington, Virginia xiii

s About the Authors
The following individuals contributed to the study design, data collection, analysis,writing, copyediting and production of this report.
Matthew R. Sottong
Research Director and Managing Editor
Andrew J. Hellwege
Survey Research Analyst
Cordelia Gaffney
Graphics Director
J. Michael Reidy
Consulting Editor
Payroll Department Benchmarks and Analysis 2015-2016
xiv � 2015 The Bureau of National Affairs, Inc. • Arlington, Virginia

s Overview
Bloomberg BNA’s Payroll Department Benchmarks and Analysis 2015-2016 is acomprehensive survey-based report on payroll operations, staffs, budgets,responsibilities and performance. Based on the results of an in-depth surveyquestionnaire, the report’s narrative and graphics provide extensive research andanalyses across a broad spectrum of topics and measures, including:
s payroll operations and parameters, including oversight of the payroll depart-ment, extent of domestic and international operations, pay cycles and meansof time-worked submissions;
s payroll staffing and expenditures, particularly per capita measures of stafflevels and budgets;
s payroll systems, technology and automation;
s outsourcing of payroll functions and activities;
s speed and efficiency of routine payroll transactions;
s incidence and resolution of payroll errors, inquiries and fraud; and
s evaluation and benchmarking of the payroll department.
This report is the second iteration of Bloomberg BNA’s most extensive surveyresearch and analysis on the payroll function, conducted among more than 200payroll professionals nationwide in 2014. The report’s extensive narrative isaccompanied by more than 100 charts and tables, notes on methodology and‘‘perspectives’’ pieces on the experiences, challenges and accomplishments ofpayroll departments and professionals.
Introduction
�2015 The Bureau of National Affairs, Inc. • Arlington, Virginia 3

s Definitions of Terms
Please note the following definitions of several terms used throughout this report.
Average—The average, or mean, is the sum of all values divided by the numberof values or observations in the data set or series.
Median—The median is the midpoint or middle value within a set of figuresarranged in numerical order. That is, half the numbers in a set fall above themedian and the other half below it. Medians are often used in statistical analysesto help ensure that a few extreme values in a range of numbers do not distort theresults. Values at the extremes (‘‘outliers’’) tend to have a much greater impact onthe mean than on the median.
Central range or midrange—The central range or midrange refers to the rangebetween the 25th percentile (first quartile) and the 75th percentile (third quartile)in a numerical series. Fifty percent of the values fall within this range.Twenty-five percent fall below the 25th percentile figure and 25 percent lie abovethe 75th percentile mark. The central range or midrange (the middle 50 percent)might be characterized as a broad representation of the most common orprevalent percentages, ratios or amounts.
Full-time equivalent (FTE)—In this report, full-time equivalents are usedprimarily to adjust for the full-time or part-time status of workers in comparisonsof staff levels in the payroll department. Therefore, a payroll office with threefull-time employees (3.0 FTEs) and three half-time employees (3 x 0.5=1.5 FTEs)has 4.5 full-time equivalent workers.
Employee headcount—The total number of employees in an organization’sworkforce (not including contractors, temporaries or contingent workers)regardless of full-time or part-time status. A company with 110 full-time workersand 17 part-time employees has an employee headcount of 127.
Payroll Department Benchmarks and Analysis 2015-2016
4 � 2015 The Bureau of National Affairs, Inc. • Arlington, Virginia

s Study Design, Methodology, and Presentation
Bloomberg BNA’s Payroll Department Benchmarks and Analysis 2015-2016 isbased on an extensive survey conducted among payroll professionals andexecutives in 2014, drawn from a sample of payroll professionals in BloombergBNA’s nationwide database. The survey was conducted over a secure website,with several reminders to respond. As an incentive to participate, respondentsreceive a copy of the full survey report. A total of 230 respondents providedusable data for analysis.
Several steps were taken to ensure that survey participants’ responses wouldremain confidential. As noted above, the survey was hosted on a secure website toensure that information submitted by respondents could not be observed orobtained by third parties. Respondents were assured that neither individualrespondents nor the organizations they represented would be identified withoutexpress permission from the participants. Apart from those exceptions, onlyaggregate data and statistics are presented and analyzed in this report.
Introduction
�2015 The Bureau of National Affairs, Inc. • Arlington, Virginia 5

s Profile of Participating Employers
The responding payroll professionals represent a wide variety of enterprises,
institutions and industries, as the summary data below demonstrates.
Manufacturing 22%
Basic manufacturing 7%Intermediate manufacturing 4%Advanced manufacturing 11%
Nonmanufacturing 53%
Business, personal and miscellaneous services 16%Retail and wholesale trade 11%Finance, insurance and real estate 8%Transportation, warehousing and utilities 7%Information services, telecommunications and data processing 4%Consulting 3%Construction 3%Other *
Nonbusiness 26%
Health care 11%Government 7%Education 6%Membership organizations and associations 1%Other *
Workforce Size (Total employee headcount)
Fewer than 250 employees 11%250 to 499 employees 8%500 to 999 employees 10%1,000 to 2,499 employees 19%2,500 or more employees 50%No response 2%
Region
Northeast 17%South 30%North Central 33%West 19%No response *
Payroll Department Benchmarks and Analysis 2015-2016
6 � 2015 The Bureau of National Affairs, Inc. • Arlington, Virginia

Union Status
Union-represented employees 37%Non-union 60%No response 3%
*Less than 0.5 percent.
Introduction
�2015 The Bureau of National Affairs, Inc. • Arlington, Virginia 7
About Bloomberg BNA
Bloomberg BNA delivers specialized information to human resources,
legal, business, and government professionals at every level of
expertise. As the leading independent publisher of print and electronic
news, analysis, and reference products, Bloomberg BNA has provided
intensive coverage of new developments for more than 75 years.
An extensive network of more than 500 Bloomberg BNA editors,
reporters, and correspondents, posted at federal, state and
international government offices, courts and other key locations,
ensures that you have timely information and expert analysis of the
issues that matter most. Our authoritative, nonpartisan publications
are recognized for their editorial excellence and objectivity.
See why Bloomberg BNA’s fast, reliable HR answers make us the
most trusted information leader in the industry. Visit www.bna.com/HR
to learn more.
1801 S. Bell Street · Arlington, VA 22202800.372.1033
bna.com
© 2015 THE BUREAU OF NATIONAL AFFAIRS, INC.