payment reform - tmc€¦ · payment reform: bundled payment ... •final budgets are created at...
TRANSCRIPT
1
Payment Reform: Bundled Payment Pilot & Electronic Connectivity
Ken JandaPresident and CEO TMC Health Policy Institute National MeetingSeptember 20, 2017

2
About Us
• Non-profit Health Maintenance Organization licensed by the Texas Department of Insurance
• Affiliate of the Harris Health System (Houston’s public hospital system)
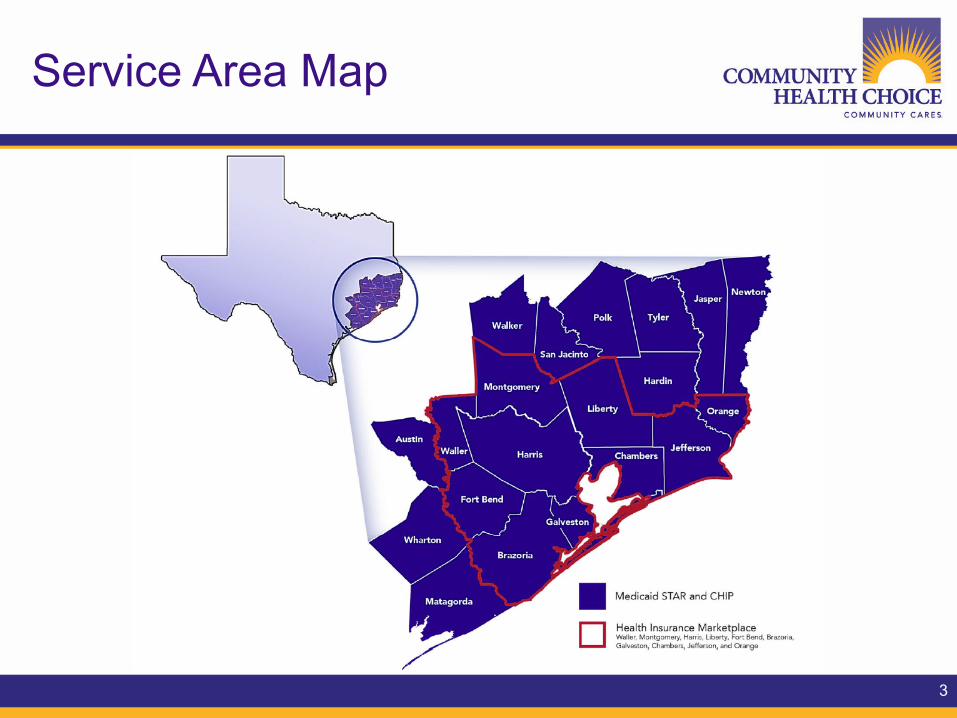
• Serves over 440,000 Members in the following programs:• Medicaid State of Texas Access Reform (STAR) Program • Children’s Health Insurance Program (CHIP) • Health Insurance Marketplace Plans offered under the ACA.• Regional HMO coverage for State of Texas employees (ERS).• Administrator for multiple collaborative safety net projects.
• Surplus goes to community benefits program
3
Service Area Map

4
Guiding Principle: Health Care Triple Aim

5
What Are Our Goals? A Health Policy Home Run
FirstBase:Personalaccountabilityfor
healthandfinancing
SecondBase:Coverageforeveryone
ThirdBase:Simplifyfundingand
administrationofprograms
HomePlate:Slowhealthcarecost
increasesthroughproviderpaymentreform
6
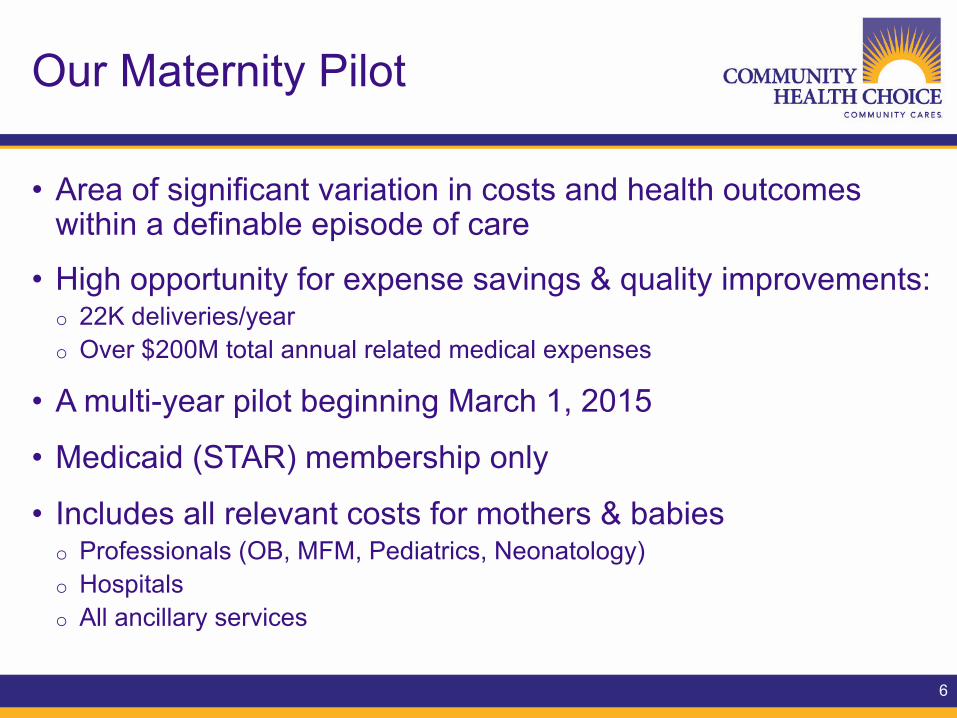
Our Maternity Pilot
• Area of significant variation in costs and health outcomes within a definable episode of care
• High opportunity for expense savings & quality improvements: o 22K deliveries/year o Over $200M total annual related medical expenses
• A multi-year pilot beginning March 1, 2015
• Medicaid (STAR) membership only
• Includes all relevant costs for mothers & babieso Professionals (OB, MFM, Pediatrics, Neonatology)o Hospitalso All ancillary services

7
Pregnancy and Delivery EpisodeDefinitions for Bundled Payment
The definition of the pregnancy/delivery/neonatal episodes includes:
• Both low risk and high risk pregnancies with severity markers
• Related care for Moms and babies:o For the mother: includes all related services for delivery including post
discharge period (60 days post discharge) and entire pre-natal care period (270 days prior to delivery)
o For the infant: includes initial delivery stay and all services/costs up to 30 days post discharge
o Blended C-section and vaginal delivery rate; blended nursery levels 1, 2 and 3; exclude nursery level 4 babies.

8
Maternity and Newborn Episode

9
Average Expected Episode Budget(Blended Deliveries) ~ $8,952*

10
Creating Patient Specific Budgets – Year 1
• Patient specific budgets are based on the historical average costs and are adjusted based on risk factors
• Patient Risk Factors include:o Patient demographics – ageo Patient comorbidities - mostly diagnosis code-based (very few
procedures)o Clinical severity markers (derived from episode specific risk categories,
e.g. gestational diabetes, multiple gestation, etc.)o Collected from claims data and clinical recordso Neonatal costs are not risk adjusted
• Timing of Risk Factors:o Risk factors are mostly ex-ante (historic); not concurrento Clinical severity markers (subtypes) are pulled from the trigger claims,
the look-back time window, and medical record data

11
Provider Selection
• Provider groups selected based on willingness to engage and understanding of need to move in this direction
• Chose two higher volume, multi-specialty (OBs, neonatologists and pediatricians) physician groupso UT Physicians – deliveries at LBJ and Memorial Hermann
facilitieso UTMB – deliveries at system facilities

12
Implementation
After historical data analysis:• Providers identify eligible patients upon delivery (mothers
and babies) • Preliminary patient budgets are created • Providers submit initial quality data for identified patients• Community submits updated claims data on regular basis• Ongoing reconciliation of patient lists• Quarterly provider meetings on financial and quality results• Final budgets are created at completion of episode;
Reconciliation occurs at end of each pilot year

13
Planned Transition
• Year 1: Upside risk only, quality scorecard used for monitoring and setting benchmarks
• Year 2: Upside/downside risk, quality thresholds for shared savings
• Year 3 and beyond: Move away from current contractual payments to flat dollar or other budget payments with reconciliation

14
Opportunities for Margin Under Bundled Approach
Reduction Provider
Reduce C-Section Rate by 10 percentage points $335,000
Reduce Neonatal LOS by 10% $175,000
Reduce PACs for C-Sections by 50% $90,000
Reduce PACs during Pregnancy by 50% $85,000
Reduce PACs for Vaginal Delivery by 50% $30,000
Reduce Infant Post-Discharge Admits by 50% $225,000
Reduce Infant Post-Discharge ED Visits by 50% $60,000
Total Potential Savings/Margin $1 Million
Potential of $1 million in savings from a budget of $9 million.

15
Quality ScorecardFull Term Births
Term Babies GA>or equal to 37 completed weeks Points
Prenatal Care
Prenatal Care Visit (HEDIS) 0Risk-appropriate screenings during pre-natal care visits 10Shared-decision making on mode of delivery 10
Delivery Care% of early elective deliveries prior to full gestation 20% of eligible patients who receive intra-partum antibiotic prophylaxis for GBS and/or Antenatal Steroids 5
Postpartum Care
Postnatal Care Visit (HEDIS) 0BP Monitoring 15Random finger-stick testing; patients with results that exceed a certain threshold required to have a 2 hour fasting glucose test 10
Depression screening 10
Baby Care% of babies who were exclusively breast fed during stay 10% of babies receiving Hep B vaccine prior to discharge 10
Total Points 100

16
Patient Reported Outcome Measures (PROM)• PROMs and how they differ from Patient Satisfaction
Surveys was first discussion:“How was the food in the hospital?” or “How long did you wait for your appointment in the physician office?”
vs. “Were you given enough time to ask questions during office visits?” or “Do you feel you were involved enough in decisions about your care?”
• Modified Childbirth Connection PROM Surveyo Birth Informationo Prenatal Careo Birth Experienceo Postpartum Care

17
Year 1 Financial Results
• Year 2 start delayed until October 1, 2016, to allow for full analysis of budget and quality data
• Year 1 final results:Provider1 Provider2
Delivery Budget 7% favorable 12% unfavorable
Newborn Budget 10% favorable 100% unfavorable
Pregnancy Budget 7% unfavorable 2% favorable
Total Budget 5% favorable 33% unfavorable

18
Year 1 Quality Results
Provider 1 Possible Points Points Achieved PercentPrenatal 30 27 90%Delivery 90 60 67%Post-Partum 40 33 83%Newborn 40 24 60%All (preterm and full term weighted average) 73%
Provider 2 Possible Points Points Achieved PercentPrenatal 55 26 47%Delivery 40 32 80%Post-Partum 55 39 71%Newborn 50 38 76%All (preterm and full term weighted average) 67%

19
Key Year 1 Takeaway
• Nursery level determination may be less objective than previously thought and may not be best indicator of ultimate cost:o Significant differences in level distribution across providers and over
timeo Correlations of LBW and/or preterm with nursery level is uneveno Birth defects can be costly but are not necessarily dealt with in Level 4
nursery.
• Recommendation: to protect both provider (from extreme outlier episodes) and plan (from arbitrary placement), keep all babies in but use stop loss aimed at true outliers

20
Year 2 Transition
• Began October 1, 2016 to allow providers time to digest Y1 results and make care delivery changes
• Year 2 includes upside and downside risk, tempered by quality improvements/declines
% Share in Loss (over budget)
Change in Score(PPT)
% Share in Gain (under budget)
0.50 -0.20 0.0
0.45 -0.05 0.35
0.40 0 0.45
0.35 0.05 0.55
0.25 0.20 0.75

21
Measuring Success
• Little provider change in behavior/practice during Year 1
• Delayed Year 2 start so that providers could have fuller understanding of changes they could implement
• Year 1 quality results set baseline for many metrics we did not have visibility into previously; expect quality metrics improvement in Year 2
• Case study commitment

22
UT Physicians Reduces Costs &Improves Outcomes of Obstetric Patients
https://www.utphysicians.com/news/2017/05/ut-physicians-reduces-costs-improves-outcomes-obstetric-patients/
UT Physicians received a bonus check of more than $101,000 from Community Health Choice for its successful efforts during a pilot study to lower costs and advance the care of pregnant women and their babies.
“It has been a great experience to be in partnership with Community Health Choice the last two years,” said Sean Blackwell, M.D., professor and chair of the Department of Obstetrics, Gynecology and Reproductive Sciences at McGovern Medical School at The University of Texas Health Science Center at Houston (UTHealth). “We have improved the quality of care provided to our patients, eliminated unnecessary procedures and lowered costs. It’s a formula for success.”
23
Electronic Connectivity with Harris Health Network Access Improvement Program (NAIP)

24
Background
• Clinical data flow between providers and Managed Care Organizations (MCOs) still lives in the 90’s: o Telephonic pre-certifications o Faxes for clinical information o On-site concurrent reviews by managed care staff o Retrospective denial of claims due to “system” failures rather than lack
of medical necessity for services
• EPIC is largest EHR system in Houston market• Regional health information exchange (GHH) slow to connect
providers much less MCOs• Need to build trust between providers and MCOs to expedite
care, improve outcomes and reduce administrative burden

25
Goals
• Utilize IGTs to draw down additional Federal Medicaid funds for projects that improve network access, care coordination and provider/MCO relationships (NAIP)
• Improve availability, quality and coordination of services for Medicaid enrollees through provider/MCO collaboration
• Reduce administrative burden of MCOs’ utilization management and claim payment processes
• Build trust between providers and MCOs

26
The Project
• Build “EpicCare Link” interface between Community and Harris Health
• Allow Community staff access to member medical record information
• Bi-directional electronic exchange of eligibility and prior authorization information
• Collaboration to increase efficiency of prior authorization requests: o Electronic submission and approval of prior authorizations o Clinical information available in a dedicated section of EpicCare Link
• Year 1 includes inpatient admissions, outpatient information and requests to be added in year 2
• Capability for electronic claim status queries and responses

27
Evaluation and Next Steps
Analysis not yet complete but expecting: • Reduction in process time
• Near elimination of wait time for additional information and need for call-backs
• Reduction in administrative denials
• No increase in medical necessity denials (early fear that MCOs would use access to find reason to deny claims)
• Opportunity to provide real-time electronic connectivity to MCO care guidelines to reduce concurrent review burden
• Opportunity to replicate with other providers using EPIC
