paying themselves: s corporation owners and trends in s ......paying themselves: s corporation...
TRANSCRIPT

Office of Tax Analysis
Working Paper 107
August 2016
Paying Themselves: S Corporation Owners and Trends in
S Corporation Income, 1980-2013
Susan C. Nelson
The OTA Working Papers Series presents original research by the staff of the Office of Tax
Analysis. These papers are intended to generate discussion and critical comment while
informing and improving the quality of the analysis conducted by the Office. The papers are
works in progress and subject to revision. Views and opinions expressed are those of the authors
and do not necessarily represent official Treasury positions or policy. Comments are welcome,
as are suggestions for improvements, and should be directed to the authors. OTA Working
Papers may be quoted without additional permission.

1
PAYING THEMSELVES: S CORPORATION OWNERS AND TRENDS IN
S CORPORATION INCOME, 1980-2013
August 2016
Susan C. Nelson1
The composition of business income has shifted dramatically in the last three decades, away
from C corporations and into pass-through forms of organization. Examining this shift by
looking only at business profits, as is the standard practice, ignores the income that owner-
employees of small or closely-held corporations receive as wages from their firms. Partners and
sole proprietors are not allowed to pay themselves wages so the total earnings from their
businesses are well reflected by profits and distributives shares. In contrast, whether the income
of C and S corporation owners is reported as wages or business profits is influenced by the
businesses’ organizational form and tax preferences.
This paper focuses on S corporations because their profits have surged as a share of business
income over time, and because it is easier to identify owner-employees of S corporations than of
C corporations. The paper uses administrative data from 2001 to 2013 to measure the
compensation that S corporation owners receive from their businesses in the form of wages. It
finds that ignoring owner-wages seriously understates the earnings that S corporations receive
from their businesses. Using officer compensation, which is shown to be a good proxy for
owner-employee wages, the paper finds that owner-employee wages exceeded reported net trade
or business income of S corporation until 1994, and since then has amounted to over two-thirds
of reported S corporation ordinary income. A broad measure of S corporation earnings, which
includes officer compensation as a proxy for owner-employee wages, exceeded partnership net
income every year from at least 1980 until 2006, and since then has exceeded partnership net
income as often as not.
After examining the effect on S corporations of tax legislation over the past several decades, the
paper considers broader implications of the understatement of the income of S corporation
owners. For instance, tax-based statistics form the core of many analyses of income inequality
and of the sources of rising inequality.Because wages paid to business owners are represented
as labor income, the importance of business-related income in inequality may be understated.
Similarly the wage and business income that business owners report for tax purposes may not be
an accurate measure of the relative income they receive from labor versus capital. The
understatement also has implications for tax policy such as in identifying income that business
owners could shift out of the pass-through sector in response to reductions in the corporate tax
rate.
Keywords: S Corporations, Business Taxes, Pass-Throughs, Officer Compensation, Inequality
JEL Codes: H24, H25
___________________________________________________________________________ Susan C. Nelson: Office of Tax Analysis, U.S. Department of the Treasury, [email protected].
1. Adam Looney made major contributions to this paper. Michael Cooper and Portia DeFilippes provided superb
data analysis for the project, and Gerald Auten, Edith Brashares, James Mackie, James Pearce, Richard Prisinzano,
and Matt Smith provided very helpful comments on earlier drafts. Nathan Born assisted with the editing.

2
Introduction
Business owners contribute labor and capital to their firms. In small or closely-held
firms, the return to these factors can be difficult to separate. In practice, whether owners’
income is reported as wages or business profits is influenced by the businesses’ organizational
form and tax preferences. For instance, partners and sole proprietors are not allowed to pay
themselves wages so the total earnings from their businesses—the returns to both labor and
capital—are well reflected by profits and distributive shares.1
In contrast, the income of C or S corporation owners may be divided into profits,
intended to reflect a return to capital, or compensation for services provided to the firm.
Moreover, while owners’ profits are readily observable in published statistics, the labor earnings
of corporate owner-employees are not available because corporate tax returns do not identify
wages paid to their owners separately from wages paid to non-owner employees.2 The omission
of this source of business owners’ income is likely to be particularly severe in corporations that
are closely held and actively managed by their owners, where the owners are able to adjust the
profits/labor split to their advantage.3 This describes most S corporations, where the vast
majority has only 1 or 2 shareholders, and basically only individuals are eligible to be
shareholders. The individual owners of many small, closely-held C corporations also exercise
substantial control over their compensation
This paper focuses on S corporations because their profits have surged as a share of
business income over time, inviting further investigation of the income going to their owners,
1 Partners can receive guaranteed payments for labor or other services provided to the partnership, but such
payments are neither required nor the norm. 2 An exception is that C corporations with $500,000 in total receipts (S corporations beginning in 2013) are required
to provide detailed information on all officer compensation on Form 1125-E. However, this detail is not published. 3 As Judge Richard Posner wrote, S corporation owners have an incentive “to alchemize salary into earnings.”
Construction and Design Co. v. USCIS, 563 F.3d 593 (7th
Cir. 2009).

3
and because it is easier to identify owner-employees of S corporations than of C corporations.
The paper first uses administrative data to measure the compensation that S corporation owners
receive from their businesses in the form of wages, and finds that ignoring owner-wages
seriously understates the earnings that S corporation owners receive from their businesses. For
example, in 2013, almost all of the $254 billion in officer compensation reported by
S corporations represented wages paid to owners, or about 36 percent of the total income paid by
S corporations (profits plus wages) to their owners. Until 1994, officer compensation of
S corporations exceeded reported net trade or business income of S corporations. Since then,
officer compensation, on average, amounted to over two-thirds of reported S corporation
ordinary income.
A broad measure of S corporation earnings, which includes officer compensation as a
proxy for owner-employee wages, shows that S corporations represent a larger share of total
business net income in recent decades and a larger share of business income growth over time
than does the traditional measure of net income. Since 1994, broad S corporation earnings have
exceeded net income of sole proprietors. From at least 1980 through 2006, it exceeded
partnership net income in every year, and since then it has exceeded partnership net income as
often as not. Between 1980 and 2013, S corporation business income alone accounted for about
17 percent of the increase in business net income; including the wages of owners, the broad
measure of S corporation earnings accounted for 26 percent of the total increase in business net
income (plus S corporation officer compensation).
The understatement of owners’ income also occurs within closely-held C corporations.
Closely-held C corporations have strong incentives to pay out income to owners in the form of
compensation to avoid the double tax on dividends, which are taxed at both the corporate and the

4
individual levels. In practice, small, closely-held firms appear to pay out a majority of their
income in the form of executive compensation, and this compensation represents the majority of
all officer compensation paid by C corporations.4 Hence, it seems likely that the aggregate
amount of officer compensation paid to owner-employees in C corporations is large as well.
However, identifying owner-employees of C corporations is more challenging than for
S corporations because there is no annual filing requirement for C corporations that identifies all
owners comparable to Schedule K-1s for S corporations. Thus this paper confines its
quantitative analysis to S corporations, although the understatement of income of owners of
closely-held C corporations warrants further study as well.
The fact that a large share of the income that owners of S corporations and other closely-
held corporations derive from their business is received as wages has several potential
implications for interpreting published statistics based on tax data. For instance, tax-based
statistics form the core of many analyses of income inequality and of the sources of rising
inequality. Because wages paid to business owners is represented as labor income in those
statistics, the importance of business-related income in inequality may be understated. For
example, S corporation profits are highly concentrated, with about 70 percent accruing to
taxpayers in the top one percent. Although wages of employee-owners are less concentrated
than profits, those wages would represent roughly 10 percent of all wage income of top-income
taxpayers.
Similarly, these findings suggest that the wage and business income that business owners
report for tax purposes may not be an accurate measure of the relative income they receive from
labor versus capital. Reporting of business owners’ income as wages or profits varies across
4 Calculations by Matt Smith of the Office of Tax Analysis based on returns of privately-held C corporations with
less than $10 million in assets for 2004 through 2013.

5
entities and is responsive to tax policy changes, suggesting that labor’s reported share of income
varies across entities and over time for non-tax economic reasons. These measurement issues are
likely magnified by the increasing concentration of business activity in pass-through entities, and
could affect trends in macroeconomic statistics that rely on IRS-reported income sources.
The understatement of owners’ income also has implications for tax policy, for instance,
in identifying income that business owners could shift out of the pass-through sector in response
to a business tax reform that lowered corporate rates, or income that could be shifted into pass-
through profits if the pass-through rate were lowered relative to the individual tax rate on wage
income, or to avoid specific tax provisions such as the Net Investment Income tax..
The first section of this paper describes the data on owner-employee wages and officer
compensation of S corporations. The second section shows how the picture of S corporations’
earnings over time changes when the aggregate earnings of S corporation owners include officer
compensation and relates enacted legislation to changes in the growth of S corporation profits
and officer compensation. The third section puts the expanded measure of S corporation income
in the context of total business net income and considers legislative changes in recent decades
that have affected the balance between officer compensation and S corporation profits. The final
section considers implications of the results and discusses questions for future research.
Section I. Paying Themselves: Identifying owner-employee wages and officer
compensation
Corporations are required to pay their owners “reasonable compensation” for services
provided.5 The firm deducts the payments and the owner includes them in income. What is
5 From the Instructions to Form 1120S: “Distributions and other payments by an S corporation to a corporate officer
must be treated as wages to the extent the amounts are reasonable compensation for services rendered to the

6
“reasonable” is not a precise term and therefore corporations and their owners in fact have a fair
amount of leeway in choosing what to pay their owner-employees.6 Since 90 percent of S
corporations have only one or two shareholders, and 98 percent have 5 or fewer, owner-
employees likely have substantial influence in setting their wages.7 S corporation employee-
shareholders have incentives to minimize the wages they receive in order to avoid or minimize
employment taxes since, unlike wages, S corporation profits (or distributive income) are not
subject to employment taxes, either as wages subject to Federal Insurance Contribution Act
(FICA) taxes or as self-employment earnings subject to Self-Employment Contributions Act
(SECA) taxes. As will be discussed later, as the cap on wages subject to Medicare taxes
approximately doubled in 1992 and then was eliminated in 1994, and an additional Medicare tax
was imposed on wages of high-income individuals in 2013, the incentives to characterize
earnings as profits rather than wages have grown.
S corporations are directed to report payments to owners that represent reasonable
compensation on line 7 of the S corporation’s Form 1120S income tax return if the owner is an
officer, on the wages and salaries line 8 if the owner is not an officer, or possibly on line 3 of
Form 1125-A in labor costs of goods sold.8 Regardless of where owners’ wages show up on the
corporation’s tax return, they are deducted in calculating the net income of the S corporation and
should be reported to the owner on a W-2 with appropriate income and payroll tax withholding.
corporation. “ Page 15. 2012 - Instructions for Form 1120S. Officer compensation amounts should include fringe
benefits made on behalf of officers owning more than 2% of the corporation’s stock, and are reported as wages on
their W-2. 6 In its 2010 report Actions Needed to Address Noncompliance with S Corporation Tax Rules,” GAO reported that
“Stakeholder representatives, IRS officials, and TIGTA have indicated that determining adequate shareholder
compensation is highly subjective and hinders compliance and enforcement.” 7 Unpublished SOI data for 2012. Figures for other recent years are comparable.
8 Firms might also characterize payments to owners as “non-employee compensation,” properly or improperly, and
report those on Form 1099-MISC

7
Identifying owner-employee wages requires identifying the owner as both owner and
employee. With S corporations, the Form 1120S Schedule K-1 information returns that the
corporation files annually identify owners and their social security numbers (SSNs) which can be
matched with W-2s issued by the firm to isolate owner-employees.
In theory, owner-employee wages can be either greater or less than officer compensation.
To the extent that officers are not shareholders, officer compensation could exceed owners’
wages. On the other hand, to the extent that shareholder-employees are not officers, the reverse
might be true: owners’ wages could equal or exceed officer compensation. Indeed, any apparent
relation between the amount of owner-wages and officer compensation could be coincidental.
However, given the nature of S corporations as privately held with very few owners and the vast
majority of owners reporting active (as opposed to passive) income or loss, those shareholders
are most likely to be officers, and wages they receive would be reported as officer compensation.
Even if most owner-wages are reported as officer compensation, compliance or reporting
problems could lead to difficulties matching the administrative data, resulting in owners’ wages
being under-identified. For example, firms might fail to issue W-2s to officers or make mistakes
in SSNs. Payroll processing firms or other intermediaries issuing W-2s might impede linkages
between shareholders’ K-1s and their W-2s from the firm. It is an empirical question whether
reported officer compensation can be used as a proxy for owner-employee wages in years when
those wages are not available.
The analysis starts with the income tax returns from the annual IRS Statistics of Income
(SOI) samples of S corporations which are selected to represent the full population of S
corporations from 2001 through 2013. Taking S corporations’ employer identification numbers
(EINs) from the returns, the analysis uses IRS administrative data to find the Form 1120S

8
Schedule K-1s that those firms issue to shareholders and the W-2s they issue for wages paid to
employees. If a firm issues both a K-1 and a W-2 to the same SSN, that individual is considered
an owner-employee and the wages reported on that W-2 are counted as wages of owner-
employees.9
The matching put all firms into one of four categories, shown graphically for 2013 in Figure
1.
(1) “No W-2s found & no labor costs” reported.10
This category is treated as not having any
owner-employees. In 2013, 1,271,000 S corporations fell into this category.
(2) “With OEW” – with owner-employee wages. Labor costs were reported and W-2s were
found that matched to K1s issued by the firm. 2,147,000 S corporations fell into this
category in 2013.
(3) “With W-2, no K-1--W-2.” Labor costs reported but no W-2s of owners found. None of
the SSNs on W2s matched to K-1s, so no owner-employee wages. 420,000 S
corporations in this category in 2013.
(4) “No W-2 but labor costs.” No W-2s found (for owners or other employees), but some
labor costs reported. 371,000 S corporations fell into this category in 2013.
9 The administrative data needed for matching are only reliably available back to 2001.
10 Labor costs include wages and salaries, officer compensation, and labor costs of goods sold.

9
Excluding the firms that deducted no labor expenses (the grey bar on the left), one or
more W-2s were found for 86-88 percent of the S corporations in each year 2001 to 2013. Of
these most had W-2s with SSNs that matched to shareholders of the W-2 issuing S corporation.
Overall, owner-employee wages were found, on average, on 70 percent of S corporations with
labor costs and on 80 percent where any W-2s were found. 11
Figure 2 compares the amounts of officer compensation (OC) with owner-employee
wages (OEW) for 2001 - 2013. It separates the officer compensation amounts according to
whether the S corporation reports owner-employee wages as well as any wages. The top line
(Total OC, the dotted line) shows the total amount of officer compensation reported on form
1120S. The next line down (OEW, the line with dashes) shows the total wages on W-2s issued
to the S corporations’ owners, as determined by matching administrative data. Over this 13-year
period, identified owner-employee wages averaged 89 percent of S corporation officer
compensation, suggesting officer compensation is a strong candidate to proxy owners’ wages.
11
Firms might legitimately have labor costs of goods sold that they reported to independent contractors as Non
Employee Compensation on Form 1099-MISC. About 4 percent of S corporations issued 1099MISC to their
shareholders. The non-employee compensation amounted to about 2 percent of officer compensation.
No W2 & no labor costs
With OEW
With W2, no K1-W2
No W2 but labor costs 500
1000
1500
2000
2500
Office of Tax Analysis calculations with IRS administrative data
Figure 1. Number of S Corporations by Match Status, 2013 (in 1000's)

10
Officer compensation could exceed observed owner-employee wages either because the
officers were not owners (e.g. it was managed by an employee) or because of errors in the
matching of owners to W-2s because of issues like processing delays, typos, or other sources of
error. To assess the source of the discrepancy, the next line down (the solid line) shows the
officer compensation deducted by firms for whom some owner W-2s were found—firms where
any matching errors are presumably reduced. In all years, the wages paid to owner-employees
slightly exceeded the officer compensation reported by these firms, indicating that for these
firms, officer compensation is a very good proxy for owner-employee wages.12
12
This pattern of total OEW exceeding OC for firms with any owners’ wages holds for firms with and without net
income.
0
50
100
150
200
250
300
2001 2003 2005 2007 2009 2011 2013
Office of Tax Analysis calculations with IRS administrative data
Figure 2. S Corporation Officer Compensation & Owner-Employee Wages
2001 - 2013, billions of dollars
Total officer compensation (OC)Owner-employee wages (OEW)Officer c omp with owner-employee wagesOfficer comp with W2s found but no owner-employee wagesOfficer comp but no W2s found

11
However, for the remaining firms that deducted officer compensation but where no
owner W-2s were found, it remains unclear whether systematic matching errors are responsible
or whether there were simply no owner employees. To narrow this down further, the two lines at
the bottom of the figure show officer compensation where: (a) some W-2s were found but no W-
2s for owners (the line with large dashes), and where (b) no W-2s were found but officer
compensation was deducted (solid grey line). Both of these categories report only small amounts
of officer compensation, The first of these two categories could represent firms with non-owner
officers, or the absence of owner-W-2s could reflect compliance or matching problems.13
Between 2001-2013, officer compensation at these firms represented about 7 percent of all S
corporation officer compensation—making that a reasonable upper bound on the amount of
officer compensation paid to non-owners. However, for the second category, which reported an
average of 8 percent of total officer compensation per year, errors in the filing of forms or
finding those forms must explain those firms who reported and deducted officer compensation
but for whom no W-2s were found. If W-2s had been found, it is likely that most of them would
have been linked to owners.
Combining these pieces of likely and identified wage payments to owners (and adding in
non-employee compensation paid to owners on Form 1099-MISC that amounted to 2 percent of
officer compensation) brings total owners’ wages very close to officer compensation. Taken as a
whole, these findings suggest that officer compensation would be a good proxy for owner-
employee wages for years in which the administrative data were not available to identify owners’
wages.
13
The firms could have failed to issue W-2s for officer-shareholders, or the links from S corporation EINs to SSNs
on shareholder K-1s and W-2s might have been faulty, or a combination of both.

12
Section II. A more complete picture of S corporation income for owners over time
The composition of business income has shifted dramatically in the last three decades,
away from C corporations and sole proprietorships and into partnerships and S corporations.
Figure 3 shows the standard SOI figures on the shares of business net income by entity type,
comparable to what was first presented in Petska et al. (2005) and more recently shown in Plesko
and Toder (2013) and DeBaker and Prisinzano (2015). In 2013, 51 percent of U.S. business
income was earned in the pass-through sectors, compared to only 21 percent in 1980.
-10%
0%
10%
20%
30%
40%
50%
60%
70%
80%
1980 1985 1990 1995 2000 2005 2010
Note: regulated investment corporations (RICs) and real estate investment trusts (REITS) are included in business net income but not in the C corporation series. Source: IRS Statistics of Income Integrated Business Data plus unpublished IRS data
Figure 3. Shares of Total Business Net Income (less deficit) 1980 - 2013
Partnership Sole proprietorship S corporation C corporation
Partnership
Sole prop.
C corp.
S Corp.

13
This figure is a useful starting point for considering the declining importance of the
corporate income tax as business net income has shifted away from C corporations and towards
pass-through businesses. However, this figure does not present the complete picture of income
accruing to business owners because it excludes compensation paid to corporate owners.
Using the conclusion of Section I changes the picture of the profitability of the S
corporation sector over time. Including their wages (as proxied by officer compensation) shows
that S corporation shareholders have been receiving substantially more in the way of current
earnings from their businesses than S corporation net income shows. This can be seen in Figure
4 which compares officer compensation to two measures of net income: trade or business income
and total net income. Trade or business income is sometimes referred to as “ordinary business
income” and is the type of net income that S corporation owner-employees could more easily
switch between wages and profits. Total net income includes trade or business income plus
additional components that generally obtain their character as they are received by the firm,
namely portfolio income, such as capital gains and dividends, and rental income. Total net
income is the measure used by SOI in the Integrated Business Data for comparisons among
different types of businesses, shown earlier in Figure 3.
Until 1994, officer compensation exceeded both measures of S corporations’ net income.
From 1994 through 2003, officer compensation tracked trade or business income quite well.
During this decade it was equivalent to, on average, 102 percent of trade or business net income.
Since 1994 total net income has generally grown faster than both trade or business net income
and officer compensation. Nevertheless, officer compensation amounted, on average, to 77
percent of total net income between 1994 and 2003. Since 2003, both measures of income have
shown considerably more volatility than officer compensation, with officer compensation

14
averaging only 62 percent of total income since then. Ignoring owners’ wages misses a
substantial portion of the earnings of S corporation shareholders, understating the profitability of
the sector.
Section III. Total business income and expanded S corporation earnings over time
Ignoring the wages paid to S corporation shareholders also short-changes the S
corporation sector in comparisons with other types of businesses. Figure 5 revises the standard
shares of business income shown in Figure 3 to include officer compensation in the S
corporation share as well as in the total income of all businesses. Since TRA86, S corporation
officer compensation has averaged about 9 percent of total business income. Expanding the
$0
$50
$100
$150
$200
$250
$300
$350
$400
$450
$500
1980 1985 1990 1995 2000 2005 2010
Source: IRS Statistics of Income published and unpublished data
Figure 4. S Corporation Net Income & Officer Compensation
1980-2013 (in billions)
Total net income (less deficit)
Officer compensation
Trade or business net income (less deficit)
Total Net Income
Officer comp
Trade/bus. NI

15
measure of S corporation income to include shareholders’ wages doesn’t alter the general picture
of a shift from C corporation and sole proprietor income to partnerships and S corporations. It
does, however, alter the comparison between partnerships and S corporations, showing the S
corporation sector as growing faster than partnerships when wages of S corporation shareholders
(proxied by officer compensation) are included. Figure 5 shows the expanded measure of S
corporation earnings exceeding total income from partnerships until 2006 (instead of until 1993
in Figure 3). Since then, partnership income has sometimes exceeded expanded S corporation
income but sometimes not.
-10%
0%
10%
20%
30%
40%
50%
60%
70%
80%
1980 1985 1990 1995 2000 2005 2010
Source: IRS Statistics of Income Integrated Business Data plus unpublished IRS data
Figure 5. Shares of Business Net Income (less deficit) plus S Corporation Officer Compensation
1980 - 2013
Partnership Sole proprietorship S corporation + OC C corporation
C corps
Sole prop
S corp. + Officer Comp.
Partnership
16
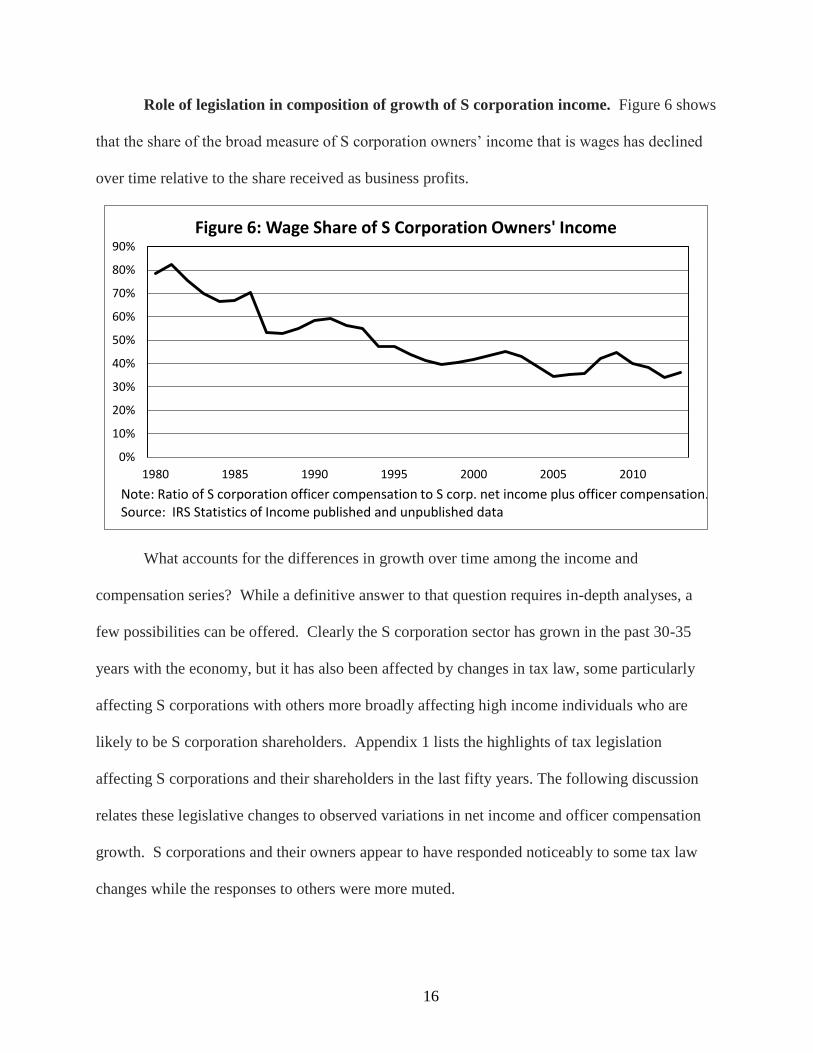
Role of legislation in composition of growth of S corporation income. Figure 6 shows
that the share of the broad measure of S corporation owners’ income that is wages has declined
over time relative to the share received as business profits.
What accounts for the differences in growth over time among the income and
compensation series? While a definitive answer to that question requires in-depth analyses, a
few possibilities can be offered. Clearly the S corporation sector has grown in the past 30-35
years with the economy, but it has also been affected by changes in tax law, some particularly
affecting S corporations with others more broadly affecting high income individuals who are
likely to be S corporation shareholders. Appendix 1 lists the highlights of tax legislation
affecting S corporations and their shareholders in the last fifty years. The following discussion
relates these legislative changes to observed variations in net income and officer compensation
growth. S corporations and their owners appear to have responded noticeably to some tax law
changes while the responses to others were more muted.
0%
10%
20%
30%
40%
50%
60%
70%
80%
90%
1980 1985 1990 1995 2000 2005 2010
Figure 6: Wage Share of S Corporation Owners' Income
Note: Ratio of S corporation officer compensation to S corp. net income plus officer compensation. Source: IRS Statistics of Income published and unpublished data

17
1980s. 1982 saw a substantial revision to S corporation rules and operations with the
Subchapter S Revision Act of 1982, but it wasn’t until the Tax Reform Act of 1986 (TRA86) that
the S corporation sector took off. The role of TRA86 in spurring the growth in the S corporation
sector has been well documented.14
Among other changes, TRA86 reversed the traditional
relation between top individual and top corporate rates, increasing the relative advantage of
operating as a passthrough business. More specifically affecting S corporations was TRA86’s
“repeal” of the General Utilities doctrine.15
After 1986, C corporations generally had to
recognize gain when distributing appreciated property. To provide some parity, gains distributed
from S corporations that were former C corporations would be subject to a built-in-gains tax if
distributed within 10 years of becoming an S corporation.
The post-TRA86 expansion of the S corporation sector can be seen in Figure 4. Both
measures of net income and officer compensation rose sharply in 1987 and 1988. For several
years after, officer compensation continued its rise before leveling off in 1991, while net income
showed little increase from 1988-1991, perhaps with the recession of 1991. By 1991 officer
compensation amounted to more than double trade or business net income and exceeded total net
income by nearly half.
1990s Figure 4 shows 1991 as the beginning of a change in the relation between officer
compensation and net income: the net income measures began outpacing growth in officer
compensation. This is consistent with the changes that the Omnibus Budget Reconciliation Act
of 1990 (OBRA90) and that the Omnibus Budget Reconciliation Act of 1993 (OBRA93) made to
the Medicare portion of employment taxes (HI tax). OBRA90 for the first time set the earnings
cap on the HI tax above the cap for social security (OASDI) taxes. Effective for tax year 1991,
14
For example, see Nelson (1993), Plesko (1994); Auten et al (forthcoming). 15
General Utilities Corporation v. Helvering. 296 U.S. 200 (1935).

18
the OASDI cap was $53,400 and the HI cap $125,000. OBRA93 then removed the HI earnings
cap completely, effective for 1994.
These changes in the HI cap provided incentives for highly paid S corporation owner-
employees to characterize less of their earnings as wages or officer compensation, and more as
profits since S corporation earnings distributed to owners as wages and officer compensation
face employment taxes, whereas earnings distributed as profits do not. As mentioned earlier,
owner-employees are required to be paid “reasonable compensation” for the services they
provide the business, but that instruction provides considerable flexibility.
Researchers have found evidence of income shifting by high income taxpayers from 1993
into 1992 to avoid the higher income tax rates imposed by OBRA93: top rates on ordinary
income went from 31 percent to 39.6 percent, while top capital gains rates stayed at 28 percent.
There is also evidence of shifting from 1994 into 1993 to avoid the uncapped HI tax.16
Auten et
al find evidence of dramatic increases in capital gains realizations by S corporation executives
(much of the difference between total net income and trade and business net income in Figure 4
comes from capital gains). A similar response was found with high income individuals that had
large amounts of partnership income. These partners appeared to be more responsive to
removing the HI tax cap than to the OBRA93 increases in individual income tax rates.
The Small Business Job Protection Action of 1996 (SBJPA96) substantially broadened
the scope for S corporations, making that form of organization more attractive to more and larger
businesses. It increased the maximum number of shareholders from 35 to 75, allowed banks that
did not use the reserve method of accounting to elect S corporation status, expanded the category
of eligible shareholders to include certain tax-exempt organizations and trusts, and it allowed S
16
See Auten et al (forthcoming) and Auten and Kawano (2013) for good summaries of the literature and additional
evidence of shifting.

19
corporations to own certain corporate subsidiaries. Figure 4 shows that, after SBJPA96 went into
effect, total net income climbed well beyond trade or business income and officer compensation,
while officer compensation and trade or business income were rising together but at a more
modest rate. A question for future research is whether the added growth in the types of portfolio
income included in total net income, but not in trade or business income, result from the
broadening of scope from SBJPA96 or from a continuation of shifting out of ordinary income
and into capital gains encouraged by the rate differentials set in place by OBRA93.
2000s. The Bush Tax Cuts,17
enacted in 2001 and 2003, lowered income taxes for most
taxpayers in a number of ways, including reducing statutory tax rates on ordinary income as well
as on long-term capital gains and qualified dividends. In 2004, provisions of the Small Business
Jobs Protection Act (SBJA04) specifically addressed large S corporations, raising the allowable
number of shareholders to 100 and counting up to six generations of family members as a single
shareholder.
What’s striking about Figure 4 during the 2000s until the Fiscal Crisis is that for the first
time, net trade or business income grew substantially faster than officer compensation, and total
net income faster still. Whether the Bush Tax Cuts or the SBJA04 contributed to the differential
growth rates of the three types of S corporation earnings is unclear. In particular, why did net
trade or business income diverge from officer compensation in 2003 when it hadn’t in the late
1990s after the HI cap was removed? Perhaps it reflects a continuation of the prior trend of
shifting from wage to S corporation distributions that may have been interrupted by the 2001
recession. (Net income appears more cyclically sensitive than officer compensation.) Perhaps
with the lower statutory income tax rates, payroll taxes, including the HI tax, were a larger share
17
Officially, the Economic Growth Tax Relief Reconciliation Act of 2001 (EGTRRA) and Jobs and Growth Tax
Relief Reconciliation Act of 2003 (JGTRRA).

20
of total Federal taxes and therefore began to draw more attention for tax planning. Preliminary
analysis by industry and number of shareholders doesn’t show any obvious explanations.
2010s. Two pieces of legislation had the potential for significant impact on S
corporations: the Affordable Care Act (ACA) enacted in 2010 and the American Taxpayer Relief
Act of 2012 (ATRA12). The ACA, better known for its health care reforms, imposed a 0.9
percent added Medicare tax on employment earnings of individuals with incomes over a
threshold of $200,000 single/$250,000 joint. It also created the Net Investment Income Tax
(NIIT) which levied a 3.8 percent tax on most investment income, including interest, dividends,
capital gains and passive income. The NIIT applied to taxpayers over the same threshold as the
added Medicare tax. However, active S corporation income and some active income of limited
partners were covered by neither the Medicare tax nor the NIIT. Both the added Medicare tax
and the NIIT became effective for tax year 2013.18
ATRA12 also went into effect in 2013. It permanently extended many of the Bush Tax
Cuts except for some of those benefitting high income taxpayers. In particular, it raised the top
individual rate from 35 to 39.6 percent and the top rate on capital gains and qualifying dividends
from 15 to 20 percent. Considering the additional Medicare tax and NIIT of the ACA and
ATRA12, top marginal rates on most forms of income rose about 7 percentage points between
2012 and 2013. However, the top rates on active S corporation income rose less than others and
ended up at least 3 percentage points lower than for most other types of income.19
As a result of these changes in relative marginal rates, Auten et al (forthcoming) found
the very top income groups shifted income from 2013 into 2012, a short run shift in capital gains
18
For more explanation, see U.S. Treasury, Office of Tax Analysis (2016). 19
Auten et al (forthcoming).

21
realizations but also a longer run shift into active S corporation income, particularly from passive
S corporation income.
The evidence in Figure 4 is consistent with the Auten et al findings: substantial increases
in both measures of income from 2011 to 2012 (twice as large in percentage terms as their
increases in 2010 or 2011 coming out of the recession), followed by a decline in total S
corporation income reflecting a drop in capital gains realizations, and a leveling off of trade or
business net income. Officer compensation, however, resumed its slower but steady increase
after the recession.
Because the imposition of the additional Medicare tax and the NIIT were known with the
passage of ACA in 2010, taxpayers had time to avoid or minimize their impact before they went
into effect in 2013. (Kosnitzky and Grisolia, 2013.) It would be tempting to say that the sharp
increases after 2009 in both types of S corporation net income relative to officer compensation
reflect these responses. However, since the patterns mimic those in the early 2000s after the
Bush tax cuts when tax rates dropped, further investigation is warranted to identify the effect of
the ACA taxes on high income individuals.
IV. Summary, Implications, and Future Research
Summary. This paper broadens the view of earnings that owners of S corporations
receive from their businesses beyond profits to include wages that owner-employees receive for
services provided. Using IRS administrative data for 2001-2013, it finds that wages paid to
owners and reported on W-2s can be proxied by officer compensation claimed by the
S corporations and reported in SOI statistics. Based on this analysis, the paper shows that

22
ignoring this source of income for S corporation shareholders has seriously understated the
income of the S corporation sector at least back to 1980.
There are variations in the size of the understatement, depending on which measure of
income is used and which years are considered: it is larger until 1994 and larger for ordinary
income than for total net income (which includes both ordinary and portfolio income). The
paper considers the influence that major pieces of tax legislation, both broadly applicable and
narrowly focused on S corporations, might have had in recent decades. Movements in the time
series on S corporation income (trade or business income and total income) and on officer
compensation appear consistent with expected responses to major changes in individual income
and capital gains tax rates and in particular to change in the HI tax on high income taxpayers.
The effects of narrower S corporation-focused legislation, however, in 1996 and 2004, need
further research to identify.
The paper also puts the broader version of S corporation income in the context of total
business income from all types of firms. Including owner-employee wages, as proxied by officer
compensation, S corporations contributed a larger share of business income than partnerships
every year examined until 2006 (instead of until 1993 using the standard measure of S
corporation net income) and for some of the years since then. Since TRA86 S corporations’
officer compensation has averaged about 9 percent of total business net income for businesses of
all types. These earnings of S corporation owners should not be ignored in examining the
composition of business income or in considering the potential response of S corporations and
their owners to business tax reform measures such as reductions in the corporate income tax.
Implications and questions for future work. The fact that S corporation and,
undoubtedly, closely-held C corporation owners receive a large share of their business income in

23
the form of wages suggests that published statistics, which group together the labor income of
employees and owners, should be interpreted cautiously.
For instance, published statistics based on tax data form the basis for measuring the
distribution of income across households, and analyzing how that distribution has changed over
time (Piketty-Saez 2003; Congressional Budget Office 2016). This literature shows that income
concentration increased substantially over time: according to Harris and Sammartino (2012) and
CBO (2016), the top-1 percent income share doubled (from 10.5 percent to 21.3 percent)
between 1979 and 2007, though it had dropped back to 15.0 percent by 2013. Cooper et al. 2015
note that 41 percent of that increase came in the form of higher pass-through business income,
because it is both increasing in size and concentration. In 2013, about 70 percent of partnership
and S corporation business income accrued to taxpayers in the top 1 percent.
Even though the income S corporation owners receive as wages is less concentrated than
profits, S corporation owners’ wages represent a sizable share of all wages accruing to the top
1 percent. According to data matched to Treasury’s Individual Income Tax Model for 2010, the
top one-percent of taxpayers received over 46 percent of all S corporation owner-employee
wages. Tthese wages amounted to roughly 10 percent of all wages reported by individuals in the
top income group that year. (The amount that owners of closely-held C corporations pay
themselves in wages would raise that share.) Whether owners’ wages have contributed to
changes in inequality in income or wages over time is less clear, however, and depends on
whether the concentration in owner wages was correlated with or offset increases in the
concentration of owner profits. Moreover, the migration of business activity from C corporations
to S corporations suggests that some increase in officer compensation among S corporation

24
owners was offset by reductions in compensation of C corporation officers. Data drawn from
linked owner-business records could help address these questions.
Similarly, the Bureau of Economic Analysis relies on information on wages paid to
inform its measures of national income and to differentiate labor from capital income. The fact
that business owners’ income may be reported as wages or profits depending on organizational
form and tax preferences and that the income of owners is economically important, may have
implications for understanding macroeconomic trends in the relative income of capital and labor.
Figure 7 illustrates the recent experience of the S corporation sector as an example. In 2001, non-
owner employee wages represented 65 percent of total profits plus wages paid by S corporations,
owners’ wages represented 20 percent, and owners profits 15 percent. By 2013, owners’ profits
had increased to 24 percent, owners’ wages was about unchanged at 19 percent, but non-owner
employee wages had declined to 57 percent. Hence, at least within the S corporate sector,
whether all or some owners’ wages are counted as labor or capital income could have a sizable
effect on the level of labor’s share and in its change over time.

25
This paper has raised more fundamental questions than it has answered. For instance,
how much of the wages paid by small closely-held C corporations is really payment of business
profits to owner-employees? Has that sector seen a decline in income shares going to non-owner
employees as has the S corporation sector? If we can identify the tax returns of the individuals
receiving these owner-wages from C corporations and S corporations, particularly the high
income individuals, what would that say about the sources of income inequality? And how does
the blurring of the line between profits and owners-wages affect the possible responses to
changes in business taxation such as would come with business tax reform proposals?
0%
10%
20%
30%
40%
50%
60%
70%
80%
2001 2003 2005 2007 2009 2011 2013
Shar
e o
f p
rofi
ts p
lus
wag
es
pai
d
Figure 7: S Corporation Employee and Owner Income Shares, 2001 - 2013
Employee wages
Owner wages
Owners' net income
Source:

26
Appendix 1. Major Legislation Affecting S Corporations and Their Shareholders - 1980-2013
Year of
legislation Name and Main S corporation related provisions
1958 Subchapter S created.
o Limit 10 shareholders. Raised in steps to 25 by 1981
1982 Subchapter S Revision Act of 1982 (SSRA)
o Fundamentally revised S corporation rules
o 35 shareholder limit
1986 Tax Reform Act of 1986 (TRA86)
o Changed relation between individual and corporate rates,
o Repealed General Utilities (General Utilities Co. v. Helvering, 296 U.S. 200
(1935)).
-- After 1986, corporations generally must recognize gain when distributing
appreciated property.
-- Introduced built-in gains tax on previous C corporations
1990 OBRA 1990 (Omnibus Budget Reconciliation Act of 1990)
o Set HI taxable maximum higher than OASDI maximum.
o For TY91, Hi taxable maximum = $125,000 vs $53,400 for OASDI.
1993 OBRA 1993 - enacted August 1993.
o Raised top rates on ordinary income, kept top capital gains rate at 28%
o Removed cap on earnings for the HI tax , effective 1/1/94
1996 Small Business Job Protection Act of 1996 (SBJPA96)
o Broadened scope of S corporations:
-- Could own certain corporate subsidiaries
-- Allowed certain banks to elect S corporation status
-- Certain tax-exempt organizations and trusts could be shareholders
o Increased shareholder limit to 75
2001 & 2003
Economic Growth Tax Relief Reconciliation Act of 2001 (EGTRRA)
and Jobs and Growth Tax Relief Reconciliation Act of 2003
(JGTRRA) o Cut individual income tax rates
2004 American Jobs Creations Act (AJCA) -- effective tyba 12/31/04
o Shareholder limit to 100
o Up to 6 generations of family members treated as a one shareholder.
2010 Affordable Care Act (ACA)
o Imposed 0.9% added Medicare tax on high income earners
o Net Investment Income tax - 3.8% tax on most investment income
-- Included capital gains, dividends, passive income etc.
o Covered by neither NIIT or 0.9% added Medicare tax:
o effective 2013
2012 ATRA12 (American Taxpayer Relief Act of 2012)
o Introduced July 2012, enacted January 2013
o Let top individual rates rise from 35% to 39.6%
o Other increases for top incomes
Sources: Sicular (2014); Auten et al. (forthcoming); De et al (2014).

27
REFERENCES
Auten, Gerald, David Splinter, and Susan Nelson, forthcoming. “Reaction of High Income
Taxpayers to Major Tax Legislation.” National Tax Journal.
Auten, Gerald, and Laura Kawano, 2013. “Another Look at Taxpayer Responses to the 1993
Act.” In Proceedings of the 104th
Annual Conference on Taxation. 13-20. National Tax
Association, Washington, DC. Available at
http://ntanet.org/images/stories/pdf/proceedings/11/03.pdf
Bull, Nicholas, Susan Nelson, and Robin Fisher, 2009. “Characteristics of Business Ownership:
Overview for Pass-Through Entities and Evidence on S Corporate Ownership from Linked
Data,” Proceedings of the Annual Conference on Taxation, June, p. 37.
Congressional Budget Office, 2016. The Distribution of Household Income and Federal Taxes,
2013 https://www.cbo.gov/publication/51361
Cooper, Michael, John McClelland, James Pearce, Richard Prisinzano, Joseph Sullivan, Danny
Yagan, Owen Zidar, 2015. “Business in the United States: Who Owns it and How Much Tax
They Pay,” September 3.
De, Rajlakshmi, Hamid Mehran, Michael Suher, 2014. “Evolution of S-Corporation Banks.”
Liberty Street Economics. November 3.
http://libertystreeteconomics.newyorkfed.org/2014/11/evolution-of-s-corporation-
banks.html#.V3wVsPnR8dU
DeBacker, Jason M. and Richard Prisinzano, 2015. “The Rise of Partnerships.” Tax Notes,
147(13): 1563-75.
Harris, Ed, and Frank Sammartino, 2012. “Trends in the Distribution of Household Income,
1979-2007.” Presentation to the National Tax Association 2012 Spring Symposium.
http://www.cbo.gov/publica6on/42729
Knittel, Matthew J. and Susan C. Nelson, 2011.“How Would Small Business Owners Fare Under
A Business Entity Tax?” National Tax Journal, December, 64 (4), 949–75.
Kosnitzky, Michael and Michael Grisolia, 2013. “Net Investment Income Tax Regulations
Affecting S Corporations.” Taxes-The Tax Magazine. 91 (4): 63-74.
Nelson, Susan, 1993. “S Corporations: The Record of Growth After Tax Reform.” Journal of S
Corporation Taxation, 5(2), 138-161.
Petska, Tom, Michael Parisi, Kelley Luttrell, Lucy Davitian, and Matt Scoffie, 2005. “An
Analysis of Business Organizational Structure and Activity from Tax Data,” Special Studies in
Federal Tax Statistics, pp. 9–44. https://www.irs.gov/pub/irs-soi/05petska.pdf

28
Picketty, Thomas and Emmanuel Saez, 2003. "Income Inequality in the United States, 1913-1998"
with Thomas Piketty, Quarterly Journal of Economics, 118(1), 1-39
Plesko, George, 1994 “The Role of Taxes in Organizational Choice: S Conversions after the Tax
Reform Act of 1986.” Working Paper. Sloan School of Management, Massachusetts Institute of
Technology.
Plesko, George A and Eric J. Toder, 2013. “Changes in the Organization of Business Activity
and Implications for Tax Reform.” National Tax Journal, December, 66(4), 855-870.
Sicular, David R., 2014. “Subchapter S at 55—Has Time Passed This Passthrough By? Maybe
Not.” Tax Lawyer 68 (1), 185-238.
U.S. Government Accountability Office (GAO), 2010. “Actions Needed to Address
Noncompliance with S Corporation Tax Rules.” GAO-10-195, report to the Committee on
Finance, U.S. Senate.
U.S. Treasury, Office of Tax Analysis, 2016. “Gaps between the Net Investment Income Tax
Base and the Employment Tax Base.” April. www.treasury.gov/resource-center/tax-policy/tax-
analysis/Documents/OTA-NIIT-SECA-Coverage.pdf