paying more for power - electricity rates in the us and canada - may 2014
TRANSCRIPT

Paying More for Power Electricity Rates in the US and Canada
by Gerry Angevine& Kenneth P. Green
May 2014


May 2014
Paying More for PowerElectricity Rates in the US and Canada
by Gerry Angevine and Kenneth P. Green

fraserinstitute.org

fraserinstitute.org / i
Contents
Executive summary / iii
Introduction / 1
The basis of the rates comparison / 2
How the rates compare / 5
Reasons for the differences in rates / 13
The impact of taxes levied on consumers’ bills / 32
Summary of selected electricity rate comparisons / 35
Conclusions / 37
Policy recommendations / 38
References / 40
About the authors / 43
Acknowledgments / 44
Publishing information / 45
Supporting the Fraser Institute / 46
Purpose, funding, & independence / 47
About the Fraser Institute / 48
Editorial Advisory Board / 49

fraserinstitute.org
fraserinstitute.org / iii
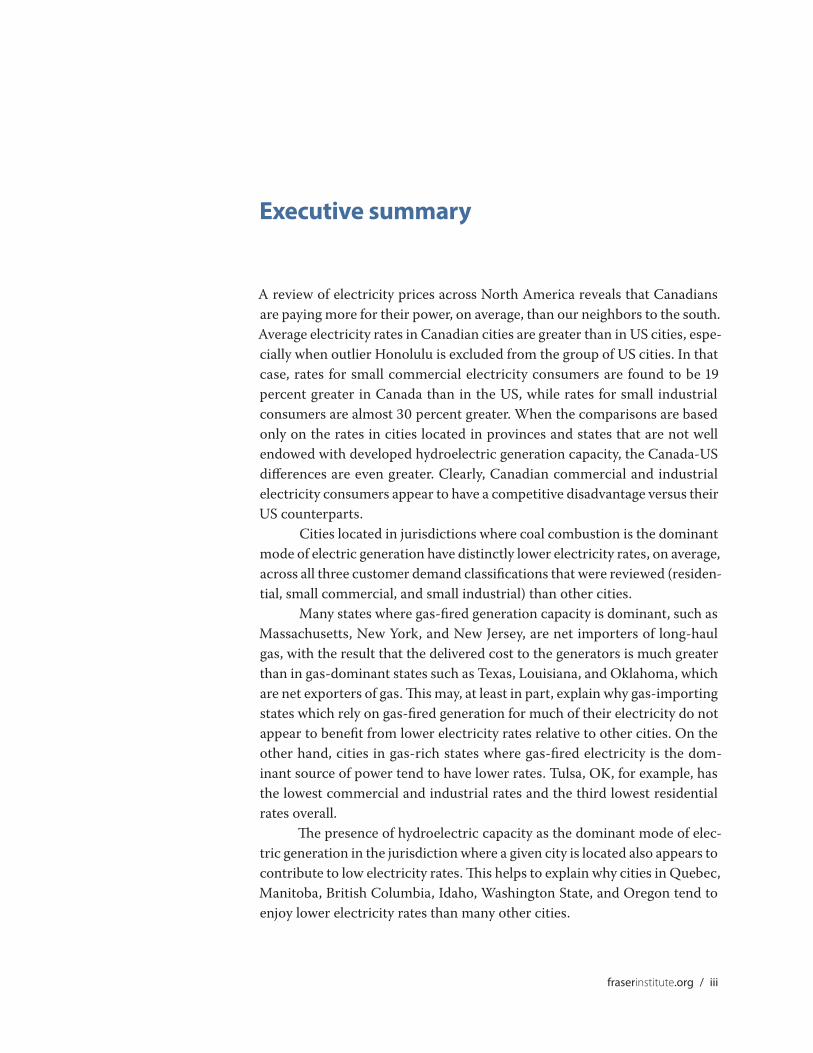
Executive summary
A review of electricity prices across North America reveals that Canadians are paying more for their power, on average, than our neighbors to the south. Average electricity rates in Canadian cities are greater than in US cities, espe-cially when outlier Honolulu is excluded from the group of US cities. In that case, rates for small commercial electricity consumers are found to be 19 percent greater in Canada than in the US, while rates for small industrial consumers are almost 30 percent greater. When the comparisons are based only on the rates in cities located in provinces and states that are not well endowed with developed hydroelectric generation capacity, the Canada-US differences are even greater. Clearly, Canadian commercial and industrial electricity consumers appear to have a competitive disadvantage versus their US counterparts.
Cities located in jurisdictions where coal combustion is the dominant mode of electric generation have distinctly lower electricity rates, on average, across all three customer demand classifications that were reviewed (residen-tial, small commercial, and small industrial) than other cities.
Many states where gas-fired generation capacity is dominant, such as Massachusetts, New York, and New Jersey, are net importers of long-haul gas, with the result that the delivered cost to the generators is much greater than in gas-dominant states such as Texas, Louisiana, and Oklahoma, which are net exporters of gas. This may, at least in part, explain why gas-importing states which rely on gas-fired generation for much of their electricity do not appear to benefit from lower electricity rates relative to other cities. On the other hand, cities in gas-rich states where gas-fired electricity is the dom-inant source of power tend to have lower rates. Tulsa, OK, for example, has the lowest commercial and industrial rates and the third lowest residential rates overall.
The presence of hydroelectric capacity as the dominant mode of elec-tric generation in the jurisdiction where a given city is located also appears to contribute to low electricity rates. This helps to explain why cities in Quebec, Manitoba, British Columbia, Idaho, Washington State, and Oregon tend to enjoy lower electricity rates than many other cities.
iv / Electricity rates in the US and Canada
fraserinstitute.org
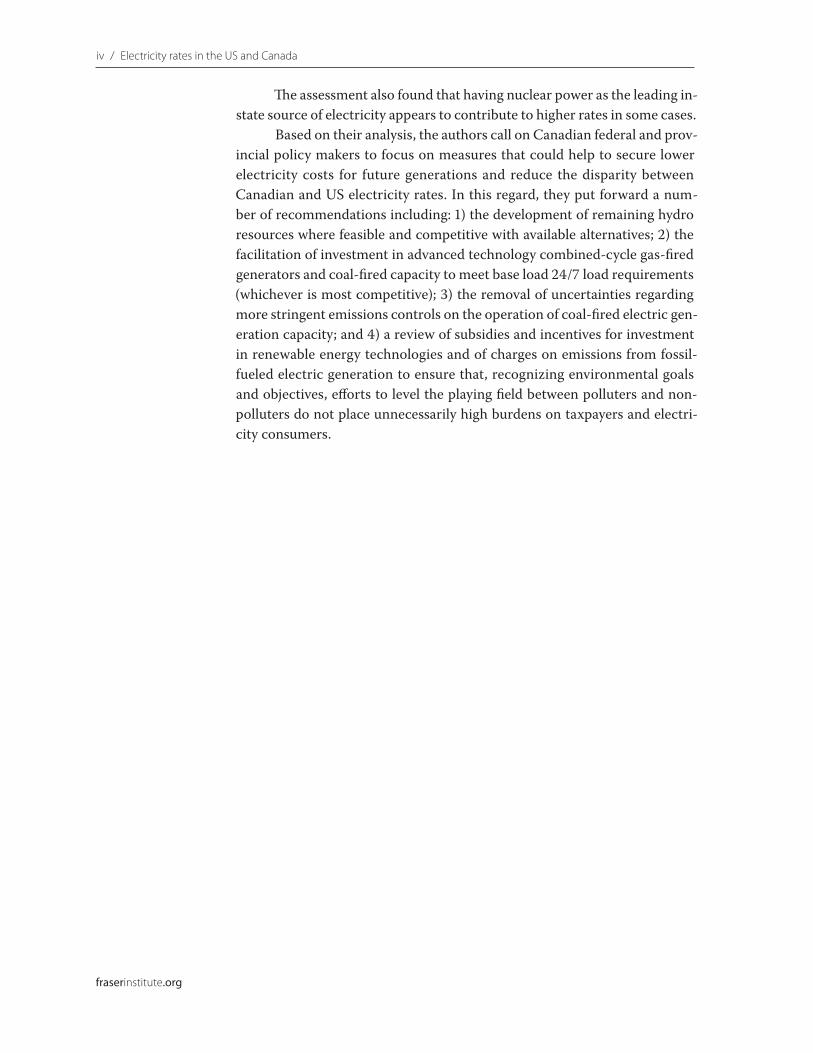
The assessment also found that having nuclear power as the leading in-state source of electricity appears to contribute to higher rates in some cases.
Based on their analysis, the authors call on Canadian federal and prov-incial policy makers to focus on measures that could help to secure lower electricity costs for future generations and reduce the disparity between Canadian and US electricity rates. In this regard, they put forward a num-ber of recommendations including: 1) the development of remaining hydro resources where feasible and competitive with available alternatives; 2) the facilitation of investment in advanced technology combined-cycle gas-fired generators and coal-fired capacity to meet base load 24/7 load requirements (whichever is most competitive); 3) the removal of uncertainties regarding more stringent emissions controls on the operation of coal-fired electric gen-eration capacity; and 4) a review of subsidies and incentives for investment in renewable energy technologies and of charges on emissions from fossil-fueled electric generation to ensure that, recognizing environmental goals and objectives, efforts to level the playing field between polluters and non-polluters do not place unnecessarily high burdens on taxpayers and electri-city consumers.

fraserinstitute.org / 1
Introduction
This study compares retail electricity rates or prices in selected Canadian and American cities. Possible reasons for the apparent differences in rates, such as the major source of electricity produced in the province, state or district where each city is located, are examined. In addition, rates in the group of Canadian cities are compared with rates in the group of US cities. Finally, policy recommendations are put forward that are intended to promote the interests of Canadian electricity consumers by lessening their disadvantage relative to their American counterparts.
Note that the study is focused only on the rates that various types of consumers are charged for electrical energy in the various cities. The cost of the electrical energy (electricity) that is consumed by typical consumers in each city, as would be calculated by multiplying the units of energy consumed by the applicable rate(s), is not compared. Moreover, the total or delivered cost of electricity that consumers face according to the volume of energy which they consume, including transmission and distribution charges, is not addressed.

2 / fraserinstitute.org
The basis of the rates comparison
The study relies on two major annual surveys of electricity rates. The first, undertaken by Hydro-Quebec, provides electricity prices or rates on custom-ers’ bills as at April 1, 2013 in terms of cents per kilowatt-hour (kWh), based on information received from or pertaining to electric distribution utilities in 12 Canadian and 10 US cities (Hydro-Quebec, 2013). The Canadian centers included are St. John’s, Halifax, Charlottetown, Moncton, Montreal, Ottawa, Toronto, Winnipeg, Regina, Edmonton, Calgary, and Vancouver. The US cities included in the Hydro-Quebec survey are Boston, New York, Miami, Detroit, Nashville, Chicago, Houston, Seattle, Portland OR, and San Francisco.
The second information source for electricity rates is the National Electric Rate Survey, undertaken by the Lincoln Electric System of Lincoln, Nebraska, which reports rates effective as of January 1, 2013 for 106 US cities in terms of US dollars. The Edison Electric Institute’s Typical Winter Bills report provided the information reported in the Lincoln Electric System Survey for the majority of the investor-owned utilities. Bills for the other investor-owned utilities and for municipality-owned utilities were surveyed by the Lincoln Electric System, which used the information collected to calculate typical bills using average rates from a 12-month period to capture seasonal rates.
Both surveys were focused on the cost of electrical energy on cus-tomer bills pertaining to specified levels of consumption, including applicable rate riders but excluding the cost of transmission and distribution (transpor-tation and delivery). The Hydro-Quebec survey provides rate information both with and without the sales and other taxes that are levied on electricity prices in the various cities. However, the Lincoln Electric System Survey only provides rate information exclusive of any taxes that are levied on them. For cities where consumers have the right to choose between purchasing their electricity requirements from a marketer at a contractually agreed price or from the distributor at a regulated price option, as in Alberta, Ontario, Massachusetts, or Texas, Hydro-Quebec used the regulated price whereas the Lincoln Electric System survey calculated “average” prices for each city.1
1. Where consumers have the option of choosing between a regulated rate or purchasing electricity from a marketer, wholesale markets have been deregulated and the regulated rates are therefore a function of market conditions. Nevertheless, if there are significant

Electricity rates in the US and Canada / 3
fraserinstitute.org
Hydro-Quebec’s rate information was used for all 10 US cities included in their survey, nine of which (all but Houston) are also included in the Lincoln Electric System survey. In total, information was available for 119 distinct loca-tions: the 22 Canadian and US cities in the Hydro-Quebec survey, and the 97 US cities in the Lincoln Electric System survey that are not included in Hydro-Quebec’s survey.
Rates offered by some utilities vary depending on the season and/or time of day when energy is consumed. In the United States, for example, a number of utilities set a higher price in summer, when demand for air-condi-tioning is stronger. In Quebec, on the other hand, demand increases in winter because of heating requirements. Since, for some utilities, April 1 (the date used for the rates comparison in the Hydro-Quebec survey) may fall within a period in the year when the rate is relatively high, whereas for others it may fall in a period when the rate is relatively low, Hydro-Quebec calculated an annual average rate in the case of utilities whose rates vary according to sea-son or time of day.2
The issue of changing rates according to season and/or time of day is handled in a similar manner in the Lincoln Electric System survey. In that sur-vey, the rates indicated to be effective as of January 1, 2013 are average rates estimated for 2013 as a whole. This incorporates the effects of both summer and winter rates and also time-of-use rate changes.
In order to compare the prices in the two surveys, data in terms of US cents per kilowatt-hour in the Lincoln Electric System survey was converted to Canadian cents per kilowatt-hour using the noon Bank of Canada US-to-Canadian dollar exchange rate on January 2, 2013. At that point in time the Canadian dollar was worth about US$ 1.01.3
differences, on average, between marketers’ contractual rates and regulated rates (with the former being greater) the different approaches taken in the two surveys could bias the comparison of Canada-US rates.2. In the case of utilities whose supply costs are determined by the market (as in Alberta, Texas, and other jurisdictions where wholesale electricity markets have been developed to allow prices to be determined through the interaction of electricity supply offers and bids to purchase), Hydro Quebec used average prices for the month of March 2013.3. From January 2, 2013 until mid-January 2014, the value of the Canadian dollar depreci-ated by about 10 percent against the US dollar. When the results of the two 2014 surveys become available for comparison, other things equal the stronger value of the US dollar in January 2014 than a year earlier will result in the rates tabulated by the Lincoln Electric System survey for US cities being considerably higher than in 2013 when expressed in Canadian dollar terms. This will imply that the discrepancy between US and Canadian electric rates in favor of the US identified in the current study has narrowed or perhaps even shifted to such an extent that, on average, Canadian rates will appear more favor-able than US rates. To ensure consistency in annual comparisons of Canadian and US electric rates going forward, in spite of inevitable exchange rate fluctuations, it would

4 / Electricity rates in the US and Canada
fraserinstitute.org
In order to link price information for cities in the Lincoln Electric System report to that provided in the Hydro-Quebec survey, price data in terms of Canadian cents per kilowatt-hour were compared for each of the nine US cities that were included in both surveys, and the average percent-age differences calculated. In general, this indicated that the rates for those nine cities published in the Lincoln Electric System’s National Rate Survey were a bit greater than those indicated by Hydro-Quebec.4 For this reason, the price data for the other 97 US centers included in the Lincoln Electric System survey was adjusted accordingly.
Both surveys provided price comparisons for an array of different elec-tricity demand levels and consumption volumes. Many of these were not the same and, therefore, not comparable. Fortunately, it was possible to link and compare rates from the two surveys for the following three categories:
• Residential service at the 1,000 kWh per month consumption level;
• Rates applicable to small commercial power demand at the 40 kW level with monthly electricity consumption of 10,000 kWh (35 percent load factor);
• Rates applicable to small industrial sector demand at the 1,000 kW level with monthly consumption of 400,000 kWh (56 percent load factor).
be necessary to hold the value of the Canadian dollar constant in terms its US counter-part. There are several ways of doing this. One would be to continue to use the exchange rate as observed on January 2, 2013. A more logical option, perhaps, would be to revise the 2013 comparison and undertake similar comparisons in future years using the aver-age exchange rate during a selected historical period such as, for example, from 1983 to 2013. One could also select an exchange rate based on a study (or studies) of the purchas-ing power parity of the Canadian dollar. But because the perception of the exchange rate that would give Canadians the same purchasing power as Americans will change with time, the exchange rate that is adopted for this purpose would need to be reviewed and adjusted from time to time.4. This is most likely because the Lincoln Electric System survey results reflect the effects of summer rates which, in most US centers, are higher than in the winter or spring because load peaks during the hot summer months as a consequence of cooling require-ments. For the nine US cities included in both surveys, in the case of residential service at the rate of 1,000 kWh per month, the prices in the Lincoln Electric System survey aver-aged one percent higher than in the Hydro-Quebec survey. For the small commercial load category the difference was only 0.2 percent. However, for small industrial consumption at the 400,000 kWh per month level, the difference averaged almost 4.4 percent, with the largest differences apparent in Chicago and New York.

fraserinstitute.org / 5
How the rates compare
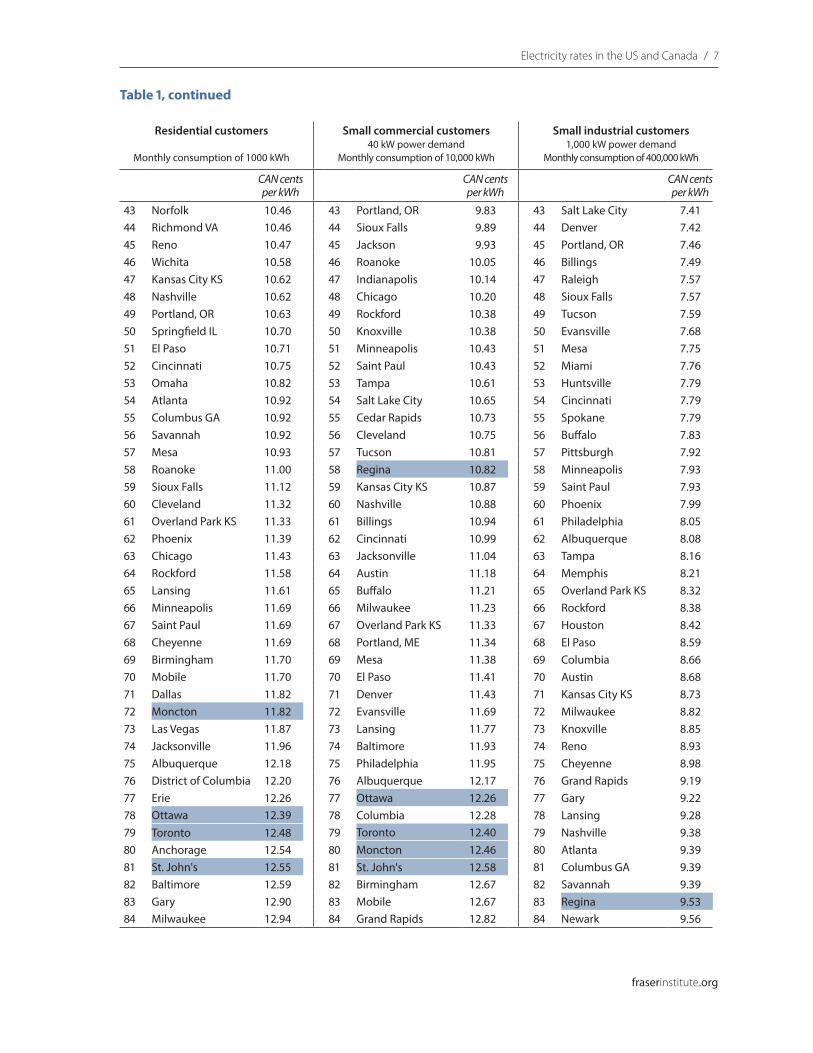
Table 1 shows how electricity rates for the three types of customers in the 119 jurisdictions compare. The 12 Canadian cities are highlighted. The arithmetic means for each rate class and the standard deviation are indicated at the bot-tom of the table. Because the Hydro-Quebec survey provides rates both with and without taxes, while the Lincoln Electric System survey only provides rate information without taxes included, the comparison of rates in the 119 cites that is presented here, and throughout most of the following analysis and discussion, is without regard to taxes.5
1. Residential rates
The arithmetic average residential rate over all 119 jurisdictions is 12.08 cents per kWh. As indicated by table 1, several cities have much lower rates than this, while others have much higher rates. Only four Canadian cities (Montreal, Winnipeg, Vancouver, and Moncton) have lower rates than the average. The difference between the lowest rate (4.92 cents per kWh in Lincoln, NE) and the rates in the two cities with the highest rates (Honolulu at 32.36 cents and San Francisco at 22.93 cents) is vast. The Honolulu rate, for example, is more than 6.5 times the Lincoln Electric System rate.6
20 cities’ rates vary by more than one standard deviation (3.70 cents per kWh) from the mean and the overall distribution is skewed. At the lower end, eight cities’ rates are more than one standard deviation less than the average rate, and top-ranked Lincoln’s rate for the indicated residential class is almost two standard deviations less. At the upper end of the range, 12 cit-ies have rates greater than a single standard deviation from the mean. Outlier Honolulu’s rate is nearly 5.5 standard deviations above the average rate, while rates in New York, San Diego, and San Francisco are almost three standard deviations greater.
5. A comparison of rates with and without taxes included, based on the information provided with respect to the 22 cities covered in the Hydro-Quebec survey, is provided in a separate section.6. This reflects the fact that Honolulu depends, for the most part, on oil combustion to meet its electricity commitments.

6 / Electricity rates in the US and Canada
fraserinstitute.org
Table 1: Electricity rate comparisons (energy only), 2013
Residential customers
Monthly consumption of 1000 kWh
Small commercial customers 40 kW power demand
Monthly consumption of 10,000 kWh
Small industrial customers 1,000 kW power demand
Monthly consumption of 400,000 kWh
CAN cents per kWh
CAN cents per kWh
CAN cents per kWh
1 Lincoln 4.92 1 Tulsa 6.23 1 Tulsa 4.012 Montreal 6.87 2 Boise 6.27 2 Des Moines 4.913 Tulsa 7.11 3 Spokane 7.04 3 Boise 4.944 Tacoma 7.48 4 Tacoma 7.27 4 Tacoma 4.995 Winnipeg 7.63 5 Seattle 7.28 5 Las Vegas 5.366 Spokane 7.74 6 Winnipeg 7.48 6 Oklahoma City 5.387 Baton Rouge 7.92 7 Lincoln 7.49 7 Davenport 5.578 Springfield MO 8.33 8 Baton Rouge 7.53 8 Lexington 5.679 Lexington 8.50 9 Las Vegas 7.69 9 Winnipeg 5.7610 Boise 8.64 10 Reno 7.89 10 Baton Rouge 5.8411 Fargo 8.87 11 Des Moines 8.04 11 St. Louis 6.0512 Vancouver 8.91 12 Colorado Springs 8.09 12 Louisville 6.0913 Oklahoma City 8.93 13 Eugene 8.14 13 Seattle 6.2114 Huntsville 8.94 14 Oklahoma City 8.23 14 Eugene 6.2115 Seattle 8.97 15 St. Louis 8.26 15 Chicago 6.2716 St. Louis 9.03 16 Omaha 8.28 16 Charlotte 6.2917 Davenport 9.08 17 Davenport 8.47 17 Greensboro 6.2918 Shreveport 9.17 18 Shreveport 8.51 18 Cleveland 6.4719 Tucson 9.18 19 Wichita 8.56 19 Springfield MO 6.4920 Louisville 9.20 20 Little Rock 8.59 20 Omaha 6.5321 Des Moines 9.22 21 Raleigh 8.66 21 Jackson 6.5522 Eugene 9.22 22 Charlotte 8.67 22 Lincoln 6.5623 Jackson 9.33 23 Greensboro 8.67 23 Norfolk 6.6324 Memphis 9.33 24 Springfield MO 8.86 24 Richmond VA 6.6325 Wheeling W.VA 9.45 25 Pittsburgh 8.87 25 Mobile 6.8226 Miami 9.46 26 Lexington 8.88 26 Birmingham 6.8527 Indianapolis 9.58 27 Fargo 9.03 27 Colorado Springs 6.8728 New Orleans 9.64 28 Montreal 9.05 28 Little Rock 6.8829 Duluth 9.66 29 Dallas 9.10 29 Fargo 6.9330 Austin 9.75 30 Houston 9.18 30 Wichita 6.9931 Kansas City MO 9.89 31 Louisville 9.30 31 Shreveport 6.9932 Billings 9.89 32 Wheeling W.VA 9.36 32 Wheeling W.VA 7.0433 Knoxville 10.00 33 Huntsville 9.41 33 Cedar Rapids 7.0634 Little Rock 10.01 34 Kansas City MO 9.41 34 Dallas 7.0935 Tampa 10.01 35 New Orleans 9.46 35 Duluth 7.1736 Charlotte 10.05 36 Erie 9.48 36 Vancouver 7.2337 Greensboro 10.05 37 Norfolk 9.57 37 Indianapolis 7.3038 Houston 10.10 38 Richmond VA 9.57 38 Kansas City MO 7.3339 Denver 10.14 39 Vancouver 9.60 39 Roanoke 7.3840 Raleigh 10.16 40 Duluth 9.60 40 Montreal 7.3841 Salt Lake City 10.27 41 Miami 9.74 41 New Orleans 7.4042 Colorado Springs 10.39 42 Memphis 9.80 42 Erie 7.40
Electricity rates in the US and Canada / 7
fraserinstitute.org
Table 1, continued
Residential customers
Monthly consumption of 1000 kWh
Small commercial customers 40 kW power demand
Monthly consumption of 10,000 kWh
Small industrial customers 1,000 kW power demand
Monthly consumption of 400,000 kWh
CAN cents per kWh
CAN cents per kWh
CAN cents per kWh
43 Norfolk 10.46 43 Portland, OR 9.83 43 Salt Lake City 7.4144 Richmond VA 10.46 44 Sioux Falls 9.89 44 Denver 7.4245 Reno 10.47 45 Jackson 9.93 45 Portland, OR 7.4646 Wichita 10.58 46 Roanoke 10.05 46 Billings 7.4947 Kansas City KS 10.62 47 Indianapolis 10.14 47 Raleigh 7.5748 Nashville 10.62 48 Chicago 10.20 48 Sioux Falls 7.5749 Portland, OR 10.63 49 Rockford 10.38 49 Tucson 7.5950 Springfield IL 10.70 50 Knoxville 10.38 50 Evansville 7.6851 El Paso 10.71 51 Minneapolis 10.43 51 Mesa 7.7552 Cincinnati 10.75 52 Saint Paul 10.43 52 Miami 7.7653 Omaha 10.82 53 Tampa 10.61 53 Huntsville 7.7954 Atlanta 10.92 54 Salt Lake City 10.65 54 Cincinnati 7.7955 Columbus GA 10.92 55 Cedar Rapids 10.73 55 Spokane 7.7956 Savannah 10.92 56 Cleveland 10.75 56 Buffalo 7.8357 Mesa 10.93 57 Tucson 10.81 57 Pittsburgh 7.9258 Roanoke 11.00 58 Regina 10.82 58 Minneapolis 7.9359 Sioux Falls 11.12 59 Kansas City KS 10.87 59 Saint Paul 7.9360 Cleveland 11.32 60 Nashville 10.88 60 Phoenix 7.9961 Overland Park KS 11.33 61 Billings 10.94 61 Philadelphia 8.0562 Phoenix 11.39 62 Cincinnati 10.99 62 Albuquerque 8.0863 Chicago 11.43 63 Jacksonville 11.04 63 Tampa 8.1664 Rockford 11.58 64 Austin 11.18 64 Memphis 8.2165 Lansing 11.61 65 Buffalo 11.21 65 Overland Park KS 8.3266 Minneapolis 11.69 66 Milwaukee 11.23 66 Rockford 8.3867 Saint Paul 11.69 67 Overland Park KS 11.33 67 Houston 8.4268 Cheyenne 11.69 68 Portland, ME 11.34 68 El Paso 8.5969 Birmingham 11.70 69 Mesa 11.38 69 Columbia 8.6670 Mobile 11.70 70 El Paso 11.41 70 Austin 8.6871 Dallas 11.82 71 Denver 11.43 71 Kansas City KS 8.7372 Moncton 11.82 72 Evansville 11.69 72 Milwaukee 8.8273 Las Vegas 11.87 73 Lansing 11.77 73 Knoxville 8.8574 Jacksonville 11.96 74 Baltimore 11.93 74 Reno 8.9375 Albuquerque 12.18 75 Philadelphia 11.95 75 Cheyenne 8.9876 District of Columbia 12.20 76 Albuquerque 12.17 76 Grand Rapids 9.1977 Erie 12.26 77 Ottawa 12.26 77 Gary 9.2278 Ottawa 12.39 78 Columbia 12.28 78 Lansing 9.2879 Toronto 12.48 79 Toronto 12.40 79 Nashville 9.3880 Anchorage 12.54 80 Moncton 12.46 80 Atlanta 9.3981 St. John's 12.55 81 St. John's 12.58 81 Columbus GA 9.3982 Baltimore 12.59 82 Birmingham 12.67 82 Savannah 9.3983 Gary 12.90 83 Mobile 12.67 83 Regina 9.5384 Milwaukee 12.94 84 Grand Rapids 12.82 84 Newark 9.56

8 / Electricity rates in the US and Canada
fraserinstitute.org
Table 1, continued
Residential customers
Monthly consumption of 1000 kWh
Small commercial customers 40 kW power demand
Monthly consumption of 10,000 kWh
Small industrial customers 1,000 kW power demand
Monthly consumption of 400,000 kWh
CAN cents per kWh
CAN cents per kWh
CAN cents per kWh
85 Regina 13.15 85 Detroit 12.91 85 Patterson 9.5686 Cedar Rapids 13.20 86 Gary 13.00 86 Columbus OH 9.6587 Grand Rapids 13.28 87 Anchorage 13.13 87 St. John's 9.8288 Columbus OH 13.35 88 Springfield IL 13.17 88 Jacksonville 9.8389 Columbia 13.44 89 Edmonton 13.25 89 Portland, ME 9.8490 Edmonton 13.90 90 Cheyenne 13.33 90 Detroit 10.0091 Wilmington 13.95 91 Atlanta 13.34 91 Madison 10.0092 Portland, ME 13.96 92 Columbus GA 13.34 92 Anchorage 10.2793 Buffalo 14.00 93 Savannah 13.34 93 District of Columbia 10.2994 Los Angeles 14.27 94 Madison 13.41 94 Baltimore 10.4395 Pawtucket 14.43 95 District of Columbia 13.50 95 Ottawa 10.5996 Cambridge 14.74 96 Columbus OH 13.61 96 Springfield IL 10.6097 Calgary 14.81 97 Los Angeles 13.77 97 Pueblo 10.8598 Charlottetown 14.87 98 Phoenix 13.80 98 Los Angeles 10.9499 Evansville 14.92 99 Pueblo 13.92 99 Moncton 10.98100 Madison 15.08 100 Cambridge 14.27 100 Cambridge 11.15101 Waterbury 15.15 101 Wilmington 14.38 101 Wilmington 11.29102 Philadelphia 15.21 102 Halifax 14.85 102 Toronto 11.85103 Pittsburgh 15.26 103 Pawtucket 15.54 103 Pawtucket 12.35104 Halifax 15.45 104 Charlottetown 15.54 104 Waterbury 12.38105 Pueblo 15.45 105 Springfield MA 15.78 105 Halifax 12.44106 Detroit 15.54 106 Waterbury 15.79 106 Manchester 12.71107 Burlington 15.59 107 Newark 15.86 107 Charlottetown 12.87108 Springfield MA 16.31 108 Patterson 15.86 108 Burlington 13.26109 Manchester 16.44 109 Manchester 16.22 109 San Diego 13.36110 Boston 16.50 110 Bridgeport 16.27 110 Springfield MA 14.04111 Newark 16.56 111 New Haven 16.27 111 San Francisco 14.09112 Patterson 16.56 112 Calgary 16.93 112 Bridgeport 14.11113 Bridgeport 19.27 113 Burlington 17.29 113 New Haven 14.11114 New Haven 19.27 114 Boston 17.57 114 Boston 14.15115 Hempstead 20.61 115 San Francisco 17.79 115 Calgary 15.27116 New York 21.75 116 Hampstead 18.46 116 New York 15.58117 San Diego 22.40 117 San Diego 18.47 117 Hampstead 15.95118 San Francisco 22.93 118 New York 19.70 118 Edmonton 17.92119 Honolulu 32.36 119 Honolulu 31.05 119 Honolulu 28.25
Arithmetic mean 12.08 Arithmetic mean 11.55 Arithmetic mean 8.92Standard deviation 3.70 Standard deviation 3.42 Standard deviation 3.19
Note: Cities above the red lines have prices that are at least one standard deviation less than the average price; cities below the black lines have prices that are at least one standard deviation greater than the average price.
Sources: Hydro-Quebec (2013); Lincoln Nebraska Electric System (2013); calculations by authors.

Electricity rates in the US and Canada / 9
fraserinstitute.org
Table 2 illustrates how the residential rates for the 12 Canadian cities alone compare, according to the Hydro-Quebec survey. The average resi-dential rate in these cities, at 12.07 cents per kWh, is virtually the same as for all 119 cities. The four Canadian cities with the lowest rates are second ranked Montreal, 5th ranked Winnipeg, 12th ranked Vancouver, and 72nd place Moncton. Those with the highest rates are 104th ranked Halifax, 98th ranked Charlottetown, 97th ranked Calgary and 90th place Edmonton.7 The rates in both Montreal and Winnipeg are more than one standard deviation less than the average residential rate for all cities. No Canadian city has residential rates more than one standard deviation greater than the average rate for all cities.
2. Small commercial consumer rates
The average small commercial rate for the 119 cities is 11.55 cents per kWh, only slightly less than that for the residential customer rate class. As with residential rates, several cities have rates that are much lower than this, while
7. These findings with respect to Canada are corroborated by the survey of Canadian cities’ electricity rates undertaken by Manitoba Hydro with regard to rates applicable to this class of customers as of May 1, 2013 (Manitoba Hydro, 2013). While some minor dif-ferences were indicated in the case of Toronto, Winnipeg, Edmonton, and Calgary, the overall findings are closely similar.
Table 2: Comparison of residential electricity rates in Canadian cities, 2013
Rates for residential customers(Monthly consumption of 1000 kWh)
CAN cents per kWh
1 Montreal 6.87
2 Winnipeg 7.63
3 Vancouver 8.91
4 Moncton 11.82
5 Ottawa 12.39
6 Toronto 12.48
7 St. John's 12.55
8 Regina 13.15
9 Edmonton 13.90
10 Calgary 14.81
11 Charlottetown 14.87
12 Halifax 15.45
Arithmetic mean 12.07
Sources: Hydro-Quebec (2013); calculations by authors.

10 / Electricity rates in the US and Canada
fraserinstitute.org
others have much higher rates. Again the spread between the rate in the city with the lowest rate (Tulsa at 6.23 cents per kWh) and the two cities with the highest rates, Honolulu at 31.05 cents per kWh and New York at 19.70 cents, is vast. 29 of the 119 cities have rates that are either one standard deviation less or greater than the mean.
At the lower end of the scale, where 12 cities’ rates are more than a single standard deviation (3.42 cents per kWh) less than the average rate for all 119 cities, top-ranked Tulsa and second place Boise both have rates about 1.5 times the standard deviation less than the mean. The rates of the 10 other cities in this group vary much less from the average.
At the upper end, 17 cities’ rates are more than one standard deviation greater than the mean. As with the residential rates, those cities with rates with the greatest differentials from the mean are outlier Honolulu (5.7 stan-dard deviations) and several New York State and California cities. New York City’s rate for this commercial customer class, for example, is about 2.4 stan-dard deviations greater than the average rate for all 119 cities and the rates in San Diego and Hampstead, NY are about two standard deviations greater.
Only four of the 12 Canadian cities included have rates for this class of customer that are less than the average for all 119 cities: Winnipeg, Montreal, Vancouver, and Regina. Table 3 shows how the rates compare among just the 12 Canadian cities surveyed by Hydro-Quebec.
Table 3: Comparison of commercial electricity rates in Canadian cities, 2013
Rates for commercial customersMonthly consumption of 10,000 kWh
CAN cents per kWh
1 Winnipeg 7.48
2 Montreal 9.05
3 Vancouver 9.60
4 Regina 10.82
5 Ottawa 12.26
6 Toronto 12.40
7 Moncton 12.46
8 St. John's 12.58
9 Edmonton 13.25
10 Halifax 14.85
11 Charlottetown 15.54
12 Calgary 16.93
Arithmetic mean 12.27
Sources: Hydro-Quebec (2013); calculations by authors.

Electricity rates in the US and Canada / 11
fraserinstitute.org
At 12.27 cents per kWh the average rate is 0.72 cents per kWh higher than the average for all 119 cities. Winnipeg, Montreal, Vancouver, Regina, and Ottawa have lower rates than the Canadian average but, except for Winnipeg, the rates in all five locations are considerably above the average rate of 6.82 cents per kWh in the five cities (of 119) with the lowest rates. Seven cities have higher rates than the Canadian average with Calgary, Charlottetown, Halifax, and Edmonton standing out as the least desirable. All four locations are among the group of 21 (of 119) having the highest rates.
Only one Canadian city, Winnipeg, has a commercial customer class rate which is more than one standard deviation less than the average for all 119 cities. At the upper end of the scale, the rates for two cities—Charlottetown and Calgary—are more than a single standard deviation greater than the mean rate.
3. Small industrial consumer rates
As indicated in table 1, the average rate for the small industrial electricity customer class (demand of 1,000 kW with monthly consumption of 400,000 kWh) in the 119 cities surveyed is 8.92 cents per kWh. This is considerably less than the vicinity of 12 cents per kWh observed in the case of the two other rate classes compared. This most likely reflects strategic decisions on the part of governments and regulators to assign lower rates to large volume customers because of economic development considerations and strategies. Only three of the 12 Canadian jurisdictions have rates applicable to this cus-tomer class that are less than the overall average: Winnipeg, Vancouver, and Montreal. Reasons why those cities fare better when it comes to electricity rates than their Canadian peers are examined in the following sections.
While the average rate for this customer class is significantly less than those for the two other classes examined, the differential between the low-est rate (a remarkable 4.01 cents per kWh in Tulsa) and the highest rate (Honolulu at 28.25 cents per kWh) is about as large as in the other cases. Consequently, the standard deviation (3.19 cents per kWh) is only 23 cents per kWh less than that for the small commercial customer class.
Eight cities have rates that are greater than a single standard deviation less than the average rate for all 119 cities. Top-ranked Tulsa’s rate is about 1.5 standard deviations less than the mean, while second place Boise’s rate is about 1.3 standard deviations lower.
At the upper end of the range, where 17 cities’ rates are more than a single standard deviation greater than the mean, there are some large dif-ferentials compared with the average. Honolulu is an even greater outlier than in the two other customer classes examined, with a rate more than six standard deviations above the mean. Edmonton’s rate is about 2.8 standard

12 / Electricity rates in the US and Canada
fraserinstitute.org
deviations greater than the average and New York’s is about two standard deviations greater. The rates for Hampstead, NY and Calgary are also about two standard deviations above the mean. The differences between the small industrial class rates for each of the 12 other cities in this group of 17 and the average rate fall between 1 and 1.6 standard deviations.
Table 4 illustrates the rates for the 12 Canadian cities alone. Their aver-age rate of 10.97 cents per kWh is 2.05 cents per kWh greater than for all 119 cities ranked. Six Canadian cities have rates lower than the Canadian aver-age. The highest Canadian rates are in 118th ranked (of 119) Edmonton, 115th ranked Calgary, 107th ranked Charlottetown and 105th place Halifax.
Of interest is the fact that not a single Canadian city is represented in the group of eight cities whose rates for this customer class are more than one standard deviation less than the average for all 119 cities compared. On the other hand, four of the 12 Canadian cities have rates that are more than a single standard deviation above the mean.
Table 4: Comparison of industrial electricity rates in Canadian cities, 2013
Rates for industrial customersMonthly consumption of 400,000 kWh
CAN cents per kWh
1 Winnipeg 5.76
2 Vancouver 7.23
3 Montreal 7.38
4 Regina 9.53
5 St. John's 9.82
6 Ottawa 10.59
7 Moncton 10.98
8 Toronto 11.85
9 Halifax 12.44
10 Charlottetown 12.87
11 Calgary 15.27
12 Edmonton 17.92
Arithmetic mean 10.97
Sources: Hydro-Quebec (2013); calculations by authors.

fraserinstitute.org / 13
Reasons for the differences in rates
In this section we discuss a number of possible reasons why electricity rates are higher or lower in some cities than others. Ideally, multivariate statistical analysis—which would simultaneously determine the contribution of each factor to electricity prices while taking other factors into account—would have been helpful. However, where appropriate, reference is made to the results of statistical tests undertaken to determine whether the differences in the arithmetic means of rates between two groups such as cities in coal-intensive states/provinces, on the one hand, and in non-coal intensive juris-dictions, on the other, are “significant.” That is, the tests indicate whether the difference in the means is the result of random occurrences or survey sampling errors, thereby implying that there is no fundamental difference between the two data sets, or a consequence of fundamental factors such as the availability of relatively low-cost coal-fired electric generation in one group of cities but not in the other.8
1. Differences between customer classes
The ranking of cities according to their electricity rates is essentially the same for each of the three customer classes. However, the rankings do not pre-cisely conform. The fact that there are differences in the rankings accord-ing to customer type reflects the fact that regulators (and politicians) in the various states and provinces have somewhat different perspectives as to the portions of the overall cost of electricity generated in their respective regions that the various kinds of customers (e.g., residential, commercial, and indus-trial) should bear.
8. In order to test whether differences in mean values were statistically significant, P-values and t-values were calculated for the data sets being compared. At the 95 per-cent confidence level, if P-values were found to be less than 0.05, the null hypothesis that the difference was due solely to random factors—i.e., that there was no fundamental dif-ference in the two data sets involved and that they could have come from essentially the same population—was rejected, and it was concluded that the difference was statistic-ally significant.
14 / Electricity rates in the US and Canada
fraserinstitute.org
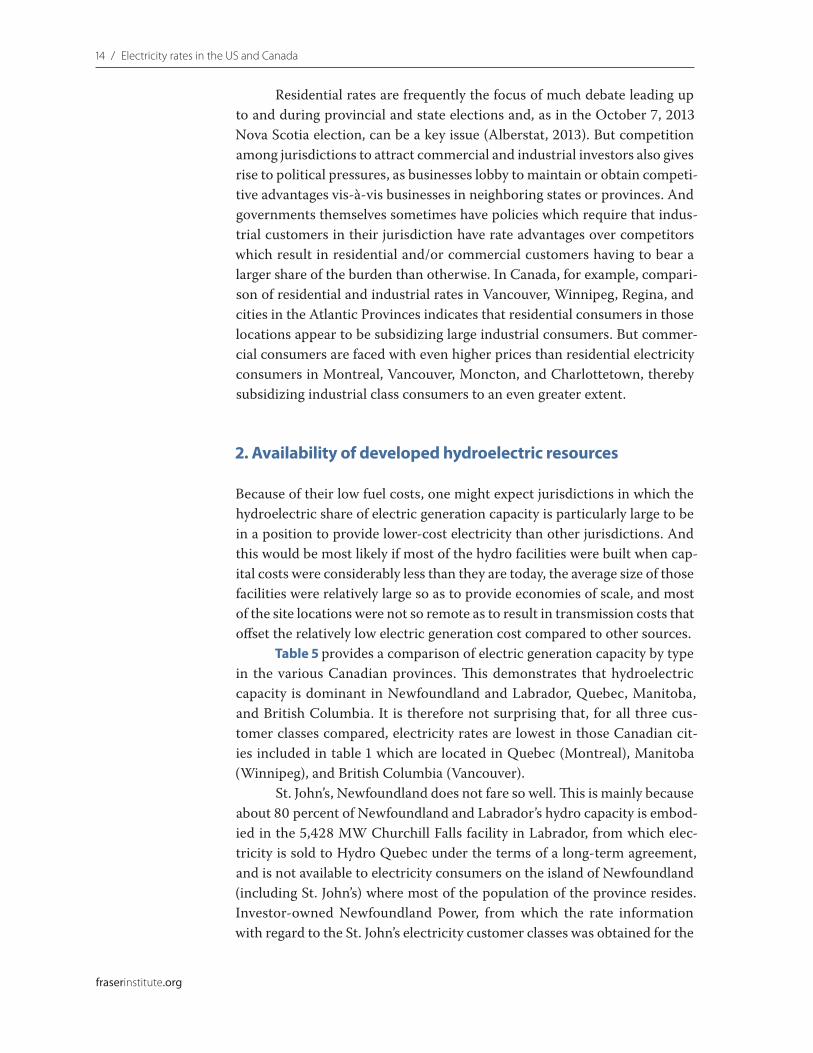
Residential rates are frequently the focus of much debate leading up to and during provincial and state elections and, as in the October 7, 2013 Nova Scotia election, can be a key issue (Alberstat, 2013). But competition among jurisdictions to attract commercial and industrial investors also gives rise to political pressures, as businesses lobby to maintain or obtain competi-tive advantages vis-à-vis businesses in neighboring states or provinces. And governments themselves sometimes have policies which require that indus-trial customers in their jurisdiction have rate advantages over competitors which result in residential and/or commercial customers having to bear a larger share of the burden than otherwise. In Canada, for example, compari-son of residential and industrial rates in Vancouver, Winnipeg, Regina, and cities in the Atlantic Provinces indicates that residential consumers in those locations appear to be subsidizing large industrial consumers. But commer-cial consumers are faced with even higher prices than residential electricity consumers in Montreal, Vancouver, Moncton, and Charlottetown, thereby subsidizing industrial class consumers to an even greater extent.
2. Availability of developed hydroelectric resources
Because of their low fuel costs, one might expect jurisdictions in which the hydroelectric share of electric generation capacity is particularly large to be in a position to provide lower-cost electricity than other jurisdictions. And this would be most likely if most of the hydro facilities were built when cap-ital costs were considerably less than they are today, the average size of those facilities were relatively large so as to provide economies of scale, and most of the site locations were not so remote as to result in transmission costs that offset the relatively low electric generation cost compared to other sources.
Table 5 provides a comparison of electric generation capacity by type in the various Canadian provinces. This demonstrates that hydroelectric capacity is dominant in Newfoundland and Labrador, Quebec, Manitoba, and British Columbia. It is therefore not surprising that, for all three cus-tomer classes compared, electricity rates are lowest in those Canadian cit-ies included in table 1 which are located in Quebec (Montreal), Manitoba (Winnipeg), and British Columbia (Vancouver).
St. John’s, Newfoundland does not fare so well. This is mainly because about 80 percent of Newfoundland and Labrador’s hydro capacity is embod-ied in the 5,428 MW Churchill Falls facility in Labrador, from which elec-tricity is sold to Hydro Quebec under the terms of a long-term agreement, and is not available to electricity consumers on the island of Newfoundland (including St. John’s) where most of the population of the province resides. Investor-owned Newfoundland Power, from which the rate information with regard to the St. John’s electricity customer classes was obtained for the

Electricity rates in the US and Canada / 15
fraserinstitute.org
Table 5: Canadian electric generation capacity by type and province (megawatts and % share of provincial total), 2013
Fossil fuel combustion
Nuclear Hydro Wind Other Total
MW % MW % MW % MW % MW % MW
Newfoundland & Labrador* 585 7.9 0 0.0 6,781 91.4 54 0.7 0 0.0 7,420
Prince Edward Island 117 41.6 0 0.0 0 0.0 164 58.4 0 0.0 281
Nova Scotia 2,006 74.8 0 0.0 376 14.0 281 10.5 20 0.7 2,683
New Brunswick** 2,849 72.1 0 0.0 951 24.1 150 3.8 0 0.0 3,950
Quebec*** 1,822 4.4 675 1.6 38,196 92.0 817 2.0 0 0.0 41,510
Ontario 13,877 38.4 11,990 33.2 8,408 23.3 1,742 4.8 143 0.4 36,160
Manitoba 501 8.9 0 0.0 5,054 89.3 104 1.8 0 0.0 5,659
Saskatchewan 3,177 75.6 0 0.0 856 20.4 171 4.1 0 0.0 4,204
Alberta 10,845 85.9 0 0.0 887 7.0 890 7.1 0 0.0 12,622
British Columbia 1,288 8.5 0 0.0 13,745 90.8 103 0.7 0 0.0 15,136
Notes: * 5,428 MW of the 6781hydro capacity is from the Churchill Falls Facility in Labrador, which is not available to the island of Newfoundland.
** Excludes the 680 MW (gross) Point Lepreau nuclear plant that was returned to service in late 2012.
*** Includes the 675 MW Gentilly II nuclear plant that is being dismantled.
Source: Statistics Canada CANSIM Table 127-0009.
Hydro-Quebec study, purchases 90 percent of its electricity requirements from Crown-owned Newfoundland and Labrador Hydro and generates most of the balance from an array of smaller hydroelectric stations (Newfoundland Power, 2013). Newfoundland and Labrador Hydro itself has nine hydroelectric plants and several fossil fuel combustion generation facilities (Newfoundland and Labrador, 2013). The relatively small hydro facilities on the island of Newfoundland do not benefit from the economies of scale inherent in the large hydro plants in Quebec, Manitoba, Winnipeg, British Columbia, and Labrador’s Churchill Falls.
Although Ontario’s hydroelectric capacity is less than its fossil fuel combustion and nuclear capacity, the fact that it is nevertheless quite sig-nificant (23 percent of total capacity) may help to explain why cities in that province (Ottawa and Toronto) have rates that are less than those of cities in provinces other than hydro-rich Quebec, Manitoba, and British Columbia.
16 / Electricity rates in the US and Canada
fraserinstitute.org
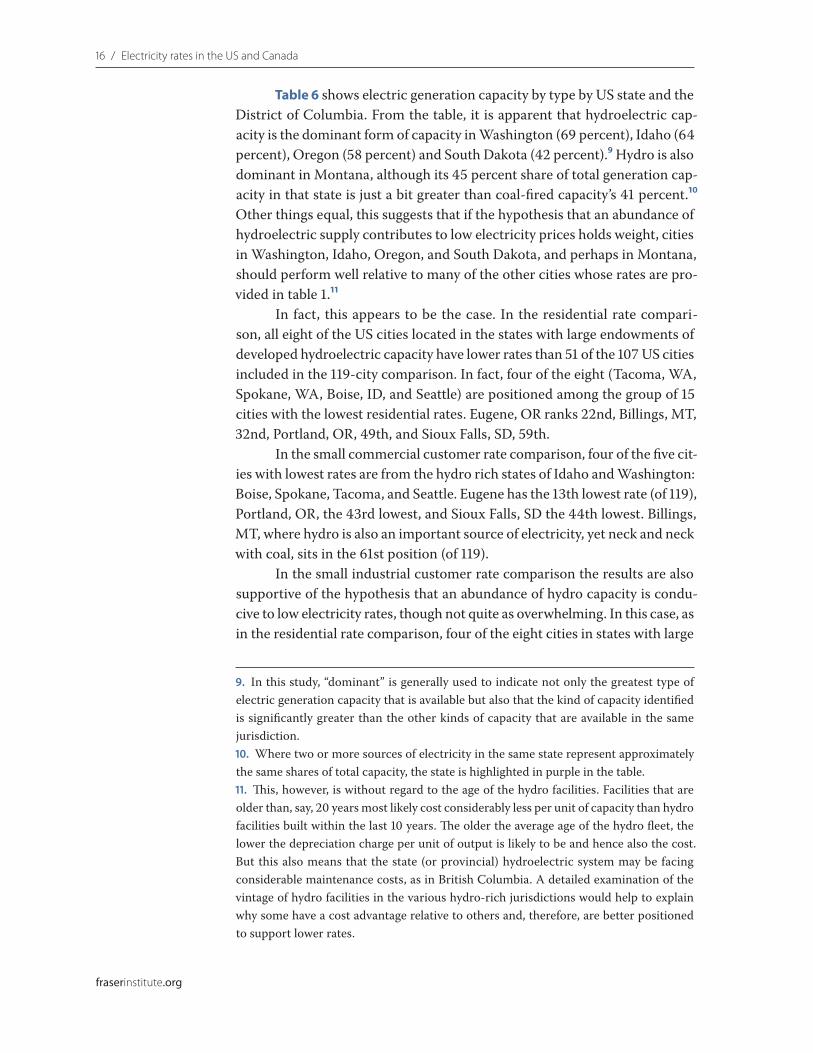
Table 6 shows electric generation capacity by type by US state and the District of Columbia. From the table, it is apparent that hydroelectric cap-acity is the dominant form of capacity in Washington (69 percent), Idaho (64 percent), Oregon (58 percent) and South Dakota (42 percent).9 Hydro is also dominant in Montana, although its 45 percent share of total generation cap-acity in that state is just a bit greater than coal-fired capacity’s 41 percent.10 Other things equal, this suggests that if the hypothesis that an abundance of hydroelectric supply contributes to low electricity prices holds weight, cities in Washington, Idaho, Oregon, and South Dakota, and perhaps in Montana, should perform well relative to many of the other cities whose rates are pro-vided in table 1.11
In fact, this appears to be the case. In the residential rate compari-son, all eight of the US cities located in the states with large endowments of developed hydroelectric capacity have lower rates than 51 of the 107 US cities included in the 119-city comparison. In fact, four of the eight (Tacoma, WA, Spokane, WA, Boise, ID, and Seattle) are positioned among the group of 15 cities with the lowest residential rates. Eugene, OR ranks 22nd, Billings, MT, 32nd, Portland, OR, 49th, and Sioux Falls, SD, 59th.
In the small commercial customer rate comparison, four of the five cit-ies with lowest rates are from the hydro rich states of Idaho and Washington: Boise, Spokane, Tacoma, and Seattle. Eugene has the 13th lowest rate (of 119), Portland, OR, the 43rd lowest, and Sioux Falls, SD the 44th lowest. Billings, MT, where hydro is also an important source of electricity, yet neck and neck with coal, sits in the 61st position (of 119).
In the small industrial customer rate comparison the results are also supportive of the hypothesis that an abundance of hydro capacity is condu-cive to low electricity rates, though not quite as overwhelming. In this case, as in the residential rate comparison, four of the eight cities in states with large
9. In this study, “dominant” is generally used to indicate not only the greatest type of electric generation capacity that is available but also that the kind of capacity identified is significantly greater than the other kinds of capacity that are available in the same jurisdiction.10. Where two or more sources of electricity in the same state represent approximately the same shares of total capacity, the state is highlighted in purple in the table.11. This, however, is without regard to the age of the hydro facilities. Facilities that are older than, say, 20 years most likely cost considerably less per unit of capacity than hydro facilities built within the last 10 years. The older the average age of the hydro fleet, the lower the depreciation charge per unit of output is likely to be and hence also the cost. But this also means that the state (or provincial) hydroelectric system may be facing considerable maintenance costs, as in British Columbia. A detailed examination of the vintage of hydro facilities in the various hydro-rich jurisdictions would help to explain why some have a cost advantage relative to others and, therefore, are better positioned to support lower rates.

Electricity rates in the US and Canada / 17
fraserinstitute.org
Table 6: US summer electric generation capacity by type and jurisdiction (megawatts and % share of state total), 2011
Natural gas Coal Nuclear Hydro Petroleum Wind Other Total
MW % MW % MW % MW % MW % MW % MW MWAK 838 40.5 111 5.4 0 0.0 415 20.1 669 32.4 7 0.3 27 2,067AL 12,073 37.1 11,457 35.2 5,043 15.5 3,272 10.0 43 0.1 0 0.0 689 32,577AR 7,882 49.4 4,535 28.4 1,823 11.4 1,341 8.4 22 0.1 0 0.0 354 15,957AZ 13,548 50.1 6,225 23.0 3,937 14.6 2,720 10.1 93 0.3 138 0.5 382 27,043CA 41,274 60.4 411 0.6 4,390 6.4 10,136 14.8 517 0.8 3,770 5.5 7,797 68,295CO 5,283 37.3 5,596 39.5 0 0.0 662 4.7 178 1.3 1,793 12.6 670 14,182CT 2,925 32.0 564 6.2 2,103 23.0 122 1.3 3,185 34.9 0 0.0 233 9,132DC 10 1.3 0 0.0 0 0.0 0 0.0 790 98.8 0 0.0 0 800DE 2,295 68.3 794 23.6 0 0.0 0 0.0 113 3.4 2 0.1 155 3,359FL 33,332 55.9 10,204 17.1 3,924 6.6 55 0.1 10,672 17.9 0 0.0 1,440 59,627GA 14,263 38.4 12,988 35.0 4,061 10.9 2,049 5.5 1,251 3.4 0 0.0 2,502 37,114HI 0 0.0 180 7.0 0 0.0 24 0.9 2,000 78.1 92 3.6 266 2,562IA 2,343 15.3 6,935 45.4 601 3.9 144 0.9 1,047 6.8 4,203 27.5 15 15,288ID 812 19.1 17 0.4 0 0.0 2,704 63.5 5 0.1 611 14.4 106 4,255IL 13,578 31.0 14,857 33.9 11,486 26.2 34 0.1 887 2.0 2,737 6.2 251 43,830IN 5,646 20.6 18,949 69.1 0 0.0 60 0.2 450 1.6 1,340 4.9 959 27,404KS 4,568 35.8 5,188 40.7 1,175 9.2 3 0.0 545 4.3 1,272 10.0 7 12,758KY 4,864 23.0 15,290 72.4 0 0.0 822 3.9 70 0.3 0 0.0 68 21,114LA 18,889 72.1 3,424 13.1 2,133 8.1 192 0.7 994 3.8 0 0.0 566 26,198MA 5,971 43.9 1,560 11.5 685 5.0 263 1.9 3,107 22.8 30 0.2 1,985 13,601MD 2,043 16.2 4,896 38.9 1,705 13.6 590 4.7 2,933 23.3 120 1.0 296 12,583ME 1,645 36.6 85 1.9 0 0.0 742 16.5 1,007 22.4 323 7.2 691 4,493MI 11,028 36.9 11,347 37.9 3,957 13.2 238 0.8 639 2.1 375 1.3 2,318 29,902MN 4,880 32.2 4,710 31.1 1,594 10.5 197 1.3 813 5.4 2,576 17.0 392 15,162MO 5,525 25.0 12,425 56.3 1,190 5.4 570 2.6 1,218 5.5 459 2.1 674 22,061MS 11,552 74.3 2,526 16.3 1,190 7.7 0 0.0 35 0.2 0 0.0 240 15,543MT 376 6.2 2,442 40.6 0 0.0 2,725 45.3 54 0.9 378 6.3 45 6,020NC 8,026 28.2 12,251 43.0 4,970 17.5 1,964 6.9 544 1.9 0 0.0 704 28,459ND 10 0.2 4,147 67.1 0 0.0 508 8.2 72 1.2 1,423 23.0 24 6,184NE 1,784 21.8 4,160 50.9 1,245 15.2 278 3.4 363 4.4 333 4.1 11 8,174NH 1,207 28.9 546 13.1 1,246 29.9 493 11.8 499 12.0 24 0.6 159 4,174NJ 10,093 54.9 2,001 10.9 4,113 22.4 5 0.0 1,381 7.5 8 0.0 773 18,374NM 3,291 39.9 3,990 48.3 0 0.0 83 1.0 4 0.0 750 9.1 136 8,254NV 7,255 62.3 2,873 24.7 0 0.0 1,051 9.0 11 0.1 0 0.0 456 11,646NY 18,809 47.5 2,813 7.1 5,219 13.2 4,319 10.9 5,161 13.0 1,399 3.5 1,909 39,629OH 8,244 24.8 21,251 63.9 2,134 6.4 102 0.3 1,030 3.1 160 0.5 359 33,280OK 13,445 61.6 5,307 24.3 0 0.0 858 3.9 69 0.3 1,811 8.3 334 21,824OR 3,042 20.9 585 4.0 0 0.0 8,420 57.9 0 0.0 2,208 15.2 280 14,535PA 10,055 21.9 18,068 39.4 9,642 21.0 760 1.7 4,325 9.4 789 1.7 2,178 45,817RI 1,735 97.5 0 0.0 0 0.0 3 0.2 16 0.9 2 0.1 23 1,779SC 5,329 22.1 7,258 30.1 6,486 26.9 1,337 5.6 668 2.8 0 0.0 3,003 24,081SD 661 17.6 497 13.2 0 0.0 1,594 42.4 228 6.1 780 20.7 0 3,760TN 4,654 22.0 8,581 40.6 3,401 16.1 2,616 12.4 40 0.2 29 0.1 1,807 21,128TX 68,860 63.1 23,180 21.2 4,960 4.5 689 0.6 208 0.2 10,361 9.5 921 109,179UT 2,015 26.5 4,903 64.4 0 0.0 255 3.3 28 0.4 324 4.3 88 7,613VA 8,163 33.1 5,848 23.7 3,539 14.3 866 3.5 2,370 9.6 0 0.0 3,899 24,685VT 0 0.0 0 0.0 620 52.9 324 27.7 101 8.6 45 3.8 81 1,171WA 3,828 12.5 1,340 4.4 1,097 3.6 21,067 69.1 15 0.0 2,454 8.0 706 30,507WI 6,084 33.2 8,405 45.9 1,750 9.6 388 2.1 722 3.9 612 3.3 340 18,301WV 1,044 6.0 15,441 89.0 0 0.0 285 1.6 11 0.1 528 3.0 33 17,342WY 120 1.4 6,482 76.9 0 0.0 307 3.6 6 0.1 1,412 16.7 104 8,431
Note: States are highlighted according to the dominant type of electric generation as follows:
Gas Coal Nuclear Hydro Petroleum No single technology dominant
Where wind capacity exceeds five percent it is boldfaced.
Source: EIA (2013a).

18 / Electricity rates in the US and Canada
fraserinstitute.org
developed hydro resources have rates that are among those of the 14 cities (of 119) with the lowest rates. These include Boise, Tacoma, Seattle, and Eugene, of which Boise and Tacoma rank third and 4th, respectively. Portland, OR, Billings, Sioux Falls and Spokane rank 45th, 46th, 48th and 55th, respectively.
Looking at all (i.e., both Canadian and US) cities listed in table 1, in the residential rate comparison seven of the 12 cities from provinces and states with dominant hydroelectric capacity shares (including Newfoundland and Labrador) are among the group of 15 cities that have the lowest rates.12 In both the small commercial and small industrial customer class comparisons, six of the 12 cities from hydro-rich provinces and states show up among the 15 with the best (lowest) rates.
The coefficient of correlation between the cities’ residential rates and the hydro share of electricity produced in the corresponding jurisdictions, although small (0.19), is negative. This suggests, at least, that in jurisdictions where the hydro share of the electricity that is produced is relatively high, cit-ies are somewhat likely to have relatively low electricity rates.
The difference between the mean residential rate of 8.83 cents per kWh for the 11 cities in hydro dominant jurisdictions (based on the hydro share of conventional capacity in the Canadian provinces, US states, and Washington, DC) and the mean residential rate of 12.22 cents per kWh in the other 107 cities (Honolulu excluded) was found to be very significant according to the statistical tests.13 This supports the view that residential electricity rates in cities located in jurisdictions where hydro is the dominant source of sup-ply might be expected to be lower, in general, than rates in other cities. The results for the difference of means test undertaken with respect to both the small commercial and small industrial rate classes were similar.14
As explained above, these difference of means tests were based on groups differentiated according to whether or not developed hydro capacity was dominant in the various jurisdictions. In 2012, hydroelectric generation was the major source of electricity produced in all of the hydro capacity dom-inant states and provinces except Montana, where coal-fired facilities were the source of 50.3 percent of electricity production and hydroelectric facilities only 40.6 percent (EIA, 2013b). When Billings, MT was excluded from the group of cities identified as being in hydro dominant states and the difference
12. The eight US cities already noted plus St. John’s, Montreal, Winnipeg, and Vancouver.13. St. John’s, NL was excluded from the group of hydro cities because its electricity comes from a collection of mainly small hydro facilities and fossil fuel plants. 14. For the small commercial rate class the mean rate was 8.44 cents per kWh for the 11 “hydro” cities compared with 11.69 cents per kWh for the other 107 cities (Honolulu excluded). For the small industrial rate class the corresponding mean rates were 6.64 cents per kWh and 8.97 cents per kWh.

Electricity rates in the US and Canada / 19
fraserinstitute.org
of means tests were repeated, the differences in the means continued to be statistically significant for each of the customer class cases.
Figure 1 illustrates the relationship between residential electricity rates in the cities surveyed and hydro’s share of electricity production in the respective jurisdictions.
3. Substantial reliance on coal-fired electric generation
In the preceding section it was noted that cities in jurisdictions where hydro-electric generation capacity is the major source of electricity tend to benefit from low electricity rates. Here, we investigate whether this might also be true where coal-fired electricity is the dominant supply source.
Table 5 indicates that, in Canada, fossil fuel combustion is the major type of electric generation capacity in Nova Scotia, New Brunswick, Saskatchewan, and Alberta and an important source of supply, along with nuclear power, in Ontario. However coal-fired thermal plants only dominate the electric generation capacity mix in Saskatchewan where they constitute 48 percent of SaskPower’s generation capacity, compared with 24 percent for hydro, 23 percent for natural gas, and 5 percent for wind (SaskPower, 2013).
The combined capacity of Nova Scotia Power’s generating stations at Trenton, Point Tupper, Lingan, and Point Aconi, which rely on mixtures of coal, petroleum coke, and/or heavy fuel oil for their fuel source, is 1,247 MW. This constitutes almost 52 percent of the generation capacity that Nova Scotia Power either owns or for which it has contractual supply relationships with
0 5 10 15 20 25 30 350
10
20
30
40
50
60
70
80
90
100
Hyd
ro S
hare
(%)
Figure 1: Hydro shares of electricity production and residential electricity rates in cities surveyed
Sources: Hydro-Quebec (2013); Lincoln Nebraska Electric System (2013); EIA (2013b); calculations by authors.
CAN cents per kWh
20 / Electricity rates in the US and Canada
fraserinstitute.org
independent power producers (Nova Scotia Power, 2013a, 2013b). But since coal is just one of the three fuels that are used in the four plants, coal does not appear to be the dominant source of electricity in the province.
In Alberta, where coal and natural gas fired plants represent, respect-ively, 38.1 percent and 38.8 percent of total generation capacity, significantly more electricity is still being produced from coal plants each year than from natural gas combustion (Alberta Energy, 2014; National Energy Board, 2013)). In Ontario, where coal is being phased out as an electricity supply source, coal-fired generation capacity’s nine percent share is dwarfed by nuclear cap-acity (36 percent), natural gas (28 percent), and hydro (22 percent) (Ontario Independent Electric System Operator, 2013). While NB Power’s Belledune coal station is relatively large (458 MW), the province’s fossil fuel combus-tion capacity is dominated by fuel oil, diesel, and natural gas-fired plants owned by NB Power, Emera Inc., and TransCanada Corp. (NB Power, 2013; Wikipedia, 2013).
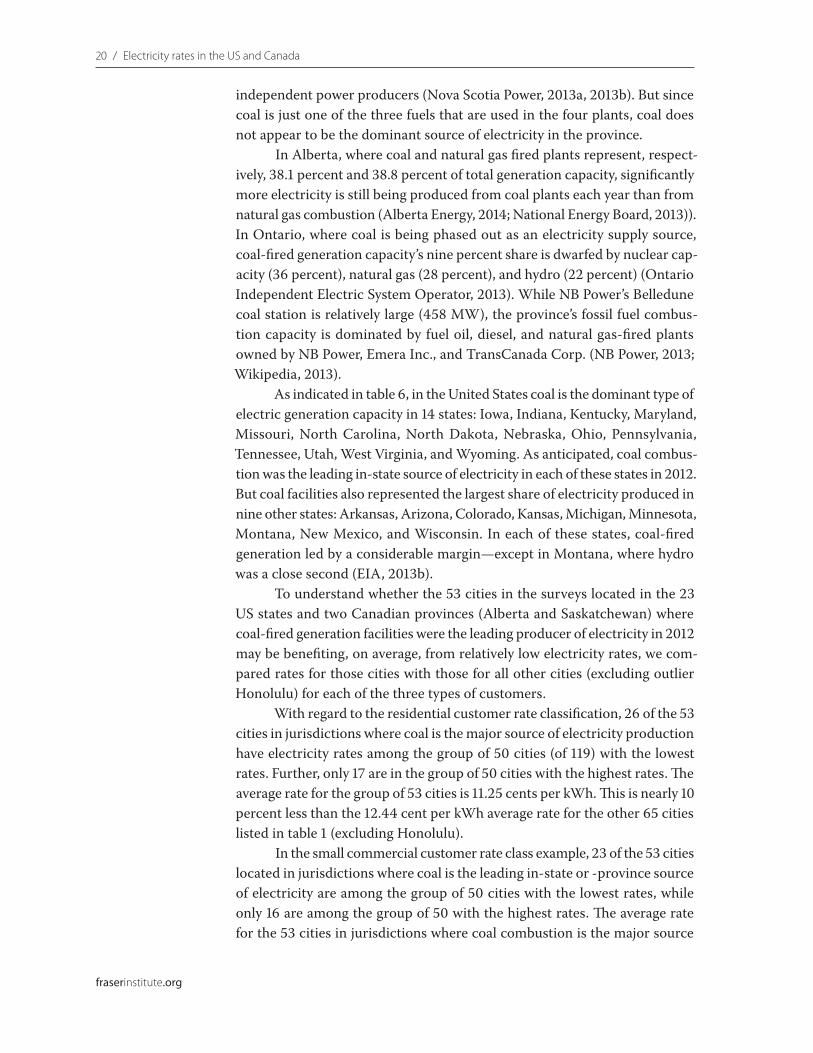
As indicated in table 6, in the United States coal is the dominant type of electric generation capacity in 14 states: Iowa, Indiana, Kentucky, Maryland, Missouri, North Carolina, North Dakota, Nebraska, Ohio, Pennsylvania, Tennessee, Utah, West Virginia, and Wyoming. As anticipated, coal combus-tion was the leading in-state source of electricity in each of these states in 2012. But coal facilities also represented the largest share of electricity produced in nine other states: Arkansas, Arizona, Colorado, Kansas, Michigan, Minnesota, Montana, New Mexico, and Wisconsin. In each of these states, coal-fired generation led by a considerable margin—except in Montana, where hydro was a close second (EIA, 2013b).
To understand whether the 53 cities in the surveys located in the 23 US states and two Canadian provinces (Alberta and Saskatchewan) where coal-fired generation facilities were the leading producer of electricity in 2012 may be benefiting, on average, from relatively low electricity rates, we com-pared rates for those cities with those for all other cities (excluding outlier Honolulu) for each of the three types of customers.
With regard to the residential customer rate classification, 26 of the 53 cities in jurisdictions where coal is the major source of electricity production have electricity rates among the group of 50 cities (of 119) with the lowest rates. Further, only 17 are in the group of 50 cities with the highest rates. The average rate for the group of 53 cities is 11.25 cents per kWh. This is nearly 10 percent less than the 12.44 cent per kWh average rate for the other 65 cities listed in table 1 (excluding Honolulu).
In the small commercial customer rate class example, 23 of the 53 cities located in jurisdictions where coal is the leading in-state or -province source of electricity are among the group of 50 cities with the lowest rates, while only 16 are among the group of 50 with the highest rates. The average rate for the 53 cities in jurisdictions where coal combustion is the major source
Electricity rates in the US and Canada / 21
fraserinstitute.org
of electricity is 10.66 cents per kWh. That is 1.31 cents per kWh (10.9 per-cent), less than the average rate of 11.97 cents per kWh in the other 65 cities (Honolulu excluded).
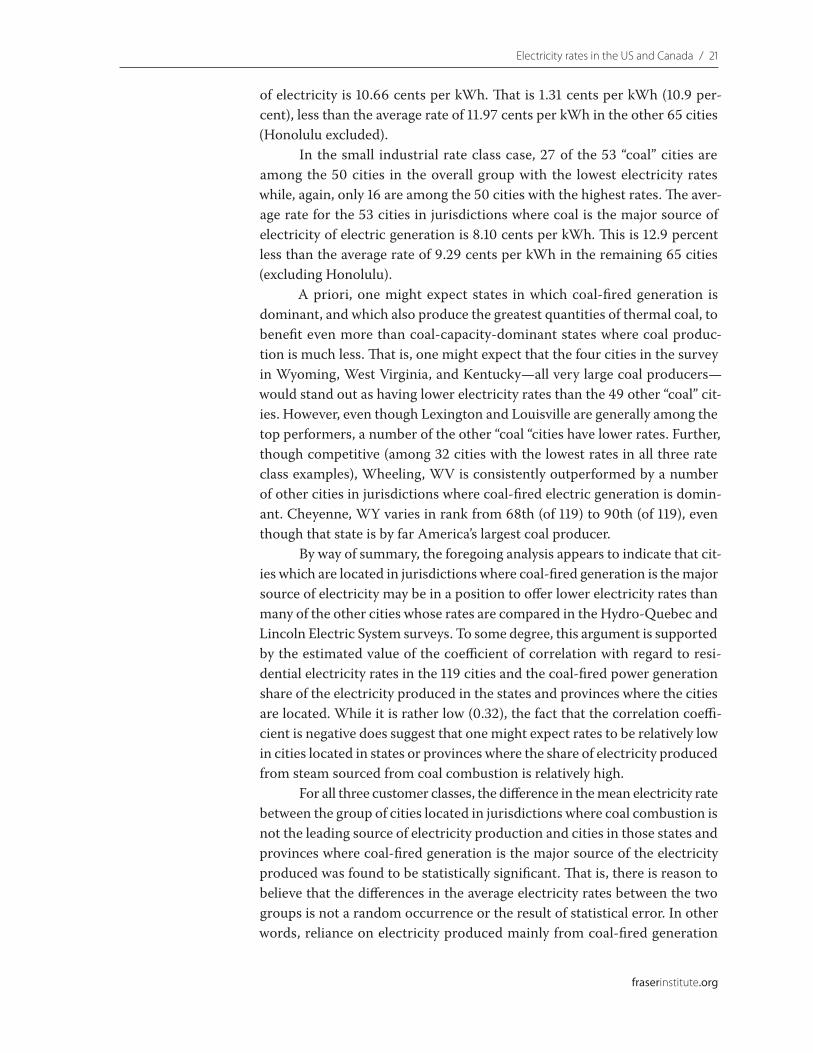
In the small industrial rate class case, 27 of the 53 “coal” cities are among the 50 cities in the overall group with the lowest electricity rates while, again, only 16 are among the 50 cities with the highest rates. The aver-age rate for the 53 cities in jurisdictions where coal is the major source of electricity of electric generation is 8.10 cents per kWh. This is 12.9 percent less than the average rate of 9.29 cents per kWh in the remaining 65 cities (excluding Honolulu).
A priori, one might expect states in which coal-fired generation is dominant, and which also produce the greatest quantities of thermal coal, to benefit even more than coal-capacity-dominant states where coal produc-tion is much less. That is, one might expect that the four cities in the survey in Wyoming, West Virginia, and Kentucky—all very large coal producers—would stand out as having lower electricity rates than the 49 other “coal” cit-ies. However, even though Lexington and Louisville are generally among the top performers, a number of the other “coal “cities have lower rates. Further, though competitive (among 32 cities with the lowest rates in all three rate class examples), Wheeling, WV is consistently outperformed by a number of other cities in jurisdictions where coal-fired electric generation is domin-ant. Cheyenne, WY varies in rank from 68th (of 119) to 90th (of 119), even though that state is by far America’s largest coal producer.
By way of summary, the foregoing analysis appears to indicate that cit-ies which are located in jurisdictions where coal-fired generation is the major source of electricity may be in a position to offer lower electricity rates than many of the other cities whose rates are compared in the Hydro-Quebec and Lincoln Electric System surveys. To some degree, this argument is supported by the estimated value of the coefficient of correlation with regard to resi-dential electricity rates in the 119 cities and the coal-fired power generation share of the electricity produced in the states and provinces where the cities are located. While it is rather low (0.32), the fact that the correlation coeffi-cient is negative does suggest that one might expect rates to be relatively low in cities located in states or provinces where the share of electricity produced from steam sourced from coal combustion is relatively high.
For all three customer classes, the difference in the mean electricity rate between the group of cities located in jurisdictions where coal combustion is not the leading source of electricity production and cities in those states and provinces where coal-fired generation is the major source of the electricity produced was found to be statistically significant. That is, there is reason to believe that the differences in the average electricity rates between the two groups is not a random occurrence or the result of statistical error. In other words, reliance on electricity produced mainly from coal-fired generation

22 / Electricity rates in the US and Canada
fraserinstitute.org
facilities appears to explain why cities in some jurisdictions enjoy lower elec-tricity rates than others.
The relationship between city electricity rates and the coal facility share of the electricity produced in the respective jurisdictions is illustrated in figure 2.15
4. Natural gas
Figure 3 illustrates that the implied price of natural gas paid by US power generators was lower during 2012, on average, than at any other time during the previous decade.16 The 2012 gas price of $3.52 per thousand cubic feet (Mcf) was clearly much lower than in 2008 when the price averaged $9.26 per Mcf. This suggests, at least, that cities located in jurisdictions where natural gas combustion is a major source of electricity may have been in a position
15. For Canada, the 2012 electricity production shares by province for coal-fired combus-tion and other electric generation technologies were derived from data published by the National Energy Board (NEB, 2013). Corresponding data for US states and the District of Columbia was calculated from Energy Information Administration data (EIA, 2013b).16. This data is calculated by the US Energy Information Administration from infor-mation collected via EIA Form 923 regarding the volume and cost of fuel purchased by power plant operators. Review of the plant-by-plant information contained in the Fuel Receipts and Cost Time Series File produced by the EIA from Form 923 data for January 2012 indicates that most of the natural gas that is used for power generation is purchased on a contractual basis from gas producers and marketers.
0 5 10 15 20 25 30 350
10
20
30
40
50
60
70
80
90
100
Coal
Sha
re (%
)
Figure 2: Coal-�red generation shares of electricity production and residential electricity rates in cities surveyed
Sources: Hydro-Quebec (2013); Lincoln Nebraska Electric System (2013); EIA (2013b); calculations by authors.
CAN cents per kWh

Electricity rates in the US and Canada / 23
fraserinstitute.org
to enjoy relatively low electric rates when the 2013 Lincoln Electric System survey was undertaken, compared with cities in jurisdictions with little gas-fired capacity.
In order to test whether cities in jurisdictions with substantial gas-fired electric generation capacity might have a relative advantage in terms of electric rates, we first identified the states and districts in which natural gas is either the dominant or a major form of electric generation capacity (table 6). Guided by that information, we then identified those states and districts where the natural gas share of electricity produced in 2012 was greater than any other single in-state source of supply (EIA, 2013b). Next, we assessed how electricity rates in the cities located in states where gas-fired generation was the largest kind of electricity production compared, on average, with those in the rest of the group of 119 cities.
In 2012, natural gas combustion was the major form of electricity generation in 13 US states: Alaska, California, Delaware, Florida, Louisiana, Maine, Massachusetts, Mississippi, Nevada, New York, Oklahoma, Rhode Island, and Texas. Gas also constituted the greatest share of electricity pro-duction in the District of Columbia. From the list of US cities surveyed we determined that 29 US cities are located in those jurisdictions.
From table 5 and investigation of the gas-share of electricity produc-tion in the Canadian provinces, we discovered that while natural gas is an important source of electricity in some cases, especially Alberta, it was not the major source of supply in that or any other province during 2012.
In the residential rate class example, two of the 29 cities in states where gas combustion is the major supply source are among the 10 cities (of 119) with lowest electric rates and 11 of the 29 are among the 50 (of 119) with low-est rates. However, 17 of the 29 “gas” cities are among the 50 cities (of 119)
01
2
3
4
5
6
7
8
9
10
20122011201020092008200720062005200420032002
US$
/Mcf
Figure 3: Natural gas price paid by US electric power companies, 2002–2012
Source: EIA (2014).

24 / Electricity rates in the US and Canada
fraserinstitute.org
with the highest rates. Moreover, the average rate for all 29 cities located in states where gas-fired generation is dominant, 13.06 cents per kWh, is 1.30 cents per kWh or 11.1 percent greater than the average rate for the 90 other cities in the survey. Tests indicated that the difference between the mean rate for the 29 cities in gas-dominant jurisdictions and the mean rate for all other cities (excluding Honolulu) is statistically significant. However, if Honolulu is included in the “other” group the difference between the mean values is not significant. For this reason it is not clear that the difference in average residential electric rates in the two groups of cities is a reflection of gas-fired electricity being the major source of supply for cities in the one group, but not in the other.
In the small commercial customer rate class example, four of the 29 “gas” cities (Tulsa, Baton Rouge, Las Vegas, and Reno) are among the group of 10 cities (of 119) with the lowest rates. Also, 11 (of 29) are among the 50 (of 119) with the lowest rates. Yet 13 of the 29 cities in states where gas com-bustion is the major in-state source of electricity are among the 50 (of 119) cities with the highest rates. Moreover, the average rate for the 29 “gas” cities, at 12.16 cents per kWh, is 7.1 percent greater than the average rate for the 90 other cities. In this case, the difference between the mean rates in cities in the “gas” and “other” states (with or without outlier Honolulu included) was not statistically significant. That is, it could have occurred randomly. In other words, there appears to be no justification to distinguish between small commercial customer electric rates in the two groups of cities on the basis of gas-fired generation being either the major or a lesser component of the electricity produced.
For the small industrial rate class the findings were similar. Four of the 29 cities located in states where gas-fired generation is the major form of production are among the 10 (of 119) cities with the lowest rates, and eight of the 29 are among the 50 (of 119) with the lowest rates. However, in this case, 16 of the 29 “gas” cities are among the 50 (of 119) cites with the highest rates. And the average rate for the group of 29 cities is 11.3 percent greater than that for the 90 other cities. With this rate class the difference of means test results were mixed as for residential rates: statistically significant (though mildly so) with Honolulu excluded from the “other” group, but not significant when Honolulu was included.
These mixed results indicate that being located in a state or district where natural gas combustion is the major form of electricity production does not guarantee that a city will have higher or lower than average electricity rates. While cities in some such states (e.g., Florida, Louisiana, Mississippi, Oklahoma, and Texas) are mostly among the group of 50 cities (of 119) with lowest rates for all 3 customer classes reviewed, cities in some states where gas-fired electric generation is very important generally have rates that are

Electricity rates in the US and Canada / 25
fraserinstitute.org
greater than average—in some cases, as in California, Massachusetts, and New York, very much greater.
Several factors contribute to whether a state where gas-fired electric generation is dominant has relatively low electricity rates. One is the extent of the contribution made by competing sources of supply in the state, such as coal and hydro. Another is location. Oklahoma, Louisiana, and Texas, for example, are major producers and net exporters of natural gas. In gas-rich states such as these, the local price of gas is likely to be lower than in states that are net importers of gas such as New York and Massachusetts, where the delivered cost of gas includes significant transmission charges.
Another important factor is the extent to which gas-fired facilities are being relied upon to meet baseload and not merely peak demand require-ments, as has traditionally been the case with gas combustion generation facilities. State-by-state electricity generation data for 2012 indicates that Delaware, Mississippi, and Nevada, for example, were relying on gas-fired generation to meet at least 70 percent of their total electricity production requirements (much more than New York), implying considerable utilization during non-peak periods (EIA, 2013b).
Another factor is a state’s electricity supply mix since, in spite of hav-ing substantial quantities of relatively low-cost electricity from gas, electri-city rates may be pulled up by high cost sources of electricity such as wind power, oil combustion, and pumped storage.17 California and New York, for example, have significant dependence on wind power and pumped storage. Massachusetts is also burdened by significant pumped storage costs.
Another factor is the relative efficiency of the gas-fired power plants that are available. For example, single or simple cycle burners that only gen-erate electricity via gas turbines are less efficient (require more gas per unit of electricity generated) than combined-cycle plants in which exhaust gases from a gas generator are cycled to a steam generator where they are used to generate additional electricity. States where state-of-the-art combined-cycle gas-fired plants are being built will be in a better position to take advantage of low gas prices.
17. Pumped storage is hydroelectric generation made possible by pumping water into reservoirs. Because the pumps themselves consume considerable volumes of costly fuels such as natural gas or diesel fuel, this non-conventional source of hydroelectric electricity is generally very costly. However, the availability of pumped storage to help meet elec-tricity requirements during peak electricity demand periods can allow ‘baseload’ supply sources such as coal-fired generators and nuclear plants to maintain operating levels without interruption other than for maintenance, therefore achieving high levels of effi-ciency. Baseload simply refers to generating units slated for operation on a continuous 24-7 basis because of their low all-in unit costs.

26 / Electricity rates in the US and Canada
fraserinstitute.org
5. Nuclear power
As indicated by table 6, nuclear power electric generation capacity is clearly very dominant only in the state of Vermont, where its share is about 72 per-cent. However, nuclear power is almost as important in terms of generation capacity as either natural gas or both gas and coal in Illinois, New Hampshire, Ontario, and South Carolina. Moreover, in 2012 nuclear power was the leading producer of electricity not only in those five jurisdictions but in Connecticut, New Jersey, and Virginia as well.18
That nuclear power’s share of production is greater than its share of generation capacity in some cases (as in South Carolina, New Jersey, Illinois, and Connecticut) reflects the fact that nuclear power plants are generally relied upon to produce electricity on a continuous basis in order to help meet ‘baseload’ electricity demand requirements prevailing throughout the day. In contrast, because of their greater flexibility, gas-fired electric generation facili-ties are more often called on during peak demand periods, as in the early morning and in the late afternoon and early evening, when lighting, cook-ing, and heat energy requirements are greatest. For this reason the opposite is true. That is, the natural gas share of a jurisdiction’s electricity production is generally less than the share of total generation capacity represented by gas-fired facilities.
In Ontario, where nuclear and gas-fired electric generation capaci-ties constitute about the same shares of total capacity, it is therefore not sur-prising that the nuclear facilities have been producing more electricity than the gas combustion units. This also helps to explain why even though New Hampshire’s nuclear generation capacity and gas-fired capacity are approxi-mately the same, in 2012 the state’s nuclear plants accounted for nearly 42.5 percent of the electricity produced and natural gas only a bit more than a third. In South Carolina, where nuclear power ranked second in terms of capacity (behind coal), nuclear plants were responsible for 53 percent of the state’s electricity output compared with coal-fired facilities’ 29 percent. Similarly, while nuclear power plants ranked third in terms of capacity in Illinois (behind both coal and natural gas), nuclear power was the source of almost 48 percent of the electrical energy produced compared with coal facili-ties’ 41 percent and gas-fired units’ 6 percent share (EIA, 2013b).
When we compared average electricity rates in the 16 cities included in the two surveys that are located in the eight jurisdictions cited in the first
18. Nuclear power’s share of total electricity production in these eight jurisdictions was as follows: Vermont (75.9 percent of the total), Ontario (55.0 percent ), South Carolina (52.9 percent ), New Jersey (50.7 percent ), Illinois (48.3 percent ), Connecticut (47.3 per-cent ), New Hampshire (42.5 percent ), and Virginia (40.6 percent ) (Statistics Canada, 2014; EIA, 2013b).

Electricity rates in the US and Canada / 27
fraserinstitute.org
paragraph of this section with the average for the other cities in the surveys (with or without Honolulu) we found that they were clearly higher. For the residential rate class for example, the average rate in the 16 “nuclear” cities was more than two cents per kilowatt-hour (18.1 percent) greater than in all the other cities. Further, rates in the 16 cities in nuclear-intensive jurisdic-tions were 18.3 percent greater and more than two cents per kWh higher, on average, than in the other cities in the small commercial demand rate class example. In the small industrial demand case, rates averaged 16.5 percent greater in the “nuclear” cities.
While there are a few exceptions—for example, Chicago’s rate for small industrial demand ranks 15th (of 119), and rates in Norfolk and Richmond, VA are consistently among the group of 50 cities (of 119) with the lowest rates—these comparisons suggest that cities in jurisdictions where nuclear power is the leading source of the electrical energy that is produced cannot be counted on as having competitive electricity rates. To the contrary, they tend to have higher rates.
For all three customer classes, tests of the differences between the mean electricity rate for cities in the eight jurisdictions where nuclear power is the major in-state source of electricity and the mean rate for cities (exclud-ing Honolulu) in states where nuclear power is either not the leading supply source or absent indicated that they were statistically significant. In other words, rates in cities in the nuclear-strong jurisdictions are not only greater, on average, than rates in the other cities, but there is also reason to believe that this may be, at least in part, on account of the extent of penetration of nuclear power in the electricity production mix. At least, the statistical tests of the differences of means tell us that the differences in the average rates for the two groups are sufficiently large that they may not be the result of ran-dom occurrences.
The estimated coefficient of correlation between residential electric rates and the nuclear generation share of electricity produced in the states and provinces where each of the 119 cities in the survey are located is low but positive. This also suggests that rates may tend to be higher in cities in jurisdictions where the nuclear share of production is high.
6. Reliance on renewable energy sources
In recent years, policy makers in various states and provinces have succeeded in having special incentives for investments in renewable energy sources, especially wind power, put in place—even though, with but a few exceptions including older large hydroelectric installations, renewable energy sources
28 / Electricity rates in the US and Canada
fraserinstitute.org
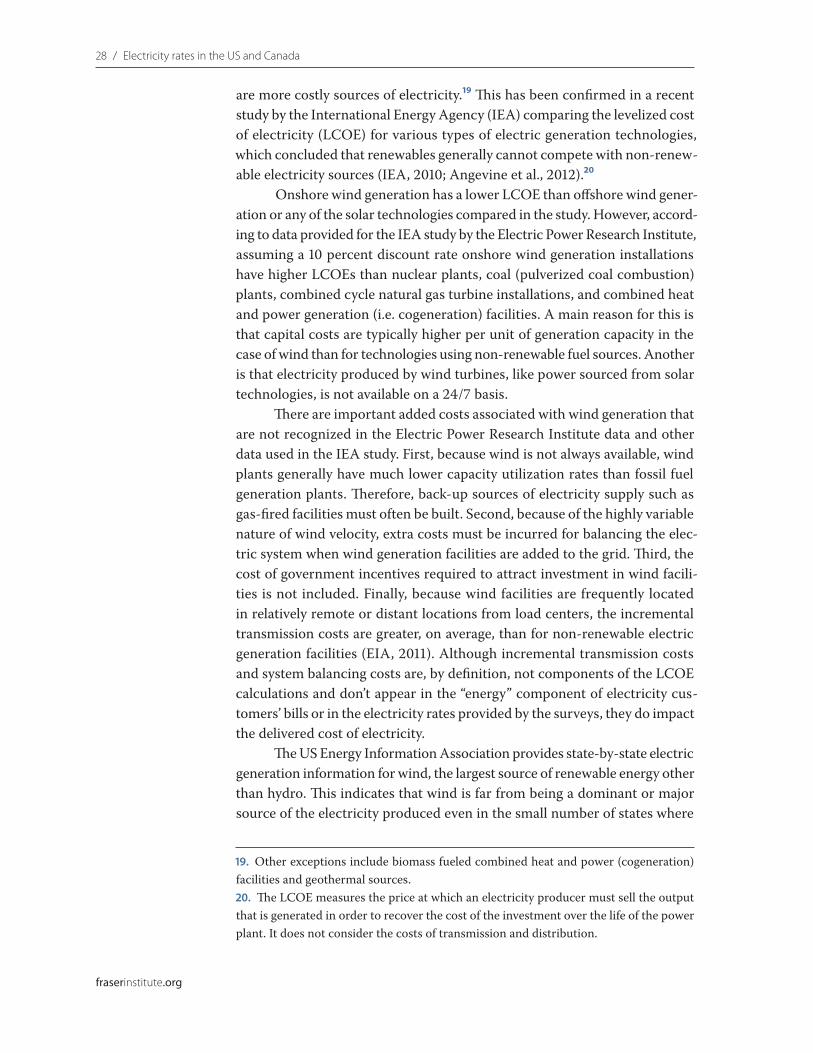
are more costly sources of electricity.19 This has been confirmed in a recent study by the International Energy Agency (IEA) comparing the levelized cost of electricity (LCOE) for various types of electric generation technologies, which concluded that renewables generally cannot compete with non-renew-able electricity sources (IEA, 2010; Angevine et al., 2012).20
Onshore wind generation has a lower LCOE than offshore wind gener-ation or any of the solar technologies compared in the study. However, accord-ing to data provided for the IEA study by the Electric Power Research Institute, assuming a 10 percent discount rate onshore wind generation installations have higher LCOEs than nuclear plants, coal (pulverized coal combustion) plants, combined cycle natural gas turbine installations, and combined heat and power generation (i.e. cogeneration) facilities. A main reason for this is that capital costs are typically higher per unit of generation capacity in the case of wind than for technologies using non-renewable fuel sources. Another is that electricity produced by wind turbines, like power sourced from solar technologies, is not available on a 24/7 basis.
There are important added costs associated with wind generation that are not recognized in the Electric Power Research Institute data and other data used in the IEA study. First, because wind is not always available, wind plants generally have much lower capacity utilization rates than fossil fuel generation plants. Therefore, back-up sources of electricity supply such as gas-fired facilities must often be built. Second, because of the highly variable nature of wind velocity, extra costs must be incurred for balancing the elec-tric system when wind generation facilities are added to the grid. Third, the cost of government incentives required to attract investment in wind facili-ties is not included. Finally, because wind facilities are frequently located in relatively remote or distant locations from load centers, the incremental transmission costs are greater, on average, than for non-renewable electric generation facilities (EIA, 2011). Although incremental transmission costs and system balancing costs are, by definition, not components of the LCOE calculations and don’t appear in the “energy” component of electricity cus-tomers’ bills or in the electricity rates provided by the surveys, they do impact the delivered cost of electricity.
The US Energy Information Association provides state-by-state electric generation information for wind, the largest source of renewable energy other than hydro. This indicates that wind is far from being a dominant or major source of the electricity produced even in the small number of states where
19. Other exceptions include biomass fueled combined heat and power (cogeneration) facilities and geothermal sources.20. The LCOE measures the price at which an electricity producer must sell the output that is generated in order to recover the cost of the investment over the life of the power plant. It does not consider the costs of transmission and distribution.

Electricity rates in the US and Canada / 29
fraserinstitute.org
wind represents more than 10 percent of total generation. For those states, and other states and provinces with significant shares of wind generation, it is not fruitful simply to compare electric rates in the cities in such jurisdictions with rates in the other cities in the surveys in order to assess the impact that the availability of wind generation may be having on rates. The reason for this is that many factors, in addition to the supply that is available from a single relatively minor source such as wind, interact to determine city electricity rates. Other things equal, it is likely that costs associated with the dominant or major sources of supply have the most influence on rates.
Table 7 provides a list of the 14 states and two provinces where the wind share of total electricity production exceeded five percent in 2012, ranging from 24.8 percent in Iowa to 5.6 percent in Washington State.21
21. Although approximately 97 percent of the electricity produced in Prince Edward Island came from wind turbines, that province was excluded since most of the electricity consumed there is being imported.
Table 7: Jurisdictions with wind generation >5% of total, 2012
State Wind share (%)
Iowa 24.8
South Dakota 24.2
Minnesota 14.6
North Dakota 14.6
Idaho 12.2
Kansas 11.7
Colorado 11.3
Oklahoma 10.5
Oregon 10.4
Wyoming 8.8
Texas 7.5
Nova Scotia 7.2
New Brunswick 7.1
Maine 6.1
New Mexico 6.1
Washington 5.6
Sources: EIA (2013b); Statistics Canada (2014).

30 / Electricity rates in the US and Canada
fraserinstitute.org
In Iowa, 62.3 percent of production came from coal-fired plants. The high proportion of output from presumably relatively low-cost coal-fired gen-eration facilities would therefore appear to explain why the average of rates in Davenport, Des Moines, and Cedar Rapids was well below the survey-wide average for each of the three rate classes.
In South Dakota, where wind constituted 24.2 percent of electricity production, natural gas combustion accounted for 24.3 percent and hydro for 49.7 percent. The fact that rates in Sioux Falls were lower than average over all three customer classes is therefore most likely a reflection of hydro’s dominant role in the supply mix. The presence of significant supply from gas may reflect the fact that gas-fired plants as well as hydro facilities were relied upon during times when wind velocities were not sufficiently strong or steady to drive the wind turbines.
While wind was the source of 14.6 percent of the electricity produced in Minnesota, the relatively attractive (below average) performance of Duluth, Minneapolis, and Saint Paul with respect to rates for all three customer classes is likely attributable to the state’s reliance during 2012 on coal-fired electricity production (43.5 percent) and nuclear power (22.4 percent).
Similarly, although wind also constituted 14.6 percent of supply in North Dakota, Fargo’s attractive rate performance—as evidenced by well below average rates for each of the customer classes—was most likely the consequence of the availability of considerable coal-fired generation cap-acity which was responsible for 78.1 percent of the electricity produced in the state during 2012.
In Idaho, where wind had the fifth highest representation in terms of share of the electricity produced in 2012, at 12.2 percent, production was dominated by hydro which was responsible for a remarkable 70.6 percent of the state’s power output. The share of production from gas-fired facilities was virtually the same as the wind share. Low-cost hydro, and the availabil-ity of both hydro and gas capacity to provide back up for the wind facilities, therefore probably goes a long way towards explaining Boise’s very low elec-tricity rates in all three customer classes, rather than the presence of wind capacity per se.22
Renewable energy “standards” or targets, as well as subsidies and incen-tives, are being used in many jurisdictions to attract investment in capacity to generate electricity from renewable energy sources such as wind in order to
22. In each of these cases, as elsewhere, multivariate regression analysis might have helped to explain the relative impacts of the various sources of supply and other fac-tors on electricity rates. Because of wind’s minor contribution relative to other sources of supply, as evidenced by the above discussion, grouping cities according to wind and no-wind categories and testing the differences of mean values for significance would not have been appropriate.

Electricity rates in the US and Canada / 31
fraserinstitute.org
reduce air pollution and greenhouse gas emissions. Analysis of this topic is beyond the scope of this study. However, various reports including a recent study by Angevine et al. (2012) indicate that such subsidies can be very costly to taxpayers and can place a huge burden on electricity consumers, as with Ontario’s Feed-in-Tariff program. For this reason, policy makers need to ensure that any emissions charges, subsidies, or incentives that are deemed essential to level the playing field between polluting and non-polluting elec-tric generation facilities are carefully designed so that, all things considered, the field does not become tilted in favor of high-cost renewable energy tech-nologies. In other words, the objective must be to achieve the lowest pos-sible cost of electricity given whatever constraints (incremental costs) may be imposed by science-based environmental policy objectives.23
23. Population was also examined as a factor explaining differences among electricity rates in the 119 cities. For this purpose, Canadian population data was obtained from Statistics Canada (2013a, 2013b). Population data for the United States was obtained from the US Census (2013a, 2013b). To test the hypothesis that electricity rates are greater in larger cities than in small cities, the correlation between residential electricity rates in the 119 cities and city size in terms of population was calculated and a scatter diagram plotted. The analysis suggested that city size is not a significant rate-determining factor.

32 / fraserinstitute.org
The impact of taxes levied on consumers’ bills
When taxes applicable to electricity prices are included, the rankings can be much different from those derived with taxes excluded. More important, the actual cost to consumers can be appreciably greater. As noted earlier, com-parison of rates in the group of 119 cities with and without taxes included was not possible because the required data were not available in the Lincoln Electric System survey. However, we were able to compare rates in this man-ner for the 22 cities included in the Hydro-Quebec Survey.24 Rates with and without taxes are summarized in table 8.
For the 12 Canadian cities, on average, taxes add 10.1 percent to the residential service rate. However, taxes increase the cost to residential elec-tricity consumers in the 10 U.S. cities by only 6.2 percent on average. In fact, in three of the 10 US cities (Boston, Nashville, and Seattle) there is zero tax on residential electricity consumption. Among the Canadian cities, the lar-gest tax impacts in percentage terms occur in Regina (15 percent), Montreal (14.8 percent), and Toronto (14.6 percent), but increases in the residential rate are almost as large in Winnipeg, Charlottetown, Moncton, and Ottawa when taxes are included. In the US, the largest increases occur in Miami (14.8 percent), Chicago (13.2 percent), and Detroit (10.9 percent).
Because of a relatively low (4.9 percent) tax bite, St. John’s jumps from 7th place (of 12) in the Canadian cities group to 4th place when taxes are included in the rate that residential customers pay for electricity. On the other hand, Miami drops from second place (of 10) among the 10 US cities to fifth
24. The taxes that were applied to typical consumer bills in the case of each of the three customer classes addressed in this study are listed in Appendix C of the Hydro-Quebec survey report. For the Canadian cities, these consisted of the federal goods and services tax and the applicable provincial sales tax (except in Alberta, which does not have a prov-incial sales tax). Where there is a ‘harmonized’ federal/provincial sales tax rate, as in the four Atlantic provinces and Ontario, that rate was used. The municipal sales taxes levied by Winnipeg and Regina were applied to bills in those cities. Similarly, for the American cities, all applicable state, municipal, and county sales taxes were applied.
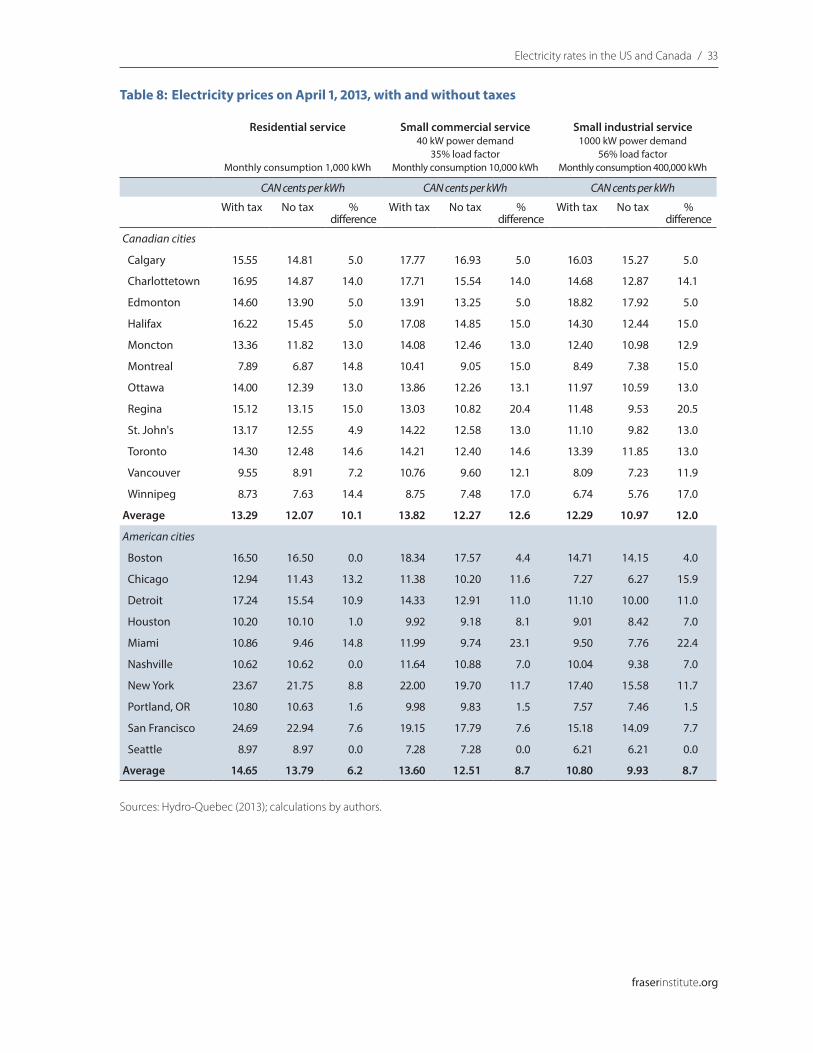
Electricity rates in the US and Canada / 33
fraserinstitute.org
Table 8: Electricity prices on April 1, 2013, with and without taxes
Residential service
Monthly consumption 1,000 kWh
Small commercial service 40 kW power demand
35% load factor Monthly consumption 10,000 kWh
Small industrial service 1000 kW power demand
56% load factor Monthly consumption 400,000 kWh
CAN cents per kWh CAN cents per kWh CAN cents per kWh
With tax No tax % difference
With tax No tax % difference
With tax No tax % difference
Canadian cities
Calgary 15.55 14.81 5.0 17.77 16.93 5.0 16.03 15.27 5.0
Charlottetown 16.95 14.87 14.0 17.71 15.54 14.0 14.68 12.87 14.1
Edmonton 14.60 13.90 5.0 13.91 13.25 5.0 18.82 17.92 5.0
Halifax 16.22 15.45 5.0 17.08 14.85 15.0 14.30 12.44 15.0
Moncton 13.36 11.82 13.0 14.08 12.46 13.0 12.40 10.98 12.9
Montreal 7.89 6.87 14.8 10.41 9.05 15.0 8.49 7.38 15.0
Ottawa 14.00 12.39 13.0 13.86 12.26 13.1 11.97 10.59 13.0
Regina 15.12 13.15 15.0 13.03 10.82 20.4 11.48 9.53 20.5
St. John's 13.17 12.55 4.9 14.22 12.58 13.0 11.10 9.82 13.0
Toronto 14.30 12.48 14.6 14.21 12.40 14.6 13.39 11.85 13.0
Vancouver 9.55 8.91 7.2 10.76 9.60 12.1 8.09 7.23 11.9
Winnipeg 8.73 7.63 14.4 8.75 7.48 17.0 6.74 5.76 17.0
Average 13.29 12.07 10.1 13.82 12.27 12.6 12.29 10.97 12.0
American cities
Boston 16.50 16.50 0.0 18.34 17.57 4.4 14.71 14.15 4.0
Chicago 12.94 11.43 13.2 11.38 10.20 11.6 7.27 6.27 15.9
Detroit 17.24 15.54 10.9 14.33 12.91 11.0 11.10 10.00 11.0
Houston 10.20 10.10 1.0 9.92 9.18 8.1 9.01 8.42 7.0
Miami 10.86 9.46 14.8 11.99 9.74 23.1 9.50 7.76 22.4
Nashville 10.62 10.62 0.0 11.64 10.88 7.0 10.04 9.38 7.0
New York 23.67 21.75 8.8 22.00 19.70 11.7 17.40 15.58 11.7
Portland, OR 10.80 10.63 1.6 9.98 9.83 1.5 7.57 7.46 1.5
San Francisco 24.69 22.94 7.6 19.15 17.79 7.6 15.18 14.09 7.7
Seattle 8.97 8.97 0.0 7.28 7.28 0.0 6.21 6.21 0.0
Average 14.65 13.79 6.2 13.60 12.51 8.7 10.80 9.93 8.7
Sources: Hydro-Quebec (2013); calculations by authors.

34 / Electricity rates in the US and Canada
fraserinstitute.org
spot when taxes are included. All of the other changes in rank that occur in both groups of cities involve only one positional change.
With regard to the small commercial customer class, including taxes increases the rates paid by electricity consumers in the 12 Canadian cities by 12.6 percent on average, whereas for the 10 US cities the average increase is only 8.7 percent. In Canada, the biggest impacts occur in Regina (20.4 per-cent), Winnipeg (17.0 percent), and Montreal and Halifax (at 15.0 percent each). In the group of 10 US cities the largest impacts of taxes on electricity in this case occur in Miami (23.1 percent) and New York (11.7 percent). For this rate class the greatest change in rank among the Canadian cities when taxes are applied occurs in the case of Edmonton, which rises to 6th place (of 12) from 9th position. Among the US cities, Miami drops to 6th spot (of 10) from third; all other changes in rank only involve a single position.
The greater percentage impact of taxes on electricity rates in Canada than in the US that was seen with residential and small commercial rates is also evident with the rates for small industrial service—with rates in the 12 Canadian cities being impacted by 12.0 percent on average, compared with only 8.7 percent for the 10 US cities. Again, in Canada the largest impact is felt in Regina (20.5 percent) but Winnipeg consumers are hit hard by taxes as well (17.0 percent). Similar to the small commercial rate class, the US city where electricity rates are most affected by taxes is Miami (22.4 percent), but Chicago (15.9 percent) and New York (11.7 percent) are also impacted signifi-cantly. In the small industrial customer rate class the changes that occur in both the Canadian and US city rankings when taxes are included are limited to one-position changes.

fraserinstitute.org / 35
Summary of selected electricity rate comparisons
Earlier, in the section How the rates compare, it was indicated that Canadian electricity rates tend to be higher, on average, than the average for all of the 119 cities included in the two surveys. As indicated in table 9, the average rate for the residential rate class is virtually the same for cities in both coun-tries. But when outlier Honolulu is excluded from the US group of cities, the residential rate is 1.5 percent greater in Canada.
For the small commercial power demand classification, the average rate is 17.1 percent greater in Canada with Honolulu included in the US average, but 19 percent greater when Honolulu is excluded. With regard to the small industrial demand rate class, the average Canadian rate is 26.2 percent greater than the comparable US rate with Honolulu included but 28.9 percent greater when it is not. These comparisons indicate that, in general, both small and large Canadian businesses face a significant and troubling cost disadvantage relative to their American peers.
Looking only at those cities which are located in states and provinces where hydro capacity is not the dominant mode of available electric genera-tion capacity—i.e., excluding cities in Quebec, Manitoba, British Columbia, Idaho, Montana, Oregon, South Dakota, and Washington—the differences between the two countries are worse. With Honolulu included, on average Canadian rates are 9.6 percent, 27.8 percent, and 39.5 percent greater than US rates in the residential, commercial, and industrial rate classes, respectively. With Honolulu excluded, the percentage differences are 11.4 percent, 30.0 percent, and 42.7 percent, respectively. Such significant differences should be a matter of great concern to Canadian policy makers. Not only are resi-dential electricity consumers in many parts of Canada, including Ontario and Alberta, disadvantaged relative to most American consumers, but com-mercial and industrial electricity users are too—and to a much greater extent.

36 / Electricity rates in the US and Canada
fraserinstitute.org
Table 9: Selected Canadian and US electricity rate comparisons
Cents per kWh
Residential Small commercial Small industrial
All cities
Canadian cities average 12.07 13.29 10.97
US cities average 12.08 11.35 8.69
Differences -0.01 1.94 2.28
% by which Canadian rates exceed US rates on average -0.1 17.1 26.2
All cities excluding Honolulu
Canadian cities average 12.07 13.29 10.97
US cities with Honolulu excluded 11.89 11.17 8.51
Differences 0.18 2.12 2.46
% by which Canadian rates exceed US rates on average 1.5 19.0 28.9
All cities in jurisdictions where hydro not dominant
Canadian cities not in hydro dominant QC., MB, or BC 13.49 14.82 12.36
US cities not in hydro dominant states 12.31 11.60 8.86
Differences 1.18 3.22 3.5
% by which Canadian rates exceed US rates on average 9.6 27.8 39.5
All cities in jurisdictions where hydro not dominant, excluding Honolulu
Canadian cities not in hydro dominant QC, MB, or BC 13.49 14.82 12.36
US cities not in hydro dominant states or Honolulu 12.11 11.40 8.66
Differences 1.38 3.42 3.7
% by which Canadian rates exceed US rates on average 11.4 30.0 42.7
Sources: Hydro-Quebec (2013); Lincoln Nebraska Electric System (2013); calculations by authors.

fraserinstitute.org / 37
Conclusions
Comparison of electricity rates in Canadian and US cities indicates that there are vast three- to four-fold and even greater differences between rates in cities like Montreal, Tulsa, Lincoln, and Tacoma on the one hand and Calgary, San Francisco, New York, and Honolulu on the other. Our search for explanations for the stark differences led us to conclude that Canadian consumers are paying more—on average—for electricity due in part to the shift away from less expen-sive coal-fired generation, as in Ontario, and insufficient reliance on natural gas for baseload generation, especially in gas-supply-rich provinces such as Alberta.
We found that having nuclear power as the major source of the elec-tricity that is produced may contribute to higher electricity rates.
Somewhat surprisingly, in view of today’s low natural gas prices, on average cities located in jurisdictions where natural gas combustion is major source of electricity appear to have higher electricity rates than the others. This may be because, in a number of such jurisdictions, gas-fired capacity is mainly being used to meet peak rather than baseload (24/7) demand. Further, many states where gas-fired capacity is dominant, such as Massachusetts, New York, and New Jersey, are net importers of gas, with the result that the delivered cost to the generators is much greater than in gas dominant states such as Texas, Louisiana, and Oklahoma, which are net exporters of gas. Tulsa, OK, for example, has the lowest commercial and industrial rates and the third lowest residential rates overall.
A factor that seems to contribute to lower electric rates is the pres-ence of hydroelectric capacity as the dominant mode of electric generation in the jurisdiction where a city is located. This appears to explain why cities in Quebec, Manitoba, British Columbia, Idaho, Washington State, and Oregon enjoy lower electricity rates than many other cities.
Cities located in jurisdictions where coal combustion is the major source of the electricity that is produced also have distinctly lower electricity rates, on average, across all three customer demand classifications than other cities.
As noted in the preceding section, many Canadian electricity consum-ers face significantly higher rates than US consumers. Consumers in cities in the non-hydro-dominant provinces such as Alberta, Saskatchewan, Ontario, New Brunswick, and Nova Scotia appear to be hit the hardest.

38 / fraserinstitute.org
Policy recommendations
In view of the foregoing analysis and discussion, Canadian and provincial policy makers need to focus on measures that will help to secure lower elec-tricity costs for future generations and reduce the disparity between Canadian and US electricity rates. In this regard, it is recommended that:
• Where they can compete with other sources of electricity, remaining undeveloped hydro resources (as in British Columbia, Manitoba, Quebec, Newfoundland and Labrador, and elsewhere) should be developed because of the stability that hydroelectric capacity can provide to electricity rates.25
• Given the favourable long-term outlook for natural gas supply and prices as a consequence of technological advances which allow gas production from shale gas formations, investment in state-of the-art advanced technology combined-cycle gas generators should be facilitated in order to help meet the anticipated growth in baseload electricity demand requirements (as opposed to the historical preference for mainly confining gas-fired generation to peak periods).
• Uncertainties with respect to regulations pertaining to air pollution and greenhouse gas emissions from existing and new coal-fired electric generation plants, as well as other fossil fuel combustion generation facilities, should be clarified so that investors can know the costs they would face if they proceed with investment plans.
• Investment in coal-fired generation should be encouraged where competitive with other resources and technologies when the costs of meeting prudent, science-based environmental emissions regulations are taken into account.
25. The current economic situation, with interest rates near historic lows, may provide a window of opportunity for financing projects with large capital costs.

Electricity rates in the US and Canada / 39
fraserinstitute.org
• Subsidies and incentives to foster investment in wind power and other renewable energy technologies—policies intended to level the playing field between polluting and non-polluting electric generation facilities, such as Ontario’s feed-in-tariff guarantees, and charges on emissions of airborne pollutants and greenhouse gas emissions from fossil fuel combustion generation facilities—should be re-examined to ensure that electricity consumers and taxpayers are not unduly penalized.
• Opportunities should be sought for increased interprovincial electricity trade, opportunities which are likely to benefit electricity consumers in spite of the costs required to expand and/or upgrade existing transmission systems and interconnection capacities.
• Canadian and US provincial and state governments, and the electric utilities, should explore opportunities for increased electricity trade so that high cost jurisdictions may benefit from power imports. From Canada’s perspective, this could help to ensure that as much as possible of the capacity of new hydro and other baseload generation facilities (that can compete in US states because of relatively low marginal costs) can be utilized at the time of commissioning. Similarly, opportunities for seasonal diversity interchange should be explored (e.g., exporting from winter peak areas during summer when power is needed in summer-peaking jurisdictions such as New York, and vice versa).
• In provinces where electric generation continues to be regulated, regulators should develop comprehensive long-term electricity supply plans designed to minimize consumers’ future energy costs. Such plans should not only take into account the full range of technologies available for increasing generation capacity in regulators’ respective jurisdictions, but also the potential for importing electricity supplies if that option is among the least-cost alternatives.
• In provinces where electricity generation facilities are wholly or mostly owned and operated by the Crown, invitations to bid to supply incremental baseload capacity should be issued from time to time, as required, to investors fully knowledgeable of the available resources and technologies, with the objective of ensuring that incremental supply costs can be minimized.

40 / fraserinstitute.org
References
Alberta Department of Energy (2014). Electricity Statistics. <http://www.energy.alberta.ca/Electricity/682.asp>
Alberstat, JoAnn (2013, September 15). Soaring Power Bills Key Election Issue. Halifax Chronicle Herald.
Angevine, Gerry, Carlos Murillo, and Nevena Pencheva (2012). A Sensible Strategy for Renewable Electrical Energy in North America. Fraser Institute. <http://www.fraserinstitute.org/uploadedFiles/fraser-ca/Content/research-news/research/publications/sensible-strategy-renewable-electrical-energy.pdf>
Hydro-Quebec (2013). Comparison of Electricity Prices in Major North American Cities. <http://www.hydroquebec.com/publications/en/comparison_prices/pdf/comp_2013_en.pdf>
International Energy Agency [IEA] (2010, March). Projected Costs of Generating Electricity.
Lincoln Electric System (2013). National Electric Rate Survey. <http://www.les.com/pdf/ratesurvey.pdf>
Manitoba Hydro (2013). Utility Rate Comparisons: Survey of Canadian Electricity Bills — Effective May 1, 2013. <http://www.hydro.mb.ca/regulatory_affairs/energy_rates/electricity/utility_rate_comp.shtml>
National Energy Board (2013, November). Reference Case – Generation by Primary Fuel Canada’s Energy Future. Appendices to Canada’s Energy Future. <http://www.neb-one.gc.ca/clf-nsi/rnrgynfmtn/nrgyrprt/nrgyftr/2013/ppndcs/pxlctrctgnrtn-eng.html>
All websites retrievable as of March 6, 2013.
Electricity rates in the US and Canada / 41
fraserinstitute.org
NB Power (2013). Generation. <http://www.nbpower.com/html/en/about/operating/generation.html>
Newfoundland Power (2013). About Us. <http://www.newfoundlandpower.com/AboutUs/Profile.aspx>
Newfoundland and Labrador Hydro (2013). Operations. <https://www.nlh.nl.ca/hydroweb/nlhydroweb.nsf/TopSubContent/Operations-Hydro%20Generation?OpenDocument>
Nova Scotia Power (2013a). How We Make Electricity. <https://www.nspower.ca/en/home/about-us/how-we-make-electricity/default.aspx>
Nova Scotia Power (2013b). 10 Year System Outlook Report. Section 4, Generation Resources. <http://oasis.nspower.ca/site/media/oasis/20130702%20NSPI%20to%20UARB%2010%20Year%20System%20Outlook%20Report%20FILED.pdf>
Ontario Independent Electric System Operator (2013). Supply Overview. <http://www.ieso.ca/Pages/Power-Data/Supply.aspx>
SaskPower (2013). Our Facilities and Electric System Map. <http://www.saskpower.com/about-us/our-company-and-strategic-direction/our-facilities-and-system-map/?linkid=MM_facilities_systems_map>
Statistics Canada (2013a). Population of Census Metropolitan Areas, 2012. <http://www.statcan.gc.ca/tables-tableaux/sum-som/l01/cst01/demo05a-eng.htm>
Statistics Canada (2013b). Census Agglomeration of Charlottetown, 2011. <http://www12.statcan.ca/census-recensement/2011/as-sa/fogs-spg/Facts-cma-eng.cfm?LANG=Eng&GK=CMA&GC=105>
Statistics Canada (2014). Electric Power Generation by Class of Electricity Producer. CANSIM Table 127-0007. <http://www5.statcan.gc.ca/cansim/a05?lang=eng&id=1270007&pattern=1270007&searchTypeByValue=1&p2=35>
US Census (2013a). Large Metropolitan Statistical Areas – Population: 1990 to 2010. <http://www.census.gov/compendia/statab/2012/tables/12s0020.pdf>
US Census (2013b). 2010 Population Finder. <http://www.census.gov/popfinder/>

42 / Electricity rates in the US and Canada
fraserinstitute.org
US Energy Information Administration [EIA] (2011). Annual Energy Outlook 2011: Levelized Cost of New Generation Resources in Annual Energy Outlook 2011. <http://www.eia.gov/forecasts/aeo/electricity_generation.cfm#3>
US Energy Information Administration [EIA] (2013a). Annual Tabulation of Electric Generation Capacity by State. <http://www.eia.gov/electricity/data/state/> (Please see file “Existing Nameplate and Net Summer Capacity”.)
US Energy Information Administration [EIA] (2013b). Annual tabulation of Electric Generation by State. <http://www.eia.gov/electricity/data/state/> (Please see file “Net Generation by State by Type of Producer by Energy Source”.)
US Energy Information Administration [EIA] (2014). Fuel Receipts and Cost Time Series File (from Form 923). <http://www.eia.gov/electricity/data/eia923/>
Wikipedia (2013). List of electrical generating stations in New Brunswick. <http://en.wikipedia.org/wiki/List_of_electrical_generating_stations_in_New_Brunswick>

Electricity rates in the US and Canada / 43
fraserinstitute.org
About the authors
Gerry AngevineGerry Angevine is a Fraser Institute Senior Fellow. From July 2006 to the end of 2012 he was a Senior Economist with the Institute with responsibility for energy policy studies. He launched the global Petroleum Survey in 2007. Dr. Angevine has been President of Angevine Economic Consulting Ltd., an en-ergy economics consulting firm, since 1999, and was a Managing Consultant with Navigant Consulting Ltd. from 2001 to 2004. He was President, CEO, and a Director of the Canadian Energy Research Institute from 1979 to 1999. Gerry has advised the Alberta Department of Energy and testified before the National Energy Board as an expert witness. He has also written analy-ses for the Fraser Institute of Ontario’s 2007 Integrated Power System Plan and Alberta electric transmission policy as well as several studies addressing aspects of a continental energy strategy and policy changes required to expe-dite investment in Canadian crude oil and natural gas transportation infra-structure. He has A.M. and Ph.D. degrees in Economics from the University of Michigan, an M.A. Economics degree from Dalhousie University, and a B.Com. degree from Mount Allison University.
Kenneth P. GreenKenneth P. Green is Senior Director of Natural Resource Studies at the Fraser Institute. He received his doctorate in Environmental Science and Engineering from the University of California, Los Angeles (UCLA), an M.S. in Molecular Genetics from San Diego State University, and a B.S. Biology from UCLA. Dr. Green has studied public policy involving risk, regulation, and the environment for more than 16 years at public policy research insti-tutions across North America. He has an extensive publication list of policy studies, magazine articles, opinion columns, book and encyclopedia chapters, and two supplementary textbooks on climate change and energy policy in-tended for middle-school and collegiate audiences respectively. Ken’s writing has appeared in major newspapers across the US and Canada, and he is a regular presence on both Canadian and American radio and television. Ken has testified before several state legislatures and regulatory agencies, as well as giving testimony to a variety of committees of the US House and Senate.

44 / Electricity rates in the US and Canada
fraserinstitute.org
Acknowledgments
The authors are indebted to the anonymous reviewers for their comments, suggestions, and insights. Any remaining errors or oversights are the sole responsibility of the authors. As the researchers worked independently, the views and conclusions expressed in this paper do not necessarily reflect those of the Board of Trustees of the Fraser Institute, the staff, or supporters.

Electricity rates in the US and Canada / 45
fraserinstitute.org
Publishing information
DistributionThese publications are available from <http://www.fraserinstitute.org> in Portable Document Format (PDF) and can be read with Adobe Acrobat® or Adobe Reader®, versions 7 or later. Adobe Reader® XI, the most recent ver-sion, is available free of charge from Adobe Systems Inc. at <http://get.adobe.com/reader/>. Readers having trouble viewing or printing our PDF files us-ing applications from other manufacturers (e.g., Apple’s Preview) should use Reader® or Acrobat®.
Ordering publicationsTo order printed publications from the Fraser Institute, please contact the publications coordinator:
• e-mail: [email protected] • telephone: 604.688.0221 ext. 580 or, toll free, 1.800.665.3558 ext. 580 • fax: 604.688.8539.
MediaFor media enquiries, please contact our Communications Department:
• 604.714.4582 • e-mail: [email protected].
CopyrightCopyright © 2014 by the Fraser Institute. All rights reserved. No part of this publication may be reproduced in any manner whatsoever without written permission except in the case of brief passages quoted in critical articles and reviews.
Date of issue May 2014
ISBN 978-0-88975-290-0
CitationAngevine, Gerry, and Kenneth P. Green (2014). Paying More for Power: Electricity Rates in the US and Canada. Fraser Institute.<http://www.fraserinstitute.org>
Cover illustration Bill C. Ray

46 / Electricity rates in the US and Canada
fraserinstitute.org
Supporting the Fraser Institute
To learn how to support the Fraser Institute, please contact
• Development Department, Fraser Institute Fourth Floor, 1770 Burrard Street Vancouver, British Columbia, V6J 3G7 Canada
• telephone, toll-free: 1.800.665.3558 ext. 586
• e-mail: [email protected]
Lifetime patronsFor their long-standing and valuable support contributing to the success of the Fraser Institute, the following people have been recognized and inducted as Lifetime Patrons of the Fraser Institute.
Sonja Bata
Charles Barlow
Ev Berg
Art Grunder
Jim Chaplin
Serge Darkazanli
John Dobson
Raymond Heung
Bill Korol
Bill Mackness
Fred Mannix
Jack Pirie
Con Riley
Catherine Windels

Electricity rates in the US and Canada / 47
fraserinstitute.org
Purpose, funding, & independence
The Fraser Institute provides a useful public service. We report objective information about the economic and social effects of current public policies, and we offer evidence-based research and education about policy options that can improve the quality of life.
The Institute is a non-profit organization. Our activities are funded by charitable donations, unrestricted grants, ticket sales, and sponsorships from events, the licensing of products for public distribution, and the sale of publications.
All research is subject to rigorous review by external experts, and is conducted and published separately from the Institute’s Board of Trustees and its donors.
The opinions expressed by the authors are those of the individuals themselves, and do not necessarily reflect those of the Institute, its Board of Trustees, its donors and supporters, or its staff. This publication in no way implies that the Fraser Institute, its trustees, or staff are in favour of, or op-pose the passage of, any bill; or that they support or oppose any particular political party or candidate.
As a healthy part of public discussion among fellow citizens who de-sire to improve the lives of people through better public policy, the Institute welcomes evidence-focused scrutiny of the research we publish, including verification of data sources, replication of analytical methods, and intelligent debate about the practical effects of policy recommendations.

48 / Electricity rates in the US and Canada
fraserinstitute.org
About the Fraser Institute
Our vision is a free and prosperous world where individuals benefit from greater choice, competitive markets, and personal responsibility. Our mission is to measure, study, and communicate the impact of competitive markets and government interventions on the welfare of individuals.
Founded in 1974, we are an independent Canadian research and edu-cational organization with locations throughout North America and interna-tional partners in over 85 countries. Our work is financed by tax-deductible contributions from thousands of individuals, organizations, and foundations. In order to protect its independence, the Institute does not accept grants from government or contracts for research.
Nous envisageons un monde libre et prospère, où chaque personne bénéfi-cie d’un plus grand choix, de marchés concurrentiels et de responsabilités individuelles. Notre mission consiste à mesurer, à étudier et à communiquer l’effet des marchés concurrentiels et des interventions gouvernementales sur le bien-être des individus.
Peer review —validating the accuracy of our researchThe Fraser Institute maintains a rigorous peer review process for its research. New research, major research projects, and substantively modified research conducted by the Fraser Institute are reviewed by experts with a recognized expertise in the topic area being addressed. Whenever possible, external review is a blind process. Updates to previously reviewed research or new editions of previously reviewed research are not reviewed unless the update includes substantive or material changes in the methodology.
The review process is overseen by the directors of the Institute’s re-search departments who are responsible for ensuring all research published by the Institute passes through the appropriate peer review. If a dispute about the recommendations of the reviewers should arise during the Institute’s peer review process, the Institute has an Editorial Advisory Board, a panel of scholars from Canada, the United States, and Europe to whom it can turn for help in resolving the dispute.

Electricity rates in the US and Canada / 49
fraserinstitute.org
Members
Past members
Editorial Advisory Board
* deceased; † Nobel Laureate
Prof. Terry L. Anderson
Prof. Robert Barro
Prof. Michael Bliss
Prof. Jean-Pierre Centi
Prof. John Chant
Prof. Bev Dahlby
Prof. Erwin Diewert
Prof. Stephen Easton
Prof. J.C. Herbert Emery
Prof. Jack L. Granatstein
Prof. Herbert G. Grubel
Prof. James Gwartney
Prof. Ronald W. Jones
Dr. Jerry Jordan
Prof. Ross McKitrick
Prof. Michael Parkin
Prof. Friedrich Schneider
Prof. Lawrence B. Smith
Dr. Vito Tanzi
Prof. Armen Alchian*
Prof. James M. Buchanan* †
Prof. Friedrich A. Hayek* †
Prof. H.G. Johnson*
Prof. F.G. Pennance*
Prof. George Stigler* †
Sir Alan Walters*
Prof. Edwin G. West*