pavement health track (pht) analysis tool graphical user interface ... · pavement health track...
TRANSCRIPT

Pavement Health Track (PHT) Analysis Tool Graphical User Interface
Hands-On Workbook Version 2.x
Federal Highway Administration Office of Asset Management
Sept 2013

(This page intentionally left blank)
Table of Contents
Chapter 1 – Software Installation ........................................................................................... 1
Chapter 2 – Getting Started with PHT .................................................................................... 3
Chapter 3 – Preparing for t he Analysis ................................................................................... 5
Chapter 4 – Working with Highway Data ................................................................................ 9
Chapter 5 – Running the Analysis ........................................................................................ 19
Chapter 6 – Working with GIS Selections ............................................................................ 25
Chapter 7 – Generating Reports .......................................................................................... 31
Chapter 8 – Corridor A nalysis .............................................................................................. 39
U.S. DOT FHWA - PHT i Hands-On Workbook

(This page intentionally left blank)
U.S. DOT FHWA - PHT ii Hands-On Workbook
1 2
3 4
Chapter 1 — Software Installation
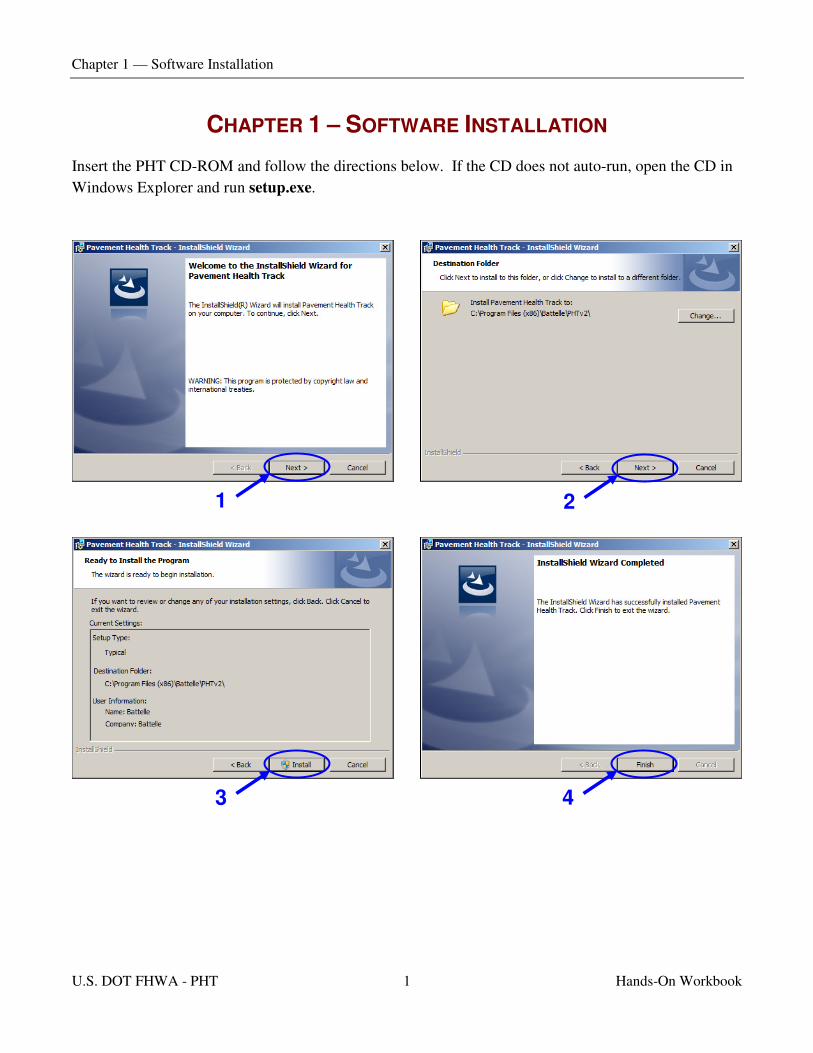
CHAPTER 1 – SOFTWARE INSTALLATION
Insert the PHT CD-ROM and follow the directions below. If the CD does not auto-run, open the CD in
Windows Explorer and run setup.exe.
U.S. DOT FHWA - PHT 1 Hands-On Workbook

Chapter 1 — Software Installation
(This page intentionally left blank)
U.S. DOT FHWA - PHT 2 Hands-On Workbook
Chapter 2 — Getting Started with PHT
CHAPTER 2 – GETTING STARTED WITH PHT
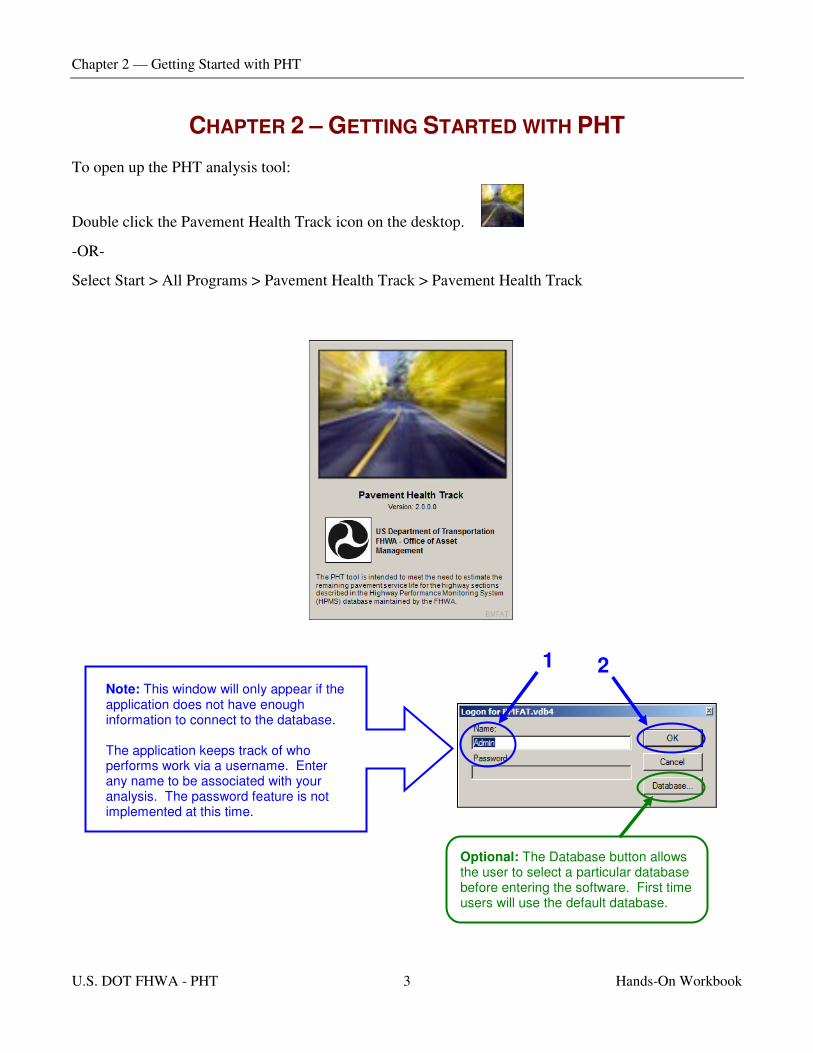
To open up the PHT analysis tool:
Double click the Pavement Health Track icon on the desktop.
-OR-
Select Start > All Programs > Pavement Health Track > Pavement Health Track
Note: This window will only appear if the application does not have enough information to connect to the database. The application keeps track of who performs work via a username. Enter any name to be associated with your analysis. The password feature is not implemented at this time.
1 2
Optional: The Database button allows the user to select a particular database before entering the software. First time users will use the default database.
U.S. DOT FHWA - PHT 3 Hands-On Workbook
Chapter 2 — Getting Started with PHT
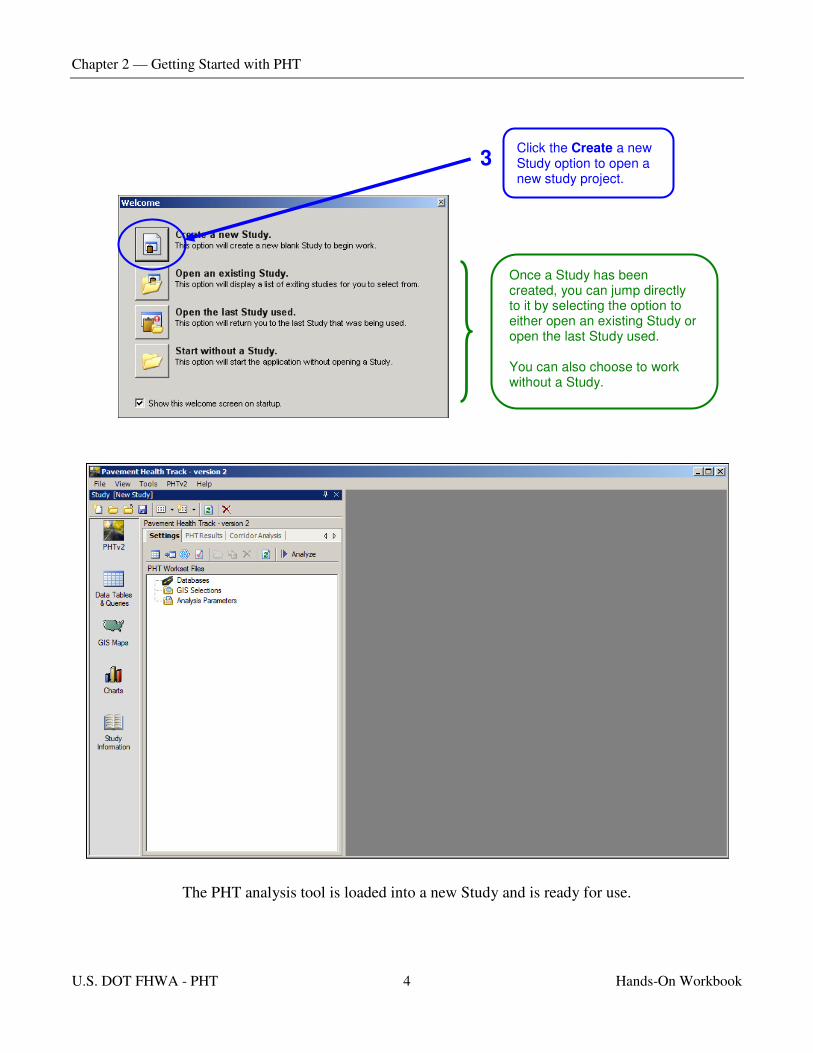
Click the Create a new 3 Study option to open a
new study project.
Once a Study has been created, you can jump directly to it by selecting the option to either open an existing Study or open the last Study used. You can also choose to work without a Study.
The PHT analysis tool is loaded into a new Study and is ready for use.
U.S. DOT FHWA - PHT 4 Hands-On Workbook

Chapter 3 — Preparing for the Analysis
CHAPTER 3 – PREPARING FOR THE ANALYSIS
Objective: View a nd modify the PHT Analysis Parameters.
Specifics: PHT ships with default analysis parameters based on National averages. Users may need
to customize the parameters to suit their own needs.
Use: PHT provides access to all of the parameters that affect the analysis including maximum
service life, terminal values, pavement estimates and distress weights.
Tasks: 1) View a nd modify PHT Analysis Parameters.
2) Override the national defaults with user customized values.
3) Restore the national default values.
U.S. DOT FHWA - PHT 5 Hands-On Workbook

Chapter 3 — Preparing for the Analysis
Click the New Parameters 1 button to create a new set of
PHT parameter metrics.
2 (Right-Click)
3 Click Open to display the parameter wizard.
Review and edit the maximum service life for various types of pavement treatments.
4 (Click Continue)
U.S. DOT FHWA - PHT 6 Hands-On Workbook
Chapter 3 — Preparing for the Analysis
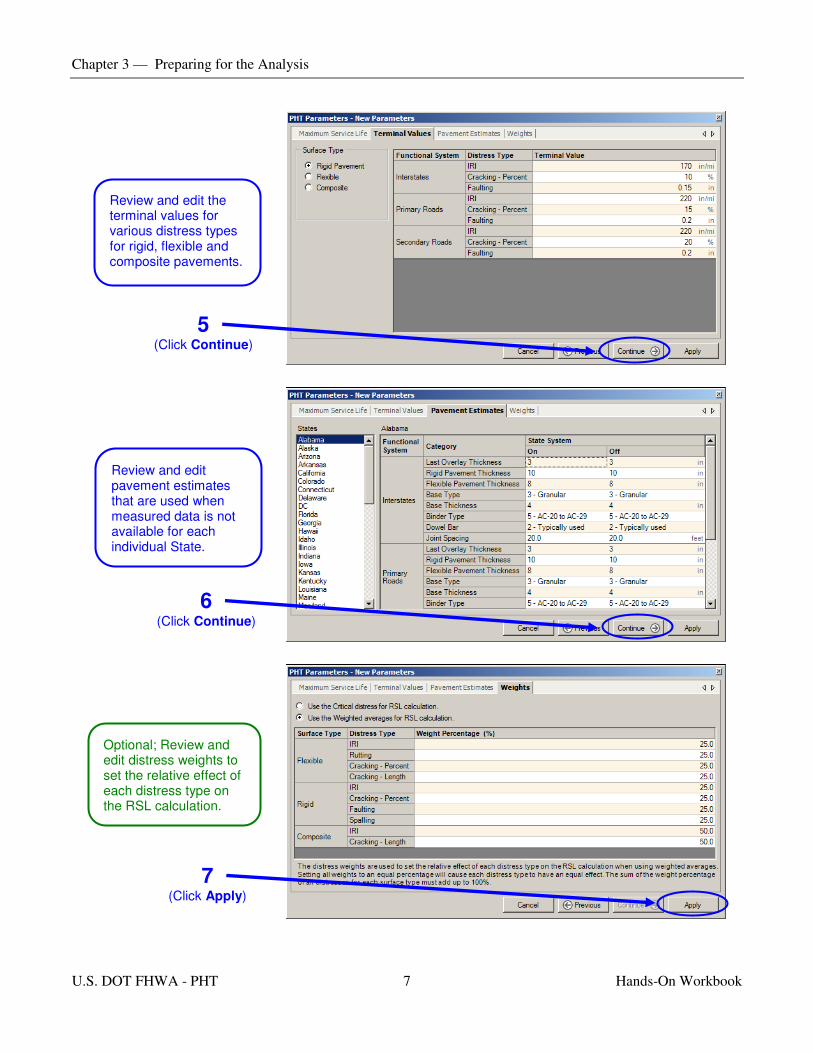
Review and edit the terminal values for various distress types for rigid, flexible and composite pavements.
5 (Click Continue)
Review and edit pavement estimates that are used when measured data is not available for each individual State.
6 (Click Continue)
Optional; Review and edit distress weights to set the relative effect of each distress type on the RSL calculation.
7 (Click Apply)
U.S. DOT FHWA - PHT 7 Hands-On Workbook

Chapter 3 — Preparing for the Analysis
8 (Right-Click)
Click the Save as Default Parameters menu item to override the national
9 default values for the PHT parameter metrics.
9a (Click OK)
10 (Right-Click)
Click the Restore National Defaults menu item to reset the parameter metrics back to the national default values.
11 Note: This option does not remove the override created in the previous step. It simply restores this instance of the parameter metrics to the national default values.
11a (Click OK)
U.S. DOT FHWA - PHT 8 Hands-On Workbook
Chapter 4 — Working with Highway Data
CHAPTER 4 – WORKING WITH HIGHWAY DATA
Objective: Become familiar with the features of the PHT tool for reading, viewing, editing, and
selecting highway data records for the PHT analysis.
Specifics: The Highway Data file is a user-provided data file which describes several different
characteristics and variables associated with each road section in the user’s system.
The characteristics include:
• Identification Information such as State, County, Route ID;
• Pavement Characteristics, such as pavement type, thickness, roughness, rutting,
faulting, cracking, etc.
• Traffic/Capacity Data such as AADT, speed limit, peak capacity, percent trucks
and future year AADT forecasts.
Formatted similar to the highway performance monitoring system (HPMS 2010) data, the
data needs to be in the same order and same structure as HPMS as defined in the HPMS
Field manual, appendix G. The source highway data can also be in other formats such as
comma-delimited CSV o r DBF files or other ODBC connective data sources that can be
manually mapped to the PHT database schema.
Use: The PHT tool provides very powerful features to allow a user to view and select highway
sections for analysis both manually and automatically using SQL queries.
Tasks: 1) Read highway data from an HPMS 2010 formatted file.
2) View a nd manipulate the highway data.
3) Select records for analysis.
4) Create copies of the highway data.
5) View a summary of the highway data.
U.S. DOT FHWA - PHT 9 Hands-On Workbook
Chapter 4 — Working with Highway Data
1
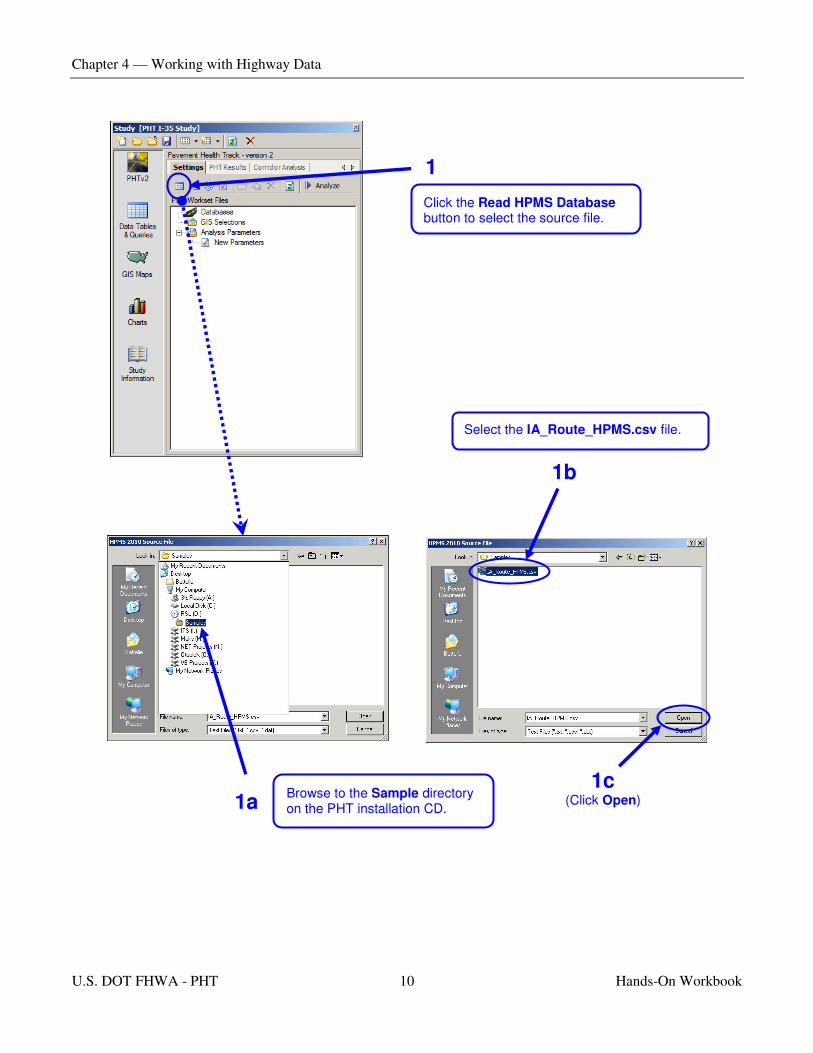
Click the Read HPMS Database button to select the source file.
Select the IA_Route_HPMS.csv file.
1b
1c Browse to the Sample directory
1a (Click Open) on the PHT installation CD.
U.S. DOT FHWA - PHT 10 Hands-On Workbook
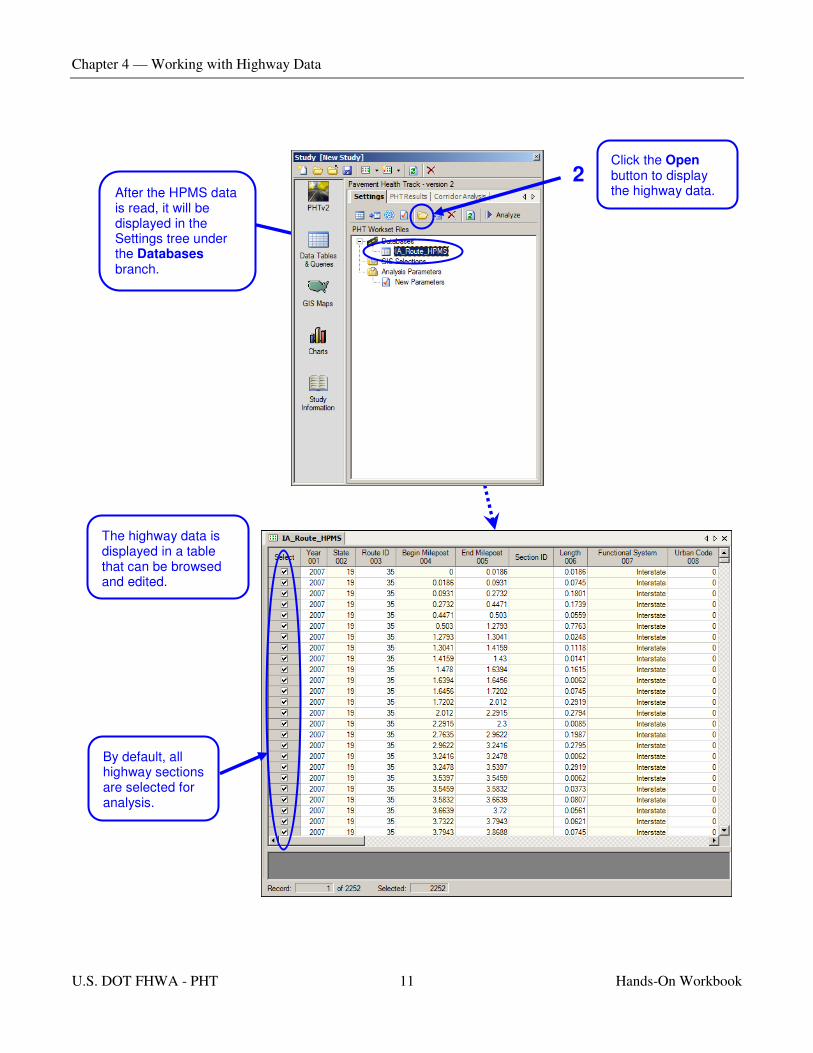
After the HPMS data is read, it will be displayed in the Settings tree under the Databases branch.
Click the Open
2 button to display the highway data.
The highway data is displayed in a table that can be browsed and edited.
By default, all highway sections are selected for analysis.
Chapter 4 — Working with Highway Data
U.S. DOT FHWA - PHT 11 Hands-On Workbook
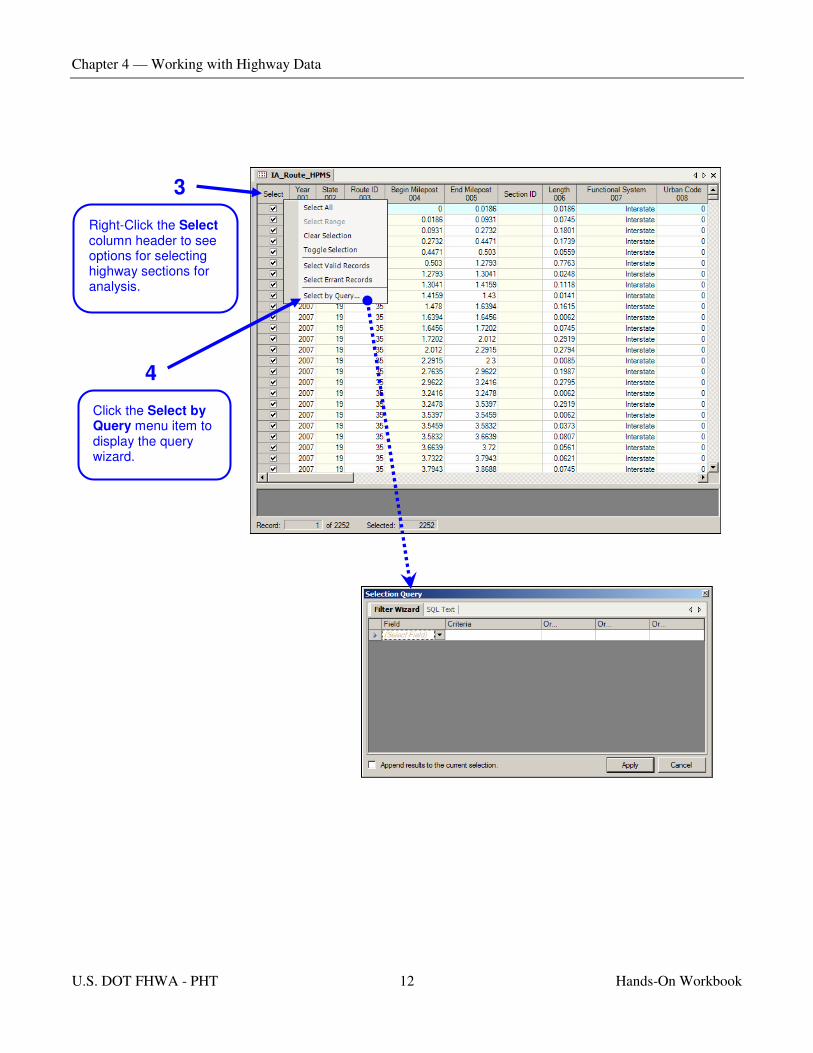
3
Right-Click the Select column header to see options for selecting highway sections for analysis.
4
Click the Select by Query menu item to display the query wizard.
Chapter 4 — Working with Highway Data
U.S. DOT FHWA - PHT 12 Hands-On Workbook
Chapter 4 — Working with Highway Data
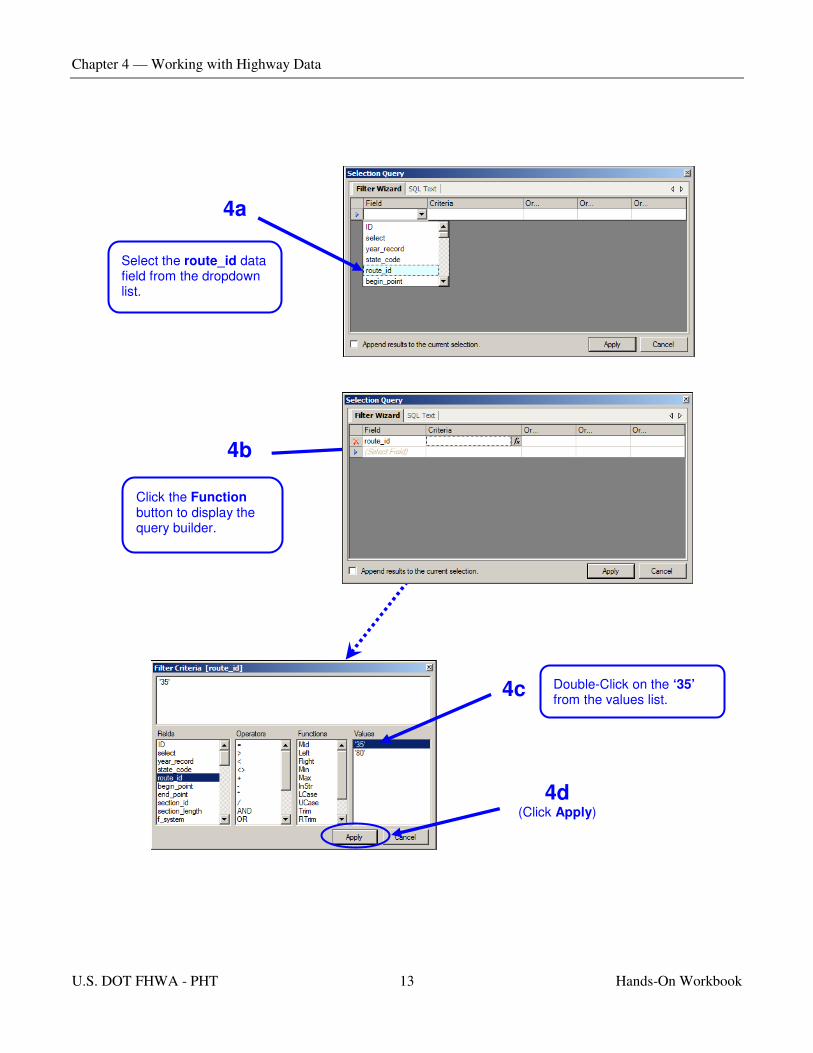
4a
Select the route_id data field from the dropdown list.
4b
Click the Function button to display the query builder.
4c Double-Click on the ‘35’ from the values list.
4d (Click Apply)
U.S. DOT FHWA - PHT 13 Hands-On Workbook
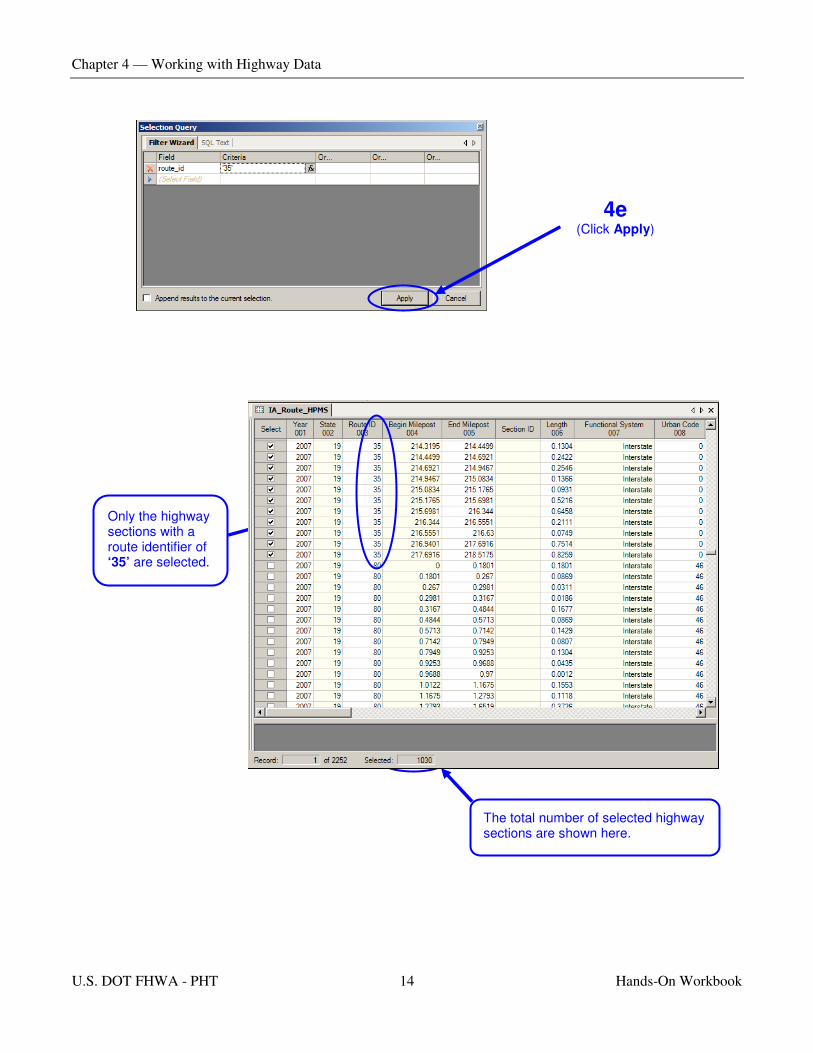
4e (Click Apply)
Chapter 4 — Working with Highway Data
Only the highway sections with a route identifier of ‘35’ are selected.
The total number of selected highway sections are shown here.
U.S. DOT FHWA - PHT 14 Hands-On Workbook
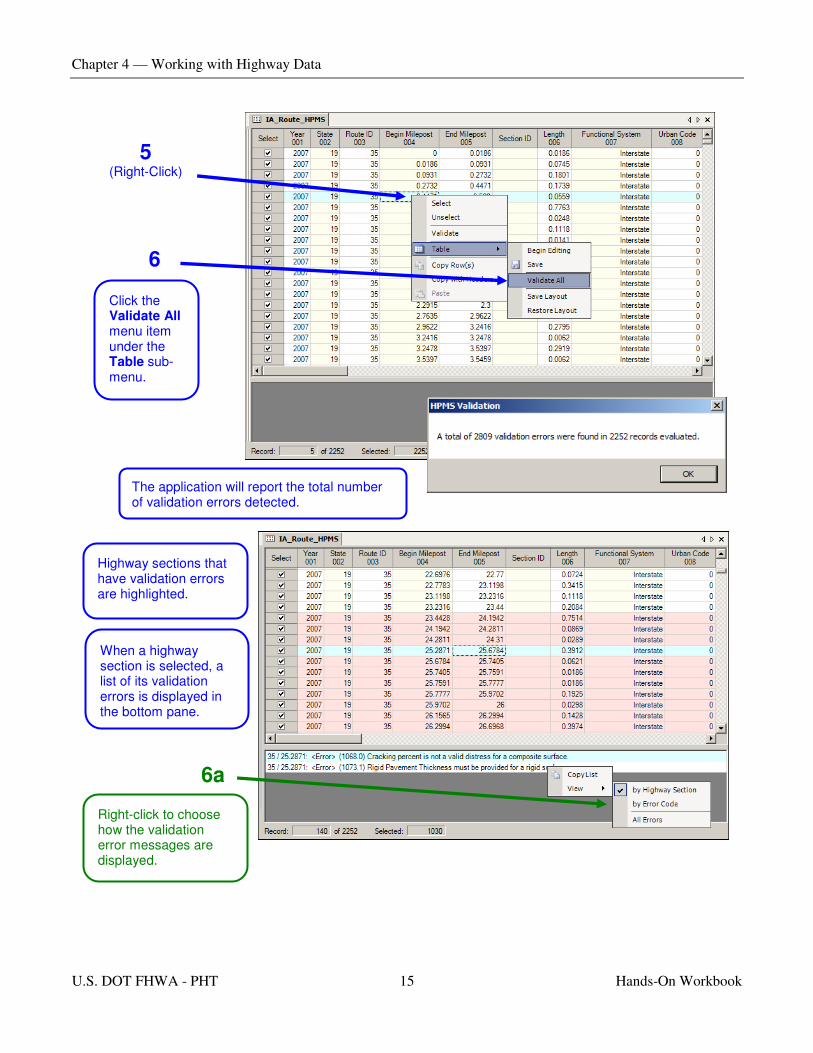
5 (Right-Click)
6
Click the Validate All menu item under the Table submenu.
The application will report the total number of validation errors detected.
Chapter 4 — Working with Highway Data
Highway sections that have validation errors are highlighted.
When a highway section is selected, a list of its validation errors is displayed in the bottom pane.
6a
Right-click to choose how the validation error messages are displayed.
U.S. DOT FHWA - PHT 15 Hands-On Workbook

Chapter 4 — Working with Highway Data
7 (Double-Click)
A panel expands from the left of the window that shows the data items for the selected highway section in a more convenient vertical format.
U.S. DOT FHWA - PHT 16 Hands-On Workbook

Chapter 4 — Working with Highway Data
8 (Click Summary)
9b (Click Refresh)
9a
Select a set of Analysis Parameters to use for the summary.
The summary window summaries the entire data set and shows the percent of deficient highway sections and the minimum, maximum and average distress values for each pavement type.
U.S. DOT FHWA - PHT 17 Hands-On Workbook
Chapter 4 — Working with Highway Data
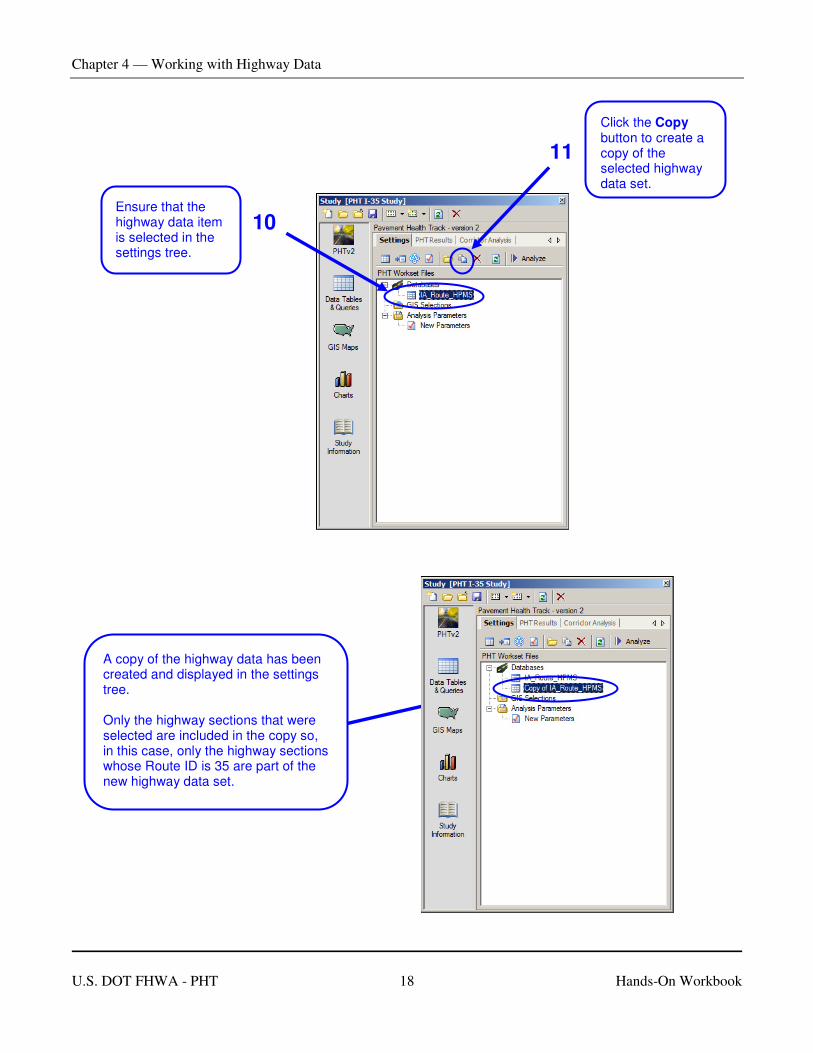
Ensure that the highway data item 10 is selected in the settings tree.
Click the Copy button to create a
11 copy of the selected highway data set.
A copy of the highway data has been created and displayed in the settings tree.
Only the highway sections that were selected are included in the copy so, in this case, only the highway sections whose Route ID is 35 are part of the new highway data set.
U.S. DOT FHWA - PHT 18 Hands-On Workbook
Chapter 5 — Running the Analysis
CHAPTER 5 – RUNNING THE ANALYSIS
Objective: To perform the PHT Analysis using settings from previous exercise.
Specifics: Use the PHT analysis run wizard to select the highway data, parameter analysis and
historical data to conduct the PHT analysis and view t he results.
Use: The PHT analysis is a complex process that uses many inputs. The run wizard makes it
simple for the user to select the input data and parameters and conduct the analysis.
Tasks: 1) Review c omponents of the analysis run
2) Conduct the PHT analysis
3) View t he analysis results.
4) View a summary of the results for each record.
5) View t he analysis log.
6) Apply the maintenance model to the analysis results.
U.S. DOT FHWA - PHT 19 Hands-On Workbook

Click the Analyze button to 1 launch the PHT analysis
run wizard.
Enter a descriptive name for the analysis. 2
Select the highway data and analysis parameters to be used in the analysis.
3 Note: Only Route 35 highway sections are selected. (Chapter 4)
Optional; Select historical sets of highway data to be used for the calibration of the analysis. You may choose up to five reference 4 years; the years do not need to be contiguous.
Optional; Check this option to have the PHT analysis calculate 5 the reliability RSL value. 6
(Click Run)
Chapter 5 — Running the Analysis
U.S. DOT FHWA - PHT 20 Hands-On Workbook
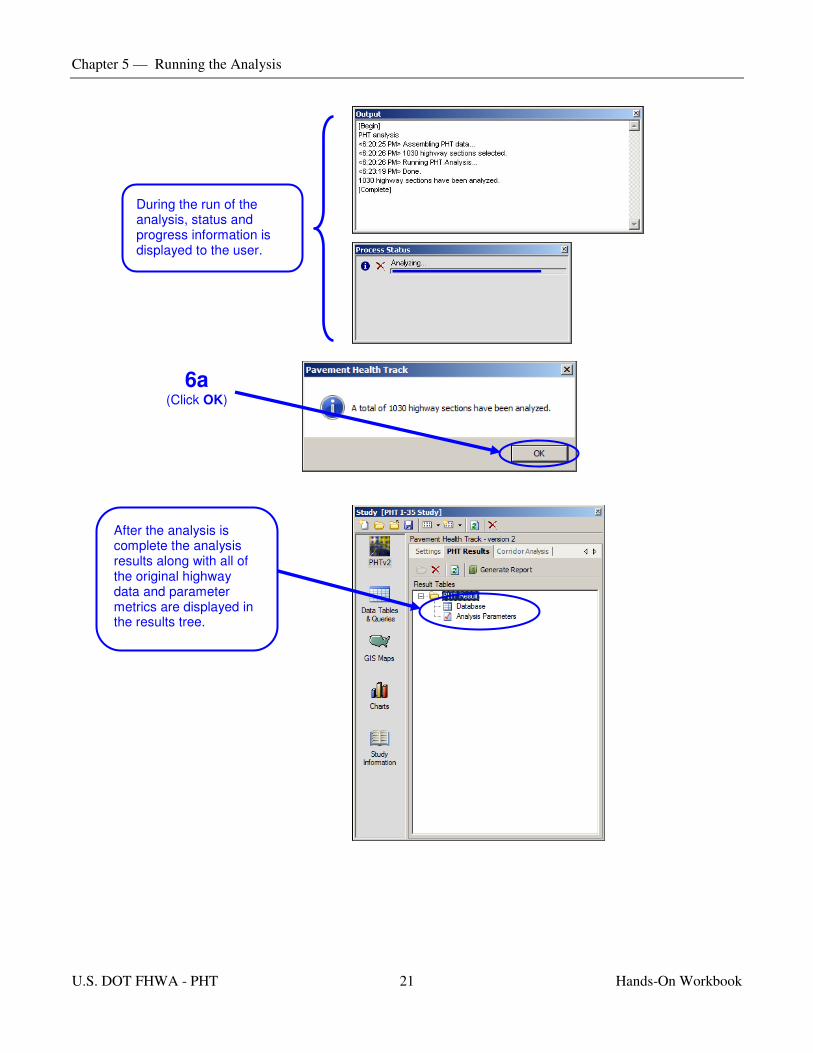
During the run of the analysis, status and progress information is displayed to the user.
6a (Click OK)
Chapter 5 — Running the Analysis
After the analysis is complete the analysis results along with all of the original highway data and parameter metrics are displayed in the results tree.
U.S. DOT FHWA - PHT 21 Hands-On Workbook

The PHT Analysis results for the selected highway section are displayed in the left window.
Click the Open button to display
7 the original highway data and the PHT analysis results.
The original highway data is displayed in the right window.
Chapter 5 — Running the Analysis
U.S. DOT FHWA - PHT 22 Hands-On Workbook

Click the Summary tab to view a 8 summary of the PHT analysis for
the selected highway section.
The summary highlights the estimated RSL for the pavement surface and illustrates the distresses and service life limits that contributed to the RSL estimate.
The summary also annotates the analysis with notes that describe the pavement construction and any unusual conditions in the data.
Chapter 5 — Running the Analysis
Click the Log tab to view a log of 9 the analysis for the selected
highway section.
U.S. DOT FHWA - PHT 23 Hands-On Workbook
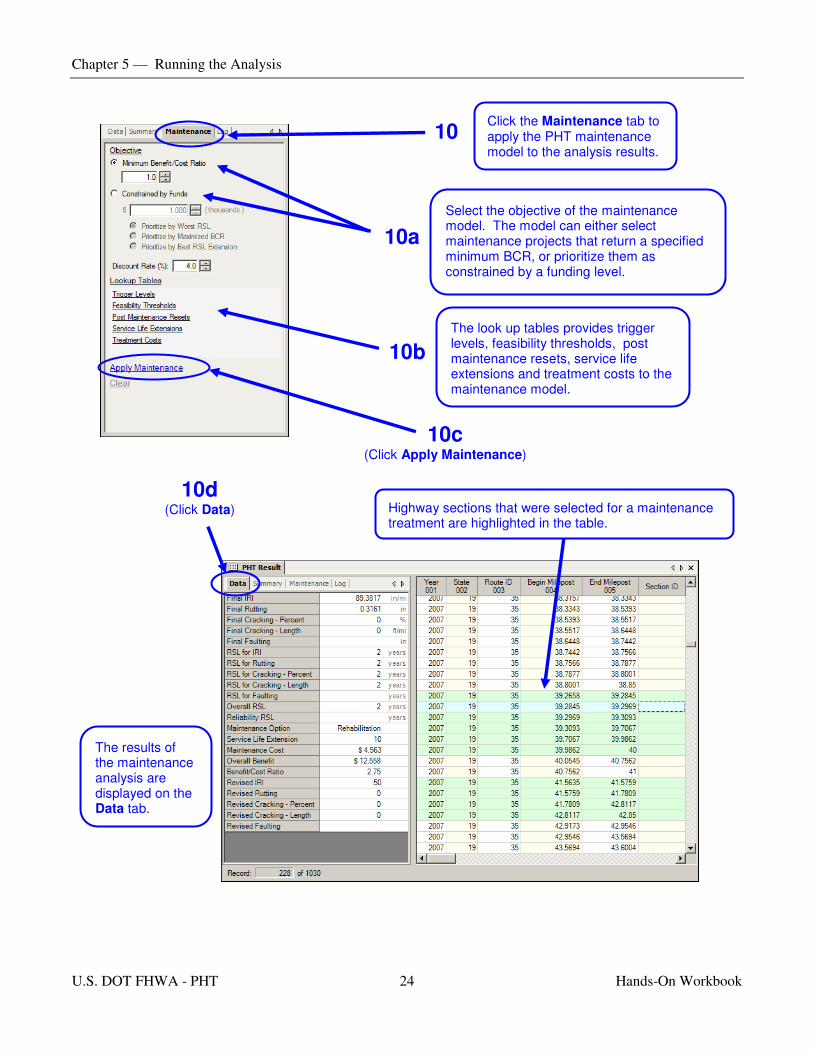
Click the Maintenance tab to 10 apply the PHT maintenance
model to the analysis results.
Select the objective of the maintenance model. The model can either select
10a maintenance projects that return a specified minimum BCR, or prioritize them as constrained by a funding level.
The look up tables provides trigger levels, feasibility thresholds, post
10b maintenance resets, service life extensions and treatment costs to the maintenance model.
10c (Click Apply Maintenance)
Chapter 5 — Running the Analysis
10d (Click Data) Highway sections that were selected for a maintenance
treatment are highlighted in the table.
The results of the maintenance analysis are displayed on the Data tab.
U.S. DOT FHWA - PHT 24 Hands-On Workbook

Chapter 6 — Working with GIS Selections
CHAPTER 6 – WORKING WITH GIS SELECTIONS
Objective: Create selections of highway sections using a GIS map.
Specifics: GIS maps provide a graphical means of selecting highway sections for the PHT analysis.
Use: GIS selections can define a sub-set of the overall highway network or define a single
continuous route for a corridor analysis.
Tasks: 1. Create a GIS Selection and associated it with the highway data
2. Select highway sections using various methods
3. Compile a GIS selection into a continuous corridor
4. Select the highway data records for analysis using the GIS selection
U.S. DOT FHWA - PHT 25 Hands-On Workbook
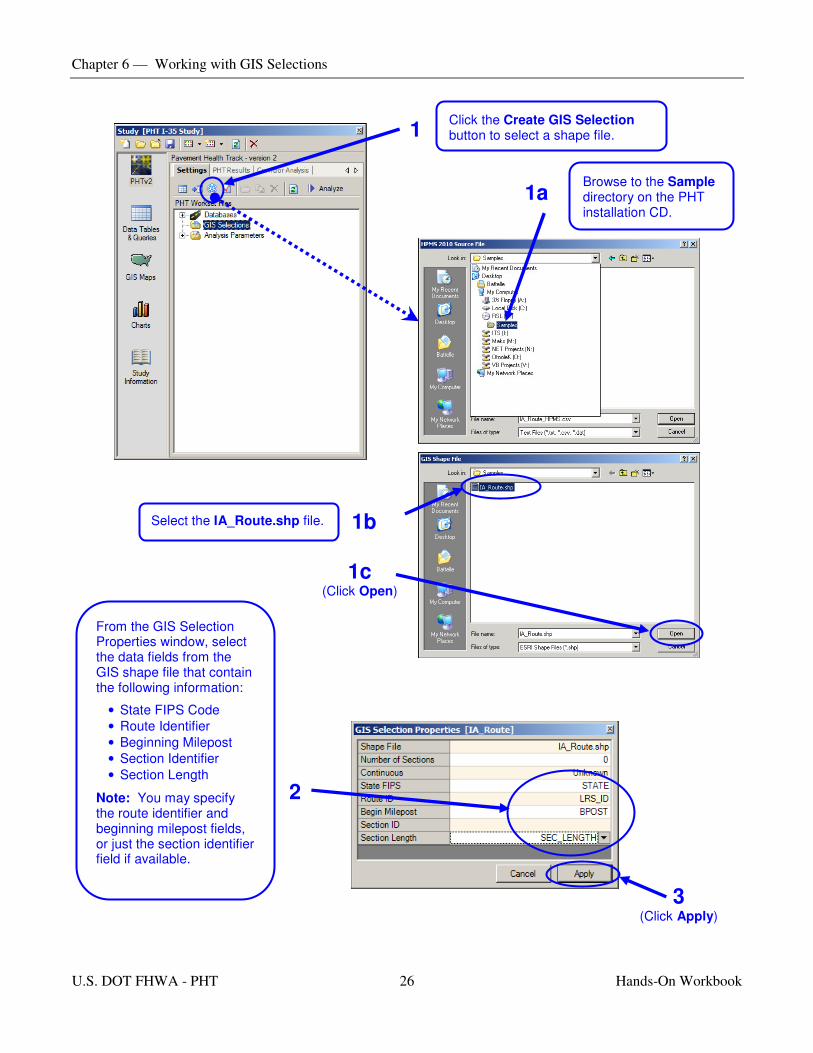
1 Click the Create GIS Selection button to select a shape file.
1a Browse to the Sample directory on the PHT installation CD.
1b Select the IA_Route.shp file.
1c (Click Open)
From the GIS Selection Properties window, select the data fields from the GIS shape file that contain the following information:
• State FIPS Code
• Route Identifier
• Beginning Milepost
• Section Identifier
• Section Length
Note: You may specify the route identifier and beginning milepost fields, or just the section identifier field if available.
2
3 (Click Apply)
Chapter 6 — Working with GIS Selections
U.S. DOT FHWA - PHT 26 Hands-On Workbook
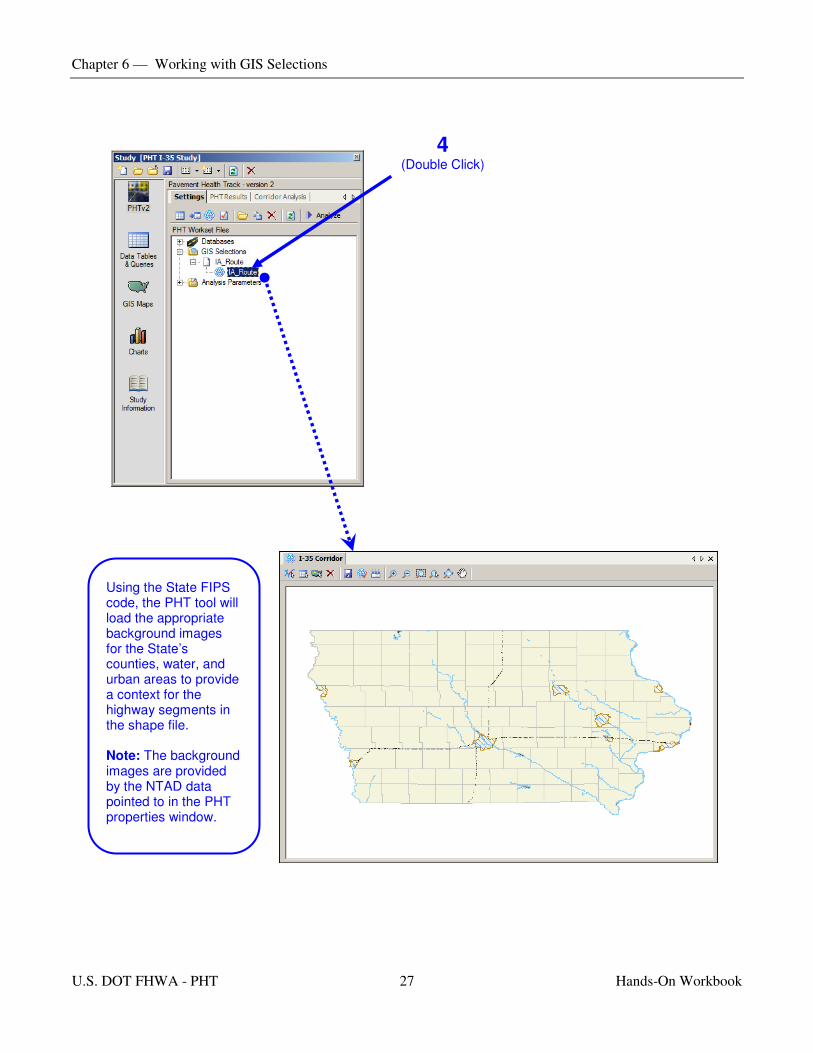
Using the State FIPS code, the PHT tool will load the appropriate background images for the State’s counties, water, and urban areas to provide a context for the highway segments in the shape file.
Note: The background images are provided by the NTAD data pointed to in the PHT properties window.
4 (Double Click)
‘s
Chapter 6 — Working with GIS Selections
U.S. DOT FHWA - PHT 27 Hands-On Workbook
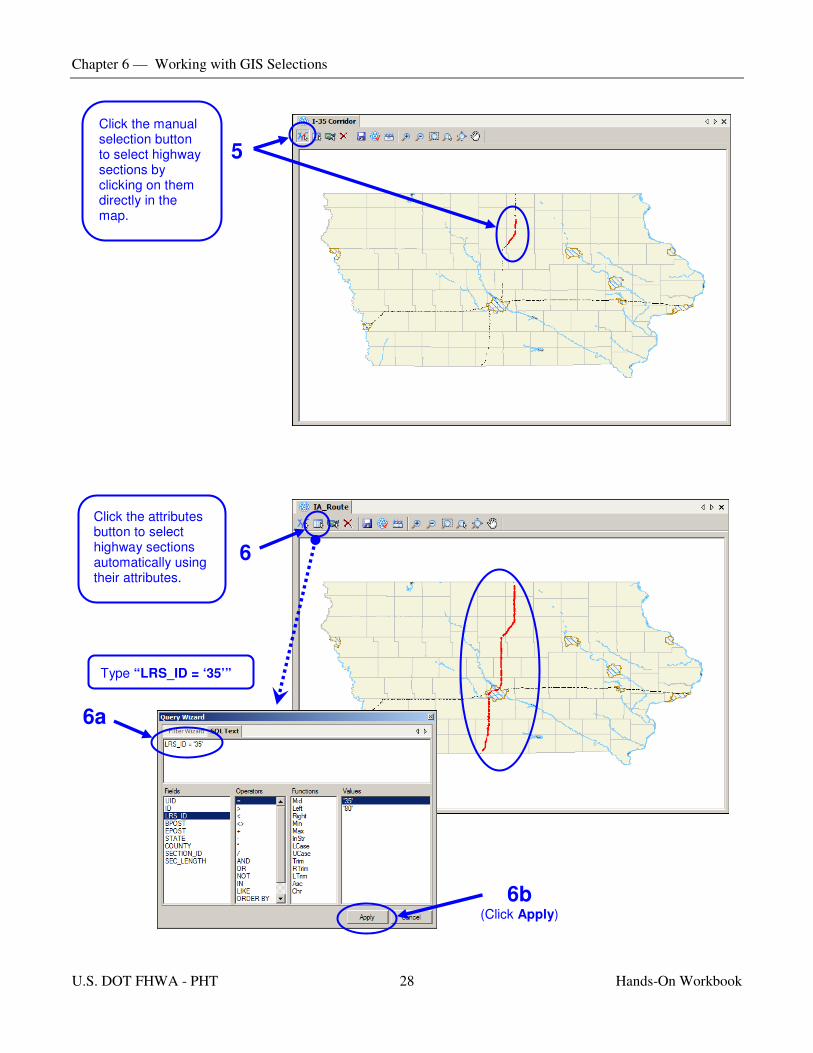
Click the manual selection button to select highway 5 sections by clicking on them directly in the map.
Chapter 6 — Working with GIS Selections
Click the attributes button to select highway sections 6automatically using their attributes.
Type “LRS_ID = ‘35’”
6a
6b (Click Apply)
U.S. DOT FHWA - PHT 28 Hands-On Workbook
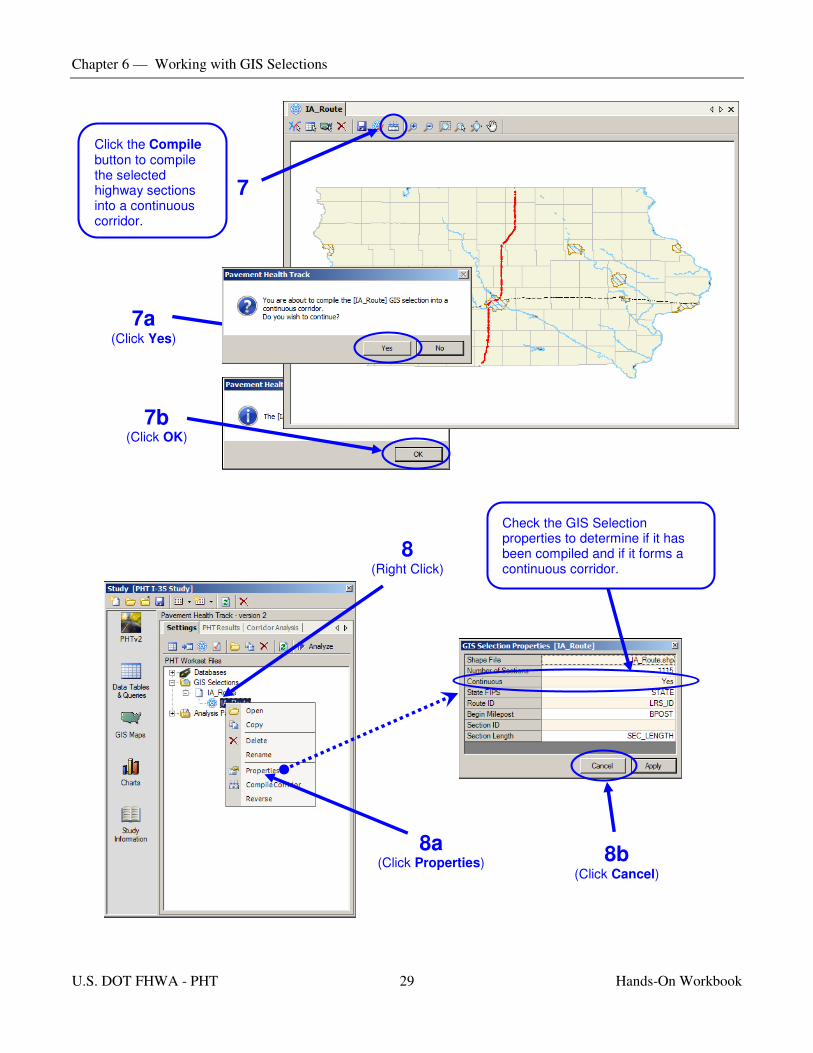
Click the Compile button to compile the selected highway sections 7 into a continuous corridor.
7a (Click Yes)
7b (Click OK)
Chapter 6 — Working with GIS Selections
Check the GIS Selection properties to determine if it has
8 been compiled and if it forms a (Right Click) continuous corridor.
8a 8b (Click Properties)
(Click Cancel)
U.S. DOT FHWA - PHT 29 Hands-On Workbook
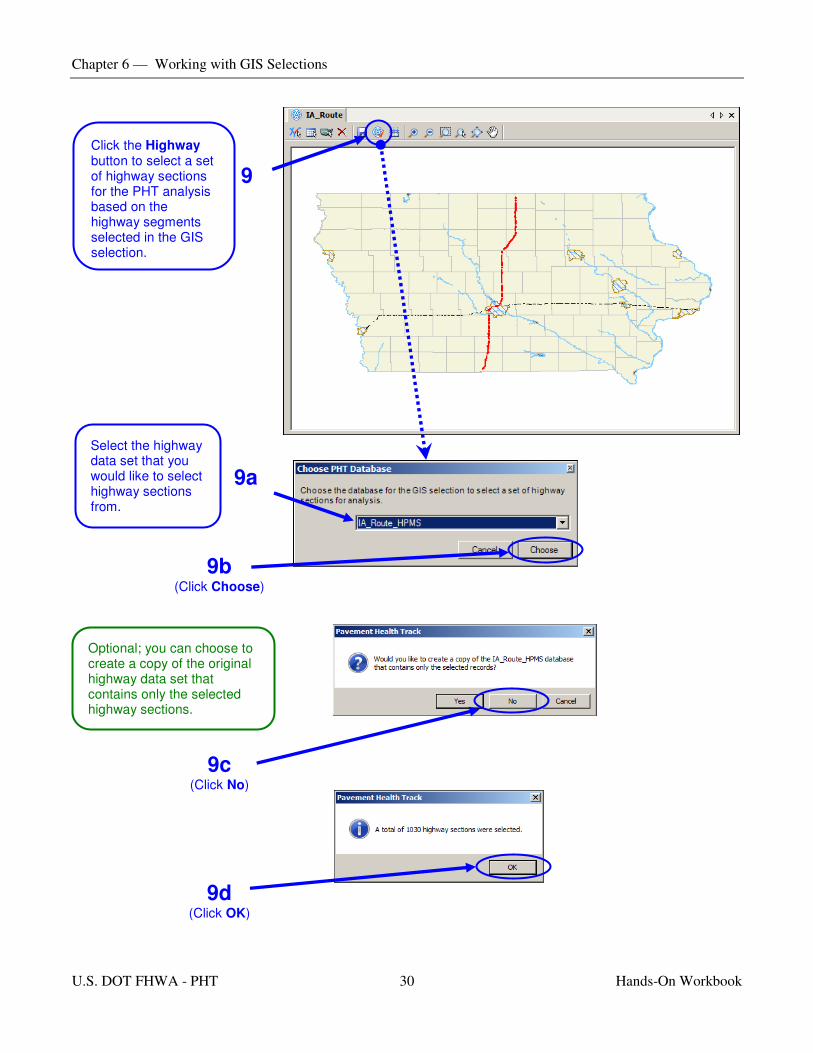
9
Click the Highway button to select a set of highway sections for the PHT analysis based on the highway segments selected in the GIS selection.
9b
Select the highway data set that you would like to select highway sections from.
9a
(Click Choose)
Optional; you can choose to create a copy of the original highway data set that contains only the selected highway sections.
9c (Click No)
9d (Click OK)
Chapter 6 — Working with GIS Selections
U.S. DOT FHWA - PHT 30 Hands-On Workbook

Chapter 7 — Generating Reports
CHAPTER 7 – GENERATING REPORTS
Objective: Become familiar with the report wizard for the PHT tool.
Specifics: The PHT tool provides a report wizard to quickly visualize the PHT analysis results.
Use: The report wizard provides a library of predefined report templates and options to quickly
create a variety of charts based on a PHT analysis.
Tasks: 1) Launch the Report Wizard and select the options to create a report.
2) Create a statistical chart and save it to the chart template library.
3) Load a chart from the chart template library.
4) Create a thematic GIS Map.
5) Browse and view t he reports created by the wizard and managed by the Study.
U.S. DOT FHWA - PHT 31 Hands-On Workbook

Click the Generate Report button to activate the report 1 wizard.
Enter a descriptive name 1a for the report.
1b
Select the statistical chart with an overall RSL theme and choose the options to show mileage as a percentage and to disaggregate the data by surface type. 1c
(Click Generate)
Chapter 7 — Generating Reports
U.S. DOT FHWA - PHT 32 Hands-On Workbook
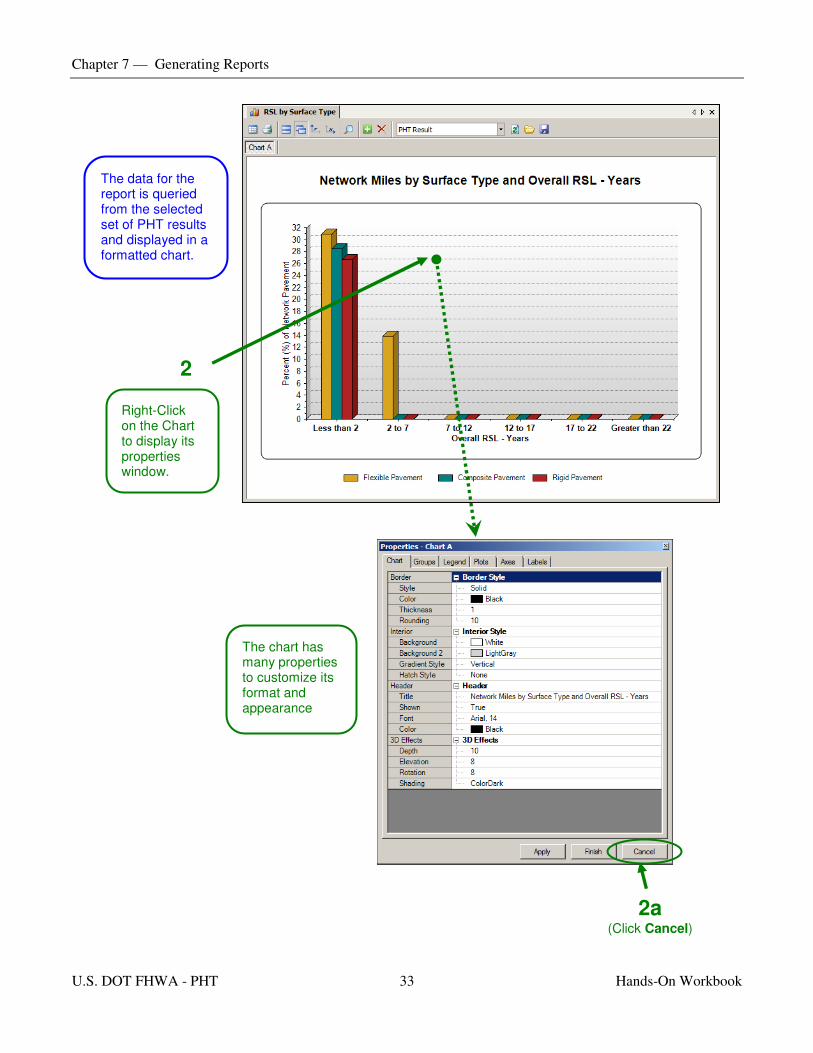
The data for the report is queried from the selected set of PHT results and displayed in a formatted chart.
2
Right-Click on the Chart to display its properties window.
2a (Click Cancel)
The chart has many properties to customize its format and appearance
Chapter 7 — Generating Reports
U.S. DOT FHWA - PHT 33 Hands-On Workbook

Click the Save button to save the chart 3 format to the template library.
3a
Enter a descriptive name for the template.
3b (Click OK)
Chapter 7 — Generating Reports
U.S. DOT FHWA - PHT 34 Hands-On Workbook
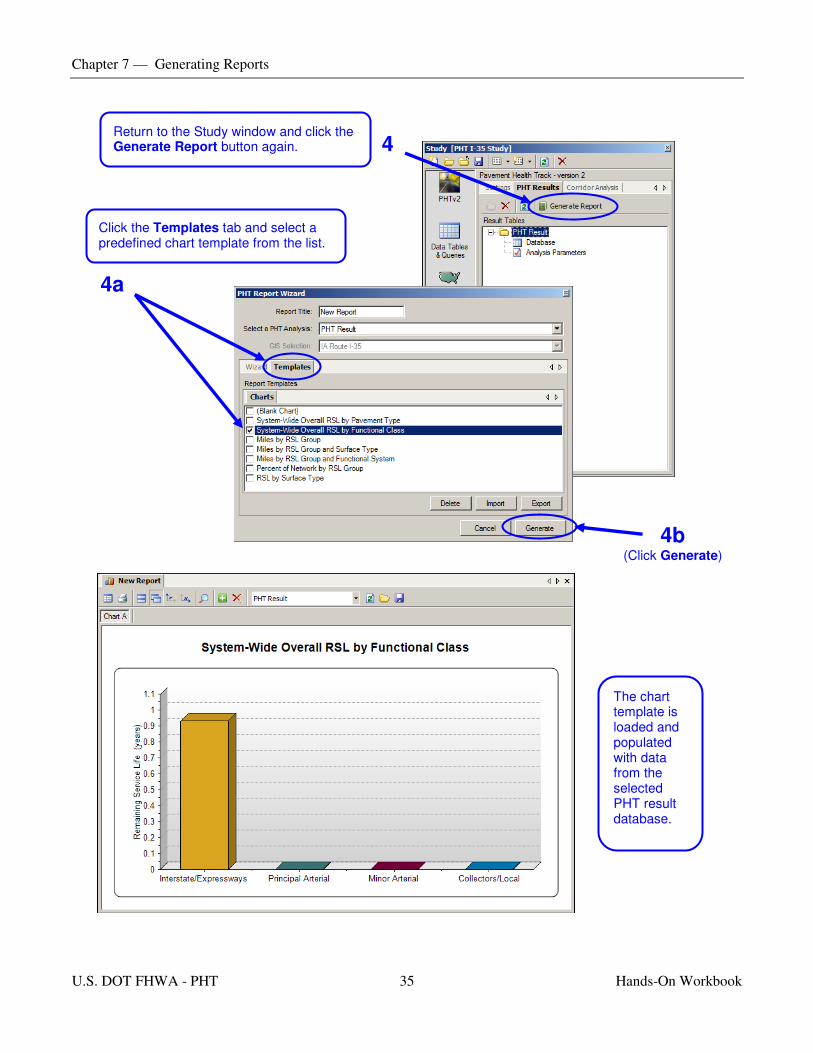
Return to the Study window and click the Generate Report button again. 4
Click the Templates tab and select a predefined chart template from the list.
4a
4b (Click Generate)
Chapter 7 — Generating Reports
The chart template is loaded and populated with data from the selected PHT result database.
U.S. DOT FHWA - PHT 35 Hands-On Workbook
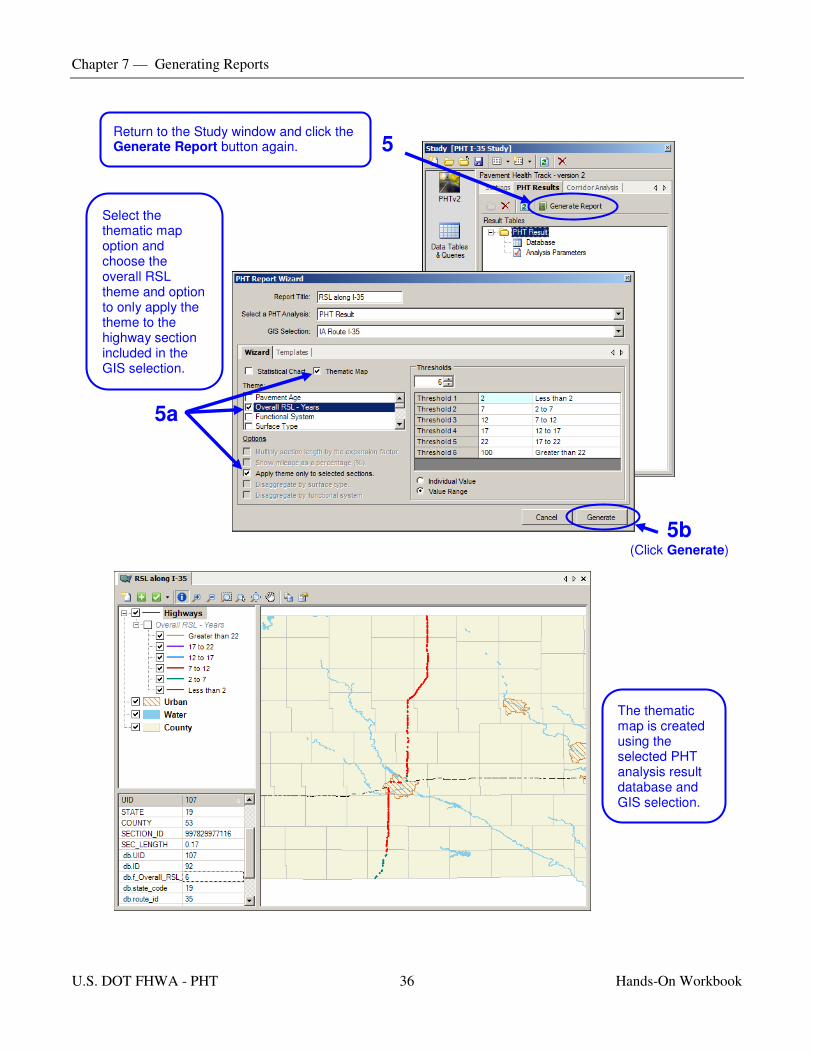
5 Return to the Study window and click the Generate Report button again.
5b
5a
Select the thematic map option and choose the overall RSL theme and option to only apply the theme to the highway section included in the GIS selection.
(Click Generate)
Chapter 7 — Generating Reports
The thematic map is created using the selected PHT analysis result database and GIS selection.
U.S. DOT FHWA - PHT 36 Hands-On Workbook

6 (Click Charts)
The Charts window displays a list of statistical charts created by the report wizard.
Chapter 7 — Generating Reports
7 (Click Maps)
The Maps window displays a list of GIS maps created by the report wizard.
U.S. DOT FHWA - PHT 37 Hands-On Workbook

Chapter 7 — Generating Reports
(This page intentionally left blank)
U.S. DOT FHWA - PHT 38 Hands-On Workbook

Chapter 8 — Corridor Analysis
CHAPTER 8 – CORRIDOR ANALYSIS
Objective: Become familiar with the PHT corridor analysis feature.
Specifics: The PHT tool provides for evaluating the analysis results for a specific corridor.
Use: The corridor analysis provides a profile along the corridor by virtual milepost where the
beginning of the corridor is set to 0. Up to four result data elements can be profiled
simultaneously.
Tasks: 1) Create a new corridor profile.
2) Select the associated analysis results and GIS selection.
3) View t he corridor profile.
4) Use the zoom controls to zoom into specific areas along the corridor.
U.S. DOT FHWA - PHT 39 Hands-On Workbook
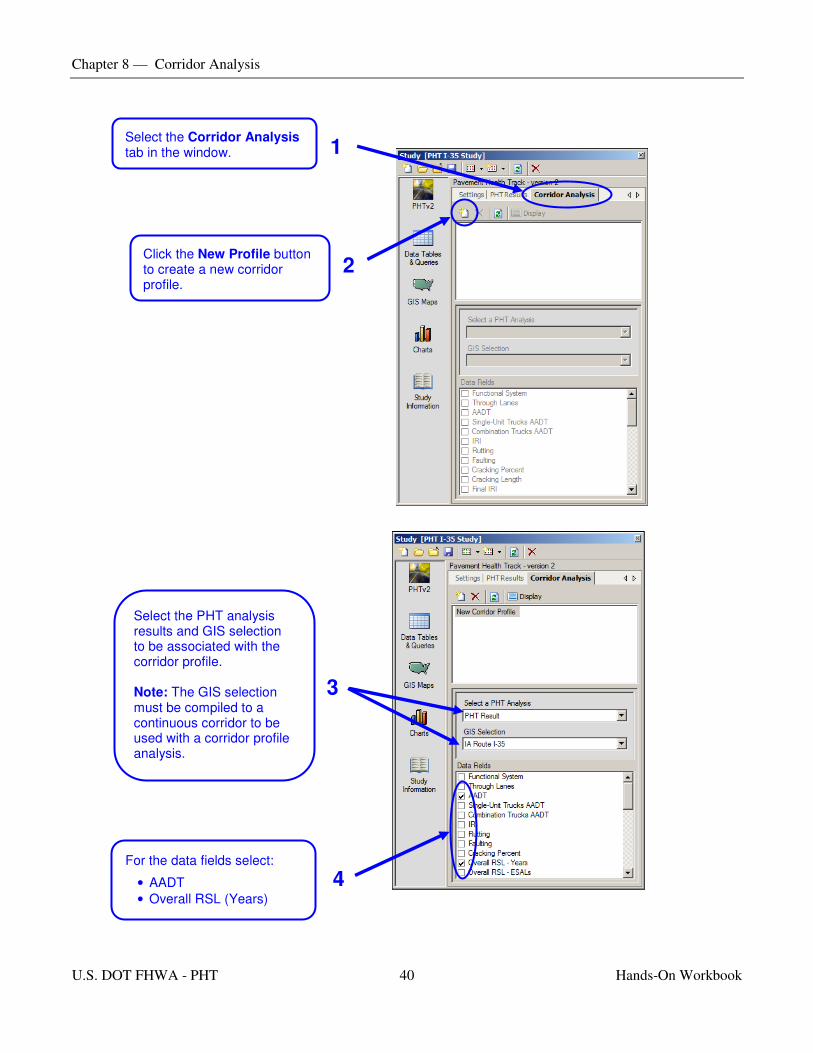
Select the Corridor Analysis tab in the window. 1
Click the New Profile button to create a new corridor 2 profile.
Chapter 8 — Corridor Analysis
3
Select the PHT analysis results and GIS selection to be associated with the corridor profile.
Note: The GIS selection must be compiled to a continuous corridor to be used with a corridor profile analysis.
For the data fields select:
• AADT
• Overall RSL (Years)
4
U.S. DOT FHWA - PHT 40 Hands-On Workbook
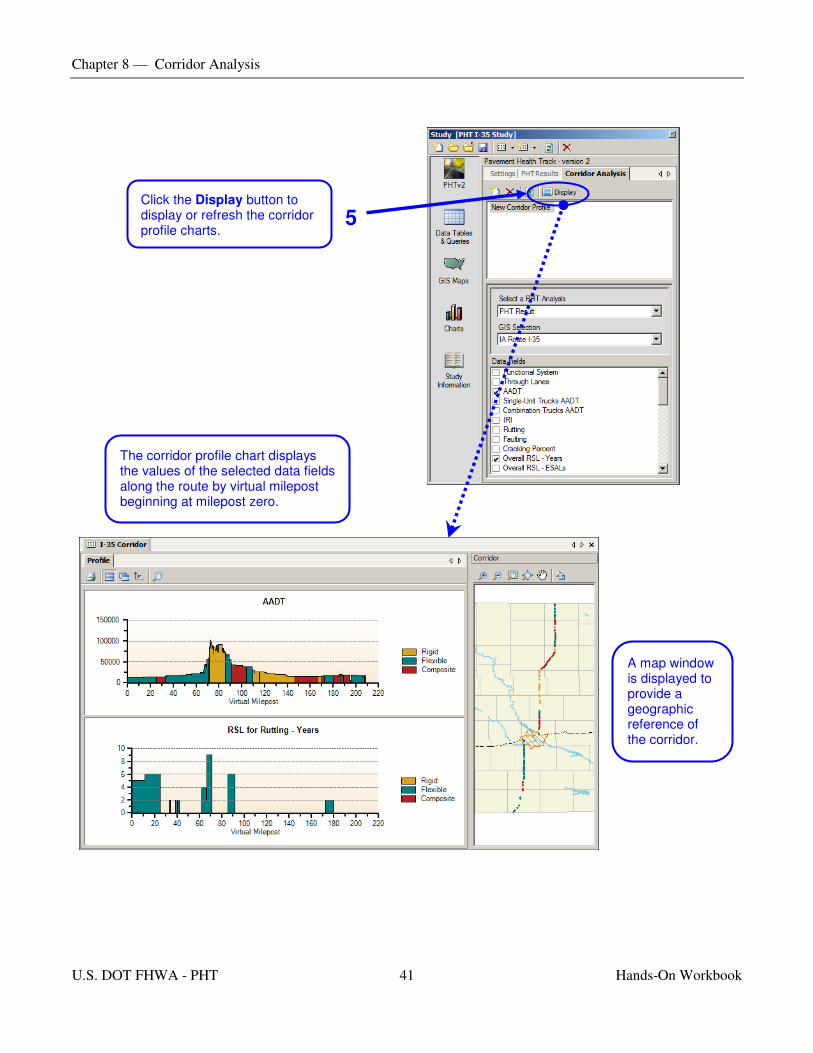
Click the Display button to display or refresh the corridor 5 profile charts.
The corridor profile chart displays the values of the selected data fields along the route by virtual milepost beginning at milepost zero.
A map window is displayed to provide a geographic reference of the corridor.
Chapter 8 — Corridor Analysis
U.S. DOT FHWA - PHT 41 Hands-On Workbook
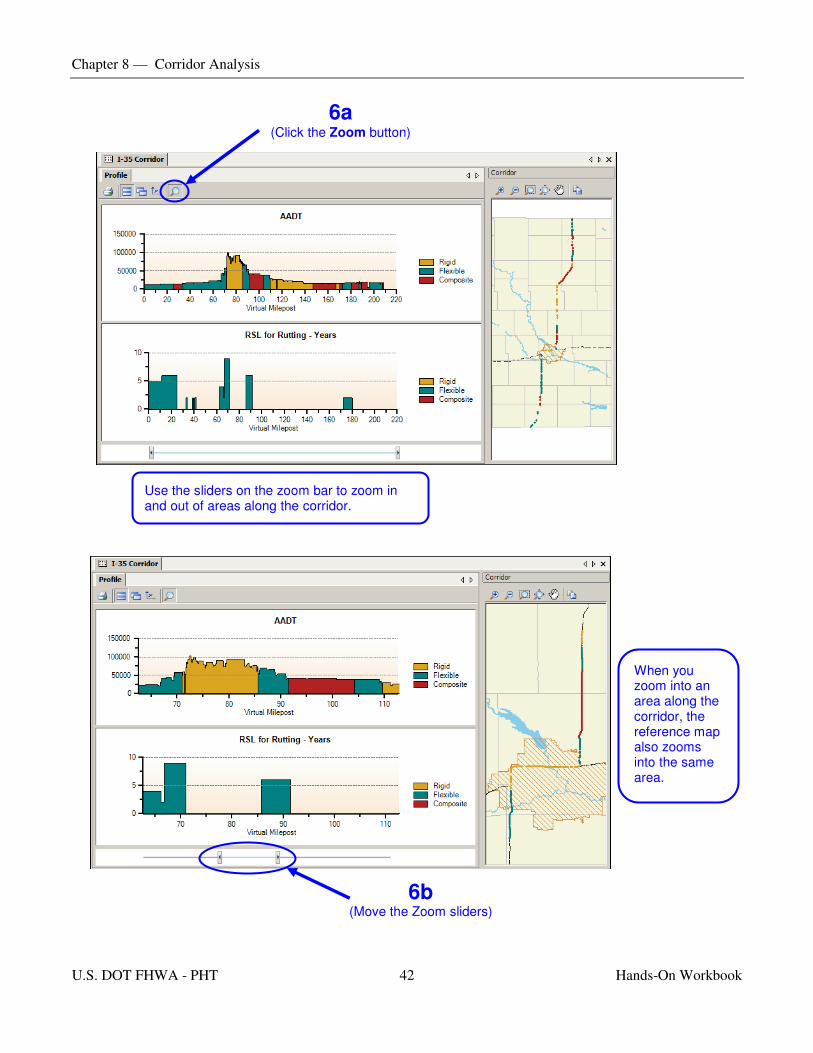
6a (Click the Zoom button)
Use the sliders on the zoom bar to zoom in and out of areas along the corridor.
Chapter 8 — Corridor Analysis
6b (Move the Zoom sliders)
When you zoom into an area along the corridor, the reference map also zooms into the same area.
U.S. DOT FHWA - PHT 42 Hands-On Workbook