pavement evaluation and design report route 33: eb & …
TRANSCRIPT

PAVEMENT EVALUATION AND DESIGN REPORT
Route 33: EB & WB (MP 24.3-29.0)
Manalapan & Freehold Townships, Monmouth County, New Jersey
Report Submitted to:
New Jersey Department of Transportation
1035 Parkway Avenue Trenton, NJ 08625-0600
December 2010
Project Site
Project Site

PAVEMENT EVALUATION AND DESIGN REPORT Route 33: EB & WB (MP 24.3-29.0)
i
TABLE OF CONTENTS
Executive Summary ...................................................................................................... ii Part I – Introduction ....................................................................................................... 1 Part II – Scope of Work .................................................................................................. 3 Part III – Results and Recommendations ..................................................................... 6
3.1 Results ................................................................................................................. 6 Mainline Lanes ...................................................................................................... 6 Inside and Outside Shoulders ............................................................................. 7
3.2 Recommendations .......................................................................................... 8 Eastbound and Westbound Route 33 ............................................................... 8 Ramps and Grade-Separated Interchange Crossroads .............................. 11
3.3 Cost Estimate .................................................................................................. 12
Part IV – Disclaimer ..................................................................................................... 13 Tables Figures Distress Photo Log
Core Photo Log
Appendix A: Straight Line Diagrams for Project Area
Appendix B: Pavement Management System Data
Appendix C: Falling Weight Deflectometer Test Results Appendix D: Traffic Data
Appendix E: Pavement Design Calculation Sheets

PAVEMENT EVALUATION AND DESIGN REPORT Route 33: EB & WB (MP 24.3-29.0)
ii
Executive Summary
Eastbound and westbound Route 33 from MP 24.20-29.00 in the eastbound direction
and from MP 24.30-29.00 in the westbound direction were evaluated in this project and
recommended for pavement restoration. Field testing (i.e., visual survey, GPR testing,
coring, and FWD testing) was performed on such pavement and the results were
considered along with anticipated traffic loadings to provide recommendations for the
restoration of the existing pavement.
Within the project limits the Route 33 lanes and shoulders are almost exclusively
comprised of flexible pavement (short remnants of the original Route 33 roadway
composite pavement exist at the western limits). The general pavement structure and
condition for the lanes can be summarized as follows:
• EB & WB, MP 24.31-27.91: 9 to 11 in. AC • EB & WB, MP 27.91-29.00: 8.5 in. AC • EB, MP 24.20-27.21: “Fair” to “Good” condition; Scattered L/M-block, fatigue, &
transverse cracking, L/M-longitudinal cracking between lanes • EB, MP 27.21-28.88 & WB, MP 24.31-28.88: “Poor” to “Very Poor” condition; Severe
block cracking, fatigue cracking, & longitudinal cracking between lanes • EB & WB, MP 28.88-29.00: “Very Good” condition; L-longitudinal cracking.
The general pavement structure and condition for the shoulders can be summarized as
follows:
• EB: 3 to 5 in. AC; WB: 4 to 5 in. AC • The shoulders are generally in “Fair” to “Good” condition, containing scattered L/M-
transverse, longitudinal, fatigue, and block cracking. The entirety of the Route 33 lanes do not require any structural improvements to attain a
10-year life. However, considering the extensive block and fatigue cracking throughout
the project limits, the following resurfacing is being recommended:
• EB, MP 24.20-27.21 (Lanes & Inside Shoulders): Mill & Replace 3” • EB, MP 27.21-28.88 & WB, MP 24.31-28.88 (Lanes & Inside Shoulders): Mill & Replace 4” • EB, MP 24.20-28.88 & WB, MP 24.31-28.88 (Outside Shoulders): Mill & Replace 2” • EB & WB, MP 28.88-29.00 (Lanes & Inside & Outside Shoulders): Do Nothing

PAVEMENT EVALUATION AND DESIGN REPORT Route 33: EB & WB (MP 24.3-29.0)
iii
These recommendations are estimated to provide an overall service life of
approximately 17.2 years in the eastbound direction and approximately 18.6 years in
the westbound direction.
Resurfacing recommendations were also provided for the ramps and
overpass/underpass crossroads at grade-separated interchanges.

PAVEMENT EVALUATION AND DESIGN REPORT Route 33: EB & WB (MP 24.3-29.0)
1
Part I – Introduction
The New Jersey Department of Transportation (NJDOT) retained Advanced
Infrastructure Design, Inc. (AID) to provide technical services pertaining to the
pavement evaluation and design of Route N.J. 33 (hereafter referred to as “Route 33”),
as part of the “Route 33: EB & WB (MP 24.3-29.0)” screening project. As indicated by the
project title, the project limits extend on Route 33 from approximately Milepost (MP) 24.3
to 29.0 in both the eastbound and westbound directions. The project site is located in
Manalapan and Freehold Townships, Monmouth County, New Jersey.
The original limits of this project are indicated above. Based on AID’s pavement
evaluation efforts, the eventual limits for recommended pavement restoration under
this project were slightly adjusted to the locations near the original limits where the
pavement condition noticeably improves (and resurfacing is not currently required).
The adjusted limits of recommended pavement restoration under this project extend
from MP 24.20-28.88 in the eastbound direction and from MP 24.31-28.88 in the
westbound direction.
The intent of AID’s work on this project was to assess the general scope of pavement
restoration work that is appropriate within the project limits. This involved a review of
existing documents as well as pavement testing in the field. The remainder of this report
discusses the scope of work in more detail and provides the results and
recommendations yielded by the pavement evaluation and design efforts.
Within the project limits Route 33 functions as an urban freeway and generally consists
of two lanes, a narrow inside shoulder, and a wide outside shoulder in each direction.
Exceptions include a third acceleration or deceleration that exists in the vicinity of the
interchanges and only one travel lane in each direction in the vicinity of the Halls Mill
Road interchange. For the purposes of this report the innermost lane in each direction
was numbered “1” and the outer lanes were sequentially numbered “2,” “3,” etc.
Furthermore, for the purposes of this report, locations are referenced in terms of

PAVEMENT EVALUATION AND DESIGN REPORT Route 33: EB & WB (MP 24.3-29.0)
2
mileposts, as per the NJDOT 2010 Straight Line Diagrams (see Appendix A).

PAVEMENT EVALUATION AND DESIGN REPORT Route 33: EB & WB (MP 24.3-29.0)
3
Part II – Scope of Work
As part of its pavement evaluation efforts, AID performed the following tasks:
• Reviewed existing documents: This included a review of the available As-Built
plans, NJDOT Pavement Management System (PMS) data, and NJDOT historical
boring records. The As-Built plan data is incorporated into the pavement
structure data in Tables 1a-b and 2a-b for the eastbound and westbound
directions, respectively. The PMS data is included in full in Appendix B and
summarized in Tables 1a and 2a.
• Performed visual pavement condition survey: This included conducting a visual
survey of the existing pavement condition along the Route 33 project length in
accordance with the guidelines in the Strategic Highway Research Program’s
Distress Identification Manual for the Long-Term Pavement Performance Project.
A subjective assessment of the relative overall pavement condition was also
made. All of this information as well as available information on design
constraints (such as curb presence/reveal, barrier curb presence/height/reveal,
guiderail presence, bridge and overpass structures, driveway presence, and
drainage issues) are summarized in Tables 1a-c and 2a-c. A photo log of some of
the distresses observed during the visual survey is provided in this report.
A visual survey of the pavement for the ramps connecting to Route 33 as well as
the overpass/underpass crossroad pavement at grade-separated interchanges
was also conducted to determine the visual condition and scope of treatment
required. A summary of such findings for the ramp and crossroad pavement is
provided in Table 3.
• Performed Ground Penetrating Radar (GPR) testing and analysis: One run of GPR
testing utilizing a 2 GHz air-launched antenna was conducted along each of the
inner two lanes and the outside shoulder in each direction of Route 33. The
testing was conducted along the approximate outer wheel path of the lanes

PAVEMENT EVALUATION AND DESIGN REPORT Route 33: EB & WB (MP 24.3-29.0)
4
and along the centerline of the outside shoulders. Such testing was performed in
accordance with ASTM D 4748: Standard Test Method for Determining the
Thickness of Bound Pavement Layers Using Short-Pulse Radar. The GPR data was
used to determine the variation in thickness of the asphalt concrete (AC) layer.
The variations in estimated AC layer thickness for the lanes and shoulders are
plotted in Figures 1 through 6.
• Performed coring and hand augering: A total of thirty-six (36) cores were
extracted in this project. Samples of the underlying unbound material were
collected via hand augering or grab sampling beneath the bound material.
Table 4 provides a summary of the core results, including the AC thicknesses, the
types and thicknesses of the underlying materials (see “Classification of Unbound
Pavement Materials” appending Table 4), and any pertinent comments (e.g.,
interface depths where core was broken or debonded). A core photo log with
photos of each core is included in this report. The AC layer thicknesses from the
cores are superimposed in the GPR figures (i.e., Figures 1 through 6).
• Performed Falling Weight Deflectometer (FWD) testing and analysis: FWD testing
was conducted in accordance with ASTM D 4694-96(03): Standard Test Method
for Deflections with a Falling-Weight-Type Impulse Load Device and ASTM D
4695-03: Standard Guide for General Pavement Deflection Measurements. This
testing was carried out approximately every 0.05 mi. along Lane 2 of each
direction. Inaccessible areas, where safety and/or traffic flow would be
compromised, were not tested. The FWD testing, which involved applying three
load drops at each test location, was performed to allow for determination of
the various pavement layer moduli, including the subgrade resilient modulus, as
well as the effective structural number. ASTM D 5858-96(03): Standard Guide for
Calculating In Situ Equivalent Elastic Moduli of Pavement Materials Using Layered
Elastic Theory and the AASHTO Guide for Design of Pavement Structures (1993)
were followed for the backcalculation of the pavement parameters. The FWD

PAVEMENT EVALUATION AND DESIGN REPORT Route 33: EB & WB (MP 24.3-29.0)
5
flexible pavement test results are compiled in Appendix C. The average results
by section are included in Tables 1a and 2a.
• Obtained traffic-related inputs for pavement design: NJDOT provided AID with
an intradepartmental NJDOT memorandum dated 9/23/2010 (see Appendix D)
with the one-way Average Daily Traffic (ADT) for base and future years and
percentages of “heavy” and “total” trucks under the headings “Year 2015” and
“Year 2035.” We were subsequently instructed by NJDOT to use the “Year 2035”
data with an initial design year of 2015 for pavement design calculations. It was
assumed that the “heavy” trucks are representative of Federal Highway
Administration (FHWA) Classes 6 through 13 and the total trucks are
representative of FHWA Classes 4 through 13. This information was then used to
determine the percentages of “light” (i.e., FHWA Classes 4 and 5) and “heavy”
(i.e., FHWA Classes 6 through 13) trucks for pavement design purposes. The
current 18-kip equivalent single axle load (ESAL) factors (2009) for the project
limits were obtained from the NJDOT website and are also included in Appendix
D. Table 5 contains a summary of the traffic-related inputs that were used for the
Route 33 pavement design.

PAVEMENT EVALUATION AND DESIGN REPORT Route 33: EB & WB (MP 24.3-29.0)
6
Part III – Results and Recommendations
3.1 Results
Summaries of the pavement evaluation findings for various sections of the eastbound
and westbound Route 33 lanes/outside shoulders are provided in Tables 1a-b and 2a-b,
respectively.
The following is a summary of the pavement evaluation findings:
Mainline Lanes
• The mainline lanes consist of flexible (i.e., AC only) pavement throughout the
project limits with the exception of short sections at the western end of the
project, which consist of composite (i.e., AC over Portland cement concrete
(PCC)) pavement. These composite pavement sections are the remnants of the
original Route 33, which continues as Route 33 Business roughly parallel to the
subject Route 33 freeway. The composite pavement sections include the
eastbound lanes from ~MP 24.20-24.31 and the westbound lanes from ~MP 24.34-
24.40 and consist of 6 in. of AC over 8 in. PCC slabs over 6 in. of Subbase, based
on a lone core and the As-Builts.
• The flexible pavement lanes generally are comprised of the following structure in
both directions:
o MP 24.31-27.91: 9 to 11 in. AC over 12 in. of base/subbase (sand & gravel (natural) with silt)
o MP 27.91-29.00: 8.5 in. AC over 12 in. of base/subbase (sand & gravel (stone) with silt)
• The lanes exhibit 0.25 to 0.50 in. of rutting throughout the project limits and “Fair”
ride quality, based on the PMS data. The following is a summary of the visual
condition:

PAVEMENT EVALUATION AND DESIGN REPORT Route 33: EB & WB (MP 24.3-29.0)
7
o EB, MP 24.20-27.21: “Fair” to “Good” condition; L/M-block cracking, scattered L/M-fatigue & transverse cracking, L/M-longitudinal cracking between lanes
o EB, MP 27.21-28.88 & WB, MP 24.31-28.88: “Poor” to “Very Poor” condition; Severe block cracking, fatigue cracking, & longitudinal cracking between lanes It should be noted that the longitudinal cracking between lanes is widespread and severe (especially in the latter section noted above), such that wide gaps exist along these construction joints with missing asphalt pieces. As such, this condition appears to pose a safety hazard to the motoring public, especially motorcyclists crossing these joints.
o EB & WB, MP 28.88-29.00: “Very Good” condition; L-longitudinal cracking.
• The FWD test results indicate that the pavement is in relatively good structural
condition, as the normalized deflections are generally under 7 to 8 mils.
Backcalculation of the FWD data yielded an average seasonally adjusted
subgrade resilient modulus of 4500 to 5000 psi, indicative of a “Fair” subgrade
quality, which is in line with the boring information on record.
Inside and Outside Shoulders
• Like the lanes, the inside and outside shoulders consist of flexible pavement
throughout the project limits with the exception of short sections at the western
end of the project, which consist of composite pavement. The composite
pavement sections include the eastbound inside shoulder from ~MP 24.26-24.32
and the westbound inside and outside shoulders from ~MP 24.34-24.37 and from
~MP 24.37-24.41. It is assumed that the shoulders consist of a similar composite
pavement structure as to that in the lanes.
• The flexible pavement shoulders generally are comprised of the following
structure:
o EB, MP 24.20-27.91: 3 to 4.5 in. AC over 19 in. of sand & gravel (natural) with silt
o EB, MP 27.91-29.00: 4.75 in. AC over 16 in. of sand & gravel (stone) with silt o WB, MP 24.31-27.91: 4 to 5 in. AC over 19 in. of sand & gravel (natural) with
silt

PAVEMENT EVALUATION AND DESIGN REPORT Route 33: EB & WB (MP 24.3-29.0)
8
o WB, MP 27.91-29.00: 4 to 5 in. AC over 16 in. of sand & gravel (stone) with silt
• The shoulders are generally in “Fair” to “Good” condition, containing scattered
L/M-transverse, longitudinal, fatigue, and block cracking.
3.2 Recommendations
The objective of AID’s pavement design efforts was to determine feasible milling and
overlaying recommendations to obtain a minimum 10-year design life (or acceptably
close thereto) via such an effort. Pavement design calculations were thus performed to
determine the required 10-year overlay thickness and the life provided by appropriate
mill and overlay alternatives. The findings and recommendations are discussed below.
Pavement design calculation sheets for the 10-year overlay requirements and the
preferred alternative recommendations are compiled in Appendix E.
Eastbound and Westbound Route 33
The 10-year overlay requirement (where the initial design year was taken as 2015) with
standard Hot Mix Asphalt (HMA) mixes was calculated for each section of the lanes
within the project limits, based on the AASHTO Guide for Design of Pavement Structures
(1993). The overlay requirements for eastbound and westbound Route 33 are shown in
Tables 1d and 2d, respectively. As shown in these tables, the entirety of the Route 33
lanes within the project limits structurally does not require any additional HMA overlay
thickness to achieve a 10-year service life.
Although no structural improvements are needed, extensive block and fatigue cracking
exist throughout the project limits up to approximately MP 28.88. The eastbound lanes
from MP 27.21-28.88 and the westbound lanes from MP 24.31-28.88 are generally in poor
condition with severe cracking in either or both of the directional lanes. The eastbound
lanes from MP 24.20-27.21 are in better condition with less severe cracking. Both
directions from MP 28.88-29.00 are in very good condition with only low-severity
longitudinal cracking.

PAVEMENT EVALUATION AND DESIGN REPORT Route 33: EB & WB (MP 24.3-29.0)
9
Estimated service lives for a matrix of mill depths and overlay thicknesses are provided
in Tables 1d and 2d. This matrix includes mill depths of 2, 3, and 4 in. and overlay
thicknesses resulting in no raise, a 1 in. raise, and a 2 in. raise.
Based on a review of the cores (i.e., debonding and cracking patterns, condition of the
AC, etc.) and the assessed AC layer thicknesses, it was determined that it would be
appropriate to mill and replace 4 in. of the existing AC layer in the above-noted poor
condition areas of the lanes. 3 in. of mill and replace should be sufficient to restore the
eastbound lanes from MP 24.20-27.21. The 20-year ESAL’s are approximately 4.25 million,
suggesting that HMA 12.5M64 is an appropriate mix for the replacement overlay. No
pavement improvements are needed or recommended at this time from MP 28.88-
29.00. The service lives corresponding to these preferred alternative recommendations
are bolded, shaded, and boxed in Tables 1d and 2d.
As indicated in Tables 1d and 2d, based on the pavement design calculations, the
above mill and overlay recommendations will provide an estimated service life of 20
years throughout most of the project limits west of MP 27.91. East of MP 27.91, where the
AC layer is thinner – approximately 8.5 in. – a 13 to 14 year life can be expected.
Because the inside shoulders are narrow (approximately 5 ft.), it is recommended to
apply the lane recommendations to the adjacent inside shoulders. Considering the
measured AC thickness of the outside shoulders and assuming the inside shoulders are
similar in structure, the 3 to 4 in. of milling in the inside shoulders may also require
removal of unbound material in some areas. Wherever unbound material is
encountered, “Removal of Pavement” and “Excavation, Unclassified” should be used
on an “If & Where Directed” basis in lieu of the milling item.
The outside shoulders are of lane width. It is recommended to resurface these shoulders
by milling and replacing 2 in. of the existing AC.
The service lives provided to the shoulders by section following the above
recommended mill and overlay efforts are shown in Tables 1e and 2e. It can be seen

PAVEMENT EVALUATION AND DESIGN REPORT Route 33: EB & WB (MP 24.3-29.0)
10
that the life of the shoulders varies from approximately 0.9 to 3.8 years. If it is anticipated
that any sections of the shoulders will be subjected to traffic longer than the
anticipated service life during staging, it would be recommended to perform deeper
milling and overlaying in these sections.
It is recommended to perform necessary pavement repairs on an “If and Where
Directed” basis in conjunction with the milling and overlaying operation (following
milling and prior to overlay). Such repairs include “Sealing of Cracks in Hot Mix Asphalt
Surface Course” and “Hot Mix Asphalt Pavement Repair” in the flexible pavement
areas. The following recommendations apply to Route 33:
EB, MP 24.20-27.21 (Lanes & Inside Shoulders) • Mill 3 in. • Perform Necessary Pre-Overlay Repairs (noted above) • Place 3 in. Hot Mix Asphalt 12.5M64 Surface Course
EB, MP 27.21-28.88 & WB, MP 24.31-28.88 (Lanes & Inside Shoulders) • Mill 4 in. • Perform Necessary Pre-Overlay Repairs (noted above) • Place 2 in. Hot Mix Asphalt 12.5M64 Surface Course • Place 2 in. Hot Mix Asphalt 12.5M64 Intermediate Course
EB, MP 24.20-28.88 & WB, MP 24.31-28.88 (Outside Shoulders) • Mill 2 in. • Perform Necessary Pre-Overlay Repairs (noted above) • Place 2 in. Hot Mix Asphalt 12.5M64 Surface Course EB & WB, MP 28.88-29.00 (Lanes & Inside & Outside Shoulders) • Do Nothing
As evidenced by the current deteriorated condition of the longitudinal construction
joints, it is critical that Polymerized Joint Adhesive be properly applied to any such joints
created in the newly resurfaced pavement.
A schematic of the recommendations, including the corresponding estimated service
life by segment, is provided in Table 6. A cost estimate considering the above
recommendations is discussed in Section 3.3.

PAVEMENT EVALUATION AND DESIGN REPORT Route 33: EB & WB (MP 24.3-29.0)
11
The above recommendations are estimated to provide an overall service life of
approximately 17.2 years in the eastbound direction and approximately 18.6 years in
the westbound direction.
It is believed that the prescribed recommendations can be implemented throughout
the project length, as there is no resulting increase in vertical profile.
Ramps and Grade-Separated Interchange Crossroads
Table 3 provides a summary of the recommended treatment for ramps connecting to
Route 33 as well as the overpass/underpass crossroad pavement at grade-separated
interchanges. Based on the existing visual condition and consideration of the
pavement structure based on the As-Builts, the ramps and crossroads were
recommended for either “resurfacing,” “deep resurfacing,” or nothing, as shown in
Table 3. The following recommendations apply for “resurfacing” and “deep
resurfacing”:
Resurfacing • Mill 2 in. • Perform Necessary Pre-Overlay Repairs (noted below) • Place 2 in. Hot Mix Asphalt 12.5M64 Surface Course Deep Resurfacing • Mill 3 in. • Perform Necessary Pre-Overlay Repairs (noted below) • Place 2 in. Hot Mix Asphalt 12.5M64 Surface Course • Place 2 in. Hot Mix Asphalt 12.5M64 Intermediate Course
For the ramps and crossroads being resurfaced, it is recommended to perform
necessary pavement repairs on an “If and Where Directed” basis in conjunction with
the milling and overlaying operation. Such repairs include “Sealing of Cracks in Hot Mix
Asphalt Surface Course” and “Hot Mix Asphalt Pavement Repair.” These repairs are also
recommended for any ramps that will not be resurfaced.

PAVEMENT EVALUATION AND DESIGN REPORT Route 33: EB & WB (MP 24.3-29.0)
12
3.3 Cost Estimate
A cost estimate of the pavement-related work for the recommended pavement
restoration efforts has been prepared. Costs associated with additional roadway
improvements that may result from roadway profile change, realignment, widening,
traffic signals, right-of-way, etc. during the design development phase of the project
were not considered in these cost estimates. The unit costs utilized for this cost estimate
were compiled from various sources, including a review of recent construction bid
tabulations and reports, discussion with NJDOT personnel and industry representatives,
and the experience of AID staff. Pay item quantities have been estimated based on the
general project geometry.
A summary of the cost estimate can be found in Table 7. The approximate cost of
pavement-related work is approximately $4.15 million.
PAVEMENT EVALUATION AND DESIGN REPORT Route 33: EB & WB (MP 24.3-29.0)
13
Part IV – Disclaimer
AID has used reasonable care and professional judgment in the performance of its
services for this project. The GPR testing was performed using state-of-the-art
equipment, and the results were analyzed utilizing the GPR manufacturer’s software.
GPR testing is a non-destructive type of testing that permits the collection of pavement
layer thickness and composition information relatively quickly, unobtrusively, and
inexpensively in comparison with conventional coring methods. It should be
understood, however, that the accuracy of the GPR test results is inherently affected by
such factors as: surface condition, electrical conductivity of the ground,
electromagnetic noise in the testing environment from devices using a frequency near
the GPR operating frequency, water in the pavement layers, obstacles in the GPR
vehicle’s path, attenuation of the GPR signal, and the depth of radar penetration. This
should be kept in mind when considering the GPR test results presented in this report.

PAVEMENT EVALUATION AND DESIGN REPORT Route 33: EB & WB (MP 24.3-29.0)
Tables

Table 1a. SUMMARY OF EVALUATION FINDINGS BY SECTION FOR EASTBOUND MAINLINE LANE PAVEMENT
D1A
(in.)E1A
(ksi)a1
D1C
(in.)E1C
(ksi)D2
(in.)E2
(ksi)a2
D3
(in.)E3
(ksi)a3
MR
(psi)k
(psi/in.)
Skid Value
(SN40R)
IRI(in./mi.) SDI
Avg. Rut
Depth(in.)
033 E 24.20 25.36 11.00 1,237 NA --- --- 12.00 39 NA --- --- --- 5,138 NA 5.7 6.57M-Block Cracking; Scattered M-Fatigue
Cracking; M-Longitudinal Cracking between Lanes; M-Transverse Cracking; Scattered
Potholes & Patches
--- 114 0.58 0.32 Fair Fair
033 E 25.36 27.21 9.00 845 NA --- --- 12.00 38 NA --- --- --- 4,918 NA 8.2 5.10L/M-Longitudinal Cracking between Lanes;
Scattered L/M-Transverse Cracking; Scattered L/M-Fatigue Cracking; Cracks Are Sealed in
Some Locations; Minor Rutting
--- 112 3.30 0.15 Good Fair
033 E 27.21 27.54 10.50 1,063 NA --- --- 12.00 40 NA --- --- --- 4,757 NA 6.9 5.91 H-Block Cracking; Scattered M-Fatigue Cracking; Scattered Patches & Potholes --- 145 0.37 0.28 Poor Fair
033 E 27.54 27.91 10.50 1,155 NA --- --- 12.00 38 NA --- --- --- 4,928 NA 6.4 6.09 H-Block Cracking; Scattered M-Fatigue Cracking; Scattered Patches & Potholes --- 165 2.20 0.28 Poor Fair
033 E 27.91 28.88 8.50 914 NA --- --- 12.00 37 NA --- --- --- 4,528 NA 8.6 5.00 H-Block Cracking; H-Fatigue Cracking; Scattered Patches & Potholes --- 172 0.40 0.42 Very Poor Deficient
033 E 28.88 29.00 8.50 NT 0.44 --- --- 12.00 NT 0.12 --- --- --- 4,500 NA NT 5.18 L-Longitudinal Cracking --- 84 3.53 0.31 Very Good Good
Table 1b. SUMMARY OF EVALUATION FINDINGS BY SECTION FOR EASTBOUND SHOULDER PAVEMENT
D1A
(in.)E1A
(ksi)a1
D1C
(in.)E1C
(ksi)D2
(in.)E2
(ksi)a2
D3
(in.)E3
(ksi)a3
MR
(psi)k
(psi/in.)
Skid Value
(SN40R)
IRI(in./mi.) SDI
Avg. Rut
Depth(in.)
033 E 24.20 24.35 3.50 NT 0.38 --- --- 19.00 NT 0.11 --- --- --- 4,500 NA NT 3.42 M-Longitudinal & Transverse Cracking; Scattered M-Fatigue Cracking --- --- --- --- Fair Fair
033 E 24.35 25.36 4.50 NT 0.40 --- --- 19.00 NT 0.11 --- --- --- 4,500 NA NT 3.89 L/M-Longitudinal & Transverse Cracking; Scattered Patches & Potholes --- --- --- --- Good Fair
033 E 25.36 25.87 3.50 NT 0.40 --- --- 19.00 NT 0.11 --- --- --- 4,500 NA NT 3.49 Scattered L/M-Transverse Cracking --- --- --- --- Good Fair
033 E 25.87 27.21 3.00 NT 0.40 --- --- 19.00 NT 0.11 --- --- --- 4,500 NA NT 3.29 L/M-Longitudinal & Transverse Cracking; Scattered Patches & Potholes --- --- --- --- Good Fair
033 E 27.21 27.54 4.00 NT 0.38 --- --- 19.00 NT 0.11 --- --- --- 4,500 NA NT 3.61M-Block Cracking; L/M-Longitudinal &
Transverse Cracking; Scattered L/M-Fatigue Cracking; Scattered Patches & Potholes
--- --- --- --- Fair Fair
033 E 27.54 27.91 4.00 NT 0.38 --- --- 19.00 NT 0.11 --- --- --- 4,500 NA NT 3.61M-Block Cracking; L/M-Longitudinal &
Transverse Cracking; Scattered L/M-Fatigue Cracking; Scattered Patches & Potholes
--- --- --- --- Fair Fair
033 E 27.91 28.88 4.75 NT 0.38 --- --- 16.00 NT 0.11 --- --- --- 4,500 NA NT 3.57L/M-Longitudinal & Transverse Cracking;
Scattered L/M-Fatigue Cracking; Scattered Patches & Potholes
--- --- --- --- Fair Fair
033 E 28.88 29.00 4.75 NT 0.40 --- --- 16.00 NT 0.11 --- --- --- 4,500 NA NT 3.66 L-Longitudinal Cracking --- --- --- --- Very Good Good
Notes:
2) NT = No Falling Weight Deflectometer Testing was performed.
3) L = Low Severity, M = Medium Severity, H = High Severity; Distresses correspond to types and severities defined in SHRP's Distress Identification Manual for the Long-Term Pavement Performance Program (June 2003)
4) Overall Pavement Condition has been subjectively evaluated as either Very Good, Good, Fair, Poor, or Very Poor.
5) Ride Quality has been evaluated as either Excellent, Good, Fair, or Deficient.
6) The eastbound lanes are believed to consist of composite pavement from approximately MP 24.20 to 24.31, while the eastbound inside shoulder is believed to consist of composite pavement from approximately MP 24.26 to 24.32. Limited core and As-Built data indicate the composite pavement consists of 6 in. AC/8 in. PCC/6 in. Subbase.
Table 1c. SUMMARY OF DESIGN CONSTRAINTS FOR EASTBOUND PAVEMENT
Drainage Issues
Overpasses/BridgesOverpasses: MP's 24.68, 25.68, 26.59, 28.24, 29.04Bridges (AC surface): MP's 26.23, 27.34, 28.09, 28.55Bridges (PCC surface): MP's 27.50-27.57, 27.67-27.71
None
None
Driveways None
None
Inside Shoulder: MP's 24.32-24.36, 24.65-24.72, 25.54-25.81, 26.56-26.76, 27.41-27.86, 28.22-28.28, 28.82-28.86Outside Shoulder: MP's 24.29-24.35, 24.88-24.92, 25.54-25.56, 26.76-26.80, 27.29-27.83, 28.06-28.19, 28.51-28.56, 28.83-28.84Guiderail Limits
Barrier Curb Limits/Height/Reveal
Inside & Outside Shoulders(see Note 6)
Curb Limits/Reveal
Feature
Subbase
BeginMP
EndMP
Comments
1) AC = Asphalt Concrete, PCC = Portland Cement Concrete
Roadway
Inside & Outside Shoulders
Inside & Outside Shoulders
AC
Inside & Outside Shoulders
Inside & Outside Shoulders
Inside & Outside Shoulders
PCC
Overall Pavement Condition
Ride Quality
PMS DataBase
Subbase
Predominant DistressesSNeff
SubgradeOverall
Pavement Condition
PMS DataBase
FWD Basin/
MidslabD0
(mils)
Ride Quality
Direction Predominant Distresses
AC
SNeff
SubgradePCC FWD Basin/
MidslabD0
(mils)
Inside & Outside Shoulders
Flexible Pavement:Lanes 1, 2 and 3
(where exist)
Flexible Pavement:Lane 1 and 2(where exist)
Direction
Inside & Outside Shoulders
Flexible Pavement:Lanes 1, 2 and 3
(where exist)
Roadway
Flexible Pavement:Lanes 1 and 2(see Note 6)
BeginMP Section
Flexible Pavement:Lane 1
Section
Flexible Pavement:Lanes 1, 2 and 3
(where exist)
EndMP

Table 1d. SUMMARY OF DESIGN FINDINGS BY SECTION FOR EASTBOUND MAINLINE LANE PAVEMENT
FD(SY)
PD(SY) 2" HMA 3" HMA 4" HMA 3" HMA 4" HMA 5" HMA 4" HMA 5" HMA 6" HMA
033 E 24.20 25.36 0.00 NA NA 20.0 20.0 20.0 20.0 20.0 20.0 20.0 20.0 20.0
033 E 25.36 27.21 0.00 NA NA 15.8 20.0 20.0 16.1 20.0 20.0 16.4 20.0 20.0
033 E 27.21 27.54 0.00 NA NA 20.0 20.0 20.0 20.0 20.0 20.0 20.0 20.0 20.0
033 E 27.54 27.91 0.00 NA NA 20.0 20.0 20.0 20.0 20.0 20.0 20.0 20.0 20.0
033 E 27.91 28.88 0.00 NA NA 13.7 20.0 20.0 13.7 20.0 20.0 13.7 20.0 20.0
033 E 28.88 29.00 0.00 NA NA 16.7 20.0 20.0 16.7 20.0 20.0 16.7 20.0 20.0
Table 1e. SUMMARY OF DESIGN FINDINGS BY SECTION FOR EASTBOUND SHOULDER PAVEMENT
FD(SY)
PD(SY) 2" HMA 3" HMA 4" HMA 3" HMA 4" HMA 5" HMA 4" HMA 5" HMA 6" HMA
033 E 24.20 24.35 NA NA NA 1.3 --- --- 1.4 --- --- --- --- ---
033 E 24.35 25.36 NA NA NA 2.6 --- --- 2.7 --- --- --- --- ---
033 E 25.36 25.87 NA NA NA 1.3 --- --- 1.4 --- --- --- --- ---
033 E 25.87 27.21 NA NA NA 0.9 --- --- 1.0 --- --- --- --- ---
033 E 27.21 27.54 NA NA NA 1.7 --- --- --- --- --- 2.1 --- ---
033 E 27.54 27.91 NA NA NA 2.1 --- --- --- --- --- 2.6 --- ---
033 E 27.91 28.88 NA NA NA 2.0 --- --- --- --- --- 2.4 --- ---
033 E 28.88 29.00 NA NA NA --- --- --- --- --- --- --- --- ---
Notes:
2) FD = Full Depth Concrete Pavement Repair, PD = Partial Depth Concrete Repair
1) HMA = Hot Mix Asphalt, DGA = Dense-Graded Aggregate Base Course
3) The eastbound lanes are believed to consist of composite pavement from approximately MP 24.20 to 24.31, while the eastbound inside shoulder is believed to consist of composite pavement from approximately MP 24.26 to 24.32. Limited core and As-Built data indicate the composite pavement consists of 6 in. AC/8 in. PCC/6 in. Subbase.
20-YearReconstruction
Box
Mill 2" & Overlay with:10-YearOverlay (HMA) Requirement
(in.)
Inside & Outside Shoulders
Inside & Outside Shoulders(see Note 3)
10 in. HMAover
8 in. DGA
Inside & Outside Shoulders
Inside & Outside Shoulders
Inside & Outside Shoulders
Inside & Outside Shoulders
Inside & Outside Shoulders
Inside & Outside Shoulders
Roadway Direction BeginMP
EndMP Section
20-YearReconstruction
Box
Mill 4" & Overlay with:
Expected Service Life(years)
Expected Service Life(years)
SectionMill 3" & Overlay with:
Mill 3" & Overlay with:Required Repairs
Mill 2" & Overlay with:
Flexible Pavement:Lanes 1 and 2(see Note 3)
10 in. HMAover
8 in. DGA
Flexible Pavement:Lanes 1, 2 and 3
(where exist)
Flexible Pavement:Lanes 1, 2 and 3
(where exist)
Flexible Pavement:Lanes 1, 2 and 3
(where exist)
Flexible Pavement:Lane 1 and 2(where exist)
10-YearOverlay (HMA) Requirement
(in.)
Required Repairs
Roadway Direction BeginMP
EndMP
Flexible Pavement:Lane 1
Mill 4" & Overlay with:

Table 2a. SUMMARY OF EVALUATION FINDINGS BY SECTION FOR WESTBOUND MAINLINE LANE PAVEMENT
D1A
(in.)E1A
(ksi)a1
D1C
(in.)E1C
(ksi)D2
(in.)E2
(ksi)a2
D3
(in.)E3
(ksi)a3
MR
(psi)k
(psi/in.)
Skid Value
(SN40R)
IRI(in./mi.) SDI
Avg. Rut
Depth(in.)
033 W 24.31 24.84 10.50 790 NA --- --- 12.00 40 NA --- --- --- 5,139 NA 6.7 5.79
M-Fatigue Cracking; Isolated H-Fatigue Cracking; M-Block Cracking; M/H-Longitudina
Cracking between Lanes; M-Longitudinal Cracking; Patches; Scattered Potholes
--- 114 0.11 0.28 Poor Fair
033 W 24.84 25.76 9.75 554 NA --- --- 12.00 40 NA --- --- --- 5,606 NA 8.3 5.02
M-Fatigue Cracking; Isolated H-Fatigue Cracking; M-Block Cracking; M/H-Longitudina
Cracking between Lanes; M-Longitudinal Cracking; Patches; Scattered Potholes
--- 106 0.10 0.30 Poor Fair
033 W 25.76 26.55 11.00 1,190 NA --- --- 12.00 39 NA --- --- --- 4,889 NA 6.1 6.34
M-Fatigue Cracking; Isolated H-Fatigue Cracking; M-Block Cracking; M/H-Longitudina
Cracking between Lanes; M-Transverse Cracking; Patches; Scattered Potholes
--- 120 0.13 0.28 Poor Fair
033 W 26.55 26.99 10.00 982 NA --- --- 12.00 37 NA --- --- --- 4,362 NA 7.0 5.77 M/H-Fatigue Cracking; M/H-Longitudinal Cracking; M-Transverse Cracking --- 145 0.15 0.27 Poor Fair
033 W 26.99 27.54 10.50 1,260 NA --- --- 12.00 37 NA --- --- --- 5,036 NA 5.5 6.54M-Fatigue Cracking; L/M-Block Cracking; M/H-
Longitudinal Cracking between Lanes; Scattered M/H-Transverse Cracking; Patches;
Scattered Potholes
--- 125 0.30 0.27 Poor Fair
033 W 27.54 27.91 10.50 1,500 NA --- --- 12.00 30 NA --- --- --- 4,809 NA 4.3 7.58M-Fatigue Cracking; L/M-Block Cracking; M/H-
Longitudinal Cracking between Lanes; Scattered M/H-Transverse Cracking; Patches;
Scattered Potholes
--- 148 0.70 0.28 Poor Fair
033 W 27.91 28.88 8.50 994 NA --- --- 12.00 37 NA --- --- --- 4,262 NA 8.2 5.10
M/H-Fatigue Cracking; M/H-Block Cracking; M/H-Longitudinal Cracking between Lanes; Transverse Cracking; Patches; Scattered
Potholes
--- 169 1.72 0.42 Very Poor Fair
033 W 28.88 29.00 8.50 NT 0.44 --- --- 12.00 NT 0.13 --- --- --- 4,500 NA NT 5.30 L-Longitudinal Cracking --- 112 2.53 0.31 Very Good Fair
Table 2b. SUMMARY OF EVALUATION FINDINGS BY SECTION FOR WESTBOUND SHOULDER PAVEMENT
D1A
(in.)E1A
(ksi)a1
D1C
(in.)E1C
(ksi)D2
(in.)E2
(ksi)a2
D3
(in.)E3
(ksi)a3
MR
(psi)k
(psi/in.)
Skid Value
(SN40R)
IRI(in./mi.) SDI
Avg. Rut
Depth(in.)
033 W 24.31 24.94 4.00 NT 0.40 --- --- 19.00 NT 0.11 --- --- --- 4,500 NA NT 3.69L/M-Longitudinal Cracking between Lanes;
L/M-Transverse Cracking; Scattered Patches & Potholes
--- --- --- --- Good Fair
033 W 24.94 26.79 4.00 NT 0.38 --- --- 19.00 NT 0.11 --- --- --- 4,500 NA NT 3.61L/M-Longitudinal Cracking between Lanes; L/M-Longitudinal & Transverse Cracking;
Scattered Patches & Potholes--- --- --- --- Fair Fair
033 W 26.79 27.43 5.00 NT 0.38 --- --- 19.00 NT 0.11 --- --- --- 4,500 NA NT 3.99L/M-Longitudinal Cracking between Lanes;
L/M-Transverse Cracking; Scattered Patches & Potholes
--- --- --- --- Fair Fair
033 W 27.43 28.88 4.00 NT 0.38 --- --- 16.00 NT 0.11 --- --- --- 4,500 NA NT 3.28L/M-Longitudinal Cracking between Lanes; L/M-Transverse Cracking; Scattered L/M-
Fatigue Cracking; M-Edge Cracking--- --- --- --- Fair Fair
033 W 28.88 29.00 5.00 NT 0.40 --- --- 16.00 NT 0.11 --- --- --- 4,500 NA NT 3.76 L-Longitudinal Cracking --- --- --- --- Very Good Good
Notes:
2) NT = No Falling Weight Deflectometer Testing was performed.
3) L = Low Severity, M = Medium Severity, H = High Severity; Distresses correspond to types and severities defined in SHRP's Distress Identification Manual for the Long-Term Pavement Performance Program (June 2003)
4) Overall Pavement Condition has been subjectively evaluated as either Very Good, Good, Fair, Poor, or Very Poor.
5) Ride Quality has been evaluated as either Excellent, Good, Fair, or Deficient.
Table 2c. SUMMARY OF DESIGN CONSTRAINTS FOR WESTBOUND PAVEMENT
PMS DataOverall
Pavement Condition
Ride Quality
Flexible Pavement:Lanes 1, 2 & 3(where exist)
FWD Basin/
MidslabD0
(mils)
Flexible Pavement:Lanes 1, 2 & 3(where exist)
Flexible Pavement:Lanes 1, 2 & 3(where exist)
Flexible Pavement:Lanes 1, 2 & 3(where exist)
Predominant Distresses
Flexible Pavement:Lanes 1 & 2(see Note 6)
Drainage Issues None
Barrier Curb Limits/Height/Reveal None
Guiderail Limits
Overpasses: MP's 24.68, 25.68, 26.59, 28.24, 29.04Bridges (AC surface): MP's 26.23, 27.34, 28.09, 28.55Bridges (PCC surface): MP's 27.50-27.57, 27.67-27.71
Driveways None
Overpasses/Bridges
Inside Shoulder: MP's 24.65-24.71, 25.55-25.81, 26.56-26.75, 27.42-27.73, 28.20-28.26, 28.81-29.04Outside Shoulder: MP's 24.90-24.94, 25.56-25.62, 25.78-25.97, 26.23-26.27, 26.72-26.81, 27.34-27.41, 27.46-27.73, 27.84-27.86, 28.24-28.33, 28.54-28.59
Curb Limits/Reveal None
PCC
Section
Inside & Outside Shoulders
PMS DataOverall
Pavement Condition
Ride Quality
EndMP
Inside & Outside Shoulders
Base
Inside & Outside Shoulders(see Note 6)
Predominant DistressesRoadway Direction BeginMP
Comments
Inside & Outside Shoulders
1) AC = Asphalt Concrete, PCC = Portland Cement Concrete
AC
Feature
Inside & Outside Shoulders
FWD Basin/
MidslabD0
(mils)
Subbase Subgrade
SNeff
6) The westbound lanes are believed to consist of composite pavement from approximately MP 24.34 to 24.40, while the westbound inside and outside shoulders are believed to consist of composite pavement from approximately MP 24.34 to 24.37 and from approximately MP 24.37 to 24.41, respectively. Limited core and As-Built data indicate the composite pavement consists of 6 in. AC/8 in. PCC/6 in. Subbase.
SNeff
AC Base Subbase
Section
Subgrade
Flexible Pavement:Lanes 1, 2 & 3(where exist)
Flexible Pavement:Lane 1
Flexible Pavement:Lanes 1, 2 & 3(where exist)
PCC
Roadway Direction BeginMP
EndMP

Table 2d. SUMMARY OF DESIGN FINDINGS BY SECTION FOR WESTBOUND MAINLINE LANE PAVEMENT
FD(SY)
PD(SY) 2" HMA 3" HMA 4" HMA 3" HMA 4" HMA 5" HMA 4" HMA 5" HMA 6" HMA
033 W 24.31 24.84 0.00 NA NA 20.0 20.0 20.0 20.0 20.0 20.0 20.0 20.0 20.0
033 W 24.84 25.76 0.00 NA NA 20.0 20.0 20.0 20.0 20.0 20.0 20.0 20.0 20.0
033 W 25.76 26.55 0.00 NA NA 20.0 20.0 20.0 20.0 20.0 20.0 20.0 20.0 20.0
033 W 26.55 26.99 0.00 NA NA 20.0 20.0 20.0 20.0 20.0 20.0 20.0 20.0 20.0
033 W 26.99 27.54 0.00 NA NA 20.0 20.0 20.0 20.0 20.0 20.0 20.0 20.0 20.0
033 W 27.54 27.91 0.00 NA NA 20.0 20.0 20.0 20.0 20.0 20.0 20.0 20.0 20.0
033 W 27.91 28.88 0.00 NA NA 13.6 20.0 20.0 13.6 20.0 20.0 13.6 20.0 20.0
033 W 28.88 29.00 0.00 NA NA 19.3 20.0 20.0 19.3 20.0 20.0 19.3 20.0 20.0
Table 2e. SUMMARY OF DESIGN FINDINGS BY SECTION FOR WESTBOUND SHOULDER PAVEMENT
FD(SY)
PD(SY) 2" HMA 3" HMA 4" HMA 3" HMA 4" HMA 5" HMA 4" HMA 5" HMA 6" HMA
033 W 24.31 24.94 NA NA NA 1.9 --- --- --- --- --- 2.1 --- ---
033 W 24.94 26.79 NA NA NA 1.7 --- --- --- --- --- 2.1 --- ---
033 W 26.79 27.43 NA NA NA 3.2 --- --- --- --- --- 3.8 --- ---
033 W 27.43 28.88 NA NA NA 1.2 --- --- --- --- --- 1.5 --- ---
033 W 28.88 29.00 NA NA NA --- --- --- --- --- --- --- --- ---
Notes:
2) FD = Full Depth Concrete Pavement Repair, PD = Partial Depth Concrete Repair
10-YearOverlay (HMA) Requirement
(in.)
Required Repairs
6) The westbound lanes are believed to consist of composite pavement from approximately MP 24.34 to 24.40, while the westbound inside and outside shoulders are believed to consist of composite pavement from approximately MP 24.34 to 24.37 and from approximately MP 24.37 to 24.41, respectively. Limited core and As-Built data indicate the composite pavement consists of 6 in. AC/8 in. PCC/6 in. Subbase.
Expected Service Life(years)
20-YearReconstruction Box
Mill 2" & Overlay with: Mill 3" & Overlay with: Mill 4" & Overlay with:
Flexible Pavement:Lanes 1, 2 & 3(where exist)
Flexible Pavement:Lanes 1, 2 & 3(where exist)
Flexible Pavement:Lanes 1, 2 & 3(where exist)
Flexible Pavement:Lane 1
Roadway Direction BeginMP
EndMP
Expected Service Life(years)
20-YearReconstruction Box
Mill 2" & Overlay with: Mill 3" & Overlay with: Mill 4" & Overlay with:
Flexible Pavement:Lanes 1 & 2(see Note 3)
Flexible Pavement:Lanes 1, 2 & 3(where exist)
Flexible Pavement:Lanes 1, 2 & 3(where exist)
Flexible Pavement:Lanes 1, 2 & 3(where exist)
Roadway Direction BeginMP
EndMP Section
10 in. HMAover
8 in. DGA
1) HMA = Hot Mix Asphalt, DGA = Dense-Graded Aggregate Base Course
Required Repairs
Inside & Outside Shoulders(see Note 3)
Inside & Outside Shoulders
Inside & Outside Shoulders
Inside & Outside Shoulders
Inside & Outside Shoulders
10-YearOverlay (HMA) Requirement
(in.)
10 in. HMAover
8 in. DGA
Section

TABLE 3. SUMMARY OF FINDINGS FOR RAMP AND GRADE-SEPARATED INTERCHANGE CROSSROAD PAVEMENT
FD(SY)
PD(SY)
E A102560 To S Wemrock Road AC M-Fatigue Cracking; M-Transverse and Longitudinal Cracking NA NA Fair Resurfacing
E B102570 From S Wemrock Road AC Scattered L/M-Fatigue Cracking NA NA Fair
None(Resurfacing Recommended If
Resurface Other Ramps)
W X102580 To N Wemrock Road AC M-Fatigue Cracking; M-Block Cracking; Scattered Patches & Potholes NA NA Poor Deep Resurfacing
W Y102570 From N Wermrock Road AC M-Fatigue Cracking; M-Block Cracking NA NA Poor Deep Resurfacing
E & W AC M/H-Block Cracking; M-Fatigue Cracking NA NA Poor Deep Resurfacing
E B102650 From S CR-537 ACScattered L/M-Fatigue Cracking;
Scattered L/M-Transverse Cracking; Isolated Potholes
NA NA Fair Resurfacing
E A102660 To N CR-537 ACL/M-Transverse & Longitudinal
Cracking; Scattered L/M-Fatigue Cracking
NA NA Fair Resurfacing
E B102680 From N CR-537 AC Scattered L/M-Fatigue Cracking; Scattered L/M-Block Cracking NA NA Fair Resurfacing
W Y102630 From S CR-537 AC M/H-Block Cracking; M/H-Longitudinal Cracking; Scattered Patches & Potholes NA NA Poor Deep Resurfacing
W X102650 To S CR-537 AC M-Block Cracking; M-Transverse Cracking; Scattered Patching NA NA Poor Deep Resurfacing
M Block Cracking M Trans erse
Roadway Direction MP RampNumber
Connecting Roadway Straight Line Diagram
Overpass: Wemrock Road
Predominant DistressesRequired Repairs Overall
Pavement Condition
Resurfacing or Reconstruction
Required?
AC/PCCSurface
25.68
26.59
033
033
W X102670 To N CR-537 AC M-Block Cracking; M-Transverse Cracking; Scattered Patching NA NA Poor Deep Resurfacing
E & W ACL-Longitudinal Cracking between Lanes;
L/M-Transverse Cracking; Isolated Patches
NA NA Fair None
E Y111270 To S US-9 AC L/M-Fatigue Cracking; L/M-Transverse Cracking NA NA Fair Deep Resurfacing
W Y111290 To S US-9 AC M/H-Block Cracking; M-Fatigue Cracking NA NA Poor Deep Resurfacing
E & W AC L-Longitudinal Cracking between Lanes; Rutting (<0.25") NA NA Fair None
E & W ACM-Longitudinal Cracking between
Lanes; M/H- Transverse Cracking; L/M-Fatigue Cracking
NA NA Poor None
Underpass: S US-9
Underpass: N US-9
Overpass: CR-537
033 27.54

TABLE 3. SUMMARY OF FINDINGS FOR RAMP AND GRADE-SEPARATED INTERCHANGE CROSSROAD PAVEMENT
FD(SY)
PD(SY)
Roadway Direction MP RampNumber
Connecting Roadway Straight Line DiagramPredominant Distresses
Required Repairs Overall Pavement Condition
Resurfacing or Reconstruction
Required?
AC/PCCSurface
E B102770 From S NJ-79 AC Ramp Abandoned NA NA NA NA
E B102780 From N NJ-79 AC M-Longitudinal Cracking; Scattered L/M-Fatigue Cracking NA NA Fair Resurfacing
E B202780 From W Willowbrook Road AC M-Transverse & Longitudinal Cracking;
Scattered L/M-Fatigue Cracking NA NA Fair Resurfacing
W Y202770 From S NJ-79 AC M-Fatigue Cracking; M-Transverse Cracking NA NA Poor Deep Resurfacing
W Y102770 From N NJ-79 AC M/H-Block Cracking; M-Fatigue Cracking NA NA Poor Deep Resurfacing
W X102790 To N NJ-79 AC M/H-Block Cracking NA NA Poor Deep Resurfacing
E & W ACM-Fatigue Cracking; L/M-Longitudinal Cracking
between lanes; L-Transverse Cracking; Isolated H-Fatigue Cracking
NA NA Poor Deep Resurfacing
E A102880 To S Halls Mill Road AC M-Fatigue Cracking; M-Edge Cracking; L/M-Transverse Cracking
NA NA Fair Resurfacing
E B102890 From S Halls Mill Road
AC M-Fatigue Cracking; M-Edge Cracking; L/M-Longitudinal Cracking
NA NA Fair Resurfacing
E A102910 To N Halls Mill Road AC M-Fatigue Cracking; M-Edge Cracking; L/M-Transverse Cracking; Isolated Potholes NA NA Fair Resurfacing
E B102920 From N Halls Mill Road
AC M-Fatigue Cracking; M-Edge Cracking; L/M-Longitudinal Cracking
NA NA Fair Resurfacing
W Y102880 From S Halls Mill Road
AC L/M-Fatigue Cracking; L/M-Transverse & Fatigue Cracking
NA NA Fair Resurfacing
W X102890 To S Halls Mill Road AC L/M-Fatigue Cracking; Isolated Potholes NA NA Fair Resurfacing
W Y102910 From N Halls Mill Road
AC M-Fatigue Cracking; L/M-Transverse Cracking
NA NA Fair Resurfacing
W X202920 To W Oakerson Road AC M-Fatigue Cracking; L/M-Transverse NA NA Fair Resurfacing
Underpass: NJ-79
033 27.69
033 29.04
W X202920 To W Oakerson Road AC M Fatigue Cracking; L/M Transverse Cracking
NA NA Fair Resurfacing
W X102920 To E Oakerson Road AC Isolated L/M-Fatigue Cracking NA NA GoodNone
(Resurfacing Recommended If Resurface Other Ramps)
E & W AC M-Block Cracking; M-Longitudinal Cracking between Lanes; M-Transverse Cracking NA NA Poor Resurfacing
Notes:
Overpass: Halls Mill Road
3) FD = Full Depth Concrete Pavement Repair, PD = Partial Depth Concrete Repair4) Overall Pavement Condition has been subjectively evaluated as either Very Good, Good, Fair, Poor, or Very Poor.
2) L = Low Severity, M = Medium Severity, H = High Severity; Distresses correspond to types and severities defined in SHRP's Distress Identification Manual for the Long-Term Pavement Performance Program (June 2003)
1) AC = Asphalt Concrete, PCC = Portland Cement Concrete

Table 4. Core Results
Core No. Roadway Direction Lane Milepost Offset
(ft.)
ACThickness
(in.)
PCCThickness
(in.)Underlying Layers Core Description
1 Route 33 Eastbound 2 24.22 10 6.00 7.75 SD w/Fn GVL (SE) AC not bonded to PCC; Rebar at 3.5 in. depth in PCC
2 Route 33 Eastbound 2 24.50 10 12.75 --- SD & Fn GVL w/Silt Crack propagated 2 in. from top of AC
3 Route 33 Eastbound Outside Shoulder 24.50 7 3.75 --- SD & Fn GVL w/Silt AC was broken into 2 pieces with interface
depth of 1.75 in.
4 Route 33 Eastbound 2 24.93 10 11.00 ---
0-6": SD & Fn GVL w/Silt & Clay6-12": SD & Fn GVL w/Silt & Clay12-18": SD w/Fn GVL, Silt, & Clay18-24": SD w/Fn GVL, Silt, & Clay
5 Route 33 Eastbound 2 25.21 9 11.00 ---
0-6": SD w/Fn GVL & Silt6-12": SD w/Fn GVL, Silt, & Clay12-18": SD w/Fn GVL, Silt, & Clay18-24": SD w/Fn GVL, Silt, & Clay
6 Route 33 Eastbound 3 25.48 6 9.00 --- SD w/Fn GVL Crack propagated 2.5 in. from top of AC
7 Route 33 Eastbound Outside Shoulder 25.48 6 4.00 ----
0-6": SD & Fn GVL w/Silt6-12": SD & Fn GVL w/Silt12-18": SD & Fn GVL w/Silt18-24": SD w/Fn GVL & Silt
Crack propagated 1 in. from bottom of AC
8 Route 33 Eastbound 2 26.01 7 8.50 ----
0-6": SD & Fn GVL w/Silt & Clay6-12": SD & Fn GVL w/Silt & Clay12-18": SD w/Fn GVL, Silt, & Clay18-24": SD w/Fn GVL, Silt, & Clay
Crack propagated throughout AC; AC was broken into 2 pieces with interface depth of
5 in.
9 Route 33 Eastbound 2 26.31 9 9.00 ---- SD & Fn GVL w/Silt
10 Route 33 Eastbound Outside Shoulder 26.31 7 2.25 ---
0-6": SD w/Fn GVL & Silt6-12": SD & Fn GVL w/Silt12-18": SD w/Fn GVL & Silt18-24": SD w/Fn GVL

Table 4. Core Results
Core No. Roadway Direction Lane Milepost Offset
(ft.)
ACThickness
(in.)
PCCThickness
(in.)Underlying Layers Core Description
11 Route 33 Eastbound 2 26.91 10 10.00 ---- SD & Fn GVL w/Silt & ClayCrack propagated 2.75 in. from top of AC; AC was broken into 2 pieces with interface
depth of 7.5 in.
12 Route 33 Eastbound 2 27.45 7 10.75 ----
0-6": SD w/Fn GVL, Silt, & Clay6-12": SD w/Fn GVL, Silt, & Clay12-18": SD w/Fn GVL, Silt, & Clay18-24": SD w/Fn GVL & Silt
Crack propagated throughout AC; AC was broken into 3 pieces with interface depths
of 1.75 in. & 5.25 in.; AC is severely stripped at 5.25 in. depth
13 Route 33 Eastbound 2 27.60 7 10.50 --- SD w/Fn GVL, Silt, & Clay
14 Route 33 Eastbound 2 28.04 10 8.00 --- SD & Fn GVL (SE) w/Silt & Clay
15 Route 33 Eastbound Outside Shoulder 28.04 6 4.75 ---
0-6": SD & Fn GVL (SE) w/Silt & Clay6-12": SD w/Fn GVL (SE), Silt, & Clay12-18": SD w/Fn GVL (SE), Silt, & Clay18-24": SD w/Fn GVL (SE), Silt, & Clay
Crack propagated 2 in. from top of AC
16 Route 33 Eastbound 2 28.29 9 9.50 ----
0-6": SD & Fn GVL (SE) w/Silt6-12": SD w/Fn GVL (SE), Silt, & Clay12-18": SD & Fn GVL (SE) w/Silt18-24": SD & Fn GVL (SE) w/Silt
Crack propagated 3.75 in. from top of AC
17 Route 33 Eastbound 2 28.66 10 8.50 --- SD & Fn GVL (SE) w/Silt & Clay
18 Route 33 Eastbound Outside Shoulder 28.66 6 4.75 --- SD w/Fn GVL & Silt
19 Route 33 Westbound 2 28.85 9 9.00 ---
0-6": SD w/Fn GVL (SE) & Silt6-12": SD w/Fn GVL (SE) & Silt12-18": SD & Fn GVL (SE) w/Silt & Clay18-24": SD w/Fn GVL (SE) & Silt
Crack propagated 3 in. from top of AC
20 Route 33 Westbound 2 28.39 11 8.50 --- SD & Fn GVL (SE)

Table 4. Core Results
Core No. Roadway Direction Lane Milepost Offset
(ft.)
ACThickness
(in.)
PCCThickness
(in.)Underlying Layers Core Description
21 Route 33 Westbound Outside Shoulder 28.39 6 4.00 ---
0-6": SD & Fn GVL (SE)6-12": SD & Fn GVL (SE)12-18": SD & Fn GVL (SE) w/Silt18-24": SD w/Fn GVL (SE) & Silt
22 Route 33 Westbound 2 28.06 9 8.25 ---
0-6": SD & Fn GVL (SE) w/Silt & Clay6-12": SD & Fn GVL (SE) w/Silt & Clay12-18": SD w/Fn GVL (SE) & Silt18-24": SD w/Fn GVL (SE) & Silt
Crack propagated 3.75 in. from top of AC
23 Route 33 Westbound 2 27.42 9 11.00 --- Fn GVL w/SD Crack propagated 0.5 in. from top of AC
24 Route 33 Westbound Outside Shoulder 27.42 8 5.00 --- SD w/Fn GVL & Silt
25 Route 33 Westbound 2 27.10 10 11.00 ---
0-6": SD w/Fn GVL, Silt, & Clay6-12": SD w/Fn GVL, Silt, & Clay12-18": SD w/Fn GVL, Silt, & Clay18-24": SD w/Fn GVL, Silt, & Clay
26 Route 33 Westbound 2 26.69 11 10.25 --- SD & Fn GVL AC was broken into 2 pieces with interface depth of 3 in.
27 Route 33 Westbound Outside Shoulder 26.69 7 11.00 ---
0-6": SD w/Fn GVL & Silt6-12": SD w/Fn GVL & Silt12-18": SD w/Fn GVL, Silt, & Clay18-24": SD w/Fn GVL, Silt, & Clay
28 Route 33 Westbound 2 26.46 8 11.00 --- Fn GVL w/SD
Crack propagated throughout AC; AC was broken into 3 pieces with interface depth of
7.25 in. & 9 in.; AC is severely stripped throughout AC depth
29 Route 33 Westbound 2 26.06 11 11.25 ---
0-6": SD & Fn GVL w/Silt6-12": SD & Fn GVL w/Silt12-18": SD w/Fn GVL & Silt18-24": SD w/Fn GVL & Silt
30 Route 33 Westbound 2 25.73 7 11.25 --- SD & Fn GVL w/Silt AC was broken into 2 pieces with interface depth of 3.75 in.

Table 4. Core Results
Core No. Roadway Direction Lane Milepost Offset
(ft.)
ACThickness
(in.)
PCCThickness
(in.)Underlying Layers Core Description
31 Route 33 Westbound Outside Shoulder 25.73 6 4.25 --- SD & Fn GVL w/Silt
32 Route 33 Westbound 2 25.38 11 10.50 ---
0-6": SD w/Fn GVL, Silt, & Clay6-12": SD w/Fn GVL, Silt, & Clay12-18": SD w/Fn GVL, Silt, & Clay18-24": SD w/Fn GVL, Silt, & Clay
AC was broken into 2 pieces with interface depth of 2.5 in.
33 Route 33 Westbound 2 25.04 10 9.00 --- SD & Fn GVL w/SiltAC was broken into 3 pieces with interface depths of 2 in. and 6 in.; Top & bottom of
AC stripped
34 Route 33 Westbound Outside Shoulder 25.04 6 > 2.50 ---
0-6": SD w/Silt6-12": SD w/Silt12-18": SD w/Fn GVL & Silt18-24": SD w/Fn GVL & Silt
AC disintegrated
35 Route 33 Westbound 2 24.64 10 10.75 --- SD & Fn GVL w/Silt & Clay
36 Route 33 Westbound 2 24.31 10 11.25 --- Fn GVL (SE)
10/18-26/10 Core Diameter (in.): 4.0Driller/Inspector: Jose Victoria/Mike Frabizzio Dates Started/Completed:
Notes: Lanes are numbered from inside to outside; Offset is measured from the inner stripe of the lane; Depths for "underlying layers" are referenced from the bottom of the AC or PCC layer.

Classification of Unbound Pavement Materials
Gravel (Natural) - Is a +¼" size bank run loose rock aggregate in its natural state with mostly rounded particals
Gravel (Stone) – Is a +¼" size solid rock aggregate of minerals, such as Igneous, sedimentary, and metamorphic
manufactured at rock quarries into varying sizes by crushing large boulders.
Sand (Natural) - Is a -¼" bank run material in its natural state with mostly rounded particles.
Sand (Stone) – Is a -¼" solid rock aggregate of minerals, such as Igneous, sedimentary, and metamorphic.
Use “&” when multiple classes of material exist in approximately equal proportions. Use “w/” when a second
class of material exists in a noticeably smaller quantity than the main class of material.
Example: Coarse gravel consisting of broken stone & some (small amount) natural sand would be abbreviated as
Crse GVL (SE) w/SD.
Note: Bound base materials are not addressed above. Such materials should be termed according to the best
available information (As-Builts, experienced staff, etc.). Examples of these include Penetration Macadam, Lime-
Stabilized Soil, etc.
Soil Class Abbreviation Size Range
Boulders Boulders Over 12"
Cobbles Cobbles 3"-12"
Gravel
(Natural)
Coarse Crse GVL 1½"-3"
Fine Fn GVL ¼"-1½"
Gravel
(Stone)
Coarse Crse GVL (SE) 1½"-3"
Fine Fn GVL (SE) ¼"-1½"
Sand
(Natural)
Sand
(Natural) SD #200-¼"
Sand
(Stone)
Sand
(Stone) SD (SE) #200-¼"
Fines
Silt Silt
Finer than Sand; Difficult
to feel particles; Leaves
residue on bag when
wetted
Clay Clay
Can roll & clump material;
Note: Clay indicates
potential settlement
problems & thus should be
termed with extreme care
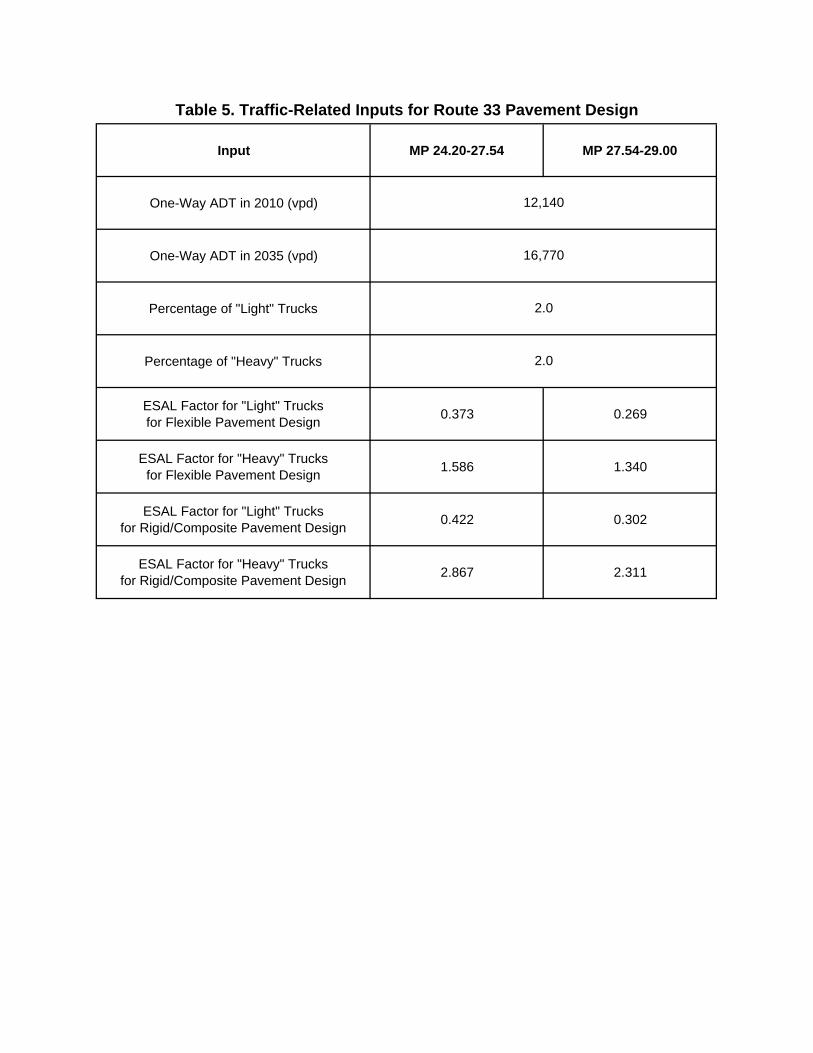
Input MP 24.20-27.54 MP 27.54-29.00
One-Way ADT in 2010 (vpd)
One-Way ADT in 2035 (vpd)
Percentage of "Light" Trucks
Percentage of "Heavy" Trucks
ESAL Factor for "Light" Trucksfor Flexible Pavement Design 0.373 0.269
ESAL Factor for "Heavy" Trucksfor Flexible Pavement Design 1.586 1.340
ESAL Factor for "Light" Trucksfor Rigid/Composite Pavement Design 0.422 0.302
ESAL Factor for "Heavy" Trucksfor Rigid/Composite Pavement Design 2.867 2.311
Table 5. Traffic-Related Inputs for Route 33 Pavement Design
12,140
16,770
2.0
2.0

Outside Shldr.
Lane 2&
Lane 3(where exists)
Lane 1
Inside Shldr.
Inside Shldr.
Lane 1
Lane 2&
Lane 3( h i t )
Table 6. Pavement Restoration Recommendations for Route 33
Milepost
24.3
0
24.5
0
24.7
0
24.9
0
25.1
0
25.3
0
25.5
0
25.7
0
27.5
0
27.7
0
27.9
0
28.1
0
28.7
0
27.1
0
27.3
0
25.9
0
26.1
0
26.3
0
26.5
0
26.7
0
26.9
0
Wes
tbou
nd
28.3
0
28.5
0
MEDIAN - MEDIAN - MEDIAN
28.9
0
East
boun
d
24.3
124
.20
27.2
1
28.8
828
.88
Expected Service Life = 18.6 years
Expected Service Life = 17.6 years Expected Service Life = 16.4 years
(where exists)
Outside Shldr.
Mill 3 in.1
Perform Necessary Pre-Overlay Repairs (see below)Place 3 in. of Hot Mix Asphalt 12.5M64 Surface Course
Mill 4 in.1
Perform Necessary Pre-Overlay Repairs (see below)Place 2 in. of Hot Mix Asphalt 12.5M64 Surface CoursePlace 2 in. of Hot Mix Asphalt 12.5M64 Intermediate Course
Mill 2 in.Perform Necessary Pre-Overlay Repairs (see below)Place 2 in. of Hot Mix Asphalt 12.5M64 Surface Course
Do Nothing
26.3
0
25.1
0
27.7
0
27.9
0
28.1
0
Milepost
24.3
0
24.5
0
24.7
0
24.9
0
27.5
0
25.3
0
25.5
0
25.7
0
25.9
0
26.1
0
28.9
0
1Unbound material may be encountered when milling the inside shoulders. Wherever unbound material is encountered, "Removal of Pavement" and "Excavation, Unclassified" should be used on an "If & Where Directed" basis in lieu of "HMA Milling, 3" or Less" or "HMA Milling, More than 3" to 6"."
Pre-Overlay Repairs: Perform following repairs on an "If & Where Directed" basis: "Hot Mix Asphalt Pavement Repair"; "Sealing of Cracks in Hot Mix Asphalt Surface Course"
28.3
0
28.5
0
28.7
0
26.5
0
26.7
0
26.9
0
27.1
0
27.3
0
24.3
124
.20
27.2
1
28.8
828
.88
Expected Service Life = 18.6 years
Expected Service Life = 17.6 years Expected Service Life = 16.4 years

PAY ITEM NO. PAY ITEM PAY ITEM
QUANTITY PAY ITEM UNIT UNIT COST($)
PAY ITEM COST
($)
202009P EXCAVATION, UNCLASSIFIED* 274 CY 50.00 13,718
202021P REMOVAL OF PAVEMENT* 15,264 SY 10.25 156,454
401009P HMA MILLING, 3" OR LESS 118,437 SY 1.99 235,690
401012P HMA MILLING, MORES THAN 3" TO 6" 107,316 SY 2.75 295,118
401021M HOT MIX ASPHALT PAVEMENT REPAIR* 1,502 SY 40.00 60,097
401024M SEALING OF CRACKS IN HOT MIX ASPHALT SURFACE COURSE* 16,312 LF 1.00 16,312
401027M POLYMERIZED JOINT ADHESIVE 159,509 LF 0.30 47,853
401030M TACK COAT 34,076 GAL 3.00 102,229
401036M PRIME COAT* 3,819 GAL 3.00 11,457
401054M HOT MIX ASPHALT 12.5 M 64 SURFACE COURSE 30,950 T 72.00 2,228,397
401072M HOT MIX ASPHALT 12.5 M 64 INTERMEDIATE COURSE 13,592 T 72.00 978,654
TOTAL COST: 4,150,000
* denotes "If and Where Directed" item.
Table 7. COST ESTIMATE FOR:
Route 33: EB & WB (MP 24.3-29.0)
Note: The cost estimate includes recommended pavement work on Route 33 within the project limits but excludes recommended pavement work on ramps and grade-separated interchanges.

PAVEMENT EVALUATION AND DESIGN REPORT Route 33: EB & WB (MP 24.3-29.0)
Figures

24 24.25 24.5 24.75 25 25.25 25.5 25.75 26 26.25 26.5 26.75 27 27.25 27.5 27.75 28 28.25 28.5 28.75 29 29.25Milepost
15
14
13
12
11
10
9
8
7
6
5
4
3
2
1
0
Thic
knes
s in
Inch
es
Figure 1. Variation in AC Thickness for Route 33, Eastbound Lane 1, Based on GPR Data
Lane 1 (Ch 1)
Lane 1 Core (Ch 1)Eastbound Lane 1
Rt 33 9.5"12.7"10.9"1.3
Note: Eastbound Lane 1 ends at approximately MP 28.5
10th Percentile 90th Percentile

24 24.25 24.5 24.75 25 25.25 25.5 25.75 26 26.25 26.5 26.75 27 27.25 27.5 27.75 28 28.25 28.5 28.75 29 29.25Milepost
15
14
13
12
11
10
9
8
7
6
5
4
3
2
1
0
Thic
knes
s in
Inch
es
Cor
e #2
Cor
e #4
Cor
e #5
Cor
e #8
Cor
e #9
Cor
e #1
1
Cor
e #1
2
Cor
e #1
3
Cor
e #1
4
Cor
e #1
6
Cor
e #1
7
Figure 2. Variation in AC Thickness for Route 33, Eastbound Lane 2, Based on GPR Data
Lane 2 (Ch 1)
Lane 2 Core (Ch 1)Eastbound Lane 2
Rt 33 8.3"11.7"9.8"1.6
10th Percentile 90th Percentile

24 24.25 24.5 24.75 25 25.25 25.5 25.75 26 26.25 26.5 26.75 27 27.25 27.5 27.75 28 28.25 28.5 28.75 29 29.25Milepost
15
14
13
12
11
10
9
8
7
6
5
4
3
2
1
0
Thic
knes
s in
Inch
es
Cor
e #3
Cor
e #7
Cor
e #1
0
Cor
e #1
5
Cor
e #1
8
Figure 3. Variation in AC Thickness for Route 33, Eastbound Outside Shoulder, Based on GPR Data
Outside Shoulder
Outside Shoulder CoreEastbound OutsideShoulder
Rt 33 3.5"6.0"4.7"1.0
10th Percentile 90th Percentile

24 24.25 24.5 24.75 25 25.25 25.5 25.75 26 26.25 26.5 26.75 27 27.25 27.5 27.75 28 28.25 28.5 28.75 29 29.25Milepost
15
14
13
12
11
10
9
8
7
6
5
4
3
2
1
0
Thic
knes
s in
Inch
es
Figure 4. Variation in AC Thickness for Route 33, Westbound Lane 1, Based on GPR Data
Lane 1 (Ch 1)
Lane 1 Core (Ch 1)Westbound Lane 1
Rt 33 9.3"12.3"10.9"1.1
10th Percentile 90th Percentile
Note: Westbound Lane 1 starts at approximately MP 28.9

24 24.25 24.5 24.75 25 25.25 25.5 25.75 26 26.25 26.5 26.75 27 27.25 27.5 27.75 28 28.25 28.5 28.75 29 29.25Milepost
15
14
13
12
11
10
9
8
7
6
5
4
3
2
1
0
Thic
knes
s in
Inch
es
Cor
e #3
6
Cor
e #3
5
Cor
e #3
3
Cor
e #3
2
Cor
e #3
0
Cor
e #2
9
Cor
e #2
8
Cor
e #2
6
Cor
e #2
5
Cor
e #2
3
Cor
e #2
2
Cor
e #2
0
Cor
e #1
9
Figure 5. Variation in AC Thickness for Route 33, Westbound Lane 2, Based on GPR Data
Lane 2 (Ch 1)
Lane 2 Core (Ch 1)Westbound Lane 2
Rt 33 9.0"11.9"10.6"1.1
10th Percentile 90th Percentile

24 24.25 24.5 24.75 25 25.25 25.5 25.75 26 26.25 26.5 26.75 27 27.25 27.5 27.75 28 28.25 28.5 28.75 29 29.25Milepost
15
14
13
12
11
10
9
8
7
6
5
4
3
2
1
0
Thic
knes
s in
Inch
es
Cor
e #3
1
Cor
e #2
7
Cor
e #2
4
Cor
e #2
1
Figure 6. Variation in AC Thickness for Route 33, Westbound Outside Shoulder, Based on GPR Data
Outside Shoudler
Outside Shoudler CoreWestbound Outside Shoulder
Rt 33 3.8"5.9"4.9"1.4
10th Percentile 90th Percentile

PAVEMENT EVALUATION AND DESIGN REPORT Route 33: EB & WB (MP 24.3-29.0)
Distress Photo Log

Description: M/H-Transverse & longitudinal reflection cracking.
Description: M-Longitudinal & transverse cracking in Lane 2 & Outside Shoulder.
Description: M-Longitudinal reflection cracking.
Photo No: D-1
Road: Rte. 33
Direction: EB
Lane: 1 & 2
Sta./MP: 24.21
Photo No: D-2
Road: Rte. 33
Direction: EB
Lane: 2
Sta./MP: 24.22
Photo No: D-3
Road: Rte. 33
Direction: EB
Lane: 2 & OS
Sta./MP: 24.50

Description: M-Longitudinal cracking between lanes; L-Fatigue cracking.
Description: Sealed longitudinal & transverse cracking.
Description: M-Block cracking.
Photo No: D-4
Road: Rte. 33
Direction: EB
Lane: 1 & 2
Sta./MP: 24.51
Photo No: D-5
Road: Rte. 33
Direction: EB
Lane: 1
Sta./MP: 24.92
Photo No: D-6
Road: Rte. 33
Direction: EB
Lane: 1 & 2
Sta./MP: 25.87

Description: H-Block cracking & fatigue cracking.
Description: M-Block & fatigue cracking; M-Longitudinal cracking between lanes.
Description: H-Fatigue cracking & block cracking in lane & transverse cracking in inside shoulder.
Photo No: D-7
Road: Rte. 33
Direction: EB
Lane: 3
Sta./MP: 27.24
Photo No: D-8
Road: Rte. 33
Direction: EB
Lane: IS & 1
Sta./MP: 28.57
Photo No: D-9
Road: Rte. 33
Direction: WB
Lane: 1 & 2
Sta./MP: 28.55

Description: M-Transverse cracking.
Description: H-Transverse cracking & L-longitudinal cracking; H-Longitudinal cracking with patching between lanes.
Description: H-Longitudinal cracking between lanes; M-Fatigue cracking.
Photo No: D-10
Road: Rte. 33
Direction: WB
Lane: OS
Sta./MP: 27.42
Photo No: D-11
Road: Rte. 33
Direction: WB
Lane: 1 & 2
Sta./MP: 26.69
Photo No: D-12
Road: Rte. 33
Direction: WB
Lane: 1 & 2
Sta./MP: 26.43

Description: Fatigue cracking, rutting, & H-longitudinal cracking with patching between lanes.
Description: Minimal distress.
Description: Fatigue cracking in Lane 1; Transverse & longitudinal cracking; H-longitudinal cracking between lanes.
Photo No: D-15
Road: B102570
Direction: Ramp
Lane: 1
Sta./MP: 25.68
Photo No: D-14
Road: Rte. 33
Direction: WB
Lane: 1 & 2
Sta./MP: 25.04
Photo No: D-13
Road: Rte. 33
Direction: WB
Lane: 1
Sta./MP: 25.47
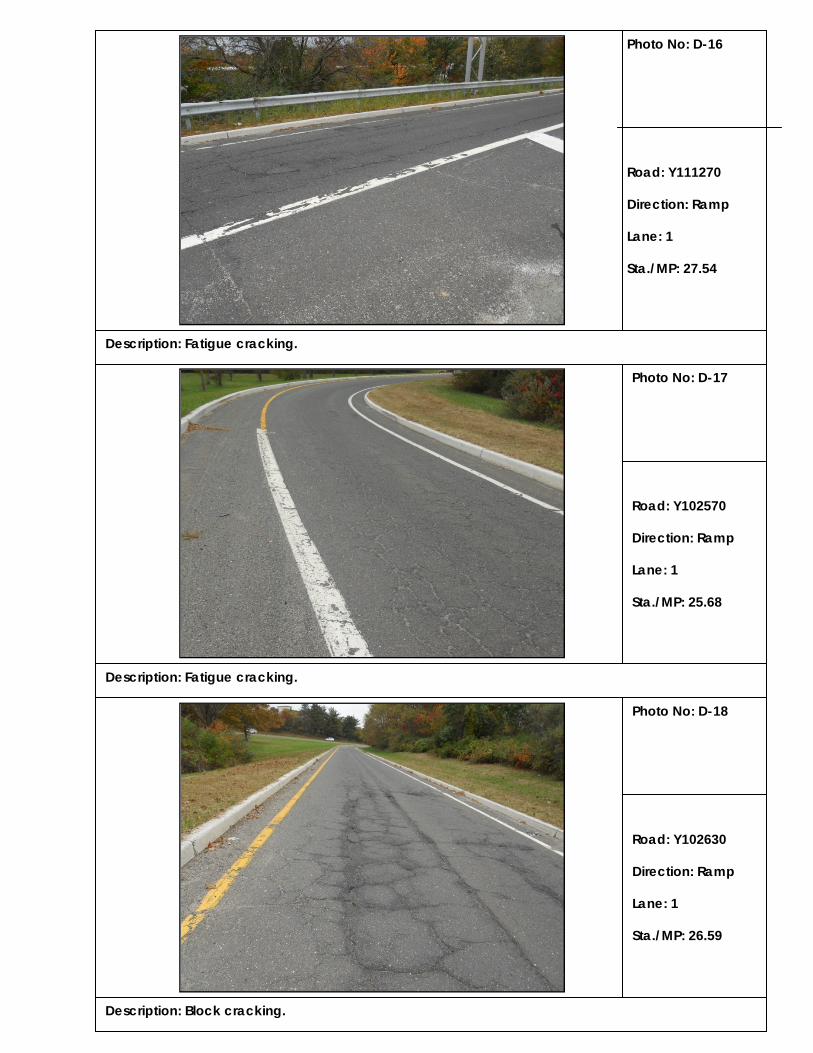
Description: Fatigue cracking.
Description: Block cracking.
Description: Fatigue cracking.
Photo No: D-16
Road: Y111270
Direction: Ramp
Lane: 1
Sta./MP: 27.54
Photo No: D-17
Road: Y102570
Direction: Ramp
Lane: 1
Sta./MP: 25.68
Photo No: D-18
Road: Y102630
Direction: Ramp
Lane: 1
Sta./MP: 26.59

Description: Minimal distress.
Description: L-longitudinal cracking.
Description: Fatigue & block cracking.
Photo No: D-19
Road: X102920
Direction: Ramp
Lane: 1
Sta./MP: 29.04
Photo No: D-20
Road: Wemrock Road
Direction: Overpass
Lane: N & S Lane 1
Sta./MP: 25.68
Photo No: D-21
Road: CR-537
Direction: Overpass
Lane: S Lane 1
Sta./MP: 26.59

Description: L-Longitudinal cracking between lanes.
Description: M-Longitudinal cracking between lanes.
Photo No: D-22
Road: Rte. 9
Direction: Underpass
Lane: S Lanes 1-3
Sta./MP: 27.54
Photo No: D-23
Road: Rte. 9
Direction: Underpass
Lane: N Lanes 1-2
Sta./MP: 27.54

PAVEMENT EVALUATION AND DESIGN REPORT Route 33: EB & WB (MP 24.3-29.0)
Core Photo Log

Description: Core# 1
Description: Core# 3
Description: Core# 2
Photo No: C-1
Road: 33
Direction: EB
Lane: 2
M.P: 24.22
Photo No: C-2
Road: 33
Direction: EB
Lane: 2
M.P: 24.50
Photo No: C-3
Road: 33
Direction: EB
Lane: Outside Shoulder
M.P: 24.50
Crack

Description: Core# 4
Description: Core# 6
Description: Core# 5
Photo No: 4
Road: 33
Direction: EB
Lane: 2
M.P: 24.93
Photo No: C-5
Road: 33
Direction: EB
Lane: 2
M.P: 25.21
Photo No: C-6
Road: 33
Direction: EB
Lane: 3
M.P: 25.48

Description: Core# 7
Description: Core# 9
Description: Core# 8
Photo No: C-7
Road: 33
Direction: EB
Lane: Outside Shoulder
M.P: 25.48
Photo No: C-8
Road: 33
Direction: EB
Lane: 2
M.P: 26.01
Photo No: C-9
Road: 33
Direction: EB
Lane: 2
M.P: 26.31

Description: Core# 10
Description: Core# 12
Description: Core# 11
Photo No: C-10
Road: 33
Direction: EB
Lane: Outside Shoulder
M.P: 26.31
Photo No: C-11
Road: 33
Direction: EB
Lane: 2
M.P: 26.91
Photo No: C-12
Road: 33
Direction: EB
Lane: 2
M.P: 27.45

Description: Core# 13
Description: Core# 15
Description: Core# 14
Photo No: C-15
Road: 33
Direction: EB
Lane: Outside Shoulder
M.P: 28.04
Photo No: C-14
Road: 33
Direction: EB
Lane: 2
M.P: 28.04
Photo No: C-13
Road: 33
Direction: EB
Lane: 2
M.P: 27.60

Description: Core# 16
Description: Core# 18
Description: Core# 17
Photo No: C-16
Road: 33
Direction: EB
Lane: 2
M.P: 28.29
Photo No: C-17
Road: 33
Direction: EB
Lane: 2
M.P: 28.66
Photo No: C-18
Road: 33
Direction: EB
Lane: Outside Shoulder
M.P: 28.66
Crack

Description: Core# 19
Description: Core# 21
Description: Core# 20
Photo No: C-19
Road: 33
Direction: WB
Lane: 2
M.P: 28.85
Photo No: C-20
Road: 33
Direction: WB
Lane: 2
M.P: 28.39
Photo No: C-21
Road: 33
Direction: WB
Lane: Outside Shoulder
M.P: 28.39

Description: Core# 22
Description: Core# 24
Description: Core# 23
Photo No: C-22
Road: 33
Direction: WB
Lane: 2
M.P: 28.06
Photo No: C-23
Road: 33
Direction: WB
Lane: 2
M.P: 27.42
Photo No: C-24
Road: 33
Direction: WB
Lane: Outside Shoulder
M.P: 27.42

Description: Core# 25
Description: Core# 27
Description: Core# 26
Photo No: C-25
Road: 33
Direction: WB
Lane: 2
M.P: 27.10
Photo No: C-26
Road: 33
Direction: WB
Lane: 2
M.P: 26.69
Photo No: C-27
Road: 33
Direction: WB
Lane: Outside Shoulder
M.P: 26.69

Description: Core# 28
Description: Core# 30
Description: Core# 29
Photo No: C-28
Road: 33
Direction: WB
Lane: 2
M.P: 26.46
Photo No: C-29
Road: 33
Direction: WB
Lane: 2
M.P: 26.06
Photo No: C-30
Road: 33
Direction: WB
Lane: 2
M.P: 25.73
AC Stripping

Description: Core# 31
Description: Core# 33
Description: Core# 32
Photo No: C-33
Road: 33
Direction: WB
Lane: 2
M.P: 25.04
Photo No: C-31
Road: 33
Direction: WB
Lane: Outside Shoulder
M.P: 25.73
Photo No: C-32
Road: 33
Direction: WB
Lane: 2
M.P: 25.38
AC Stripping

Description: Core# 34
Description: Core# 36
Description: Core# 35
Photo No: C-36
Road: 33
Direction: WB
Lane: 2
M.P: 24.31
Photo No: C-34
Road: 33
Direction: WB
Lane: Outside Shoulder
M.P: 25.04
Photo No: C-35
Road: 33
Direction: WB
Lane: 2
M.P: 24.64
Disintegrated AC

PAVEMENT EVALUATION AND DESIGN REPORT Route 33: EB & WB (MP 24.3-29.0)
Appendix A: Straight Line Diagrams for Project Area

(25.27)(25.27)
(25.27)(25.27)
RO
AD
WEM
RO
CK
(25.68)
(24.68)
OLD
HIG
HW
AY(24.40)
SW
EE
TMAN
S LNM
ILLHU
RS
T RD
(24.01)
PEG
ASU
SB
LVD
UN
NA
ME
D R
OA
D(23.13)
33B
527
GULLY RD
KINNEY RDW
EMROCK RD
ASTOR DR
QUAIL CT
OAKLEY DR
CA
RO
LE CT TURTLE HOLLOW DRTAYLOR LAKE CT OAKLEY DR
Secondary Direction
Primary D
irection
22
21
689
2
Interstate Route
US Route
NJ Route
County Road
Interchange NumberGrade
Separated Interchange
Traffic Signal
Traffic Monitoring
Sites
Road Underpass
Road Overpass
Units in m
iles
Primary Direction
Secondary Direction
287
VOL
WIMAVC
NJ 33 (West to East)
SRI = 00000033__ Date last inventoried: February 2010
Page C
reated: May 2010
Mile Posts: 23.000 - 26.000
23.0 24.0 25.0 26.0
2372
(23.36)B
R. M
ANA
LAPA
N B
K.
(23 .59)M
AN
ALA PAN
BK.
(24.32)M
ANA
LAP
AN
BK.
527
527
33 B 33 B
WIM
Manalapan Twp, Monmouth Co
Manalapan Twp, Monmouth Co
Freehold Twp, Monmouth Co
Freehold Twp, Monmouth Co
Street Name NJ 33 Theodore J Narozanick Hwy
Jurisdiction N.J.D.O.T.
Functional Class Urban Principal Arterial Urban Freeway/Expressway
Federal Aid - NHS Sy NHS
Control Section 1304 1331
Speed Limit 55
Number of Lanes 2
Med. Type Unprotected
Med. Width 30
Pavement 24
Shoulder 12
Traffic Volume 26,580 (2009) 29,726 (2008) 9,966 (2008) 19,372 (2007)
Traffic Sta. ID 6-1-010 6-4-306 6-9-430 6-9-429
Structure No. 1304155 1304156 1304157 1331151
Enlarged Views
Pavement 24
Shoulder 10
Number of Lanes 2
Speed Limit 55
Street Name NJ 33 Theodore J. Narozanick Hwy

RO
AD
WILLO
W BR
OO
K(28.24)
SO
UTH
ST
(27.69)
(27.54)
FREE
HO
LD-M
OU
NT
(26.59) H
OLLY
RO
AD
9
79537
WILLOWBROOK RD
HELEN AVE
NNP
DANIELS CT
KOENIG LA
Schanck Road HOPI CT
PATTE
N S
T
GIBSON RD
IRWIN AVE
SCHAEFFER LA
MOREAU AVE
BRAE
TON
WA
Y
WYNNEW
OO
D CT
NN
P
Secondary Direction
Primary D
irection
22
21
689
2
Interstate Route
US Route
NJ Route
County Road
Interchange NumberGrade
Separated Interchange
Traffic Signal
Traffic Monitoring
Sites
Road Underpass
Road Overpass
Units in m
iles
Primary Direction
Secondary Direction
287
VOL
WIMAVC
NJ 33 (West to East)
SRI = 00000033__ Date last inventoried: February 2010
Page C
reated: May 2010
Mile Posts: 26.000 - 29.000
26.0 27.0 28.0 29.0
2373
(26.23)S
TREA
M
(27.34)S
TREA
M
(28.09)W
.BR AP
PLEG
ATE
CK
.
(28.55)D
UB
OIS
CK
.
537
537
9
9 79
79
Freehold Twp, Monmouth Co
Freehold Twp, Monmouth Co
Street Name Theodore J Narozanick Hwy
Jurisdiction N.J.D.O.T.
Functional Class Urban Freeway/Expressway
Federal Aid - NHS Sy NHS
Control Section 1331 1332
Speed Limit 55
Number of Lanes 2 1
Med. Type Unprotected
Med. Width 30 VAR
Pavement 24 12
Shoulder 12 12
Traffic Volume 17,121 (2009) 23,975 (2009) 11,012 (2001) 12,857 (2009) 19,855 (2007)
Traffic Sta. ID 6-9-431 6-9-471 6-5-037 6-9-089 6-9-470
Structure No. N/A 1331152 N/A 1331153 1332150 1332151
1332152 1332153 1332154
Enlarged Views
Pavement 24 12
Shoulder 10 12
Number of Lanes 2 1
Speed Limit 55
Street Name Theodore J. Narozanick Hwy

(29.34)(29.34)
(29.34)(29.34)
TO FIR
E AC
AD
EM
Y(31.72)
(30.92)
(30.87)
(30.72)(30.72)
FAIR
FIELD
RD
(30.64)R
OA
D
HO
WELL
(30.04)R
OA
D
UN
NA
ME
D R
OA
D(29.98)
(29.04) HALLS
(29.04) MILL R
D
33B
How
ell R
oad
OAKERSON RD
Halls M
ill Road
FAIRFIELD
RD
NNP
Secondary Direction
Primary D
irection
22
21
689
2
Interstate Route
US Route
NJ Route
County Road
Interchange NumberGrade
Separated Interchange
Traffic Signal
Traffic Monitoring
Sites
Road Underpass
Road Overpass
Units in m
iles
Primary Direction
Secondary Direction
287
VOL
WIMAVC
NJ 33 (West to East)
SRI = 00000033__ Date last inventoried: February 2010
Page C
reated: May 2010
Mile Posts: 29.000 - 32.000
29.0 30.0 31.0 32.0
2374
(29 .04)STR
EAM
(29.38)S
TREA
M
(29.55)C
RE
EK
(29.78)R
R
(30.20)C
RE
EK
33B
33B
33B
33B
(31.68)KILL TIM
E BK
.(31.68)
STRE
AM(31.69)
STRE
AM
(31.82)PIG
EO
N BK
.
Freehold, Mon. Co.
Freehold, Mon. Co.
Howell Twp, Monmouth Co
Howell Twp, Monmouth Co
Street Name Theodore J Narozanick Hwy NJ 33
Jurisdiction N.J.D.O.T.
Functional Class Urban Freeway/Expressway Rural Principal Arterial
Federal Aid - NHS Sy NHS
Control Section 1332 1305
Speed Limit 55 50
Number of Lanes 1 2
Med. Type Unprotected None
Med. Width VAR 0
Pavement 12 24
Shoulder 12 8
Traffic Volume 16,047 (2009) 13,902 (2008) 20,706 (2007)
Traffic Sta. ID 6-4-372 6-4-373 6-5-306
Structure No. 1332155 1332152 1305153 1305154 N/A 1305155
N/A 1305156
Enlarged Views
Pavement 12
Shoulder 12
Number of Lanes 1
Speed Limit 55
Street Name Theodore J. Narozanick Hwy

PAVEMENT EVALUATION AND DESIGN REPORT Route 33: EB & WB (MP 24.3-29.0)
Appendix B: Pavement Management System Data
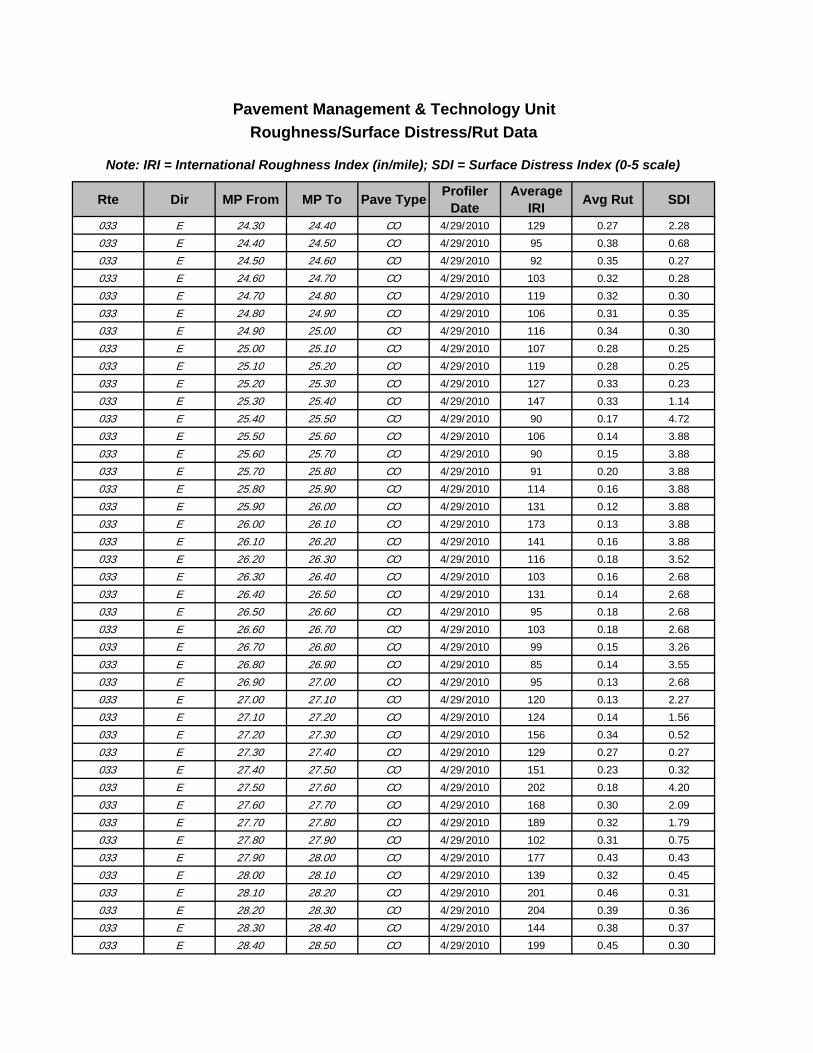
Rte Dir MP From MP To Pave Type Profiler Date
Average IRI Avg Rut SDI
033 E 24.30 24.40 CO 4/29/2010 129 0.27 2.28
033 E 24.40 24.50 CO 4/29/2010 95 0.38 0.68
033 E 24.50 24.60 CO 4/29/2010 92 0.35 0.27
033 E 24.60 24.70 CO 4/29/2010 103 0.32 0.28
033 E 24.70 24.80 CO 4/29/2010 119 0.32 0.30
033 E 24.80 24.90 CO 4/29/2010 106 0.31 0.35
033 E 24.90 25.00 CO 4/29/2010 116 0.34 0.30
033 E 25.00 25.10 CO 4/29/2010 107 0.28 0.25
033 E 25.10 25.20 CO 4/29/2010 119 0.28 0.25
033 E 25.20 25.30 CO 4/29/2010 127 0.33 0.23
033 E 25.30 25.40 CO 4/29/2010 147 0.33 1.14
033 E 25.40 25.50 CO 4/29/2010 90 0.17 4.72
033 E 25.50 25.60 CO 4/29/2010 106 0.14 3.88
033 E 25.60 25.70 CO 4/29/2010 90 0.15 3.88
033 E 25.70 25.80 CO 4/29/2010 91 0.20 3.88
033 E 25.80 25.90 CO 4/29/2010 114 0.16 3.88
033 E 25.90 26.00 CO 4/29/2010 131 0.12 3.88
033 E 26.00 26.10 CO 4/29/2010 173 0.13 3.88
033 E 26.10 26.20 CO 4/29/2010 141 0.16 3.88
033 E 26.20 26.30 CO 4/29/2010 116 0.18 3.52
033 E 26.30 26.40 CO 4/29/2010 103 0.16 2.68
033 E 26.40 26.50 CO 4/29/2010 131 0.14 2.68
033 E 26.50 26.60 CO 4/29/2010 95 0.18 2.68
033 E 26.60 26.70 CO 4/29/2010 103 0.18 2.68
033 E 26.70 26.80 CO 4/29/2010 99 0.15 3.26
033 E 26.80 26.90 CO 4/29/2010 85 0.14 3.55
033 E 26.90 27.00 CO 4/29/2010 95 0.13 2.68
033 E 27.00 27.10 CO 4/29/2010 120 0.13 2.27
033 E 27.10 27.20 CO 4/29/2010 124 0.14 1.56
033 E 27.20 27.30 CO 4/29/2010 156 0.34 0.52
033 E 27.30 27.40 CO 4/29/2010 129 0.27 0.27
033 E 27.40 27.50 CO 4/29/2010 151 0.23 0.32
033 E 27.50 27.60 CO 4/29/2010 202 0.18 4.20
033 E 27.60 27.70 CO 4/29/2010 168 0.30 2.09
033 E 27.70 27.80 CO 4/29/2010 189 0.32 1.79
033 E 27.80 27.90 CO 4/29/2010 102 0.31 0.75
033 E 27.90 28.00 CO 4/29/2010 177 0.43 0.43
033 E 28.00 28.10 CO 4/29/2010 139 0.32 0.45
033 E 28.10 28.20 CO 4/29/2010 201 0.46 0.31
033 E 28.20 28.30 CO 4/29/2010 204 0.39 0.36
033 E 28.30 28.40 CO 4/29/2010 144 0.38 0.37
033 E 28.40 28.50 CO 4/29/2010 199 0.45 0.30
Pavement Management & Technology UnitRoughness/Surface Distress/Rut Data
Note: IRI = International Roughness Index (in/mile); SDI = Surface Distress Index (0-5 scale)

Rte Dir MP From MP To Pave Type Profiler Date
Average IRI Avg Rut SDI
Pavement Management & Technology UnitRoughness/Surface Distress/Rut Data
Note: IRI = International Roughness Index (in/mile); SDI = Surface Distress Index (0-5 scale)
033 E 28.50 28.60 CO 4/29/2010 152 0.51 0.25
033 E 28.60 28.70 CO 4/29/2010 171 0.36 0.37
033 E 28.70 28.80 CO 4/29/2010 163 0.48 0.28
033 E 28.80 28.90 CO 4/29/2010 176 0.39 0.89
033 E 28.90 29.00 CO 4/29/2010 84 0.31 3.53
033 W 24.30 24.40 BC 4/29/2010 134 0.18 0.14
033 W 24.40 24.50 BC 4/29/2010 111 0.31 0.10
033 W 24.50 24.60 BC 4/29/2010 100 0.28 0.11
033 W 24.60 24.70 BC 4/29/2010 115 0.30 0.11
033 W 24.70 24.80 BC 4/29/2010 108 0.33 0.10
033 W 24.80 24.90 BC 4/29/2010 85 0.27 0.12
033 W 24.90 25.00 BC 4/29/2010 94 0.30 0.09
033 W 25.00 25.10 BC 4/29/2010 97 0.26 0.10
033 W 25.10 25.20 BC 4/29/2010 115 0.31 0.09
033 W 25.20 25.30 BC 4/29/2010 104 0.30 0.09
033 W 25.30 25.40 BC 4/29/2010 110 0.27 0.10
033 W 25.40 25.50 BC 4/29/2010 92 0.33 0.08
033 W 25.50 25.60 BC 4/29/2010 100 0.33 0.11
033 W 25.60 25.70 BC 4/29/2010 133 0.30 0.12
033 W 25.70 25.80 BC 4/29/2010 134 0.29 0.12
033 W 25.80 25.90 BC 4/29/2010 93 0.30 0.12
033 W 25.90 26.00 BC 4/29/2010 99 0.28 0.12
033 W 26.00 26.10 BC 4/29/2010 88 0.24 0.13
033 W 26.10 26.20 BC 4/29/2010 120 0.26 0.13
033 W 26.20 26.30 BC 4/29/2010 122 0.28 0.12
033 W 26.30 26.40 BC 4/29/2010 111 0.29 0.12
033 W 26.40 26.50 BC 4/29/2010 109 0.25 0.13
033 W 26.50 26.60 BC 4/29/2010 215 0.31 0.12
033 W 26.60 26.70 BC 4/29/2010 141 0.27 0.13
033 W 26.70 26.80 BC 4/29/2010 137 0.31 0.12
033 W 26.80 26.90 BC 4/29/2010 109 0.22 0.14
033 W 26.90 27.00 BC 4/29/2010 121 0.23 0.23
033 W 27.00 27.10 BC 4/29/2010 108 0.27 0.22
033 W 27.10 27.20 BC 4/29/2010 101 0.26 0.23
033 W 27.20 27.30 BC 4/29/2010 137 0.32 0.26
033 W 27.30 27.40 BC 4/29/2010 110 0.27 0.36
033 W 27.40 27.50 BC 4/29/2010 169 0.22 0.41
033 W 27.50 27.60 BC 4/29/2010 145 0.21 0.41
033 W 27.60 27.70 BC 4/29/2010 220 0.19 0.42
033 W 27.70 27.80 BC 4/29/2010 113 0.33 0.65
033 W 27.80 27.90 BC 4/29/2010 115 0.40 1.31
033 W 27.90 28.00 BC 4/29/2010 144 0.46 4.21

Rte Dir MP From MP To Pave Type Profiler Date
Average IRI Avg Rut SDI
Pavement Management & Technology UnitRoughness/Surface Distress/Rut Data
Note: IRI = International Roughness Index (in/mile); SDI = Surface Distress Index (0-5 scale)
033 W 28.00 28.10 BC 4/29/2010 183 0.48 0.55
033 W 28.10 28.20 BC 4/29/2010 221 0.53 0.52
033 W 28.20 28.30 BC 4/29/2010 188 0.40 0.81
033 W 28.30 28.40 BC 4/29/2010 189 0.55 0.62
033 W 28.40 28.50 BC 4/29/2010 184 0.46 0.86
033 W 28.50 28.60 BC 4/29/2010 139 0.33 2.36
033 W 28.60 28.70 BC 4/29/2010 161 0.38 2.30
033 W 28.70 28.80 BC 4/29/2010 129 0.38 2.30
033 W 28.80 28.90 BC 4/29/2010 150 0.22 2.65
033 W 28.90 29.00 BC 4/29/2010 112 0.31 2.53

Interstate Non-NHS OtherFreeways Highways County
NHS Highways Highways
New 0 - ? Excellent Excellent Excellent
Resurfacing Excellent Excellent Excellent
60 - 95 Good Good Good
95 - 150 Fair Good Good
150 - 170 Fair Fair Good
170 - 200 Deficient Fair Good
200 - 285 Deficient Deficient Fair
> 285 Deficient Deficient Deficient
IRI - INTERNATIONAL ROUGHNESS INDEX
NJ IRI Guidelines

New Jersey Department of Transportation Bureau of Project Support and Engineering
Pavement Management Unit 05/18/2000
Description of Pavement Ratings
SDI* Verbal Rating Description 5.0----------------------------------------------------------------------------------------------------------------------------- Very Only new (or nearly new) pavements are likely to be smooth enough and sufficiently free of Good cracks and patches to qualify for this category. All pavements constructed or resurfaced during the date year would normally be rated very good. 4.0----------------------------------------------------------------------------------------------------------------------------- Good Pavements in this category, although not quite as smooth as those described above, give a first
class ride and exhibit few, if any, visible signs of surface deterioration. Flexible pavements may be beginning to show evidence of rutting and fine random cracks. Rigid pavements may be beginning to show evidence of slight surface deterioration as well as minor cracks and spalling.
3.0----------------------------------------------------------------------------------------------------------------------------- Fair The riding qualities of pavements in this category are noticeably inferior to those of new
pavements, and may be barely tolerable for high speed traffic. Surface defects of flexible pavements may include rutting, map cracking and extensive patching. Rigid pavements in
this group may have a few joint failures, faulting and cracking, and some pumping.
2.0----------------------------------------------------------------------------------------------------------------------------- Poor Pavements that have deteriorated to such an extent that they affect the speed of free flow
traffic. Flexible pavements may have large potholes and deep cracks. Distress includes ravelling, cracking and rutting which occurs over 50 percent or more of the surface. Rigid pavement distress includes joint spalling, faulting, patching, cracking, scaling and may
include pumping and faulting.
1.0----------------------------------------------------------------------------------------------------------------------------- Very Pavements that are in an extremely deteriorated condition. The facility is passable only at Poor reduced speeds, and with considerable ride discomfort. Large potholes and deep cracks exist.
Distress occurs over 75 percent or more of the surface. 0.0----------------------------------------------------------------------------------------------------------------------------- *SDI - Surface Distress Index PAVERATE051800

PAVEMENT EVALUATION AND DESIGN REPORT Route 33: EB & WB (MP 24.3-29.0)
Appendix C: Falling Weight Deflectometer Test Results

Load Plate Radius = 5.9 in. Applied Loads = 5.5, 8.5, and 11.5 kips
Geophone Setting (in.) 0 8 12 18 24 36 48 60 72 Normalization Load = 9 kips
Normalized Deflections (mils)
D0 D1 D2 D3 D4 D5 D6 D7 D8
Statistical Analysis
10th Percentile 4.8 4.3 4.1 3.5 3.1 2.1 1.4 1.0 0.8 474 32 5754 4.6
Average 7.5 6.4 5.8 4.7 3.9 2.7 1.9 1.4 1.1 990 38 7528 5.6
90th Percentile 10.0 8.3 7.4 5.9 4.7 3.3 2.4 1.7 1.4 1500 40 9991 7.1
Std. Dev. 2.0 1.7 1.5 1.2 1.0 0.8 0.6 0.4 0.3 417 4 1744 0.9
Number of Tests = 89
Detailed Data24.33 5.3 4.6 4.3 3.7 3.2 2.3 1.7 1.4 1.0 1500 40 7889 6.724.38 6.8 5.9 5.6 4.8 4.2 3.2 2.4 1.9 1.4 1151 40 5767 6.224.43 5.0 4.3 4.1 3.6 3.2 2.5 2.0 1.6 1.3 1500 40 6931 7.124.48 4.7 4.1 3.9 3.5 3.1 2.4 1.9 1.5 1.1 1500 40 7338 7.324.53 4.4 3.9 3.6 3.1 2.7 2.0 1.5 1.2 0.9 1500 40 9014 7.224.57 4.8 4.3 4.1 3.5 3.0 2.2 1.6 1.3 0.9 1500 40 8355 6.924.62 4.9 4.4 4.1 3.6 3.1 2.3 1.8 1.5 1.1 1500 40 7537 7.024.67 5.5 5.1 4.7 4.1 3.5 2.6 2.0 1.6 1.2 1500 40 6961 6.724.72 4.6 4.2 4.0 3.5 3.1 2.4 1.9 1.4 1.1 1500 40 7207 7.424.77 4.7 4.1 3.9 3.4 3.0 2.3 1.7 1.1 1.0 1500 40 7937 7.224.82 4.8 4.2 3.9 3.4 2.9 2.2 1.6 1.2 0.9 1500 40 8572 6.924.87 7.3 5.8 5.0 3.8 3.1 2.0 1.3 0.8 0.8 512 40 10318 5.424.92 6.6 5.5 4.9 4.0 3.3 2.1 1.5 1.0 0.8 767 40 9367 5.724.97 6.4 5.4 4.9 4.0 3.4 2.3 1.6 1.3 1.0 919 40 8402 5.925.03 4.8 4.2 3.9 3.4 3.0 2.3 1.7 1.2 1.1 1500 36 7938 7.125.08 6.1 5.3 4.9 4.2 3.5 2.7 2.0 1.6 1.2 1119 40 6742 6.425.13 4.8 4.4 4.2 3.7 3.3 2.6 2.1 1.5 1.2 1500 36 6683 7.425.18 4.6 4.0 3.8 3.3 2.8 2.2 1.7 1.2 1.0 1500 40 8244 7.225.23 6.5 5.6 5.1 4.1 3.5 2.3 1.6 1.1 0.9 977 39 8505 5.925.28 8.5 7.0 6.2 5.0 4.1 2.7 1.8 1.2 0.9 507 40 7725 5.225.33 8.3 6.8 6.0 4.6 3.7 2.3 1.5 1.0 0.8 520 38 8996 5.125.38 6.7 5.4 4.9 3.9 3.2 2.1 1.3 0.9 0.8 820 40 10402 5.225.43 9.0 7.2 6.2 4.7 3.4 2.2 1.4 1.0 0.9 479 40 9943 4.525.48 11.4 9.3 8.4 6.3 4.2 3.1 2.2 1.6 1.3 418 40 6179 4.325.53 7.3 6.3 5.9 4.9 4.5 3.1 2.3 1.5 1.4 1191 40 5978 5.625.58 8.7 6.7 6.1 4.8 3.8 2.5 1.7 1.1 0.4 512 40 7852 4.825.63 9.2 7.2 6.4 5.0 3.9 2.6 1.9 1.3 1.1 449 40 7171 4.725.68 8.4 6.5 5.7 4.6 4.1 2.8 2.1 1.5 1.2 492 40 6587 5.025.73 10.9 8.6 7.4 5.9 4.5 3.1 2.2 1.5 1.3 349 40 6224 4.425.78 8.7 6.9 6.1 4.9 3.7 2.6 1.8 1.3 1.1 527 40 7461 4.825.82 7.6 6.2 5.4 4.3 3.4 2.2 1.5 1.1 0.9 643 40 8922 5.025.87 5.9 4.9 4.3 3.6 3.1 2.1 1.5 1.1 0.9 1009 36 8901 5.725.92 6.4 5.7 5.3 4.5 3.9 2.7 1.9 1.3 1.1 1500 31 7072 5.825.97 5.4 4.8 4.6 4.0 3.5 2.6 1.9 1.4 1.1 1500 37 7081 6.426.02 10.2 8.3 7.1 5.5 4.3 3.0 1.9 1.4 1.1 395 40 7121 4.526.07 9.4 8.0 7.2 5.7 4.8 3.2 2.1 1.6 1.3 637 40 6495 4.726.12 8.1 6.8 6.3 5.4 4.6 3.4 2.6 2.0 1.6 827 40 5217 5.426.17 7.7 7.1 6.2 5.1 4.5 3.2 2.4 1.8 1.5 1025 40 5700 5.4
Flexible Pavement Evaluation, Route 33, Eastbound Lane 2
StationEffective
Structural Number
Subgrade Resilient Modulus
(psi)
AC Modulus
(ksi)
Base Modulus
(ksi)

Load Plate Radius = 5.9 in. Applied Loads = 5.5, 8.5, and 11.5 kips
Geophone Setting (in.) 0 8 12 18 24 36 48 60 72 Normalization Load = 9 kips
Normalized Deflections (mils)
D0 D1 D2 D3 D4 D5 D6 D7 D8
Flexible Pavement Evaluation, Route 33, Eastbound Lane 2
StationEffective
Structural Number
Subgrade Resilient Modulus
(psi)
AC Modulus
(ksi)
Base Modulus
(ksi)
26.22 12.1 10.8 10.1 7.7 6.4 4.6 3.2 2.4 1.9 730 40 4232 4.526.27 9.8 8.6 7.6 6.0 4.7 3.0 1.9 1.2 1.0 623 32 7050 4.626.32 6.0 5.2 4.7 3.9 3.2 2.1 1.3 0.9 0.8 1233 40 10483 5.526.37 6.3 5.8 5.4 4.7 4.0 2.8 2.1 1.4 0.6 1500 36 6546 5.926.41 10.2 8.1 7.2 5.8 4.8 3.4 2.5 1.6 1.4 399 40 5522 4.726.47 5.6 5.2 4.9 4.3 3.9 2.9 2.2 1.6 1.4 1500 40 6252 6.526.51 6.2 5.8 5.4 4.8 4.2 3.1 2.3 1.7 1.4 1500 27 6012 6.126.56 7.2 6.5 6.1 5.1 4.3 2.9 2.1 1.6 1.3 1492 40 6412 5.526.61 8.6 7.3 6.8 5.4 4.5 3.0 2.0 1.5 1.2 765 40 6705 4.926.66 7.1 6.2 5.7 4.8 3.9 2.7 1.9 1.4 1.1 1178 40 7074 5.426.71 7.8 6.5 5.7 4.6 3.8 2.6 1.8 1.4 1.2 628 40 7496 5.126.76 8.6 6.7 5.8 4.3 3.4 2.0 1.4 1.1 0.9 452 40 9790 4.626.81 13.7 10.1 8.5 6.0 4.5 2.3 1.3 0.9 0.8 194 29 10319 3.726.86 7.3 6.1 5.5 4.4 3.6 2.2 1.4 1.1 0.9 816 40 9522 5.126.91 9.3 6.9 5.9 4.4 3.4 2.2 1.3 1.0 0.8 344 40 10242 4.426.96 6.0 5.2 5.0 4.2 3.5 2.4 1.6 1.1 0.8 1500 40 8331 5.827.01 8.3 7.1 6.2 4.8 3.9 2.5 1.6 1.1 0.9 633 40 8335 4.827.06 7.0 6.0 5.4 4.5 3.7 2.4 1.6 1.1 0.7 935 40 8619 5.327.11 8.4 7.0 6.1 4.8 3.8 2.4 1.6 1.0 0.7 560 40 8813 4.727.16 6.6 5.9 5.5 4.6 3.7 2.5 1.6 1.0 0.7 1493 32 8608 5.427.21 9.0 7.4 6.7 5.4 4.4 3.0 2.1 1.5 1.1 572 40 6524 5.127.26 6.8 5.2 4.5 3.4 2.8 1.8 1.3 0.9 0.9 563 40 10360 5.427.31 6.1 5.4 5.0 4.3 3.6 2.6 1.8 1.4 1.0 1349 40 7431 6.127.36 5.3 4.7 4.5 4.0 3.5 2.6 1.9 1.3 1.0 1500 40 7209 6.727.41 5.9 5.1 4.9 4.2 3.7 2.8 2.1 1.4 1.1 1500 40 6641 6.527.46 8.1 7.2 6.5 5.4 4.6 3.2 2.3 1.5 1.2 891 40 5853 5.527.58 4.4 4.2 4.0 3.5 2.9 2.2 1.7 1.1 0.9 1500 40 8148 7.227.63 6.6 5.5 5.0 4.1 3.6 2.4 1.6 1.1 0.9 859 40 8419 5.727.67 8.8 7.8 7.1 5.6 4.4 2.5 1.7 1.2 0.9 804 25 8046 5.027.75 6.0 5.5 5.1 4.4 3.8 2.7 2.0 1.5 1.1 1500 40 6973 6.327.80 8.0 6.8 6.0 4.8 4.0 2.7 1.9 1.4 1.1 651 40 7147 5.327.85 5.9 5.1 4.7 4.1 3.6 2.7 2.0 1.4 1.1 1274 40 6976 6.427.89 5.3 4.7 4.5 3.9 3.2 2.4 1.8 1.3 1.0 1500 40 7496 6.627.94 9.4 7.6 6.6 4.8 4.0 2.5 1.8 1.5 1.1 430 40 7654 4.527.99 7.2 6.5 6.1 5.0 4.1 2.9 2.0 1.4 1.1 1300 40 6901 5.328.04 7.4 6.6 6.2 5.1 4.3 3.1 2.3 1.7 1.3 1247 40 6035 5.428.11 7.7 6.7 6.1 4.8 3.8 2.4 1.6 1.1 0.9 850 40 8720 4.928.14 8.2 7.4 6.8 5.7 4.8 3.3 2.3 1.4 1.2 934 40 5935 5.128.18 8.1 7.6 7.0 6.2 5.3 3.9 2.7 1.9 1.5 1367 40 5046 5.428.23 10.0 8.5 7.4 5.9 4.6 3.1 2.2 1.4 1.3 479 40 6288 4.528.28 8.9 8.3 7.9 6.7 5.7 4.0 2.7 1.6 1.2 1274 21 5033 5.128.33 5.6 4.9 4.5 3.6 3.0 1.8 1.1 0.6 0.4 1396 30 12477 5.428.38 11.4 10.7 10.1 8.8 7.7 5.7 4.0 2.8 2.1 929 27 3403 4.928.43 13.5 12.6 12.0 10.6 9.5 7.2 5.4 3.6 2.9 791 28 2561 4.828.49 11.4 10.5 9.5 8.1 7.0 5.1 3.7 2.7 2.0 641 40 3722 4.828.53 7.8 6.6 5.9 4.7 3.7 2.3 1.6 1.2 1.0 664 40 8651 4.828.59 7.8 7.0 6.4 5.5 4.7 3.3 2.3 1.8 1.3 991 40 5840 5.3

Load Plate Radius = 5.9 in. Applied Loads = 5.5, 8.5, and 11.5 kips
Geophone Setting (in.) 0 8 12 18 24 36 48 60 72 Normalization Load = 9 kips
Normalized Deflections (mils)
D0 D1 D2 D3 D4 D5 D6 D7 D8
Flexible Pavement Evaluation, Route 33, Eastbound Lane 2
StationEffective
Structural Number
Subgrade Resilient Modulus
(psi)
AC Modulus
(ksi)
Base Modulus
(ksi)
28.63 6.9 6.3 5.8 4.8 4.0 2.9 2.1 1.5 1.2 1235 40 6496 5.528.69 7.4 6.2 5.4 4.1 3.2 2.0 1.5 0.9 0.4 660 40 9287 4.928.74 7.5 6.5 5.7 4.1 3.1 1.8 1.2 0.8 0.7 734 40 11441 4.728.79 8.0 6.5 5.6 4.1 3.1 1.8 1.3 1.0 0.9 525 40 10186 4.7
Note: Only one eastbound thru lane exists east of approx. MP 28.5 and thus the results above for that section were obtained in the lone thru lane.

Load Plate Radius = 5.9 in. Applied Loads = 5.5, 8.5, and 11.5 kips
Geophone Setting (in.) 0 8 12 18 24 36 48 60 72 Normalization Load = 9 kips
Normalized Deflections (mils)
D0 D1 D2 D3 D4 D5 D6 D7 D8
Statistical Analysis
10th Percentile 4.9 4.3 4.1 3.5 3.0 2.0 1.4 1.0 0.8 387 30 5694 4.8
Average 7.0 5.9 5.4 4.5 3.8 2.7 1.9 1.4 1.1 979 38 7531 5.8
90th Percentile 9.1 7.4 6.6 5.4 4.7 3.2 2.4 1.8 1.4 1500 40 9615 7.0
Std. Dev. 1.6 1.3 1.1 0.9 0.8 0.6 0.5 0.4 0.3 405 5 1619 0.9
Number of Tests = 87
Detailed Data28.88 6.8 5.8 5.3 4.5 3.8 2.7 1.8 1.4 1.0 1470 40 7454 5.428.83 6.7 5.6 5.0 4.3 3.7 2.7 2.0 1.7 1.3 1080 40 6815 5.628.77 7.4 5.9 5.1 4.1 3.2 2.0 1.4 1.1 0.9 625 40 10007 4.828.73 7.0 5.7 5.2 4.3 3.5 2.3 1.6 1.1 0.9 899 40 8737 5.128.67 8.3 6.9 6.4 5.1 4.1 2.6 1.8 1.3 1.1 893 40 7498 4.828.62 8.2 7.2 6.9 5.8 5.0 3.6 2.6 1.8 1.4 1500 35 5292 5.328.57 7.7 6.5 6.1 5.3 4.8 3.6 2.7 1.7 1.4 1263 33 5168 5.528.52 8.6 6.9 6.3 5.4 4.2 2.9 2.0 1.6 1.1 645 40 6813 4.828.47 12.3 10.9 9.8 8.6 7.4 5.7 4.3 3.3 2.4 677 40 3227 4.728.42 10.8 9.1 8.6 7.5 6.6 5.0 3.8 2.7 2.1 720 40 3609 4.928.37 8.9 7.9 7.2 6.3 5.4 4.0 2.9 2.2 1.5 1202 36 4800 5.228.32 8.1 6.9 6.5 5.5 4.8 3.0 2.1 1.4 0.9 1264 28 6592 5.028.27 9.6 8.2 7.8 6.9 6.0 4.6 2.9 2.0 1.4 1037 26 4701 5.028.22 9.9 7.4 6.6 5.2 4.3 2.9 2.1 1.7 1.2 354 40 6574 4.528.17 9.3 8.4 7.5 6.3 5.5 3.8 2.7 1.8 1.4 942 37 5084 4.928.12 5.6 4.7 4.4 3.5 2.8 2.1 1.4 1.0 0.9 1500 20 9579 5.728.08 6.4 5.3 4.9 4.2 3.6 2.5 1.9 1.2 1.0 1197 40 7366 5.628.03 7.7 6.3 5.6 4.6 3.8 2.5 1.8 1.5 1.1 717 40 7513 5.027.98 8.0 6.8 6.3 5.2 4.4 2.9 2.0 1.4 1.1 1000 40 6913 5.027.93 7.6 6.4 5.8 4.8 4.0 2.6 1.8 1.4 1.1 892 40 7688 5.127.83 4.6 4.2 4.0 3.6 3.2 2.5 1.9 1.5 1.1 1500 25 7245 7.327.79 4.0 3.7 3.6 3.2 2.9 2.3 1.8 1.5 1.1 1500 29 7466 7.927.74 4.1 3.8 3.6 3.3 3.0 2.4 1.9 1.5 1.1 1500 31 7235 7.827.66 4.4 4.1 3.8 3.4 3.1 2.4 1.9 1.4 1.1 1500 30 7186 7.527.60 4.3 3.9 3.8 3.3 3.0 2.3 1.7 1.3 1.0 1500 36 7952 7.427.49 4.2 3.8 3.6 3.2 2.8 2.2 1.8 1.3 1.1 1500 33 7713 7.627.38 5.0 4.3 4.0 3.5 3.1 2.3 1.7 1.3 1.0 1500 40 7857 6.827.35 4.9 4.3 4.1 3.7 3.2 2.5 1.9 1.4 1.1 1500 40 7157 7.027.31 5.8 4.9 4.5 4.0 3.5 2.5 1.9 1.5 1.0 1170 40 7295 6.427.26 7.7 6.3 5.6 4.4 3.8 2.4 1.8 1.2 1.1 557 40 7645 5.427.21 6.6 5.3 4.7 3.8 3.1 2.3 1.5 1.1 0.8 648 40 8853 5.727.15 4.5 4.0 3.8 3.4 2.9 2.3 1.6 1.0 0.8 1500 30 8462 7.127.10 5.9 5.2 4.8 4.1 3.6 2.6 1.8 1.2 0.9 1500 31 7560 6.327.05 5.7 4.9 4.5 3.9 3.3 2.3 1.6 1.0 0.9 1228 35 8515 6.227.00 5.2 4.7 4.5 4.0 3.6 2.7 2.1 1.4 1.2 1500 38 6622 6.926.95 5.9 5.1 4.9 4.3 3.8 2.7 2.1 1.7 1.3 1500 40 6541 6.426.90 5.8 5.1 4.8 4.2 3.6 2.7 1.9 1.2 1.1 1500 32 7087 6.326.85 6.5 5.6 5.0 4.2 3.5 2.5 1.8 1.1 0.3 987 40 7463 5.8
Flexible Pavement Evaluation, Route 33, Westbound Lane 2
StationEffective
Structural Number
Subgrade Resilient Modulus
(psi)
AC Modulus
(ksi)
Base Modulus
(ksi)

Load Plate Radius = 5.9 in. Applied Loads = 5.5, 8.5, and 11.5 kips
Geophone Setting (in.) 0 8 12 18 24 36 48 60 72 Normalization Load = 9 kips
Normalized Deflections (mils)
D0 D1 D2 D3 D4 D5 D6 D7 D8
Flexible Pavement Evaluation, Route 33, Westbound Lane 2
StationEffective
Structural Number
Subgrade Resilient Modulus
(psi)
AC Modulus
(ksi)
Base Modulus
(ksi)
26.80 7.4 6.1 5.3 4.2 3.4 2.4 1.7 1.0 0.9 586 40 8172 5.326.75 7.0 6.0 5.5 4.8 4.0 3.0 2.2 1.5 1.4 947 40 6212 5.826.69 7.5 6.2 5.7 4.9 4.2 3.1 2.5 2.0 1.5 700 40 5576 5.726.64 7.7 6.0 5.1 4.3 3.6 2.7 2.0 1.7 1.3 439 40 6704 5.426.59 8.4 7.4 7.1 5.8 5.0 3.3 2.3 1.5 1.2 1201 21 6045 5.326.54 7.3 6.2 5.6 4.7 4.0 2.9 2.2 1.5 1.3 760 40 6325 5.926.49 6.0 4.8 4.5 3.8 3.3 2.5 1.9 1.3 1.2 854 40 7068 6.426.45 5.8 4.9 4.5 4.0 3.4 2.5 2.0 1.5 1.2 1010 40 6811 6.526.40 5.2 4.6 4.3 3.7 3.1 2.4 1.8 1.4 1.0 1500 40 7439 6.926.35 6.4 5.3 4.9 4.3 3.8 2.8 2.1 1.7 1.4 964 40 6436 6.326.30 7.2 6.2 5.8 5.1 4.3 3.2 2.4 1.7 1.4 1103 40 5806 6.026.24 5.0 4.5 4.2 3.7 3.2 2.4 1.9 1.5 1.1 1500 40 7405 7.026.20 6.8 6.6 6.5 5.2 4.5 3.4 2.7 1.9 1.6 1500 21 5164 6.426.15 6.1 5.2 4.9 4.4 3.8 3.0 2.3 1.9 1.5 1380 40 5984 6.626.10 5.7 5.1 4.9 4.3 3.8 2.9 2.3 1.7 1.5 1500 40 6028 6.826.06 5.5 4.9 4.6 4.1 3.6 2.7 2.0 1.4 1.2 1500 34 6898 6.726.01 5.3 4.6 4.4 3.7 3.2 2.3 1.7 1.2 1.0 1500 40 8220 6.625.96 6.4 5.2 4.6 3.6 2.9 1.9 1.3 0.9 0.7 736 40 10552 5.725.91 5.1 4.5 4.2 3.6 3.0 2.0 1.4 1.0 0.8 1500 40 9670 6.525.86 4.9 4.2 3.9 3.4 2.8 2.0 1.4 1.1 0.8 1500 40 9557 6.725.81 7.5 6.1 5.2 4.2 3.4 2.1 1.5 1.1 0.8 519 40 9446 5.425.76 6.9 5.9 5.3 4.4 3.6 2.3 1.5 1.0 0.9 905 40 9376 5.425.72 6.6 5.4 4.9 4.1 3.5 2.3 1.7 1.2 1.0 807 40 8161 5.625.66 8.7 7.2 6.2 4.7 3.6 2.3 1.6 1.3 1.0 468 40 8485 4.825.62 7.3 6.1 5.6 4.4 3.7 2.6 1.8 1.3 1.0 736 40 7767 5.425.56 5.8 4.8 4.3 3.6 3.0 2.1 1.5 1.0 0.8 1014 40 9463 5.925.52 9.3 7.2 6.0 4.4 3.3 1.9 1.2 0.9 0.8 301 40 10986 4.525.46 9.3 7.6 6.4 4.9 4.1 2.7 1.9 1.4 1.1 379 40 7458 4.825.41 8.8 7.0 5.9 4.4 3.4 2.0 1.4 0.9 0.8 380 40 9990 4.725.36 6.7 5.3 4.9 3.9 3.2 2.0 1.3 0.9 0.8 697 40 10387 5.325.31 8.6 7.4 6.4 4.9 3.8 2.3 1.6 1.1 0.9 549 40 8830 4.825.26 8.9 7.3 6.1 4.7 3.6 2.2 1.5 1.1 0.9 376 40 9422 4.725.21 10.1 8.0 6.5 4.8 3.6 2.1 1.4 1.1 1.0 269 40 9677 4.425.16 9.2 7.9 7.2 5.8 4.7 3.0 2.1 1.5 1.0 590 40 6413 4.925.11 8.0 7.0 6.4 5.4 4.6 3.1 2.1 1.5 1.3 836 40 6551 5.325.06 8.0 7.1 6.3 5.3 4.5 3.2 2.4 1.6 1.3 772 40 5772 5.525.01 7.3 6.2 5.6 4.7 3.9 2.8 2.1 1.5 1.2 738 40 6404 5.624.96 9.1 7.3 6.2 4.7 3.7 2.3 1.6 1.2 1.0 356 40 8523 4.724.91 8.5 6.8 5.7 4.1 3.1 1.8 1.1 0.9 0.7 366 40 12194 4.624.86 8.9 7.2 6.0 4.5 3.5 2.2 1.5 1.0 0.9 342 40 9227 4.724.81 7.4 6.3 5.5 4.5 3.7 2.5 1.8 1.3 1.0 641 40 7702 5.524.76 6.8 5.7 5.3 4.4 3.8 2.8 1.9 1.3 1.1 839 40 7189 5.924.71 6.0 5.1 4.7 4.1 3.5 2.5 1.8 1.3 1.1 999 40 7624 6.224.66 6.6 5.7 5.3 4.4 3.8 2.8 2.1 1.5 1.2 983 40 6669 6.024.61 6.8 5.6 4.9 4.0 3.4 2.3 1.7 1.2 0.9 609 40 8128 5.724.56 6.0 5.2 4.6 3.9 3.2 2.2 1.5 1.1 0.9 953 40 9133 6.024.51 6.7 5.2 4.5 3.5 2.8 1.9 1.4 0.8 0.8 493 40 9871 5.5
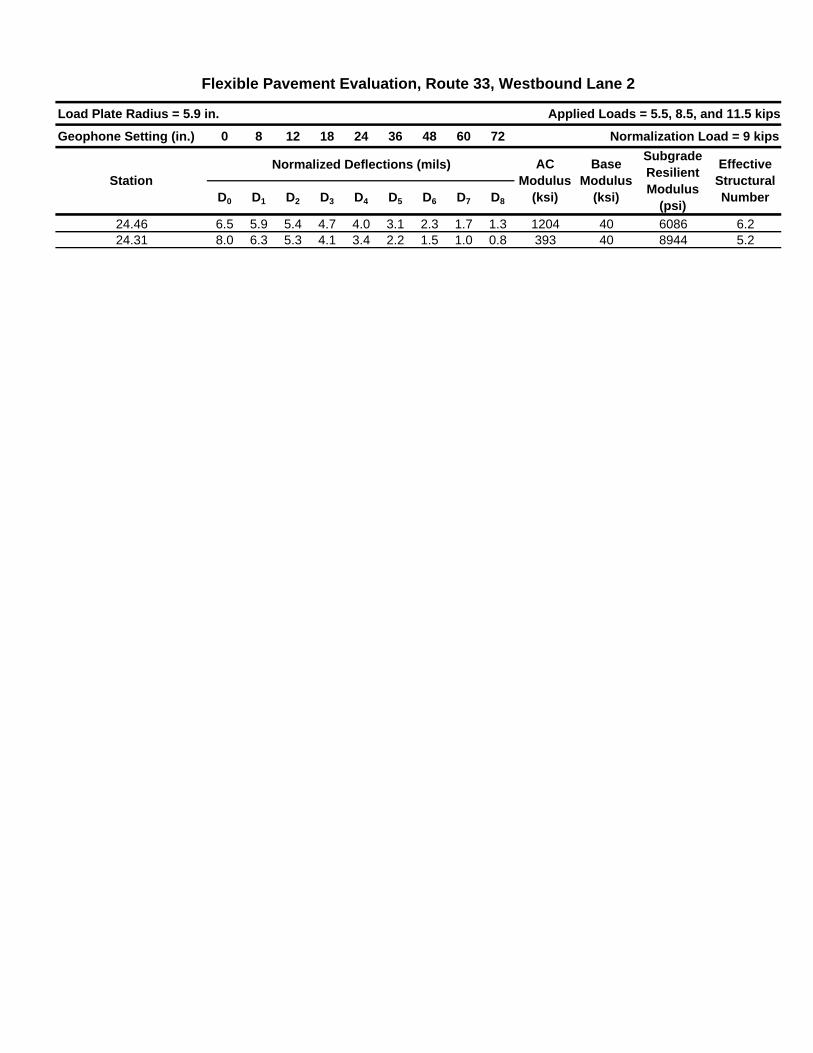
Load Plate Radius = 5.9 in. Applied Loads = 5.5, 8.5, and 11.5 kips
Geophone Setting (in.) 0 8 12 18 24 36 48 60 72 Normalization Load = 9 kips
Normalized Deflections (mils)
D0 D1 D2 D3 D4 D5 D6 D7 D8
Flexible Pavement Evaluation, Route 33, Westbound Lane 2
StationEffective
Structural Number
Subgrade Resilient Modulus
(psi)
AC Modulus
(ksi)
Base Modulus
(ksi)
24.46 6.5 5.9 5.4 4.7 4.0 3.1 2.3 1.7 1.3 1204 40 6086 6.224.31 8.0 6.3 5.3 4.1 3.4 2.2 1.5 1.0 0.8 393 40 8944 5.2

PAVEMENT EVALUATION AND DESIGN REPORT Route 33: EB & WB (MP 24.3-29.0)
Appendix D: Traffic Data

NEW JERSEY DEPARTMENT OF TRANSPORTATION
MEMORANDUM To: Sue Gresavage, Manager Pavement Management and Tech. FROM: Wagdi W. Gobrial- Central Region Division of Project Development DATE: September 23, 2010 PHONE: 530- 2741 SUBJECT: Route 33- MP 24.3 to 29.0 Manalapan and Freehold Townships, Monmouth County The following is the Traffic Design Data and Pavement Design Data for the Rt. 33 pavement resurfacing project. Year 2015 Traffic Design Data (TDD) Pavement Design Data (PDD) 2010 ADT (2 Way) = 24,285 vpd 2010 ADT (One Way) = 12,140 vpd 2015 ADT (2 Way) = 25,905 vpd 2015 ADT (One Way) = 12,790 vpd 2015 DHV (2 Way) = 2,590 vph 2015 Heavy Truck % in 24 Hours = 2% 2015 Directional Distribution = 55% 2015 Total Truck % in 24 Hours = 4% 2015 Heavy Truck % in Peak Hour = 3% Year 2035 Traffic Design Data (TDD) Pavement Design Data (PDD) 2010 ADT (2 Way) = 24,285 vpd 2010 ADT (One Way) = 12,140 vpd 2035 ADT (2 Way) = 33,540 vpd 2035 ADT (One Way) = 16,770 vpd 2035 DHV (2 Way) = 3,350 vph 2035 Heavy Truck % in 24 Hours = 2% 2035 Directional Distribution = 55% 2035 Total Truck % in 24 Hours = 4% 2035 Heavy Truck % in Peak Hour = 3% Should you have any questions please do not hesitate to contact me.

New Jersey Department of TransportationBureau of Transportation Data Development
Average Equivalency Factors per Vehicle for Heavy and Light Trucks
Equivalent Single Axle Load (ESAL) Design Factors
Rigid Pavement (r) P=2.5 D=228 mm (9.0")
Flexible Pavement (f) P=2.5 SN=127 mm (5.0")
Heavy Trucks - FHWA Class Type 6 to 13
Light Trucks - FHWA Class Type 4 & 5
Standard Route Mile Post Limit Ave. ESAL per Vehicle- Heavy Ave. ESAL per Vehicle - Light
ID (SRI) START END (f) (r) (f) (r)
MP MP 2009 2009 2009 2009
00000029 1.31 9.15 1.061 1.821 0.283 0.315
00000029 9.15 34.76 1.109 1.871 0.270 0.299
00000030 0.96 18.34 1.442 2.525 0.313 0.342
00000030 18.34 29.68 1.214 2.144 0.328 0.364
00000030 29.68 58.26 1.246 2.176 0.294 0.321
00000031 0.00 4.84 1.053 1.794 0.270 0.302
00000031 4.84 16.36 1.100 1.861 0.215 0.235
00000031 22.02 32.13 1.561 2.806 0.368 0.402
00000031 32.13 48.93 1.373 2.493 0.269 0.301
00000032 0.00 1.18 1.202 2.088 0.314 0.346
00000033 0.00 7.84 1.097 1.885 0.276 0.311
00000033 12.42 15.01 1.064 1.838 0.253 0.280
00000033 15.01 27.54 1.586 2.867 0.373 0.422
00000033 27.54 42.03 1.340 2.311 0.269 0.302
00000033B 0.00 5.03 1.245 2.190 0.307 0.346
00000034 0.00 4.13 1.184 2.081 0.240 0.255
00000034 4.13 12.27 1.469 2.610 0.324 0.360
00000034 12.27 22.42 1.325 2.357 0.275 0.304
00000034 22.42 26.79 1.208 2.063 0.315 0.354
00000035 0.00 20.24 1.212 2.085 0.288 0.324
00000035 20.24 49.38 1.435 2.524 0.266 0.303
00000035 50.63 58.11 1.265 2.276 0.324 0.364
00000035_Z 3.49 14.28 1.211 2.057 0.285 0.322
00000036 0.00 24.40 1.438 2.525 0.259 0.295
00000037 0.00 13.43 1.292 2.211 0.269 0.304
00000038 0.00 9.56 1.415 2.497 0.311 0.336
00000038 9.56 19.23 1.220 2.135 0.297 0.324
00000040 1.70 16.52 1.093 1.867 0.315 0.356
00000040 16.52 25.54 1.218 2.096 0.316 0.363
00000040 25.54 46.35 1.317 2.370 0.330 0.359
00000040 46.35 57.42 1.322 2.342 0.326 0.353
00000040 57.42 64.28 1.697 3.015 0.508 0.545
00000041 0.00 14.22 1.248 2.117 0.297 0.327
00000042 0.00 6.36 1.371 2.428 0.325 0.347
00000042 6.36 14.28 1.438 2.503 0.318 0.344
00000044 0.00 9.59 1.283 2.177 0.291 0.311
00000045 0.00 8.80 1.139 1.902 0.269 0.303
00000045 9.44 17.78 1.139 1.902 0.272 0.303
00000045 18.16 28.51 1.248 2.117 0.297 0.331
00000046 0.00 10.03 1.483 2.592 0.308 0.342
00000046 10.03 29.45 1.415 2.515 0.274 0.293
00000046 29.45 46.47 1.348 2.191 0.299 0.330
00000046 46.47 56.34 1.282 2.116 0.294 0.332
00000046 56.34 72.09 1.170 1.877 0.322 0.357
00000047 0.00 20.91 1.316 2.266 0.337 0.373
00000047 20.91 35.08 1.379 2.382 0.362 0.399
00000047 35.08 52.52 1.248 2.117 0.297 0.327
Page 2 of 8

PAVEMENT EVALUATION AND DESIGN REPORT Route 33: EB & WB (MP 24.3-29.0)
Appendix E: Pavement Design Calculation Sheets

Existing AC thickness (in)= 11.00Representative structural number SNeff= 6.57
* Elastic modulus of sound PCC is 3 to 8 million psi
Resilient Modulus Mr (psi)= 5138* Typical values are
Acceptable terminal servicibility Pt= 2.5 * Servicibility index is between 0-5
Initial servicibility P0= 4.2 * Rigid pavement 4.5, Flexible pavement 4.2
Servicibility loss (ΔPSI)= 1.7Average Daily Traffic (ADT) and year counted= 12140 2010Average Daily Traffic (ADT) and year counted= 16770 2035 1.301
Percent of Truck= 418-kips factor= 0.980
Lane Distribution (%)= 100First year of design service= 2015Last year of design service= 2025 Wf=
60 - 804
Lane DistributionGrowth Factor (%)=
2 80 - 1003
1 100
14737 1,979,738ADT=
Number of Lanes in Each Direction
50 - 75ADT= 12950
Project: Route 33: EB & WB (MP 24.3‐29.0)Design for: 10‐Year Life, AC Overlay for EB Lanes (Flexible Pavement Portions), MP 24.20‐25.36
Number of future ESAL's Wf= 1,979,738Reliability R= 95 ZR=
R= 50 60 70 80 85 90 91 92 93 94 95 96 97 98 99 100ZR= 0.0 -0.3 -0.5 -0.8 -1.0 -1.3 -1.3 -1.4 -1.5 -1.6 -1.6 -1.8 -1.9 -2.1 -2.3 -3.8
Standard deviation S0= 0.45Future structural number SNf = 4.70 W18=
SNf-SNeff (in)= -1.87Structural Coeffecient of new AC layer Aol= 0.44
E1= 1,237a1= 0.440mill 0
SNeff after milling 6.57Overlay after milling 0.00
Overlay thickness (in)= -4.24
Local 50-80
* S0=0.40-0.50 for flexible pavement (or overlay) design (I-62&III-82)&S0=0.30-0.40 for AC overlay (III-121)
1,979,738 (Wf-W18)^2= 6.4E-02
Pag
e II-
9
85-99.9 80-99.9
Principle arterials 80-99 75-95
75-95Collectors 80-95
50-80
Interstate and other freeways
-1.645Functional Classification Urban Rural
* Design ESAL is total number of ESAL's for the road multiplied by directional and lane distribution

Existing AC thickness (in)= 11.00Representative structural number SNeff= 6.57
* Elastic modulus of sound PCC is 3 to 8 million psi
Resilient Modulus Mr (psi)= 5138* Typical values are
Acceptable terminal servicibility Pt= 2.5 * Servicibility index is between 0-5
Initial servicibility P0= 4.2 * Rigid pavement 4.5, Flexible pavement 4.2
Servicibility loss (ΔPSI)= 1.7Average Daily Traffic (ADT) and year counted= 12140 2010Average Daily Traffic (ADT) and year counted= 16770 2035 1.301
Percent of Truck= 418-kips factor= 0.980
Lane Distribution (%)= 100First year of design service= 2015Last year of design service= 2086 Wf=
Number of Lanes in Each Direction Lane DistributionGrowth Factor (%)= 1 100
2 80 - 1003 60 - 804 50 - 75
ADT= 12950ADT= 32269 22,842,082
Project: Route 33: EB & WB (MP 24.3‐29.0)Design for: Life Provided by Mill 3" and AC Overlay 3" for EB Lanes (Flexible Pavement Portions), MP 24.20‐25.36
Number of future ESAL's Wf= 22,842,082Reliability R= 95 ZR=
R= 50 60 70 80 85 90 91 92 93 94 95 96 97 98 99 100ZR= 0.0 -0.3 -0.5 -0.8 -1.0 -1.3 -1.3 -1.4 -1.5 -1.6 -1.6 -1.8 -1.9 -2.1 -2.3 -3.8
Standard deviation S0= 0.45Future structural number SNf = 6.57 W18=
SNf-SNeff (in)= 0.00Structural Coeffecient of new AC layer Aol= 0.44
E1= 1,237a1= 0.440mill 3
SNeff after milling 5.25Overlay after milling 3.00 Life= years
* Design ESAL is total number of ESAL's for the road multiplied by directional and lane distribution
-1.645Functional Classification Urban Rural
Interstate and other freeways 85-99.9 80-99.9
5.0E-03
Principle arterials 80-99 75-95
Pag
e II-
9
Collectors 80-95 75-95
Overlay thickness (in)= 0.00
20.0
Local 50-80 50-80
* S0=0.40-0.50 for flexible pavement (or overlay) design (I-62&III-82)&S0=0.30-0.40 for AC overlay (III-121)
22,842,082 (Wf-W18)^2=

Existing AC thickness (in)= 9.00Representative structural number SNeff= 5.10
* Elastic modulus of sound PCC is 3 to 8 million psi
Resilient Modulus Mr (psi)= 4918* Typical values are
Acceptable terminal servicibility Pt= 2.5 * Servicibility index is between 0-5
Initial servicibility P0= 4.2 * Rigid pavement 4.5, Flexible pavement 4.2
Servicibility loss (ΔPSI)= 1.7Average Daily Traffic (ADT) and year counted= 12140 2010Average Daily Traffic (ADT) and year counted= 16770 2035 1.301
Percent of Truck= 418-kips factor= 0.980
Lane Distribution (%)= 100First year of design service= 2015Last year of design service= 2025 Wf=
Number of Lanes in Each Direction Lane DistributionGrowth Factor (%)= 1 100
2 80 - 1003 60 - 804 50 - 75
ADT= 12950ADT= 14737 1,979,738
Project: Route 33: EB & WB (MP 24.3‐29.0)Design for: 10‐Year Life, AC Overlay for EB Lanes, MP 25.36‐27.21
Number of future ESAL's Wf= 1,979,738Reliability R= 95 ZR=
R= 50 60 70 80 85 90 91 92 93 94 95 96 97 98 99 100ZR= 0.0 -0.3 -0.5 -0.8 -1.0 -1.3 -1.3 -1.4 -1.5 -1.6 -1.6 -1.8 -1.9 -2.1 -2.3 -3.8
Standard deviation S0= 0.45Future structural number SNf = 4.77 W18=
SNf-SNeff (in)= -0.33Structural Coeffecient of new AC layer Aol= 0.44
E1= 845a1= 0.426mill 0
SNeff after milling 5.10Overlay after milling 0.00
* Design ESAL is total number of ESAL's for the road multiplied by directional and lane distribution
-1.645Functional Classification Urban Rural
Interstate and other freeways 85-99.9 80-99.9
Principle arterials 80-99 75-95
Pag
e II-
9
Collectors 80-95 75-95
Overlay thickness (in)= -0.74
Local 50-80 50-80
* S0=0.40-0.50 for flexible pavement (or overlay) design (I-62&III-82)&S0=0.30-0.40 for AC overlay (III-121)
1,979,738 (Wf-W18)^2= 6.4E-02

Existing AC thickness (in)= 9.00Representative structural number SNeff= 5.10
* Elastic modulus of sound PCC is 3 to 8 million psi
Resilient Modulus Mr (psi)= 4918* Typical values are
Acceptable terminal servicibility Pt= 2.5 * Servicibility index is between 0-5
Initial servicibility P0= 4.2 * Rigid pavement 4.5, Flexible pavement 4.2
Servicibility loss (ΔPSI)= 1.7Average Daily Traffic (ADT) and year counted= 12140 2010Average Daily Traffic (ADT) and year counted= 16770 2035 1.301
Percent of Truck= 418-kips factor= 0.980
Lane Distribution (%)= 100First year of design service= 2015Last year of design service= 2031 Wf=
Number of Lanes in Each Direction Lane DistributionGrowth Factor (%)= 1 100
2 80 - 1003 60 - 804 50 - 75
ADT= 12950ADT= 15941 3,321,271
Project: Route 33: EB & WB (MP 24.3‐29.0)Design for: Life Provided by Mill 3" and AC Overlay 3" for EB Lanes, MP 25.36‐27.21
Number of future ESAL's Wf= 3,321,271Reliability R= 95 ZR=
R= 50 60 70 80 85 90 91 92 93 94 95 96 97 98 99 100ZR= 0.0 -0.3 -0.5 -0.8 -1.0 -1.3 -1.3 -1.4 -1.5 -1.6 -1.6 -1.8 -1.9 -2.1 -2.3 -3.8
Standard deviation S0= 0.45Future structural number SNf = 5.14 W18=
SNf-SNeff (in)= 0.04Structural Coeffecient of new AC layer Aol= 0.44
E1= 845a1= 0.426mill 3
SNeff after milling 3.82Overlay after milling 3.00 Life= years
* Design ESAL is total number of ESAL's for the road multiplied by directional and lane distribution
-1.645Functional Classification Urban Rural
Interstate and other freeways 85-99.9 80-99.9
1.5E-01
Principle arterials 80-99 75-95
Pag
e II-
9
Collectors 80-95 75-95
Overlay thickness (in)= 0.09
16.1
Local 50-80 50-80
* S0=0.40-0.50 for flexible pavement (or overlay) design (I-62&III-82)&S0=0.30-0.40 for AC overlay (III-121)
3,321,271 (Wf-W18)^2=

Existing AC thickness (in)= 10.50Representative structural number SNeff= 5.91
* Elastic modulus of sound PCC is 3 to 8 million psi
Resilient Modulus Mr (psi)= 4757* Typical values are
Acceptable terminal servicibility Pt= 2.5 * Servicibility index is between 0-5
Initial servicibility P0= 4.2 * Rigid pavement 4.5, Flexible pavement 4.2
Servicibility loss (ΔPSI)= 1.7Average Daily Traffic (ADT) and year counted= 12140 2010Average Daily Traffic (ADT) and year counted= 16770 2035 1.301
Percent of Truck= 418-kips factor= 0.980
Lane Distribution (%)= 100First year of design service= 2015Last year of design service= 2025 Wf=
Number of Lanes in Each Direction Lane DistributionGrowth Factor (%)= 1 100
2 80 - 1003 60 - 804 50 - 75
ADT= 12950ADT= 14737 1,979,738
Project: Route 33: EB & WB (MP 24.3‐29.0)Design for: 10‐Year Life, AC Overlay for EB Lanes, MP 27.21‐27.54
Number of future ESAL's Wf= 1,979,738Reliability R= 95 ZR=
R= 50 60 70 80 85 90 91 92 93 94 95 96 97 98 99 100ZR= 0.0 -0.3 -0.5 -0.8 -1.0 -1.3 -1.3 -1.4 -1.5 -1.6 -1.6 -1.8 -1.9 -2.1 -2.3 -3.8
Standard deviation S0= 0.45Future structural number SNf = 4.83 W18=
SNf-SNeff (in)= -1.08Structural Coeffecient of new AC layer Aol= 0.44
E1= 1,063a1= 0.440mill 0
SNeff after milling 5.91Overlay after milling 0.00
* Design ESAL is total number of ESAL's for the road multiplied by directional and lane distribution
-1.645Functional Classification Urban Rural
Interstate and other freeways 85-99.9 80-99.9
Principle arterials 80-99 75-95
Pag
e II-
9
Collectors 80-95 75-95
Overlay thickness (in)= -2.45
Local 50-80 50-80
* S0=0.40-0.50 for flexible pavement (or overlay) design (I-62&III-82)&S0=0.30-0.40 for AC overlay (III-121)
1,979,738 (Wf-W18)^2= 6.4E-02

Existing AC thickness (in)= 10.50Representative structural number SNeff= 5.91
* Elastic modulus of sound PCC is 3 to 8 million psi
Resilient Modulus Mr (psi)= 4757* Typical values are
Acceptable terminal servicibility Pt= 2.5 * Servicibility index is between 0-5
Initial servicibility P0= 4.2 * Rigid pavement 4.5, Flexible pavement 4.2
Servicibility loss (ΔPSI)= 1.7Average Daily Traffic (ADT) and year counted= 12140 2010Average Daily Traffic (ADT) and year counted= 16770 2035 1.301
Percent of Truck= 418-kips factor= 0.980
Lane Distribution (%)= 100First year of design service= 2015Last year of design service= 2050 Wf=
Number of Lanes in Each Direction Lane DistributionGrowth Factor (%)= 1 100
2 80 - 1003 60 - 804 50 - 75
ADT= 12950ADT= 20485 8,482,963
Project: Route 33: EB & WB (MP 24.3‐29.0)Design for: Life Provided by Mill 4" and AC Overlay 4"for EB Lanes, MP 27.21‐27.54
Number of future ESAL's Wf= 8,482,963Reliability R= 95 ZR=
R= 50 60 70 80 85 90 91 92 93 94 95 96 97 98 99 100ZR= 0.0 -0.3 -0.5 -0.8 -1.0 -1.3 -1.3 -1.4 -1.5 -1.6 -1.6 -1.8 -1.9 -2.1 -2.3 -3.8
Standard deviation S0= 0.45Future structural number SNf = 5.91 W18=
SNf-SNeff (in)= 0.00Structural Coeffecient of new AC layer Aol= 0.44
E1= 1,063a1= 0.440mill 4
SNeff after milling 4.15Overlay after milling 4.00 Life= years
* Design ESAL is total number of ESAL's for the road multiplied by directional and lane distribution
-1.645Functional Classification Urban Rural
Interstate and other freeways 85-99.9 80-99.9
3.0E-02
Principle arterials 80-99 75-95
Pag
e II-
9
Collectors 80-95 75-95
Overlay thickness (in)= 0.00
20.0
Local 50-80 50-80
* S0=0.40-0.50 for flexible pavement (or overlay) design (I-62&III-82)&S0=0.30-0.40 for AC overlay (III-121)
8,482,963 (Wf-W18)^2=

Existing AC thickness (in)= 10.50Representative structural number SNeff= 6.09
* Elastic modulus of sound PCC is 3 to 8 million psi
Resilient Modulus Mr (psi)= 4928* Typical values are
Acceptable terminal servicibility Pt= 2.5 * Servicibility index is between 0-5
Initial servicibility P0= 4.2 * Rigid pavement 4.5, Flexible pavement 4.2
Servicibility loss (ΔPSI)= 1.7Average Daily Traffic (ADT) and year counted= 12140 2010Average Daily Traffic (ADT) and year counted= 16770 2035 1.301
Percent of Truck= 418-kips factor= 0.805
Lane Distribution (%)= 100First year of design service= 2015Last year of design service= 2025 Wf=
Number of Lanes in Each Direction Lane DistributionGrowth Factor (%)= 1 100
2 80 - 1003 60 - 804 50 - 75
ADT= 12950ADT= 14737 1,626,033
Project: Route 33: EB & WB (MP 24.3‐29.0)Design for: 10‐Year Life, AC Overlay for EB Lanes, MP 27.54‐27.91
Number of future ESAL's Wf= 1,626,033Reliability R= 95 ZR=
R= 50 60 70 80 85 90 91 92 93 94 95 96 97 98 99 100ZR= 0.0 -0.3 -0.5 -0.8 -1.0 -1.3 -1.3 -1.4 -1.5 -1.6 -1.6 -1.8 -1.9 -2.1 -2.3 -3.8
Standard deviation S0= 0.45Future structural number SNf = 4.63 W18=
SNf-SNeff (in)= -1.45Structural Coeffecient of new AC layer Aol= 0.44
E1= 1,155a1= 0.440mill 0
SNeff after milling 6.09Overlay after milling 0.00
* Design ESAL is total number of ESAL's for the road multiplied by directional and lane distribution
-1.645Functional Classification Urban Rural
Interstate and other freeways 85-99.9 80-99.9
Principle arterials 80-99 75-95
Pag
e II-
9
Collectors 80-95 75-95
Overlay thickness (in)= -3.30
Local 50-80 50-80
* S0=0.40-0.50 for flexible pavement (or overlay) design (I-62&III-82)&S0=0.30-0.40 for AC overlay (III-121)
1,626,033 (Wf-W18)^2= 1.1E-02

Existing AC thickness (in)= 10.50Representative structural number SNeff= 6.09
* Elastic modulus of sound PCC is 3 to 8 million psi
Resilient Modulus Mr (psi)= 4928* Typical values are
Acceptable terminal servicibility Pt= 2.5 * Servicibility index is between 0-5
Initial servicibility P0= 4.2 * Rigid pavement 4.5, Flexible pavement 4.2
Servicibility loss (ΔPSI)= 1.7Average Daily Traffic (ADT) and year counted= 12140 2010Average Daily Traffic (ADT) and year counted= 16770 2035 1.301
Percent of Truck= 418-kips factor= 0.805
Lane Distribution (%)= 100First year of design service= 2015Last year of design service= 2066 Wf=
Number of Lanes in Each Direction Lane DistributionGrowth Factor (%)= 1 100
2 80 - 1003 60 - 804 50 - 75
ADT= 12950ADT= 25194 11,535,800
Project: Route 33: EB & WB (MP 24.3‐29.0)Design for: Life Provided by Mill 4" and AC Overlay 4" for EB Lanes, MP 27.54‐27.91
Number of future ESAL's Wf= 11,535,800Reliability R= 95 ZR=
R= 50 60 70 80 85 90 91 92 93 94 95 96 97 98 99 100ZR= 0.0 -0.3 -0.5 -0.8 -1.0 -1.3 -1.3 -1.4 -1.5 -1.6 -1.6 -1.8 -1.9 -2.1 -2.3 -3.8
Standard deviation S0= 0.45Future structural number SNf = 6.09 W18=
SNf-SNeff (in)= 0.00Structural Coeffecient of new AC layer Aol= 0.44
E1= 1,155a1= 0.440mill 4
SNeff after milling 4.33Overlay after milling 4.00 Life= years
* Design ESAL is total number of ESAL's for the road multiplied by directional and lane distribution
-1.645Functional Classification Urban Rural
Interstate and other freeways 85-99.9 80-99.9
3.5E-02
Principle arterials 80-99 75-95
Pag
e II-
9
Collectors 80-95 75-95
Overlay thickness (in)= 0.00
20.0
Local 50-80 50-80
* S0=0.40-0.50 for flexible pavement (or overlay) design (I-62&III-82)&S0=0.30-0.40 for AC overlay (III-121)
11,535,800 (Wf-W18)^2=

Existing AC thickness (in)= 8.50Representative structural number SNeff= 5.00
* Elastic modulus of sound PCC is 3 to 8 million psi
Resilient Modulus Mr (psi)= 4528* Typical values are
Acceptable terminal servicibility Pt= 2.5 * Servicibility index is between 0-5
Initial servicibility P0= 4.2 * Rigid pavement 4.5, Flexible pavement 4.2
Servicibility loss (ΔPSI)= 1.7Average Daily Traffic (ADT) and year counted= 12140 2010Average Daily Traffic (ADT) and year counted= 16770 2035 1.301
Percent of Truck= 418-kips factor= 0.805
Lane Distribution (%)= 100First year of design service= 2015Last year of design service= 2025 Wf=
Number of Lanes in Each Direction Lane DistributionGrowth Factor (%)= 1 100
2 80 - 1003 60 - 804 50 - 75
ADT= 12950ADT= 14737 1,626,033
Project: Route 33: EB & WB (MP 24.3‐29.0)Design for: 10‐Year Life, AC Overlay for EB Lanes, MP 27.91‐28.88
Number of future ESAL's Wf= 1,626,033Reliability R= 95 ZR=
R= 50 60 70 80 85 90 91 92 93 94 95 96 97 98 99 100ZR= 0.0 -0.3 -0.5 -0.8 -1.0 -1.3 -1.3 -1.4 -1.5 -1.6 -1.6 -1.8 -1.9 -2.1 -2.3 -3.8
Standard deviation S0= 0.45Future structural number SNf = 4.77 W18=
SNf-SNeff (in)= -0.23Structural Coeffecient of new AC layer Aol= 0.44
E1= 914a1= 0.437mill 0
SNeff after milling 5.00Overlay after milling 0.00
* Design ESAL is total number of ESAL's for the road multiplied by directional and lane distribution
-1.645Functional Classification Urban Rural
Interstate and other freeways 85-99.9 80-99.9
Principle arterials 80-99 75-95
Pag
e II-
9
Collectors 80-95 75-95
Overlay thickness (in)= -0.53
Local 50-80 50-80
* S0=0.40-0.50 for flexible pavement (or overlay) design (I-62&III-82)&S0=0.30-0.40 for AC overlay (III-121)
1,626,033 (Wf-W18)^2= 1.1E-02

Existing AC thickness (in)= 8.50Representative structural number SNeff= 5.00
* Elastic modulus of sound PCC is 3 to 8 million psi
Resilient Modulus Mr (psi)= 4528* Typical values are
Acceptable terminal servicibility Pt= 2.5 * Servicibility index is between 0-5
Initial servicibility P0= 4.2 * Rigid pavement 4.5, Flexible pavement 4.2
Servicibility loss (ΔPSI)= 1.7Average Daily Traffic (ADT) and year counted= 12140 2010Average Daily Traffic (ADT) and year counted= 16770 2035 1.301
Percent of Truck= 418-kips factor= 0.805
Lane Distribution (%)= 100First year of design service= 2015Last year of design service= 2029 Wf=
Number of Lanes in Each Direction Lane DistributionGrowth Factor (%)= 1 100
2 80 - 1003 60 - 804 50 - 75
ADT= 12950ADT= 15468 2,294,280
Project: Route 33: EB & WB (MP 24.3‐29.0)Design for: Life Provided by Mill 4" and AC Overlay 4" for EB Lanes, MP 27.91‐28.88
Number of future ESAL's Wf= 2,294,280Reliability R= 95 ZR=
R= 50 60 70 80 85 90 91 92 93 94 95 96 97 98 99 100ZR= 0.0 -0.3 -0.5 -0.8 -1.0 -1.3 -1.3 -1.4 -1.5 -1.6 -1.6 -1.8 -1.9 -2.1 -2.3 -3.8
Standard deviation S0= 0.45Future structural number SNf = 5.01 W18=
SNf-SNeff (in)= 0.01Structural Coeffecient of new AC layer Aol= 0.44
E1= 914a1= 0.437mill 4
SNeff after milling 3.25Overlay after milling 4.00 Life= years
* Design ESAL is total number of ESAL's for the road multiplied by directional and lane distribution
-1.645Functional Classification Urban Rural
Interstate and other freeways 85-99.9 80-99.9
1.0E-04
Principle arterials 80-99 75-95
Pag
e II-
9
Collectors 80-95 75-95
Overlay thickness (in)= 0.02
13.7
Local 50-80 50-80
* S0=0.40-0.50 for flexible pavement (or overlay) design (I-62&III-82)&S0=0.30-0.40 for AC overlay (III-121)
2,294,280 (Wf-W18)^2=

Existing AC thickness (in)= 10.50Representative structural number SNeff= 5.79
* Elastic modulus of sound PCC is 3 to 8 million psi
Resilient Modulus Mr (psi)= 5139* Typical values are
Acceptable terminal servicibility Pt= 2.5 * Servicibility index is between 0-5
Initial servicibility P0= 4.2 * Rigid pavement 4.5, Flexible pavement 4.2
Servicibility loss (ΔPSI)= 1.7Average Daily Traffic (ADT) and year counted= 12140 2010Average Daily Traffic (ADT) and year counted= 16770 2035 1.301
Percent of Truck= 418-kips factor= 0.980
Lane Distribution (%)= 100First year of design service= 2015Last year of design service= 2025 Wf=
Number of Lanes in Each Direction Lane DistributionGrowth Factor (%)= 1 100
2 80 - 1003 60 - 804 50 - 75
ADT= 12950ADT= 14737 1,979,738
Project: Route 33: EB & WB (MP 24.3‐29.0)Design for: 10‐Year Life, AC Overlay for WB Lanes (Flexible Pavement Portions), MP 24.31‐24.84
Number of future ESAL's Wf= 1,979,738Reliability R= 95 ZR=
R= 50 60 70 80 85 90 91 92 93 94 95 96 97 98 99 100ZR= 0.0 -0.3 -0.5 -0.8 -1.0 -1.3 -1.3 -1.4 -1.5 -1.6 -1.6 -1.8 -1.9 -2.1 -2.3 -3.8
Standard deviation S0= 0.45Future structural number SNf = 4.70 W18=
SNf-SNeff (in)= -1.09Structural Coeffecient of new AC layer Aol= 0.44
E1= 790a1= 0.417mill 0
SNeff after milling 5.79Overlay after milling 0.00
* Design ESAL is total number of ESAL's for the road multiplied by directional and lane distribution
-1.645Functional Classification Urban Rural
Interstate and other freeways 85-99.9 80-99.9
Principle arterials 80-99 75-95
Pag
e II-
9
Collectors 80-95 75-95
Overlay thickness (in)= -2.47
Local 50-80 50-80
* S0=0.40-0.50 for flexible pavement (or overlay) design (I-62&III-82)&S0=0.30-0.40 for AC overlay (III-121)
1,979,738 (Wf-W18)^2= 6.4E-02

Existing AC thickness (in)= 10.50Representative structural number SNeff= 5.79
* Elastic modulus of sound PCC is 3 to 8 million psi
Resilient Modulus Mr (psi)= 5139* Typical values are
Acceptable terminal servicibility Pt= 2.5 * Servicibility index is between 0-5
Initial servicibility P0= 4.2 * Rigid pavement 4.5, Flexible pavement 4.2
Servicibility loss (ΔPSI)= 1.7Average Daily Traffic (ADT) and year counted= 12140 2010Average Daily Traffic (ADT) and year counted= 16770 2035 1.301
Percent of Truck= 418-kips factor= 0.980
Lane Distribution (%)= 100First year of design service= 2015Last year of design service= 2055 Wf=
Number of Lanes in Each Direction Lane DistributionGrowth Factor (%)= 1 100
2 80 - 1003 60 - 804 50 - 75
ADT= 12950ADT= 21646 9,833,530
Project: Route 33: EB & WB (MP 24.3‐29.0)Design for: Life Provided by Mill 4" and AC Overlay 4" for WB Lanes (Flexible Pavement Portions), MP 24.31‐24.84
Number of future ESAL's Wf= 9,833,530Reliability R= 95 ZR=
R= 50 60 70 80 85 90 91 92 93 94 95 96 97 98 99 100ZR= 0.0 -0.3 -0.5 -0.8 -1.0 -1.3 -1.3 -1.4 -1.5 -1.6 -1.6 -1.8 -1.9 -2.1 -2.3 -3.8
Standard deviation S0= 0.45Future structural number SNf = 5.88 W18=
SNf-SNeff (in)= 0.09Structural Coeffecient of new AC layer Aol= 0.44
E1= 790a1= 0.417mill 4
SNeff after milling 4.12Overlay after milling 4.00 Life= years
* Design ESAL is total number of ESAL's for the road multiplied by directional and lane distribution
-1.645Functional Classification Urban Rural
Interstate and other freeways 85-99.9 80-99.9
7.0E-02
Principle arterials 80-99 75-95
Pag
e II-
9
Collectors 80-95 75-95
Overlay thickness (in)= 0.21
20.0
Local 50-80 50-80
* S0=0.40-0.50 for flexible pavement (or overlay) design (I-62&III-82)&S0=0.30-0.40 for AC overlay (III-121)
9,833,530 (Wf-W18)^2=

Existing AC thickness (in)= 9.75Representative structural number SNeff= 5.02
* Elastic modulus of sound PCC is 3 to 8 million psi
Resilient Modulus Mr (psi)= 5606* Typical values are
Acceptable terminal servicibility Pt= 2.5 * Servicibility index is between 0-5
Initial servicibility P0= 4.2 * Rigid pavement 4.5, Flexible pavement 4.2
Servicibility loss (ΔPSI)= 1.7Average Daily Traffic (ADT) and year counted= 12140 2010Average Daily Traffic (ADT) and year counted= 16770 2035 1.301
Percent of Truck= 418-kips factor= 0.980
Lane Distribution (%)= 100First year of design service= 2015Last year of design service= 2025 Wf=
Number of Lanes in Each Direction Lane DistributionGrowth Factor (%)= 1 100
2 80 - 1003 60 - 804 50 - 75
ADT= 12950ADT= 14737 1,979,738
Project: Route 33: EB & WB (MP 24.3‐29.0)Design for: 10‐Year Life, AC Overlay for WB Lanes, MP 24.84‐25.76
Number of future ESAL's Wf= 1,979,738Reliability R= 95 ZR=
R= 50 60 70 80 85 90 91 92 93 94 95 96 97 98 99 100ZR= 0.0 -0.3 -0.5 -0.8 -1.0 -1.3 -1.3 -1.4 -1.5 -1.6 -1.6 -1.8 -1.9 -2.1 -2.3 -3.8
Standard deviation S0= 0.45Future structural number SNf = 4.56 W18=
SNf-SNeff (in)= -0.46Structural Coeffecient of new AC layer Aol= 0.44
E1= 554a1= 0.370mill 0
SNeff after milling 5.02Overlay after milling 0.00
* Design ESAL is total number of ESAL's for the road multiplied by directional and lane distribution
-1.645Functional Classification Urban Rural
Interstate and other freeways 85-99.9 80-99.9
Principle arterials 80-99 75-95
Pag
e II-
9
Collectors 80-95 75-95
Overlay thickness (in)= -1.04
Local 50-80 50-80
* S0=0.40-0.50 for flexible pavement (or overlay) design (I-62&III-82)&S0=0.30-0.40 for AC overlay (III-121)
1,979,738 (Wf-W18)^2= 6.4E-02

Existing AC thickness (in)= 9.75Representative structural number SNeff= 5.02
* Elastic modulus of sound PCC is 3 to 8 million psi
Resilient Modulus Mr (psi)= 5606* Typical values are
Acceptable terminal servicibility Pt= 2.5 * Servicibility index is between 0-5
Initial servicibility P0= 4.2 * Rigid pavement 4.5, Flexible pavement 4.2
Servicibility loss (ΔPSI)= 1.7Average Daily Traffic (ADT) and year counted= 12140 2010Average Daily Traffic (ADT) and year counted= 16770 2035 1.301
Percent of Truck= 418-kips factor= 0.980
Lane Distribution (%)= 100First year of design service= 2015Last year of design service= 2040 Wf=
Number of Lanes in Each Direction Lane DistributionGrowth Factor (%)= 1 100
2 80 - 1003 60 - 804 50 - 75
ADT= 12950ADT= 17976 5,610,988
Project: Route 33: EB & WB (MP 24.3‐29.0)Design for: Life Provided by Mill 4" and AC Overlay 4" for WB Lanes, MP 24.84‐25.76
Number of future ESAL's Wf= 5,610,988Reliability R= 95 ZR=
R= 50 60 70 80 85 90 91 92 93 94 95 96 97 98 99 100ZR= 0.0 -0.3 -0.5 -0.8 -1.0 -1.3 -1.3 -1.4 -1.5 -1.6 -1.6 -1.8 -1.9 -2.1 -2.3 -3.8
Standard deviation S0= 0.45Future structural number SNf = 5.30 W18=
SNf-SNeff (in)= 0.28Structural Coeffecient of new AC layer Aol= 0.44
E1= 554a1= 0.370mill 4
SNeff after milling 3.54Overlay after milling 4.00 Life= years
* Design ESAL is total number of ESAL's for the road multiplied by directional and lane distribution
-1.645Functional Classification Urban Rural
Interstate and other freeways 85-99.9 80-99.9
8.5E-02
Principle arterials 80-99 75-95
Pag
e II-
9
Collectors 80-95 75-95
Overlay thickness (in)= 0.63
20.0
Local 50-80 50-80
* S0=0.40-0.50 for flexible pavement (or overlay) design (I-62&III-82)&S0=0.30-0.40 for AC overlay (III-121)
5,610,988 (Wf-W18)^2=

Existing AC thickness (in)= 11.00Representative structural number SNeff= 6.34
* Elastic modulus of sound PCC is 3 to 8 million psi
Resilient Modulus Mr (psi)= 4889* Typical values are
Acceptable terminal servicibility Pt= 2.5 * Servicibility index is between 0-5
Initial servicibility P0= 4.2 * Rigid pavement 4.5, Flexible pavement 4.2
Servicibility loss (ΔPSI)= 1.7Average Daily Traffic (ADT) and year counted= 12140 2010Average Daily Traffic (ADT) and year counted= 16770 2035 1.301
Percent of Truck= 418-kips factor= 0.980
Lane Distribution (%)= 100First year of design service= 2015Last year of design service= 2025 Wf=
Number of Lanes in Each Direction Lane DistributionGrowth Factor (%)= 1 100
2 80 - 1003 60 - 804 50 - 75
ADT= 12950ADT= 14737 1,979,738
Project: Route 33: EB & WB (MP 24.3‐29.0)Design for: 10‐Year Life, AC Overlay for WB Lanes, MP 25.76‐26.55
Number of future ESAL's Wf= 1,979,738Reliability R= 95 ZR=
R= 50 60 70 80 85 90 91 92 93 94 95 96 97 98 99 100ZR= 0.0 -0.3 -0.5 -0.8 -1.0 -1.3 -1.3 -1.4 -1.5 -1.6 -1.6 -1.8 -1.9 -2.1 -2.3 -3.8
Standard deviation S0= 0.45Future structural number SNf = 4.78 W18=
SNf-SNeff (in)= -1.56Structural Coeffecient of new AC layer Aol= 0.44
E1= 1,190a1= 0.440mill 0
SNeff after milling 6.34Overlay after milling 0.00
* Design ESAL is total number of ESAL's for the road multiplied by directional and lane distribution
-1.645Functional Classification Urban Rural
Interstate and other freeways 85-99.9 80-99.9
Principle arterials 80-99 75-95
Pag
e II-
9
Collectors 80-95 75-95
Overlay thickness (in)= -3.55
Local 50-80 50-80
* S0=0.40-0.50 for flexible pavement (or overlay) design (I-62&III-82)&S0=0.30-0.40 for AC overlay (III-121)
1,979,738 (Wf-W18)^2= 6.4E-02

Existing AC thickness (in)= 11.00Representative structural number SNeff= 6.34
* Elastic modulus of sound PCC is 3 to 8 million psi
Resilient Modulus Mr (psi)= 4889* Typical values are
Acceptable terminal servicibility Pt= 2.5 * Servicibility index is between 0-5
Initial servicibility P0= 4.2 * Rigid pavement 4.5, Flexible pavement 4.2
Servicibility loss (ΔPSI)= 1.7Average Daily Traffic (ADT) and year counted= 12140 2010Average Daily Traffic (ADT) and year counted= 16770 2035 1.301
Percent of Truck= 418-kips factor= 0.980
Lane Distribution (%)= 100First year of design service= 2015Last year of design service= 2070 Wf=
Number of Lanes in Each Direction Lane DistributionGrowth Factor (%)= 1 100
2 80 - 1003 60 - 804 50 - 75
ADT= 12950ADT= 26428 15,540,908
Project: Route 33: EB & WB (MP 24.3‐29.0)Design for: Life Provided by Mill 4" and AC Overlay 4" for WB Lanes, MP 25.76‐26.55
Number of future ESAL's Wf= 15,540,908Reliability R= 95 ZR=
R= 50 60 70 80 85 90 91 92 93 94 95 96 97 98 99 100ZR= 0.0 -0.3 -0.5 -0.8 -1.0 -1.3 -1.3 -1.4 -1.5 -1.6 -1.6 -1.8 -1.9 -2.1 -2.3 -3.8
Standard deviation S0= 0.45Future structural number SNf = 6.34 W18=
SNf-SNeff (in)= 0.00Structural Coeffecient of new AC layer Aol= 0.44
E1= 1,190a1= 0.440mill 4
SNeff after milling 4.58Overlay after milling 4.00 Life= years
* Design ESAL is total number of ESAL's for the road multiplied by directional and lane distribution
-1.645Functional Classification Urban Rural
Interstate and other freeways 85-99.9 80-99.9
3.1E-02
Principle arterials 80-99 75-95
Pag
e II-
9
Collectors 80-95 75-95
Overlay thickness (in)= 0.00
20.0
Local 50-80 50-80
* S0=0.40-0.50 for flexible pavement (or overlay) design (I-62&III-82)&S0=0.30-0.40 for AC overlay (III-121)
15,540,908 (Wf-W18)^2=

Existing AC thickness (in)= 10.00Representative structural number SNeff= 5.77
* Elastic modulus of sound PCC is 3 to 8 million psi
Resilient Modulus Mr (psi)= 4362* Typical values are
Acceptable terminal servicibility Pt= 2.5 * Servicibility index is between 0-5
Initial servicibility P0= 4.2 * Rigid pavement 4.5, Flexible pavement 4.2
Servicibility loss (ΔPSI)= 1.7Average Daily Traffic (ADT) and year counted= 12140 2010Average Daily Traffic (ADT) and year counted= 16770 2035 1.301
Percent of Truck= 418-kips factor= 0.980
Lane Distribution (%)= 100First year of design service= 2015Last year of design service= 2025 Wf=
Number of Lanes in Each Direction Lane DistributionGrowth Factor (%)= 1 100
2 80 - 1003 60 - 804 50 - 75
ADT= 12950ADT= 14737 1,979,738
Project: Route 33: EB & WB (MP 24.3‐29.0)Design for: 10‐Year Life, AC Overlay for WB Lanes, MP 26.55‐26.99
Number of future ESAL's Wf= 1,979,738Reliability R= 95 ZR=
R= 50 60 70 80 85 90 91 92 93 94 95 96 97 98 99 100ZR= 0.0 -0.3 -0.5 -0.8 -1.0 -1.3 -1.3 -1.4 -1.5 -1.6 -1.6 -1.8 -1.9 -2.1 -2.3 -3.8
Standard deviation S0= 0.45Future structural number SNf = 4.97 W18=
SNf-SNeff (in)= -0.80Structural Coeffecient of new AC layer Aol= 0.44
E1= 982a1= 0.440mill 0
SNeff after milling 5.77Overlay after milling 0.00
* Design ESAL is total number of ESAL's for the road multiplied by directional and lane distribution
-1.645Functional Classification Urban Rural
Interstate and other freeways 85-99.9 80-99.9
Principle arterials 80-99 75-95
Pag
e II-
9
Collectors 80-95 75-95
Overlay thickness (in)= -1.82
Local 50-80 50-80
* S0=0.40-0.50 for flexible pavement (or overlay) design (I-62&III-82)&S0=0.30-0.40 for AC overlay (III-121)
1,979,738 (Wf-W18)^2= 6.4E-02

Existing AC thickness (in)= 10.00Representative structural number SNeff= 5.77
* Elastic modulus of sound PCC is 3 to 8 million psi
Resilient Modulus Mr (psi)= 4362* Typical values are
Acceptable terminal servicibility Pt= 2.5 * Servicibility index is between 0-5
Initial servicibility P0= 4.2 * Rigid pavement 4.5, Flexible pavement 4.2
Servicibility loss (ΔPSI)= 1.7Average Daily Traffic (ADT) and year counted= 12140 2010Average Daily Traffic (ADT) and year counted= 16770 2035 1.301
Percent of Truck= 418-kips factor= 0.980
Lane Distribution (%)= 100First year of design service= 2015Last year of design service= 2041 Wf=
Number of Lanes in Each Direction Lane DistributionGrowth Factor (%)= 1 100
2 80 - 1003 60 - 804 50 - 75
ADT= 12950ADT= 18170 5,830,659
Project: Route 33: EB & WB (MP 24.3‐29.0)Design for: Life Provided by Mill 4" and AC Overlay 4" for WB Lanes, MP 26.55‐26.99
Number of future ESAL's Wf= 5,830,659Reliability R= 95 ZR=
R= 50 60 70 80 85 90 91 92 93 94 95 96 97 98 99 100ZR= 0.0 -0.3 -0.5 -0.8 -1.0 -1.3 -1.3 -1.4 -1.5 -1.6 -1.6 -1.8 -1.9 -2.1 -2.3 -3.8
Standard deviation S0= 0.45Future structural number SNf = 5.77 W18=
SNf-SNeff (in)= 0.00Structural Coeffecient of new AC layer Aol= 0.44
E1= 982a1= 0.440mill 4
SNeff after milling 4.01Overlay after milling 4.00 Life= years
* Design ESAL is total number of ESAL's for the road multiplied by directional and lane distribution
-1.645Functional Classification Urban Rural
Interstate and other freeways 85-99.9 80-99.9
5.6E-02
Principle arterials 80-99 75-95
Pag
e II-
9
Collectors 80-95 75-95
Overlay thickness (in)= 0.00
20.0
Local 50-80 50-80
* S0=0.40-0.50 for flexible pavement (or overlay) design (I-62&III-82)&S0=0.30-0.40 for AC overlay (III-121)
5,830,659 (Wf-W18)^2=

Existing AC thickness (in)= 10.50Representative structural number SNeff= 6.54
* Elastic modulus of sound PCC is 3 to 8 million psi
Resilient Modulus Mr (psi)= 5036* Typical values are
Acceptable terminal servicibility Pt= 2.5 * Servicibility index is between 0-5
Initial servicibility P0= 4.2 * Rigid pavement 4.5, Flexible pavement 4.2
Servicibility loss (ΔPSI)= 1.7Average Daily Traffic (ADT) and year counted= 12140 2010Average Daily Traffic (ADT) and year counted= 16770 2035 1.301
Percent of Truck= 418-kips factor= 0.980
Lane Distribution (%)= 100First year of design service= 2015Last year of design service= 2025 Wf=
Number of Lanes in Each Direction Lane DistributionGrowth Factor (%)= 1 100
2 80 - 1003 60 - 804 50 - 75
ADT= 12950ADT= 14737 1,979,738
Project: Route 33: EB & WB (MP 24.3‐29.0)Design for: 10‐Year Life, AC Overlay for WB Lanes, MP 26.99‐27.54
Number of future ESAL's Wf= 1,979,738Reliability R= 95 ZR=
R= 50 60 70 80 85 90 91 92 93 94 95 96 97 98 99 100ZR= 0.0 -0.3 -0.5 -0.8 -1.0 -1.3 -1.3 -1.4 -1.5 -1.6 -1.6 -1.8 -1.9 -2.1 -2.3 -3.8
Standard deviation S0= 0.45Future structural number SNf = 4.73 W18=
SNf-SNeff (in)= -1.80Structural Coeffecient of new AC layer Aol= 0.44
E1= 1,260a1= 0.440mill 0
SNeff after milling 6.54Overlay after milling 0.00
* Design ESAL is total number of ESAL's for the road multiplied by directional and lane distribution
-1.645Functional Classification Urban Rural
Interstate and other freeways 85-99.9 80-99.9
Principle arterials 80-99 75-95
Pag
e II-
9
Collectors 80-95 75-95
Overlay thickness (in)= -4.10
Local 50-80 50-80
* S0=0.40-0.50 for flexible pavement (or overlay) design (I-62&III-82)&S0=0.30-0.40 for AC overlay (III-121)
1,979,738 (Wf-W18)^2= 6.4E-02

Existing AC thickness (in)= 10.50Representative structural number SNeff= 6.54
* Elastic modulus of sound PCC is 3 to 8 million psi
Resilient Modulus Mr (psi)= 5036* Typical values are
Acceptable terminal servicibility Pt= 2.5 * Servicibility index is between 0-5
Initial servicibility P0= 4.2 * Rigid pavement 4.5, Flexible pavement 4.2
Servicibility loss (ΔPSI)= 1.7Average Daily Traffic (ADT) and year counted= 12140 2010Average Daily Traffic (ADT) and year counted= 16770 2035 1.301
Percent of Truck= 418-kips factor= 0.980
Lane Distribution (%)= 100First year of design service= 2015Last year of design service= 2082 Wf=
Number of Lanes in Each Direction Lane DistributionGrowth Factor (%)= 1 100
2 80 - 1003 60 - 804 50 - 75
ADT= 12950ADT= 30878 21,070,482
Project: Route 33: EB & WB (MP 24.3‐29.0)Design for: Life Provided by Mill 4" and AC Overlay 4" for WB Lanes, MP 26.99‐27.54
Number of future ESAL's Wf= 21,070,482Reliability R= 95 ZR=
R= 50 60 70 80 85 90 91 92 93 94 95 96 97 98 99 100ZR= 0.0 -0.3 -0.5 -0.8 -1.0 -1.3 -1.3 -1.4 -1.5 -1.6 -1.6 -1.8 -1.9 -2.1 -2.3 -3.8
Standard deviation S0= 0.45Future structural number SNf = 6.54 W18=
SNf-SNeff (in)= 0.00Structural Coeffecient of new AC layer Aol= 0.44
E1= 1,260a1= 0.440mill 4
SNeff after milling 4.78Overlay after milling 4.00 Life= years
* Design ESAL is total number of ESAL's for the road multiplied by directional and lane distribution
-1.645Functional Classification Urban Rural
Interstate and other freeways 85-99.9 80-99.9
1.5E-02
Principle arterials 80-99 75-95
Pag
e II-
9
Collectors 80-95 75-95
Overlay thickness (in)= 0.00
20.0
Local 50-80 50-80
* S0=0.40-0.50 for flexible pavement (or overlay) design (I-62&III-82)&S0=0.30-0.40 for AC overlay (III-121)
21,070,482 (Wf-W18)^2=

Existing AC thickness (in)= 10.50Representative structural number SNeff= 7.58
* Elastic modulus of sound PCC is 3 to 8 million psi
Resilient Modulus Mr (psi)= 4809* Typical values are
Acceptable terminal servicibility Pt= 2.5 * Servicibility index is between 0-5
Initial servicibility P0= 4.2 * Rigid pavement 4.5, Flexible pavement 4.2
Servicibility loss (ΔPSI)= 1.7Average Daily Traffic (ADT) and year counted= 12140 2010Average Daily Traffic (ADT) and year counted= 16770 2035 1.301
Percent of Truck= 418-kips factor= 0.805
Lane Distribution (%)= 100First year of design service= 2015Last year of design service= 2025 Wf=
Number of Lanes in Each Direction Lane DistributionGrowth Factor (%)= 1 100
2 80 - 1003 60 - 804 50 - 75
ADT= 12950ADT= 14737 1,626,033
Project: Route 33: EB & WB (MP 24.3‐29.0)Design for: 10‐Year Life, AC Overlay for WB Lanes, MP 27.54‐27.91
Number of future ESAL's Wf= 1,626,033Reliability R= 95 ZR=
R= 50 60 70 80 85 90 91 92 93 94 95 96 97 98 99 100ZR= 0.0 -0.3 -0.5 -0.8 -1.0 -1.3 -1.3 -1.4 -1.5 -1.6 -1.6 -1.8 -1.9 -2.1 -2.3 -3.8
Standard deviation S0= 0.45Future structural number SNf = 4.67 W18=
SNf-SNeff (in)= -2.91Structural Coeffecient of new AC layer Aol= 0.44
E1= 1,500a1= 0.440mill 0
SNeff after milling 7.58Overlay after milling 0.00
* Design ESAL is total number of ESAL's for the road multiplied by directional and lane distribution
-1.645Functional Classification Urban Rural
Interstate and other freeways 85-99.9 80-99.9
Principle arterials 80-99 75-95
Pag
e II-
9
Collectors 80-95 75-95
Overlay thickness (in)= -6.61
Local 50-80 50-80
* S0=0.40-0.50 for flexible pavement (or overlay) design (I-62&III-82)&S0=0.30-0.40 for AC overlay (III-121)
1,626,033 (Wf-W18)^2= 1.1E-02

Existing AC thickness (in)= 10.50Representative structural number SNeff= 7.58
* Elastic modulus of sound PCC is 3 to 8 million psi
Resilient Modulus Mr (psi)= 4809* Typical values are
Acceptable terminal servicibility Pt= 2.5 * Servicibility index is between 0-5
Initial servicibility P0= 4.2 * Rigid pavement 4.5, Flexible pavement 4.2
Servicibility loss (ΔPSI)= 1.7Average Daily Traffic (ADT) and year counted= 12140 2010Average Daily Traffic (ADT) and year counted= 16770 2035 1.301
Percent of Truck= 418-kips factor= 0.805
Lane Distribution (%)= 100First year of design service= 2015Last year of design service= 2143 Wf=
Number of Lanes in Each Direction Lane DistributionGrowth Factor (%)= 1 100
2 80 - 1003 60 - 804 50 - 75
ADT= 12950ADT= 68088 61,120,640
Project: Route 33: EB & WB (MP 24.3‐29.0)Design for: Life Provided by Mill 4" and AC Overlay 4" for WB Lanes, MP 27.54‐27.91
Number of future ESAL's Wf= 61,120,640Reliability R= 95 ZR=
R= 50 60 70 80 85 90 91 92 93 94 95 96 97 98 99 100ZR= 0.0 -0.3 -0.5 -0.8 -1.0 -1.3 -1.3 -1.4 -1.5 -1.6 -1.6 -1.8 -1.9 -2.1 -2.3 -3.8
Standard deviation S0= 0.45Future structural number SNf = 7.58 W18=
SNf-SNeff (in)= 0.00Structural Coeffecient of new AC layer Aol= 0.44
E1= 1,500a1= 0.440mill 4
SNeff after milling 5.82Overlay after milling 4.00 Life= years
* Design ESAL is total number of ESAL's for the road multiplied by directional and lane distribution
-1.645Functional Classification Urban Rural
Interstate and other freeways 85-99.9 80-99.9
2.6E-03
Principle arterials 80-99 75-95
Pag
e II-
9
Collectors 80-95 75-95
Overlay thickness (in)= 0.00
20.0
Local 50-80 50-80
* S0=0.40-0.50 for flexible pavement (or overlay) design (I-62&III-82)&S0=0.30-0.40 for AC overlay (III-121)
61,120,640 (Wf-W18)^2=

Existing AC thickness (in)= 8.50Representative structural number SNeff= 5.10
* Elastic modulus of sound PCC is 3 to 8 million psi
Resilient Modulus Mr (psi)= 4262* Typical values are
Acceptable terminal servicibility Pt= 2.5 * Servicibility index is between 0-5
Initial servicibility P0= 4.2 * Rigid pavement 4.5, Flexible pavement 4.2
Servicibility loss (ΔPSI)= 1.7Average Daily Traffic (ADT) and year counted= 12140 2010Average Daily Traffic (ADT) and year counted= 16770 2035 1.301
Percent of Truck= 418-kips factor= 0.805
Lane Distribution (%)= 100First year of design service= 2015Last year of design service= 2025 Wf=
Number of Lanes in Each Direction Lane DistributionGrowth Factor (%)= 1 100
2 80 - 1003 60 - 804 50 - 75
ADT= 12950ADT= 14737 1,626,033
Project: Route 33: EB & WB (MP 24.3‐29.0)Design for: 10‐Year Life, AC Overlay for WB Lanes, MP 27.91‐28.88
Number of future ESAL's Wf= 1,626,033Reliability R= 95 ZR=
R= 50 60 70 80 85 90 91 92 93 94 95 96 97 98 99 100ZR= 0.0 -0.3 -0.5 -0.8 -1.0 -1.3 -1.3 -1.4 -1.5 -1.6 -1.6 -1.8 -1.9 -2.1 -2.3 -3.8
Standard deviation S0= 0.45Future structural number SNf = 4.87 W18=
SNf-SNeff (in)= -0.23Structural Coeffecient of new AC layer Aol= 0.44
E1= 994a1= 0.440mill 0
SNeff after milling 5.10Overlay after milling 0.00
* Design ESAL is total number of ESAL's for the road multiplied by directional and lane distribution
-1.645Functional Classification Urban Rural
Interstate and other freeways 85-99.9 80-99.9
Principle arterials 80-99 75-95
Pag
e II-
9
Collectors 80-95 75-95
Overlay thickness (in)= -0.53
Local 50-80 50-80
* S0=0.40-0.50 for flexible pavement (or overlay) design (I-62&III-82)&S0=0.30-0.40 for AC overlay (III-121)
1,626,033 (Wf-W18)^2= 1.1E-02

Existing AC thickness (in)= 8.50Representative structural number SNeff= 5.10
* Elastic modulus of sound PCC is 3 to 8 million psi
Resilient Modulus Mr (psi)= 4262* Typical values are
Acceptable terminal servicibility Pt= 2.5 * Servicibility index is between 0-5
Initial servicibility P0= 4.2 * Rigid pavement 4.5, Flexible pavement 4.2
Servicibility loss (ΔPSI)= 1.7Average Daily Traffic (ADT) and year counted= 12140 2010Average Daily Traffic (ADT) and year counted= 16770 2035 1.301
Percent of Truck= 418-kips factor= 0.805
Lane Distribution (%)= 100First year of design service= 2015Last year of design service= 2029 Wf=
Number of Lanes in Each Direction Lane DistributionGrowth Factor (%)= 1 100
2 80 - 1003 60 - 804 50 - 75
ADT= 12950ADT= 15430 2,259,273
Project: Route 33: EB & WB (MP 24.3‐29.0)Design for: Life Provided by Mill 4" and AC Overlay 4" for WB Lanes, MP 27.91‐28.88
Number of future ESAL's Wf= 2,259,273Reliability R= 95 ZR=
R= 50 60 70 80 85 90 91 92 93 94 95 96 97 98 99 100ZR= 0.0 -0.3 -0.5 -0.8 -1.0 -1.3 -1.3 -1.4 -1.5 -1.6 -1.6 -1.8 -1.9 -2.1 -2.3 -3.8
Standard deviation S0= 0.45Future structural number SNf = 5.10 W18=
SNf-SNeff (in)= 0.00Structural Coeffecient of new AC layer Aol= 0.44
E1= 994a1= 0.440mill 4
SNeff after milling 3.34Overlay after milling 4.00 Life= years
* Design ESAL is total number of ESAL's for the road multiplied by directional and lane distribution
-1.645Functional Classification Urban Rural
Interstate and other freeways 85-99.9 80-99.9
6.6E-05
Principle arterials 80-99 75-95
Pag
e II-
9
Collectors 80-95 75-95
Overlay thickness (in)= 0.00
13.6
Local 50-80 50-80
* S0=0.40-0.50 for flexible pavement (or overlay) design (I-62&III-82)&S0=0.30-0.40 for AC overlay (III-121)
2,259,273 (Wf-W18)^2=

Existing AC thickness (in)=Representative structural number SNeff=
* Elastic modulus of sound PCC is 3 to 8 million psi
Resilient Modulus Mr (psi)= 4500* Typical values are
Acceptable terminal servicibility Pt= 2.5 * Servicibility index is between 0-5
Initial servicibility P0= 4.2 * Rigid pavement 4.5, Flexible pavement 4.2
Servicibility loss (ΔPSI)= 1.7Average Daily Traffic (ADT) and year counted= 12140 2010Average Daily Traffic (ADT) and year counted= 16770 2035 1.301
Percent of Truck= 418-kips factor= 0.980
Lane Distribution (%)= 100First year of design service= 2015Last year of design service= 2035 Wf= 4,250,218
Growth Factor (%)=
ADT=
Number of Lanes in Each Direction
ADT= 12950
3 60 - 804 50 - 75
Lane Distribution1 1002 80 - 100
16770
Project: Route 33: EB & WB (MP 24.3‐29.0)Design for: 20‐Year Flexible Pavement Reconstruction/New Construction
Number of future ESAL's Wf= 4,250,218Reliability R= 95 ZR=
R= 50 60 70 80 85 90 91 92 93 94 95 96 97 98 99 100ZR= 0.0 -0.3 -0.5 -0.8 -1.0 -1.3 -1.3 -1.4 -1.5 -1.6 -1.6 -1.8 -1.9 -2.1 -2.3 -3.8
Standard deviation S0= 0.45Future structural number SNf = 5.47 W18=
Layer Coeff. 0.44 0.14 0.08Material AC DGABC SubbaseThickness 10 8 0 5.52
Pag
e II-
9
50-80 50-80
Interstate and other freeways 85-99.9 80-99.9
Principle arterials
-1.645Functional Classification Urban Rural
80-99 75-95
* S0=0.40-0.50 for flexible pavement (or overlay) design (I-62&III-82)&S0=0.30-0.40 for AC overlay (III-121)
4,250,218 (Wf-W18)^2= 1.1E-01
Collectors 80-95 75-95
Local
* Design ESAL is total number of ESAL's for the road multiplied by directional and lane distribution
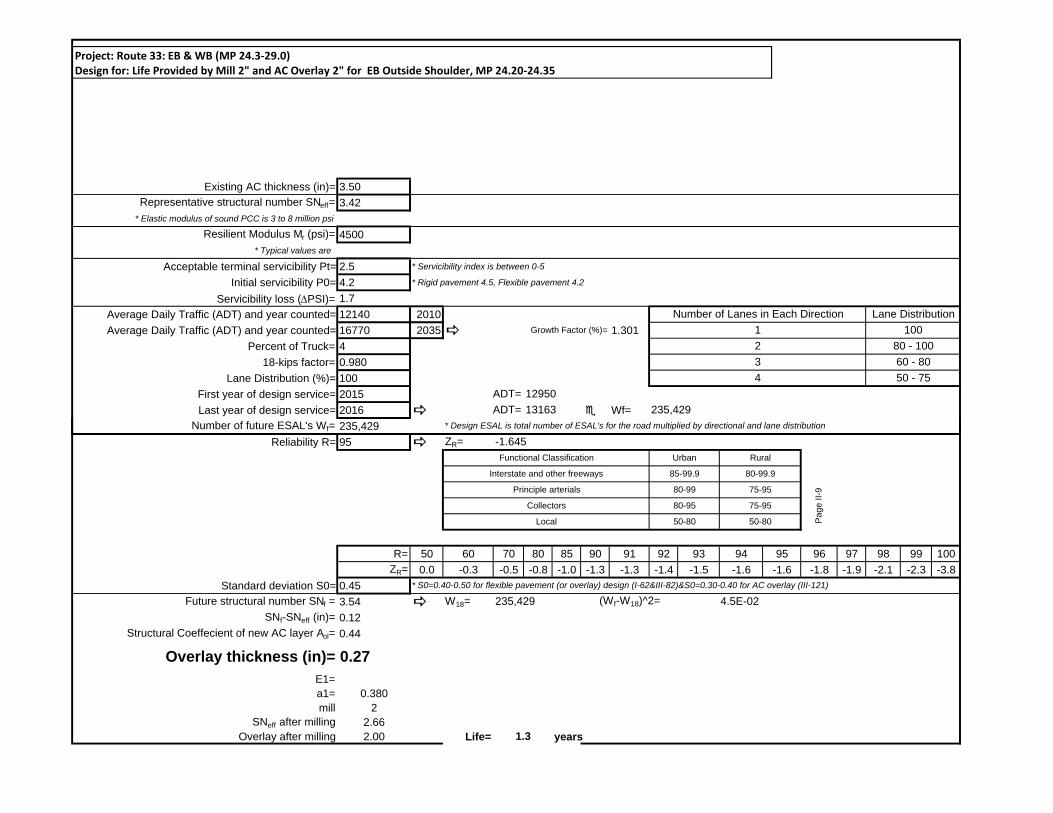
Existing AC thickness (in)= 3.50Representative structural number SNeff= 3.42
* Elastic modulus of sound PCC is 3 to 8 million psi
Resilient Modulus Mr (psi)= 4500* Typical values are
Acceptable terminal servicibility Pt= 2.5 * Servicibility index is between 0-5
Initial servicibility P0= 4.2 * Rigid pavement 4.5, Flexible pavement 4.2
Servicibility loss (ΔPSI)= 1.7Average Daily Traffic (ADT) and year counted= 12140 2010Average Daily Traffic (ADT) and year counted= 16770 2035 1.301
Percent of Truck= 418-kips factor= 0.980
Lane Distribution (%)= 100First year of design service= 2015Last year of design service= 2016 Wf=
Number of Lanes in Each Direction Lane DistributionGrowth Factor (%)= 1 100
2 80 - 1003 60 - 804 50 - 75
ADT= 12950ADT= 13163 235,429
Project: Route 33: EB & WB (MP 24.3‐29.0)Design for: Life Provided by Mill 2" and AC Overlay 2" for EB Outside Shoulder, MP 24.20‐24.35
Number of future ESAL's Wf= 235,429Reliability R= 95 ZR=
R= 50 60 70 80 85 90 91 92 93 94 95 96 97 98 99 100ZR= 0.0 -0.3 -0.5 -0.8 -1.0 -1.3 -1.3 -1.4 -1.5 -1.6 -1.6 -1.8 -1.9 -2.1 -2.3 -3.8
Standard deviation S0= 0.45Future structural number SNf = 3.54 W18=
SNf-SNeff (in)= 0.12Structural Coeffecient of new AC layer Aol= 0.44
E1=a1= 0.380mill 2
SNeff after milling 2.66Overlay after milling 2.00 Life= years
* Design ESAL is total number of ESAL's for the road multiplied by directional and lane distribution
-1.645Functional Classification Urban Rural
Interstate and other freeways 85-99.9 80-99.9
4.5E-02
Principle arterials 80-99 75-95
Pag
e II-
9
Collectors 80-95 75-95
Overlay thickness (in)= 0.27
1.3
Local 50-80 50-80
* S0=0.40-0.50 for flexible pavement (or overlay) design (I-62&III-82)&S0=0.30-0.40 for AC overlay (III-121)
235,429 (Wf-W18)^2=

Existing AC thickness (in)= 3.50Representative structural number SNeff= 3.42
* Elastic modulus of sound PCC is 3 to 8 million psi
Resilient Modulus Mr (psi)= 4500* Typical values are
Acceptable terminal servicibility Pt= 2.5 * Servicibility index is between 0-5
Initial servicibility P0= 4.2 * Rigid pavement 4.5, Flexible pavement 4.2
Servicibility loss (ΔPSI)= 1.7Average Daily Traffic (ADT) and year counted= 12140 2010Average Daily Traffic (ADT) and year counted= 16770 2035 1.301
Percent of Truck= 418-kips factor= 0.980
Lane Distribution (%)= 100First year of design service= 2015Last year of design service= 2016 Wf=
Number of Lanes in Each Direction Lane DistributionGrowth Factor (%)= 1 100
2 80 - 1003 60 - 804 50 - 75
ADT= 12950ADT= 13186 261,021
Project: Route 33: EB & WB (MP 24.3‐29.0)Design for: Life Provided by Mill 3" and AC Overlay 3" for EB Inside Shoulder (Flexible Pavement Portions), MP 24.20‐24.35
Number of future ESAL's Wf= 261,021Reliability R= 95 ZR=
R= 50 60 70 80 85 90 91 92 93 94 95 96 97 98 99 100ZR= 0.0 -0.3 -0.5 -0.8 -1.0 -1.3 -1.3 -1.4 -1.5 -1.6 -1.6 -1.8 -1.9 -2.1 -2.3 -3.8
Standard deviation S0= 0.45Future structural number SNf = 3.60 W18=
SNf-SNeff (in)= 0.18Structural Coeffecient of new AC layer Aol= 0.44
E1=a1= 0.380mill 3
SNeff after milling 2.28Overlay after milling 3.00 Life= years
* Design ESAL is total number of ESAL's for the road multiplied by directional and lane distribution
-1.645Functional Classification Urban Rural
Interstate and other freeways 85-99.9 80-99.9
9.8E-02
Principle arterials 80-99 75-95
Pag
e II-
9
Collectors 80-95 75-95
Overlay thickness (in)= 0.41
1.4
Local 50-80 50-80
* S0=0.40-0.50 for flexible pavement (or overlay) design (I-62&III-82)&S0=0.30-0.40 for AC overlay (III-121)
261,021 (Wf-W18)^2=

Existing AC thickness (in)= 4.50Representative structural number SNeff= 3.89
* Elastic modulus of sound PCC is 3 to 8 million psi
Resilient Modulus Mr (psi)= 4500* Typical values are
Acceptable terminal servicibility Pt= 2.5 * Servicibility index is between 0-5
Initial servicibility P0= 4.2 * Rigid pavement 4.5, Flexible pavement 4.2
Servicibility loss (ΔPSI)= 1.7Average Daily Traffic (ADT) and year counted= 12140 2010Average Daily Traffic (ADT) and year counted= 16770 2035 1.301
Percent of Truck= 418-kips factor= 0.980
Lane Distribution (%)= 100First year of design service= 2015Last year of design service= 2018 Wf=
Number of Lanes in Each Direction Lane DistributionGrowth Factor (%)= 1 100
2 80 - 1003 60 - 804 50 - 75
ADT= 12950ADT= 13384 480,217
Project: Route 33: EB & WB (MP 24.3‐29.0)Design for: Life Provided by Mill 2" and AC Overlay 2" for EB Outside Shoulder, MP 24.35‐25.36
Number of future ESAL's Wf= 480,217Reliability R= 95 ZR=
R= 50 60 70 80 85 90 91 92 93 94 95 96 97 98 99 100ZR= 0.0 -0.3 -0.5 -0.8 -1.0 -1.3 -1.3 -1.4 -1.5 -1.6 -1.6 -1.8 -1.9 -2.1 -2.3 -3.8
Standard deviation S0= 0.45Future structural number SNf = 3.97 W18=
SNf-SNeff (in)= 0.08Structural Coeffecient of new AC layer Aol= 0.44
E1=a1= 0.400mill 2
SNeff after milling 3.09Overlay after milling 2.00 Life= years
* Design ESAL is total number of ESAL's for the road multiplied by directional and lane distribution
-1.645Functional Classification Urban Rural
Interstate and other freeways 85-99.9 80-99.9
2.1E-02
Principle arterials 80-99 75-95
Pag
e II-
9
Collectors 80-95 75-95
Overlay thickness (in)= 0.18
2.6
Local 50-80 50-80
* S0=0.40-0.50 for flexible pavement (or overlay) design (I-62&III-82)&S0=0.30-0.40 for AC overlay (III-121)
480,217 (Wf-W18)^2=

Existing AC thickness (in)= 4.50Representative structural number SNeff= 3.89
* Elastic modulus of sound PCC is 3 to 8 million psi
Resilient Modulus Mr (psi)= 4500* Typical values are
Acceptable terminal servicibility Pt= 2.5 * Servicibility index is between 0-5
Initial servicibility P0= 4.2 * Rigid pavement 4.5, Flexible pavement 4.2
Servicibility loss (ΔPSI)= 1.7Average Daily Traffic (ADT) and year counted= 12140 2010Average Daily Traffic (ADT) and year counted= 16770 2035 1.301
Percent of Truck= 418-kips factor= 0.980
Lane Distribution (%)= 100First year of design service= 2015Last year of design service= 2018 Wf=
Number of Lanes in Each Direction Lane DistributionGrowth Factor (%)= 1 100
2 80 - 1003 60 - 804 50 - 75
ADT= 12950ADT= 13413 511,719
Project: Route 33: EB & WB (MP 24.3‐29.0)Design for: Life Provided by Mill 3" and AC Overlay 3" for EB Inside Shoulder, MP 24.35‐25.36
Number of future ESAL's Wf= 511,719Reliability R= 95 ZR=
R= 50 60 70 80 85 90 91 92 93 94 95 96 97 98 99 100ZR= 0.0 -0.3 -0.5 -0.8 -1.0 -1.3 -1.3 -1.4 -1.5 -1.6 -1.6 -1.8 -1.9 -2.1 -2.3 -3.8
Standard deviation S0= 0.45Future structural number SNf = 4.01 W18=
SNf-SNeff (in)= 0.12Structural Coeffecient of new AC layer Aol= 0.44
E1= 1,237a1= 0.400mill 3
SNeff after milling 2.69Overlay after milling 3.00 Life= years
* Design ESAL is total number of ESAL's for the road multiplied by directional and lane distribution
-1.645Functional Classification Urban Rural
Interstate and other freeways 85-99.9 80-99.9
5.7E-02
Principle arterials 80-99 75-95
Pag
e II-
9
Collectors 80-95 75-95
Overlay thickness (in)= 0.27
2.7
Local 50-80 50-80
* S0=0.40-0.50 for flexible pavement (or overlay) design (I-62&III-82)&S0=0.30-0.40 for AC overlay (III-121)
511,719 (Wf-W18)^2=

Existing AC thickness (in)= 3.50Representative structural number SNeff= 3.49
* Elastic modulus of sound PCC is 3 to 8 million psi
Resilient Modulus Mr (psi)= 4500* Typical values are
Acceptable terminal servicibility Pt= 2.5 * Servicibility index is between 0-5
Initial servicibility P0= 4.2 * Rigid pavement 4.5, Flexible pavement 4.2
Servicibility loss (ΔPSI)= 1.7Average Daily Traffic (ADT) and year counted= 12140 2010Average Daily Traffic (ADT) and year counted= 16770 2035 1.301
Percent of Truck= 418-kips factor= 0.980
Lane Distribution (%)= 100First year of design service= 2015Last year of design service= 2016 Wf=
Number of Lanes in Each Direction Lane DistributionGrowth Factor (%)= 1 100
2 80 - 1003 60 - 804 50 - 75
ADT= 12950ADT= 13174 247,938
Project: Route 33: EB & WB (MP 24.3‐29.0)Design for: Life Provided by Mill 2" and AC Overlay 2" for EB Outside Shoulder, MP 25.36‐25.87
Number of future ESAL's Wf= 247,938Reliability R= 95 ZR=
R= 50 60 70 80 85 90 91 92 93 94 95 96 97 98 99 100ZR= 0.0 -0.3 -0.5 -0.8 -1.0 -1.3 -1.3 -1.4 -1.5 -1.6 -1.6 -1.8 -1.9 -2.1 -2.3 -3.8
Standard deviation S0= 0.45Future structural number SNf = 3.57 W18=
SNf-SNeff (in)= 0.08Structural Coeffecient of new AC layer Aol= 0.44
E1=a1= 0.400mill 2
SNeff after milling 2.69Overlay after milling 2.00 Life= years
* Design ESAL is total number of ESAL's for the road multiplied by directional and lane distribution
-1.645Functional Classification Urban Rural
Interstate and other freeways 85-99.9 80-99.9
1.9E-01
Principle arterials 80-99 75-95
Pag
e II-
9
Collectors 80-95 75-95
Overlay thickness (in)= 0.18
1.3
Local 50-80 50-80
* S0=0.40-0.50 for flexible pavement (or overlay) design (I-62&III-82)&S0=0.30-0.40 for AC overlay (III-121)
247,938 (Wf-W18)^2=

Existing AC thickness (in)= 3.50Representative structural number SNeff= 3.49
* Elastic modulus of sound PCC is 3 to 8 million psi
Resilient Modulus Mr (psi)= 4500* Typical values are
Acceptable terminal servicibility Pt= 2.5 * Servicibility index is between 0-5
Initial servicibility P0= 4.2 * Rigid pavement 4.5, Flexible pavement 4.2
Servicibility loss (ΔPSI)= 1.7Average Daily Traffic (ADT) and year counted= 12140 2010Average Daily Traffic (ADT) and year counted= 16770 2035 1.301
Percent of Truck= 418-kips factor= 0.980
Lane Distribution (%)= 100First year of design service= 2015Last year of design service= 2016 Wf=
Number of Lanes in Each Direction Lane DistributionGrowth Factor (%)= 1 100
2 80 - 1003 60 - 804 50 - 75
ADT= 12950ADT= 13190 265,514
Project: Route 33: EB & WB (MP 24.3‐29.0)Design for: Life Provided by Mill 3" and AC Overlay 3" for EB Inside Shoulder, MP 25.36‐25.87
Number of future ESAL's Wf= 265,514Reliability R= 95 ZR=
R= 50 60 70 80 85 90 91 92 93 94 95 96 97 98 99 100ZR= 0.0 -0.3 -0.5 -0.8 -1.0 -1.3 -1.3 -1.4 -1.5 -1.6 -1.6 -1.8 -1.9 -2.1 -2.3 -3.8
Standard deviation S0= 0.45Future structural number SNf = 3.61 W18=
SNf-SNeff (in)= 0.12Structural Coeffecient of new AC layer Aol= 0.44
E1=a1= 0.400mill 3
SNeff after milling 2.29Overlay after milling 3.00 Life= years
* Design ESAL is total number of ESAL's for the road multiplied by directional and lane distribution
-1.645Functional Classification Urban Rural
Interstate and other freeways 85-99.9 80-99.9
1.9E-01
Principle arterials 80-99 75-95
Pag
e II-
9
Collectors 80-95 75-95
Overlay thickness (in)= 0.27
1.4
Local 50-80 50-80
* S0=0.40-0.50 for flexible pavement (or overlay) design (I-62&III-82)&S0=0.30-0.40 for AC overlay (III-121)
265,514 (Wf-W18)^2=

Existing AC thickness (in)= 3.00Representative structural number SNeff= 3.29
* Elastic modulus of sound PCC is 3 to 8 million psi
Resilient Modulus Mr (psi)= 4500* Typical values are
Acceptable terminal servicibility Pt= 2.5 * Servicibility index is between 0-5
Initial servicibility P0= 4.2 * Rigid pavement 4.5, Flexible pavement 4.2
Servicibility loss (ΔPSI)= 1.7Average Daily Traffic (ADT) and year counted= 12140 2010Average Daily Traffic (ADT) and year counted= 16770 2035 1.301
Percent of Truck= 418-kips factor= 0.980
Lane Distribution (%)= 100First year of design service= 2015Last year of design service= 2016 Wf=
Number of Lanes in Each Direction Lane DistributionGrowth Factor (%)= 1 100
2 80 - 1003 60 - 804 50 - 75
ADT= 12950ADT= 13108 174,347
Project: Route 33: EB & WB (MP 24.3‐29.0)Design for: Life Provided by Mill 2" and AC Overlay 2" for EB Outside Shoulder, MP 25.87‐27.21
Number of future ESAL's Wf= 174,347Reliability R= 95 ZR=
R= 50 60 70 80 85 90 91 92 93 94 95 96 97 98 99 100ZR= 0.0 -0.3 -0.5 -0.8 -1.0 -1.3 -1.3 -1.4 -1.5 -1.6 -1.6 -1.8 -1.9 -2.1 -2.3 -3.8
Standard deviation S0= 0.45Future structural number SNf = 3.37 W18=
SNf-SNeff (in)= 0.08Structural Coeffecient of new AC layer Aol= 0.44
E1=a1= 0.400mill 2
SNeff after milling 2.49Overlay after milling 2.00 Life= years
* Design ESAL is total number of ESAL's for the road multiplied by directional and lane distribution
-1.645Functional Classification Urban Rural
Interstate and other freeways 85-99.9 80-99.9
9.5E-02
Principle arterials 80-99 75-95
Pag
e II-
9
Collectors 80-95 75-95
Overlay thickness (in)= 0.18
0.9
Local 50-80 50-80
* S0=0.40-0.50 for flexible pavement (or overlay) design (I-62&III-82)&S0=0.30-0.40 for AC overlay (III-121)
174,347 (Wf-W18)^2=

Existing AC thickness (in)= 3.00Representative structural number SNeff= 3.29
* Elastic modulus of sound PCC is 3 to 8 million psi
Resilient Modulus Mr (psi)= 4500* Typical values are
Acceptable terminal servicibility Pt= 2.5 * Servicibility index is between 0-5
Initial servicibility P0= 4.2 * Rigid pavement 4.5, Flexible pavement 4.2
Servicibility loss (ΔPSI)= 1.7Average Daily Traffic (ADT) and year counted= 12140 2010Average Daily Traffic (ADT) and year counted= 16770 2035 1.301
Percent of Truck= 418-kips factor= 0.980
Lane Distribution (%)= 100First year of design service= 2015Last year of design service= 2016 Wf=
Number of Lanes in Each Direction Lane DistributionGrowth Factor (%)= 1 100
2 80 - 1003 60 - 804 50 - 75
ADT= 12950ADT= 13120 187,326
Project: Route 33: EB & WB (MP 24.3‐29.0)Design for: Life Provided by Mill 3" and AC Overlay 3" for EB Inside Shoulder, MP 25.87‐27.21
Number of future ESAL's Wf= 187,326Reliability R= 95 ZR=
R= 50 60 70 80 85 90 91 92 93 94 95 96 97 98 99 100ZR= 0.0 -0.3 -0.5 -0.8 -1.0 -1.3 -1.3 -1.4 -1.5 -1.6 -1.6 -1.8 -1.9 -2.1 -2.3 -3.8
Standard deviation S0= 0.45Future structural number SNf = 3.41 W18=
SNf-SNeff (in)= 0.12Structural Coeffecient of new AC layer Aol= 0.44
E1=a1= 0.400mill 3
SNeff after milling 2.09Overlay after milling 3.00 Life= years
* Design ESAL is total number of ESAL's for the road multiplied by directional and lane distribution
-1.645Functional Classification Urban Rural
Interstate and other freeways 85-99.9 80-99.9
9.7E-03
Principle arterials 80-99 75-95
Pag
e II-
9
Collectors 80-95 75-95
Overlay thickness (in)= 0.27
1.0
Local 50-80 50-80
* S0=0.40-0.50 for flexible pavement (or overlay) design (I-62&III-82)&S0=0.30-0.40 for AC overlay (III-121)
187,326 (Wf-W18)^2=

Existing AC thickness (in)= 4.00Representative structural number SNeff= 3.61
* Elastic modulus of sound PCC is 3 to 8 million psi
Resilient Modulus Mr (psi)= 4500* Typical values are
Acceptable terminal servicibility Pt= 2.5 * Servicibility index is between 0-5
Initial servicibility P0= 4.2 * Rigid pavement 4.5, Flexible pavement 4.2
Servicibility loss (ΔPSI)= 1.7Average Daily Traffic (ADT) and year counted= 12140 2010Average Daily Traffic (ADT) and year counted= 16770 2035 1.301
Percent of Truck= 418-kips factor= 0.980
Lane Distribution (%)= 100First year of design service= 2015Last year of design service= 2017 Wf=
Number of Lanes in Each Direction Lane DistributionGrowth Factor (%)= 1 100
2 80 - 1003 60 - 804 50 - 75
ADT= 12950ADT= 13244 324,965
Project: Route 33: EB & WB (MP 24.3‐29.0)Design for: Life Provided by Mill 2" and AC Overlay 2" for EB Outside Shoulder, MP 27.21‐27.54
Number of future ESAL's Wf= 324,965Reliability R= 95 ZR=
R= 50 60 70 80 85 90 91 92 93 94 95 96 97 98 99 100ZR= 0.0 -0.3 -0.5 -0.8 -1.0 -1.3 -1.3 -1.4 -1.5 -1.6 -1.6 -1.8 -1.9 -2.1 -2.3 -3.8
Standard deviation S0= 0.45Future structural number SNf = 3.73 W18=
SNf-SNeff (in)= 0.12Structural Coeffecient of new AC layer Aol= 0.44
E1=a1= 0.380mill 2
SNeff after milling 2.85Overlay after milling 2.00 Life= years
* Design ESAL is total number of ESAL's for the road multiplied by directional and lane distribution
-1.645Functional Classification Urban Rural
Interstate and other freeways 85-99.9 80-99.9
7.4E-02
Principle arterials 80-99 75-95
Pag
e II-
9
Collectors 80-95 75-95
Overlay thickness (in)= 0.27
1.7
Local 50-80 50-80
* S0=0.40-0.50 for flexible pavement (or overlay) design (I-62&III-82)&S0=0.30-0.40 for AC overlay (III-121)
324,965 (Wf-W18)^2=

Existing AC thickness (in)= 4.00Representative structural number SNeff= 3.61
* Elastic modulus of sound PCC is 3 to 8 million psi
Resilient Modulus Mr (psi)= 4500* Typical values are
Acceptable terminal servicibility Pt= 2.5 * Servicibility index is between 0-5
Initial servicibility P0= 4.2 * Rigid pavement 4.5, Flexible pavement 4.2
Servicibility loss (ΔPSI)= 1.7Average Daily Traffic (ADT) and year counted= 12140 2010Average Daily Traffic (ADT) and year counted= 16770 2035 1.301
Percent of Truck= 418-kips factor= 0.980
Lane Distribution (%)= 100First year of design service= 2015Last year of design service= 2017 Wf=
Number of Lanes in Each Direction Lane DistributionGrowth Factor (%)= 1 100
2 80 - 1003 60 - 804 50 - 75
ADT= 12950ADT= 13308 395,863
Project: Route 33: EB & WB (MP 24.3‐29.0)Design for: Life Provided by Mill 4" and AC Overlay 4" for EB Inside Shoulder, MP 27.21‐27.54
Number of future ESAL's Wf= 395,863Reliability R= 95 ZR=
R= 50 60 70 80 85 90 91 92 93 94 95 96 97 98 99 100ZR= 0.0 -0.3 -0.5 -0.8 -1.0 -1.3 -1.3 -1.4 -1.5 -1.6 -1.6 -1.8 -1.9 -2.1 -2.3 -3.8
Standard deviation S0= 0.45Future structural number SNf = 3.85 W18=
SNf-SNeff (in)= 0.24Structural Coeffecient of new AC layer Aol= 0.44
E1=a1= 0.380mill 4
SNeff after milling 2.09Overlay after milling 4.00 Life= years
* Design ESAL is total number of ESAL's for the road multiplied by directional and lane distribution
-1.645Functional Classification Urban Rural
Interstate and other freeways 85-99.9 80-99.9
1.1E-01
Principle arterials 80-99 75-95
Pag
e II-
9
Collectors 80-95 75-95
Overlay thickness (in)= 0.55
2.1
Local 50-80 50-80
* S0=0.40-0.50 for flexible pavement (or overlay) design (I-62&III-82)&S0=0.30-0.40 for AC overlay (III-121)
395,863 (Wf-W18)^2=

Existing AC thickness (in)= 4.00Representative structural number SNeff= 3.61
* Elastic modulus of sound PCC is 3 to 8 million psi
Resilient Modulus Mr (psi)= 4500* Typical values are
Acceptable terminal servicibility Pt= 2.5 * Servicibility index is between 0-5
Initial servicibility P0= 4.2 * Rigid pavement 4.5, Flexible pavement 4.2
Servicibility loss (ΔPSI)= 1.7Average Daily Traffic (ADT) and year counted= 12140 2010Average Daily Traffic (ADT) and year counted= 16770 2035 1.301
Percent of Truck= 418-kips factor= 0.805
Lane Distribution (%)= 100First year of design service= 2015Last year of design service= 2017 Wf=
Number of Lanes in Each Direction Lane DistributionGrowth Factor (%)= 1 100
2 80 - 1003 60 - 804 50 - 75
ADT= 12950ADT= 13308 324,965
Project: Route 33: EB & WB (MP 24.3‐29.0)Design for: Life Provided by Mill 2" and AC Overlay 2" for EB Outside Shoulder, MP 27.54‐27.91
Number of future ESAL's Wf= 324,965Reliability R= 95 ZR=
R= 50 60 70 80 85 90 91 92 93 94 95 96 97 98 99 100ZR= 0.0 -0.3 -0.5 -0.8 -1.0 -1.3 -1.3 -1.4 -1.5 -1.6 -1.6 -1.8 -1.9 -2.1 -2.3 -3.8
Standard deviation S0= 0.45Future structural number SNf = 3.73 W18=
SNf-SNeff (in)= 0.12Structural Coeffecient of new AC layer Aol= 0.44
E1=a1= 0.380mill 2
SNeff after milling 2.85Overlay after milling 2.00 Life= years
* Design ESAL is total number of ESAL's for the road multiplied by directional and lane distribution
-1.645Functional Classification Urban Rural
Interstate and other freeways 85-99.9 80-99.9
7.4E-02
Principle arterials 80-99 75-95
Pag
e II-
9
Collectors 80-95 75-95
Overlay thickness (in)= 0.27
2.1
Local 50-80 50-80
* S0=0.40-0.50 for flexible pavement (or overlay) design (I-62&III-82)&S0=0.30-0.40 for AC overlay (III-121)
324,965 (Wf-W18)^2=

Existing AC thickness (in)= 4.00Representative structural number SNeff= 3.61
* Elastic modulus of sound PCC is 3 to 8 million psi
Resilient Modulus Mr (psi)= 4500* Typical values are
Acceptable terminal servicibility Pt= 2.5 * Servicibility index is between 0-5
Initial servicibility P0= 4.2 * Rigid pavement 4.5, Flexible pavement 4.2
Servicibility loss (ΔPSI)= 1.7Average Daily Traffic (ADT) and year counted= 12140 2010Average Daily Traffic (ADT) and year counted= 16770 2035 1.301
Percent of Truck= 418-kips factor= 0.805
Lane Distribution (%)= 100First year of design service= 2015Last year of design service= 2018 Wf=
Number of Lanes in Each Direction Lane DistributionGrowth Factor (%)= 1 100
2 80 - 1003 60 - 804 50 - 75
ADT= 12950ADT= 13386 395,863
Project: Route 33: EB & WB (MP 24.3‐29.0)Design for: Life Provided by Mill 4" and AC Overlay 4" for EB Inside Shoulder, MP 27.54‐27.91
Number of future ESAL's Wf= 395,863Reliability R= 95 ZR=
R= 50 60 70 80 85 90 91 92 93 94 95 96 97 98 99 100ZR= 0.0 -0.3 -0.5 -0.8 -1.0 -1.3 -1.3 -1.4 -1.5 -1.6 -1.6 -1.8 -1.9 -2.1 -2.3 -3.8
Standard deviation S0= 0.45Future structural number SNf = 3.85 W18=
SNf-SNeff (in)= 0.24Structural Coeffecient of new AC layer Aol= 0.44
E1=a1= 0.380mill 4
SNeff after milling 2.09Overlay after milling 4.00 Life= years
* Design ESAL is total number of ESAL's for the road multiplied by directional and lane distribution
-1.645Functional Classification Urban Rural
Interstate and other freeways 85-99.9 80-99.9
1.1E-01
Principle arterials 80-99 75-95
Pag
e II-
9
Collectors 80-95 75-95
Overlay thickness (in)= 0.55
2.6
Local 50-80 50-80
* S0=0.40-0.50 for flexible pavement (or overlay) design (I-62&III-82)&S0=0.30-0.40 for AC overlay (III-121)
395,863 (Wf-W18)^2=

Existing AC thickness (in)= 4.75Representative structural number SNeff= 3.57
* Elastic modulus of sound PCC is 3 to 8 million psi
Resilient Modulus Mr (psi)= 4500* Typical values are
Acceptable terminal servicibility Pt= 2.5 * Servicibility index is between 0-5
Initial servicibility P0= 4.2 * Rigid pavement 4.5, Flexible pavement 4.2
Servicibility loss (ΔPSI)= 1.7Average Daily Traffic (ADT) and year counted= 12140 2010Average Daily Traffic (ADT) and year counted= 16770 2035 1.301
Percent of Truck= 418-kips factor= 0.805
Lane Distribution (%)= 100First year of design service= 2015Last year of design service= 2017 Wf=
Number of Lanes in Each Direction Lane DistributionGrowth Factor (%)= 1 100
2 80 - 1003 60 - 804 50 - 75
ADT= 12950ADT= 13282 301,427
Project: Route 33: EB & WB (MP 24.3‐29.0)Design for: Life Provided by Mill 2" and AC Overlay 2" for EB Outside Shoulder, MP 27.91‐28.88
Number of future ESAL's Wf= 301,427Reliability R= 95 ZR=
R= 50 60 70 80 85 90 91 92 93 94 95 96 97 98 99 100ZR= 0.0 -0.3 -0.5 -0.8 -1.0 -1.3 -1.3 -1.4 -1.5 -1.6 -1.6 -1.8 -1.9 -2.1 -2.3 -3.8
Standard deviation S0= 0.45Future structural number SNf = 3.69 W18=
SNf-SNeff (in)= 0.12Structural Coeffecient of new AC layer Aol= 0.44
E1=a1= 0.380mill 2
SNeff after milling 2.81Overlay after milling 2.00 Life= years
* Design ESAL is total number of ESAL's for the road multiplied by directional and lane distribution
-1.645Functional Classification Urban Rural
Interstate and other freeways 85-99.9 80-99.9
1.3E-01
Principle arterials 80-99 75-95
Pag
e II-
9
Collectors 80-95 75-95
Overlay thickness (in)= 0.27
2.0
Local 50-80 50-80
* S0=0.40-0.50 for flexible pavement (or overlay) design (I-62&III-82)&S0=0.30-0.40 for AC overlay (III-121)
301,427 (Wf-W18)^2=

Existing AC thickness (in)= 4.75Representative structural number SNeff= 3.57
* Elastic modulus of sound PCC is 3 to 8 million psi
Resilient Modulus Mr (psi)= 4500* Typical values are
Acceptable terminal servicibility Pt= 2.5 * Servicibility index is between 0-5
Initial servicibility P0= 4.2 * Rigid pavement 4.5, Flexible pavement 4.2
Servicibility loss (ΔPSI)= 1.7Average Daily Traffic (ADT) and year counted= 12140 2010Average Daily Traffic (ADT) and year counted= 16770 2035 1.301
Percent of Truck= 418-kips factor= 0.805
Lane Distribution (%)= 100First year of design service= 2015Last year of design service= 2017 Wf=
Number of Lanes in Each Direction Lane DistributionGrowth Factor (%)= 1 100
2 80 - 1003 60 - 804 50 - 75
ADT= 12950ADT= 13355 367,814
Project: Route 33: EB & WB (MP 24.3‐29.0)Design for: Life Provided by Mill 4" and AC Overlay 4" for EB Inside Shoulder, MP 27.91‐28.88
Number of future ESAL's Wf= 367,814Reliability R= 95 ZR=
R= 50 60 70 80 85 90 91 92 93 94 95 96 97 98 99 100ZR= 0.0 -0.3 -0.5 -0.8 -1.0 -1.3 -1.3 -1.4 -1.5 -1.6 -1.6 -1.8 -1.9 -2.1 -2.3 -3.8
Standard deviation S0= 0.45Future structural number SNf = 3.81 W18=
SNf-SNeff (in)= 0.24Structural Coeffecient of new AC layer Aol= 0.44
E1=a1= 0.380mill 4
SNeff after milling 2.05Overlay after milling 4.00 Life= years
* Design ESAL is total number of ESAL's for the road multiplied by directional and lane distribution
-1.645Functional Classification Urban Rural
Interstate and other freeways 85-99.9 80-99.9
3.6E-02
Principle arterials 80-99 75-95
Pag
e II-
9
Collectors 80-95 75-95
Overlay thickness (in)= 0.55
2.4
Local 50-80 50-80
* S0=0.40-0.50 for flexible pavement (or overlay) design (I-62&III-82)&S0=0.30-0.40 for AC overlay (III-121)
367,814 (Wf-W18)^2=

Existing AC thickness (in)= 4.00Representative structural number SNeff= 3.69
* Elastic modulus of sound PCC is 3 to 8 million psi
Resilient Modulus Mr (psi)= 4500* Typical values are
Acceptable terminal servicibility Pt= 2.5 * Servicibility index is between 0-5
Initial servicibility P0= 4.2 * Rigid pavement 4.5, Flexible pavement 4.2
Servicibility loss (ΔPSI)= 1.7Average Daily Traffic (ADT) and year counted= 12140 2010Average Daily Traffic (ADT) and year counted= 16770 2035 1.301
Percent of Truck= 418-kips factor= 0.980
Lane Distribution (%)= 100First year of design service= 2015Last year of design service= 2017 Wf=
Number of Lanes in Each Direction Lane DistributionGrowth Factor (%)= 1 100
2 80 - 1003 60 - 804 50 - 75
ADT= 12950ADT= 13264 347,233
Project: Route 33: EB & WB (MP 24.3‐29.0)Design for: Life Provided by Mill 2" and AC Overlay 2" for WB Outside Shoulder, MP 24.31‐24.94
Number of future ESAL's Wf= 347,233Reliability R= 95 ZR=
R= 50 60 70 80 85 90 91 92 93 94 95 96 97 98 99 100ZR= 0.0 -0.3 -0.5 -0.8 -1.0 -1.3 -1.3 -1.4 -1.5 -1.6 -1.6 -1.8 -1.9 -2.1 -2.3 -3.8
Standard deviation S0= 0.45Future structural number SNf = 3.77 W18=
SNf-SNeff (in)= 0.08Structural Coeffecient of new AC layer Aol= 0.44
E1=a1= 0.400mill 2
SNeff after milling 2.89Overlay after milling 2.00 Life= years
* Design ESAL is total number of ESAL's for the road multiplied by directional and lane distribution
-1.645Functional Classification Urban Rural
Interstate and other freeways 85-99.9 80-99.9
2.6E-02
Principle arterials 80-99 75-95
Pag
e II-
9
Collectors 80-95 75-95
Overlay thickness (in)= 0.18
1.9
Local 50-80 50-80
* S0=0.40-0.50 for flexible pavement (or overlay) design (I-62&III-82)&S0=0.30-0.40 for AC overlay (III-121)
347,233 (Wf-W18)^2=

Existing AC thickness (in)= 4.00Representative structural number SNeff= 3.69
* Elastic modulus of sound PCC is 3 to 8 million psi
Resilient Modulus Mr (psi)= 4500* Typical values are
Acceptable terminal servicibility Pt= 2.5 * Servicibility index is between 0-5
Initial servicibility P0= 4.2 * Rigid pavement 4.5, Flexible pavement 4.2
Servicibility loss (ΔPSI)= 1.7Average Daily Traffic (ADT) and year counted= 12140 2010Average Daily Traffic (ADT) and year counted= 16770 2035 1.301
Percent of Truck= 418-kips factor= 0.980
Lane Distribution (%)= 100First year of design service= 2015Last year of design service= 2017 Wf=
Number of Lanes in Each Direction Lane DistributionGrowth Factor (%)= 1 100
2 80 - 1003 60 - 804 50 - 75
ADT= 12950ADT= 13308 395,863
Project: Route 33: EB & WB (MP 24.3‐29.0)Design for: Life Provided by Mill 4" and AC Overlay 4" for WB Inside Shoulder, MP 24.31‐24.94
Number of future ESAL's Wf= 395,863Reliability R= 95 ZR=
R= 50 60 70 80 85 90 91 92 93 94 95 96 97 98 99 100ZR= 0.0 -0.3 -0.5 -0.8 -1.0 -1.3 -1.3 -1.4 -1.5 -1.6 -1.6 -1.8 -1.9 -2.1 -2.3 -3.8
Standard deviation S0= 0.45Future structural number SNf = 3.85 W18=
SNf-SNeff (in)= 0.16Structural Coeffecient of new AC layer Aol= 0.44
E1=a1= 0.400mill 4
SNeff after milling 2.09Overlay after milling 4.00 Life= years
* Design ESAL is total number of ESAL's for the road multiplied by directional and lane distribution
-1.645Functional Classification Urban Rural
Interstate and other freeways 85-99.9 80-99.9
1.1E-01
Principle arterials 80-99 75-95
Pag
e II-
9
Collectors 80-95 75-95
Overlay thickness (in)= 0.36
2.1
Local 50-80 50-80
* S0=0.40-0.50 for flexible pavement (or overlay) design (I-62&III-82)&S0=0.30-0.40 for AC overlay (III-121)
395,863 (Wf-W18)^2=

Existing AC thickness (in)= 4.00Representative structural number SNeff= 3.61
* Elastic modulus of sound PCC is 3 to 8 million psi
Resilient Modulus Mr (psi)= 4500* Typical values are
Acceptable terminal servicibility Pt= 2.5 * Servicibility index is between 0-5
Initial servicibility P0= 4.2 * Rigid pavement 4.5, Flexible pavement 4.2
Servicibility loss (ΔPSI)= 1.7Average Daily Traffic (ADT) and year counted= 12140 2010Average Daily Traffic (ADT) and year counted= 16770 2035 1.301
Percent of Truck= 418-kips factor= 0.980
Lane Distribution (%)= 100First year of design service= 2015Last year of design service= 2017 Wf=
Number of Lanes in Each Direction Lane DistributionGrowth Factor (%)= 1 100
2 80 - 1003 60 - 804 50 - 75
ADT= 12950ADT= 13244 324,965
Project: Route 33: EB & WB (MP 24.3‐29.0)Design for: Life Provided by Mill 2" and AC Overlay 2" for WB Outside Shoulder, MP 24.94‐26.79
Number of future ESAL's Wf= 324,965Reliability R= 95 ZR=
R= 50 60 70 80 85 90 91 92 93 94 95 96 97 98 99 100ZR= 0.0 -0.3 -0.5 -0.8 -1.0 -1.3 -1.3 -1.4 -1.5 -1.6 -1.6 -1.8 -1.9 -2.1 -2.3 -3.8
Standard deviation S0= 0.45Future structural number SNf = 3.73 W18=
SNf-SNeff (in)= 0.12Structural Coeffecient of new AC layer Aol= 0.44
E1=a1= 0.380mill 2
SNeff after milling 2.85Overlay after milling 2.00 Life= years
* Design ESAL is total number of ESAL's for the road multiplied by directional and lane distribution
-1.645Functional Classification Urban Rural
Interstate and other freeways 85-99.9 80-99.9
7.4E-02
Principle arterials 80-99 75-95
Pag
e II-
9
Collectors 80-95 75-95
Overlay thickness (in)= 0.27
1.7
Local 50-80 50-80
* S0=0.40-0.50 for flexible pavement (or overlay) design (I-62&III-82)&S0=0.30-0.40 for AC overlay (III-121)
324,965 (Wf-W18)^2=

Existing AC thickness (in)= 4.00Representative structural number SNeff= 3.61
* Elastic modulus of sound PCC is 3 to 8 million psi
Resilient Modulus Mr (psi)= 4500* Typical values are
Acceptable terminal servicibility Pt= 2.5 * Servicibility index is between 0-5
Initial servicibility P0= 4.2 * Rigid pavement 4.5, Flexible pavement 4.2
Servicibility loss (ΔPSI)= 1.7Average Daily Traffic (ADT) and year counted= 12140 2010Average Daily Traffic (ADT) and year counted= 16770 2035 1.301
Percent of Truck= 418-kips factor= 0.980
Lane Distribution (%)= 100First year of design service= 2015Last year of design service= 2017 Wf=
Number of Lanes in Each Direction Lane DistributionGrowth Factor (%)= 1 100
2 80 - 1003 60 - 804 50 - 75
ADT= 12950ADT= 13308 395,863
Project: Route 33: EB & WB (MP 24.3‐29.0)Design for: Life Provided by Mill 4" and AC Overlay 4" for WB Inside Shoulder, MP 24.94‐26.79
Number of future ESAL's Wf= 395,863Reliability R= 95 ZR=
R= 50 60 70 80 85 90 91 92 93 94 95 96 97 98 99 100ZR= 0.0 -0.3 -0.5 -0.8 -1.0 -1.3 -1.3 -1.4 -1.5 -1.6 -1.6 -1.8 -1.9 -2.1 -2.3 -3.8
Standard deviation S0= 0.45Future structural number SNf = 3.85 W18=
SNf-SNeff (in)= 0.24Structural Coeffecient of new AC layer Aol= 0.44
E1=a1= 0.380mill 4
SNeff after milling 2.09Overlay after milling 4.00 Life= years
* Design ESAL is total number of ESAL's for the road multiplied by directional and lane distribution
-1.645Functional Classification Urban Rural
Interstate and other freeways 85-99.9 80-99.9
1.1E-01
Principle arterials 80-99 75-95
Pag
e II-
9
Collectors 80-95 75-95
Overlay thickness (in)= 0.55
2.1
Local 50-80 50-80
* S0=0.40-0.50 for flexible pavement (or overlay) design (I-62&III-82)&S0=0.30-0.40 for AC overlay (III-121)
395,863 (Wf-W18)^2=

Existing AC thickness (in)= 5.00Representative structural number SNeff= 3.99
* Elastic modulus of sound PCC is 3 to 8 million psi
Resilient Modulus Mr (psi)= 4500* Typical values are
Acceptable terminal servicibility Pt= 2.5 * Servicibility index is between 0-5
Initial servicibility P0= 4.2 * Rigid pavement 4.5, Flexible pavement 4.2
Servicibility loss (ΔPSI)= 1.7Average Daily Traffic (ADT) and year counted= 12140 2010Average Daily Traffic (ADT) and year counted= 16770 2035 1.301
Percent of Truck= 418-kips factor= 0.980
Lane Distribution (%)= 100First year of design service= 2015Last year of design service= 2018 Wf=
Number of Lanes in Each Direction Lane DistributionGrowth Factor (%)= 1 100
2 80 - 1003 60 - 804 50 - 75
ADT= 12950ADT= 13491 598,780
Project: Route 33: EB & WB (MP 24.3‐29.0)Design for: Life Provided by Mill 2" and AC Overlay 2" for WB Outside Shoulder, MP 26.79‐27.43
Number of future ESAL's Wf= 598,780Reliability R= 95 ZR=
R= 50 60 70 80 85 90 91 92 93 94 95 96 97 98 99 100ZR= 0.0 -0.3 -0.5 -0.8 -1.0 -1.3 -1.3 -1.4 -1.5 -1.6 -1.6 -1.8 -1.9 -2.1 -2.3 -3.8
Standard deviation S0= 0.45Future structural number SNf = 4.11 W18=
SNf-SNeff (in)= 0.12Structural Coeffecient of new AC layer Aol= 0.44
E1=a1= 0.380mill 2
SNeff after milling 3.23Overlay after milling 2.00 Life= years
* Design ESAL is total number of ESAL's for the road multiplied by directional and lane distribution
-1.645Functional Classification Urban Rural
Interstate and other freeways 85-99.9 80-99.9
8.7E-02
Principle arterials 80-99 75-95
Pag
e II-
9
Collectors 80-95 75-95
Overlay thickness (in)= 0.27
3.2
Local 50-80 50-80
* S0=0.40-0.50 for flexible pavement (or overlay) design (I-62&III-82)&S0=0.30-0.40 for AC overlay (III-121)
598,780 (Wf-W18)^2=

Existing AC thickness (in)= 5.00Representative structural number SNeff= 3.99
* Elastic modulus of sound PCC is 3 to 8 million psi
Resilient Modulus Mr (psi)= 4500* Typical values are
Acceptable terminal servicibility Pt= 2.5 * Servicibility index is between 0-5
Initial servicibility P0= 4.2 * Rigid pavement 4.5, Flexible pavement 4.2
Servicibility loss (ΔPSI)= 1.7Average Daily Traffic (ADT) and year counted= 12140 2010Average Daily Traffic (ADT) and year counted= 16770 2035 1.301
Percent of Truck= 418-kips factor= 0.980
Lane Distribution (%)= 100First year of design service= 2015Last year of design service= 2019 Wf=
Number of Lanes in Each Direction Lane DistributionGrowth Factor (%)= 1 100
2 80 - 1003 60 - 804 50 - 75
ADT= 12950ADT= 13602 720,829
Project: Route 33: EB & WB (MP 24.3‐29.0)Design for: Life Provided by Mill 4" and AC Overlay 4" for WB Inside Shoulder, MP 26.79‐27.43
Number of future ESAL's Wf= 720,829Reliability R= 95 ZR=
R= 50 60 70 80 85 90 91 92 93 94 95 96 97 98 99 100ZR= 0.0 -0.3 -0.5 -0.8 -1.0 -1.3 -1.3 -1.4 -1.5 -1.6 -1.6 -1.8 -1.9 -2.1 -2.3 -3.8
Standard deviation S0= 0.45Future structural number SNf = 4.23 W18=
SNf-SNeff (in)= 0.24Structural Coeffecient of new AC layer Aol= 0.44
E1=a1= 0.380mill 4
SNeff after milling 2.47Overlay after milling 4.00 Life= years
* Design ESAL is total number of ESAL's for the road multiplied by directional and lane distribution
-1.645Functional Classification Urban Rural
Interstate and other freeways 85-99.9 80-99.9
5.4E-02
Principle arterials 80-99 75-95
Pag
e II-
9
Collectors 80-95 75-95
Overlay thickness (in)= 0.55
3.8
Local 50-80 50-80
* S0=0.40-0.50 for flexible pavement (or overlay) design (I-62&III-82)&S0=0.30-0.40 for AC overlay (III-121)
720,829 (Wf-W18)^2=

Existing AC thickness (in)= 4.00Representative structural number SNeff= 3.28
* Elastic modulus of sound PCC is 3 to 8 million psi
Resilient Modulus Mr (psi)= 4500* Typical values are
Acceptable terminal servicibility Pt= 2.5 * Servicibility index is between 0-5
Initial servicibility P0= 4.2 * Rigid pavement 4.5, Flexible pavement 4.2
Servicibility loss (ΔPSI)= 1.7Average Daily Traffic (ADT) and year counted= 12140 2010Average Daily Traffic (ADT) and year counted= 16770 2035 1.301
Percent of Truck= 418-kips factor= 0.805
Lane Distribution (%)= 100First year of design service= 2015Last year of design service= 2016 Wf=
Number of Lanes in Each Direction Lane DistributionGrowth Factor (%)= 1 100
2 80 - 1003 60 - 804 50 - 75
ADT= 12950ADT= 13153 184,006
Project: Route 33: EB & WB (MP 24.3‐29.0)Design for: Life Provided by Mill 2" and AC Overlay 2" for WB Outside Shoulder, MP 27.43‐28.88
Number of future ESAL's Wf= 184,006Reliability R= 95 ZR=
R= 50 60 70 80 85 90 91 92 93 94 95 96 97 98 99 100ZR= 0.0 -0.3 -0.5 -0.8 -1.0 -1.3 -1.3 -1.4 -1.5 -1.6 -1.6 -1.8 -1.9 -2.1 -2.3 -3.8
Standard deviation S0= 0.45Future structural number SNf = 3.40 W18=
SNf-SNeff (in)= 0.12Structural Coeffecient of new AC layer Aol= 0.44
E1=a1= 0.380mill 2
SNeff after milling 2.52Overlay after milling 2.00 Life= years
* Design ESAL is total number of ESAL's for the road multiplied by directional and lane distribution
-1.645Functional Classification Urban Rural
Interstate and other freeways 85-99.9 80-99.9
3.3E-03
Principle arterials 80-99 75-95
Pag
e II-
9
Collectors 80-95 75-95
Overlay thickness (in)= 0.27
1.2
Local 50-80 50-80
* S0=0.40-0.50 for flexible pavement (or overlay) design (I-62&III-82)&S0=0.30-0.40 for AC overlay (III-121)
184,006 (Wf-W18)^2=

Existing AC thickness (in)= 4.00Representative structural number SNeff= 3.28
* Elastic modulus of sound PCC is 3 to 8 million psi
Resilient Modulus Mr (psi)= 4500* Typical values are
Acceptable terminal servicibility Pt= 2.5 * Servicibility index is between 0-5
Initial servicibility P0= 4.2 * Rigid pavement 4.5, Flexible pavement 4.2
Servicibility loss (ΔPSI)= 1.7Average Daily Traffic (ADT) and year counted= 12140 2010Average Daily Traffic (ADT) and year counted= 16770 2035 1.301
Percent of Truck= 418-kips factor= 0.805
Lane Distribution (%)= 100First year of design service= 2015Last year of design service= 2016 Wf=
Number of Lanes in Each Direction Lane DistributionGrowth Factor (%)= 1 100
2 80 - 1003 60 - 804 50 - 75
ADT= 12950ADT= 13201 227,398
Project: Route 33: EB & WB (MP 24.3‐29.0)Design for: Life Provided by Mill 4" and AC Overlay 4" for WB Inside Shoulder, MP 27.43‐28.88
Number of future ESAL's Wf= 227,398Reliability R= 95 ZR=
R= 50 60 70 80 85 90 91 92 93 94 95 96 97 98 99 100ZR= 0.0 -0.3 -0.5 -0.8 -1.0 -1.3 -1.3 -1.4 -1.5 -1.6 -1.6 -1.8 -1.9 -2.1 -2.3 -3.8
Standard deviation S0= 0.45Future structural number SNf = 3.52 W18=
SNf-SNeff (in)= 0.24Structural Coeffecient of new AC layer Aol= 0.44
E1=a1= 0.380mill 4
SNeff after milling 1.76Overlay after milling 4.00 Life= years
* Design ESAL is total number of ESAL's for the road multiplied by directional and lane distribution
-1.645Functional Classification Urban Rural
Interstate and other freeways 85-99.9 80-99.9
1.2E-01
Principle arterials 80-99 75-95
Pag
e II-
9
Collectors 80-95 75-95
Overlay thickness (in)= 0.55
1.5
Local 50-80 50-80
* S0=0.40-0.50 for flexible pavement (or overlay) design (I-62&III-82)&S0=0.30-0.40 for AC overlay (III-121)
227,398 (Wf-W18)^2=