pavement design guide - mechanical engineering |ccfu/ence466/2002mdshadesignguide.pdf · pavement...
TRANSCRIPT

Pavement Design GuideNovember 2002
Prepared by the Pavement Division, Office of Materials and Technology.

Updated 11/1/2002
ForwardThere are many different approaches that are used in the pavement industry to developthe pavement design for new roadways and the rehabilitation of existing roadways. Inthe same manner, there are numerous approaches to evaluating the existing condition ofa pavement and project site characteristics. The majority of these existing approachesare based on experience of the individuals responsible for either developing pavementdesign recommendations or construction of the project. There are very limiteddocumented sources of information for evaluation procedures for pavements and designof pavements. Those documented sources of information are typically not written in aprocedural manner and expect the reader to process an experienced level of knowledgeabout pavement and material engineering. All of these cases have led to a lack ofconsistency between pavement designers in evaluations, designs, pavementrehabilitation techniques, etc. In addition, all this leads to indecision and confusion fornew or inexperienced engineers responsible with developing pavement designs.
Therefore, this guide was written for Maryland State Highway Administration (MDSHA)pavement engineers in order to eliminate the problems discussed previously. This guidewill provide MDSHA pavement engineers with a procedural process to complete both theevaluation of the pavement condition and the any pavement design requirements. Thepolicies and procedures included in the guide are written to achieve the Business plangoals of MDSHA.
The individuals listed below provided the development, writing, and review of thisdocument. Any questions or comments concerning this guide should be directed to theindividuals below.
Tim Smith, P.E.Acting Pavement Division ChiefMDSHA – OMT2323 W. Joppa RoadBrooklandville, MD 21022Phone – 410 – 321 – 3110Fax – 410 – 321 - 3099Email – [email protected]
Pete Stephanos, P.E.Director, Office of Materials & TechnologyMDSHA – OMT2323 W. Joppa RoadBrooklandville, MD 21022Phone – 410 – 321 – 3100Fax – 410 – 321 - 3099Email – [email protected]

Updated 11/1/2002
I Introduction and Background.......................................................................... I-1II MDSHA Pavement Design Overview.............................................................. II-1III Pavement Design Procedures ....................................................................... III-1
III.A Preliminary Pavement Recommendation .................................................................................... III-1III.B Visual Pavement Survey ............................................................................................................. III-5III.C Pavement Structure and Soil Property Determination............................................................... III-12III.D Patching Survey ........................................................................................................................ III-15III.E Traffic Analysis.......................................................................................................................... III-19III.F Pavement Rehabilitation Design ............................................................................................... III-26III.G New Pavement Design.............................................................................................................. III-50III.H Life Cycle Cost Analysis (LCCA)............................................................................................... III-68III.I FWD Testing ............................................................................................................................. III-69III.J FWD Data Analysis ................................................................................................................... III-84III.K Preliminary Engineering Cost Estimate ................................................................................... III-107III.L Shoulder Design...................................................................................................................... III-112III.M Final Review............................................................................................................................ III-115III.N Verification of Classification Data............................................................................................ III-122III.O Pavement Marking Eradication ............................................................................................... III-126
IV Forms .............................................................................................................. IV-1V Unit Cost ..........................................................................................................V-1VI Pavement Design Policies .............................................................................VI-1
VI.A Design Input Policies...................................................................................................................VI-2VI.B Material Selection Policies ........................................................................................................VI-14VI.C Lay-Down Operations................................................................................................................VI-19VI.D Ride Quality Policies .................................................................................................................VI-20
VII Pavement Design Standards ........................................................................VII-1VII.A Roundabout................................................................................................................................VII-2VII.B Park and Ride ............................................................................................................................VII-4VII.C Narrow Base Widening with Curb (Less than 4 feet)..................................................................VII-5VII.D Composite Patch (HMA over PCC) ............................................................................................VII-6VII.E Driveways & Bike Paths .............................................................................................................VII-7
VIII Pavement Rehabilitation Techniques .........................................................VIII-1VIII.A Pavement Rehabilitation Methods.............................................................................................VIII-2VIII.B Pre-Overlay Repair Guidelines..................................................................................................VIII-6
IX Construction and Material Specifications .................................................... IX-1X Material Library................................................................................................X-1
X.A Material Description .....................................................................................................................X-1X.B Material Properties .......................................................................................................................X-4X.C Design Properties.......................................................................................................................X-11

Introduction and Background
Updated 8/1/2001 I-1
I INTRODUCTION AND BACKGROUNDThis Maryland State Highway Administration (MDSHA) Pavement Design Guideprovides a comprehensive set of procedures and policies to assist the pavement designengineer in developing recommendations for new construction and pavementrehabilitation projects. The audience this pavement design guide was written for shouldhave a basic background and general understanding of pavement engineering. Thepurpose of this document is to provide Maryland State Highway pavement designers aguideline to developing pavement recommendations that are consistent and accurateacross all pavement engineers. The goal of this document is to supply pavementengineers the guidance to have the ability to provide pavement recommendations thatare based on the most effective engineering design considering cost to MDSHA,practicality of construction, and benefit in terms of service life provided to the MDSHApavement network.
MDSHA is currently responsible for approximately 16,362 lane miles of roadway.Currently, approximately 60% of the pavement network are comprised of flexiblepavements, 36% are composite pavements, and less than 5% are rigid pavements.
A large portion of the pavement roadway network of MDSHA has a significant trafficvolume. The environmental and geological regions of Maryland lend themselves to awide range of agricultural and industrial commerce. Maryland has three distinct regionsthat have different traffic and geology/soil conditions. The eastern shore portion ofMaryland is dominated with agricultural based commerce and traffic. The soil conditionson the eastern shore are dominated by sandy soils. The central portion of Maryland isstrongly metropolitan in business with a high percentage of industrial type trafficmotivated by the water ports. This central portion of Maryland is a peidmont areadominated by silty clays, clays, and micateous silts. The western portion of Maryland isdominated by logging, extractive industries (coal, stone, etc.), and agriculture basedcommerce as well as several major trucking routes that highly influence the traffic mix.The western portion of Maryland is characterized by rocky and silty soils. AlthoughMaryland is a small state, there is a wide range of existing soil and geological conditions,as well as unique traffic volume and weight trends that the MDSHA pavement design
60%
36%
4%
Flexible Composite Rigid

Introduction and Background
Updated 8/1/2001 I-2
engineer needs to possess knowledge of in order to make accurate pavementrecommendations.
MDSHA is currently structured into two separate functions for the purpose of completingand maintaining construction projects, Planning/Design and Operations. The MDSHAAdministrator is responsible for overseeing and directing both functions to ensure thatMDSHA goals are achieved. Each function is completed by the efforts of several offices.There are separate divisions under each office that complete more specific tasks relatedto the completion of construction projects. The Pavement Division of MDSHA falls underthe Office of Materials and Technology (OMT). The OMT is responsible for the designand quality of all materials placed in MDSHA projects. The Pavement Division isresponsible for the design of all pavement structures in MDSHA projects. In addition,the Pavement Division is responsible for the data processing and analysis off all thenetwork level data collection for MDSHA roadways and its pavement managementsystem (PMS). Below is a general schematic of the MDSHA structure describedpreviously.
30%
33%
28%
9%
< 5000 ADT 5000 - 20000 ADT
20000-50000 ADT >50000 ADT

Introduction and Background
Updated 8/1/2001 I-3
Other State agencies, the Federal government, Counties, Cities, and other localmunicipalities are responsible for the remaining roadways in Maryland. Frequently inthese cases, these other agencies seek the assistance Pavement Division with regard topavement recommendations. Therefore, in addition to the workload of MDSHAconstruction projects, the pavement engineers in the Pavement Division are often askedto assist and review other agencies pavement construction projects. Based on the workcompleted over the last several years and the existing transportation budget, thePavement Division is responsible for approximately 200 to 250 pavement designrecommendations a year, from MDSHA projects alone. The graph below shows acurrent breakdown of those MDSHA projects:
AdministratorAdministrator
Planning/EngineeringPlanning/Engineering
Highway DevelopmentHighway Development
Bridge DevelopmentBridge Development
Environmental DesignEnvironmental Design
ConstructionConstruction
TrafficTraffic
DistrictsDistricts
MaintenanceMaintenance
MaterialsMaterials PavementPavement DesignDesign
ManagementManagement
OperationsOperations
13%
23%
21%
43%
New/Large WideningStreetscape System Preservation

Introduction and Background
Updated 8/1/2001 I-4
Particular sections of interest in the MDSHA Pavement Design Guide are Section III“Pavement Design Procedures”, Section VI “ Pavement Design Policies”, and Section X“Material Library.” These sections provide a procedural guide for developing pavementrehabilitation recommendations as well as a standard Maryland State Highway forpavement design inputs and policies.

MDSHA Pavement Design Overview
Updated 8/1/2001 II-1
II MDSHA PAVEMENT DESIGN OVERVIEWThe Pavement Division currently utilizes the 1993 “AASHTO Guide for Design ofPavement Structures“ and its subsequent revisions as the framework for its pavementdesign procedure. The AASHTO guide documents an empirical procedure based ontesting and data collection from the AASHO road test in the late 1950’s and fromsubsequent refinements and revisions. The MDSHA Pavement Design Guide utilizes amajority of the AASHTO Guide for design analysis and has made modifications to thatprocedure based on local knowledge, available pavement data, material knowledge,past experiences, and knowledge and resource base of pavement engineers.
In the simplest of terms, the goal of the MDSHA pavement engineer is to assess thestructural and functional needs of a roadway and develop pavement sections that willmeet a desired service life at a specified minimum ride quality and structural capacity.This concept is presented in the following figure:
The individual design tasks required to achieve this goal are more involved than thefigure above can demonstrate. In order to determine the structural and functional needsof a roadway, specific pavement engineering design tasks need to be accomplished aspresented in the following diagram:
New DesignNew Design
Determine StructuralCapacity Needs
Determine StructuralCapacity Needs
Material SelectionMaterial Selection
Data CollectionData Collection
Data AnalysisData Analysis
Rehabilitation TechniqueSelection
Develop RehabilitationTechniques
Material DesignMaterial Design
Selection ofRehabilitation Strategy
Selection ofRehabilitation Strategy

MDSHA Pavement Design Overview
Updated 8/1/2001 II-2
The data collection effort involves the gathering of historical information of the roadwayas well as existing pavement and subgrade conditions. The data collection effortsinclude the following tasks: records review, site inspections, visual condition survey,functional condition data collection, and structural condition data collection. The dataanalysis efforts involve assessing the functional and structural condition of the existingroadway and subgrade in terms useful life for design and material selection tasks. Dataanalysis efforts include identifying uniform section, material strengths, existing distresstypes, and the existing pavement performance. Developing rehabilitation techniquesinvolves selecting repair and rehabilitation techniques to correct existing distress typesand meet the structural and functional demands of the roadway. Material designinvolves the selection of materials to meet the structural and functional demands of theroadway. The selection of a rehabilitation strategy for construction is based on the mosteffective engineering design considering cost to MDSHA, practicality of construction, andbenefit in terms of service life provided to the MDSHA pavement network.
The material selection portion of this pavement design overview requires knowledge ofthe existing pavement materials available in specific regions of Maryland. A significantamount of effort has been completed to develop policies in this guide for materialselection. These policies are intended to keep recommendations and material selectionconsistent across different pavement design engineers and maintain consistency withcurrent construction issues and concerns. These policies are intended to take intoaccount the different environmental conditions across the state, material availability,material costs, predicted material performance, existing material performance, trafficconditions, and functional use of the roadway in the future.

Pavement Design Procedures
Updated 8/1/2001 III-1
III PAVEMENT DESIGN PROCEDURESThe project life cycle of a MDSHA project will require completion of numerousprocedures by the pavement design engineer that are presented in this section. Severalof these procedures can be done concurrently. Although, most of the procedures have astep-by-step outline to follow, the individual pavement design engineer is left to their ownresponsibility that the most beneficial and economical pavement recommendation isprovided for the construction project.
Each procedure in this section is divided into four headings: purpose, resourcerequirement, procedure, and flowchart. The purpose provides a general understandingand goals of the procedure. The resource requirement section provides an approximateamount effort required to complete the task. The procedure section details theprocedure in a step-by-step process. The process flowchart provides a graphicaloverview of the entire procedure with reference to procedural steps throughout theprocess.

Pavement Design ProceduresVisual Pavement Survey
Updated 8/1/2001 III-1
III.A PRELIMINARY PAVEMENT RECOMMENDATION
III.A.1 PurposePreliminary pavement recommendations are developed to:
• Provide a preliminary material and construction cost estimate to Office ofPlanning and Preliminary Engineering or Highway Design Division based onnetwork level data,
• Provide Access Permits Division with a network level data pavementrecommendation,
• Review county projects,• Provide Districts with a network level data pavement recommendation for
fiscal year estimates, and• Provide a maintenance or operations engineer with a network level data
pavement recommendation.
III.A.2 Resource RequirementsThe preliminary pavement recommendation process is typically done with data availableto the pavement designer in the office coupled with a site visit. Typically, FWD and coreresults are not available at the time a preliminary pavement recommendation isdeveloped. The pavement design in a preliminary pavement recommendation is basedon available network level data and standard design inputs and policies provided in thisguide. The preliminary pavement recommendation procedure documented belowrequires the following staffing needs for a typical job:
Position Function Resources Effort Level(man-hours)
Staff Engineer or Project Engineer Records Review 1 2Staff Engineer or Project Engineer Site Visit 1 4Staff Engineer or Project Engineer Data Analysis 1 2Staff Engineer or Project Engineer Project Communication 1 2Staff Engineer or Project Engineer Pavement Design 1 2Staff Engineer or Project Engineer Memo Development 1 2
III.A.3 ProcedureThe procedure presented in the attached flowchart and described in the following textshould be followed in a preliminary pavement recommendation. Reference to specificdesign inputs for rehabilitation or new design development can be located in Section IV“Pavement Design Policies”. Numerous steps contained in this procedure can becompleted within several software applications that the Pavement Division currently usesand has under development. The software application tool available to the PavementDivision that can be principally used to complete shoulder pavement designs at this timeis DARWin. The following procedure was written to provide the design engineer withadequate information to complete a preliminary pavement recommendation withoutspecific knowledge or access to computer software applications, but with the assumptionthat these tools were available.Certain steps in the preliminary pavement recommendation process and otherprocesses overlap. It is important to keep in mind that although these processes are

Pavement Design ProceduresVisual Pavement Survey
Updated 8/1/2001 III-2
broken out and written in separate sections, they are a part of an overall process toprovide logically and technically sound recommendations. The procedure describedbelow is conducted after receiving a request from a customer. This request can becompleted via a memo request, e-mail request, or verbal request. When this process iscompleted for a project that will receive a formal pavement recommendation, certainsteps will be done with respect to the final design rather than a recommendationprovided for a District Maintenance or Access Permits Division project.Follow the steps below to complete a preliminary pavement recommendation.
Step 1. Complete Step 5 as documented in Section III.F “PavementRehabilitation Design.” If this project will not ultimately receive afinal pavement recommendation, a smaller folder without partitions isapplicable.
Responsible Party - Engineer
Step 2. Complete Steps 6 through 12 as documented in Section III.F“Pavement Rehabilitation Design.” These steps involve collecting allavailable network level data and in-house data for the project.
Responsible Party - EngineerStep 3. Complete a site visit to the project. Identify different rehabilitation
strategies, causes for existing distress, drainage problems, trafficconditions, and unique site conditions. Complete PD-04 to assist inthe documentation of the site conditions.
Responsible Party - EngineerStep 4. Complete Steps 30 through 32 and 34 as documented in Section III.F
“Pavement Rehabilitation Design.” These steps involve determiningthe structural capacities of the pavement, original, effective, andfuture. Use available records review data.
Responsible Party - EngineerStep 5. Complete Steps 35 through 38 and Steps 46 through 49 as
documented in Section III.F “Pavement Rehabilitation Design.”These steps involve determining the required rehabilitation needs.For a new design, complete Steps 24 through 31 as documented inSection III.G “New Pavement Design.”
Responsible Party - Engineer
Step 6. Complete Steps 59 through 61 as documented in Section III.F“Pavement Rehabilitation Design.” These steps involve determiningthe pavement recommendation. Depending on the source of therequest, a formal memorandum may not be needed. In any case, adocumented response shall be provided to the requester and placedin the file.
Responsible Party - Engineer
Step 7. Complete Steps 63 and 65 as documented in Section III.F “PavementRehabilitation Design.” These steps involve QC review.
Responsible Party - Engineer

Pavement Design ProceduresVisual Pavement Survey
Updated 8/1/2001 III-3
Step 8. Relay information to the person that requested the recommendationin the appropriate form based on the type of request. This responsecould be in the form of an e-mail, formal or informal memorandum,and phone conversation. In any case, some form of documentationshall be placed in the project file folder regarding therecommendation that was provided.
Responsible Party - Engineer

Pavement Design ProceduresVisual Pavement Survey
Updated 8/1/2001 III-4
III.A.4 Preliminary Pavement Recommendation Flowchart
Setup Project
Steps 1
Engineer
Gather Data RecordsRecords Review
Steps 2
Engineer
Conduct Site VisitVisual Survey
Step 3
Calculate StructuralCapacities - SC
Step 4
Engineer
Engineer
Material Design &Selection
Step 5
Engineer
Project DatabaseProject File
Geotech Contact
PrepareRecommendation &
SpecificationsSteps 6 - 8
Engineer
Perfromance DataConstruction HistoryOther Project FilesMaintenance Data
Traffic Data
Project Sketch

Pavement Design ProceduresPavement Structure and Soil Property Determination
Updated 8/1/2001 III-5
III.B VISUAL PAVEMENT SURVEY
III.B.1 PurposeVisual surveys are conducted on rehabilitation designs to:
• Establish an overall condition of the pavement• Determine estimate of pre-overlay repair needs• Establish estimate of pre-overlay repair quantities• Identify predominant distress types
III.B.2 Resource RequirementsThe visual survey procedure documented below requires the following staffing needs fora typical job:
Position Function Resources Effort Level(man-hours)
Project or Staff Engineer Setup Testing 1 4Survey Technician or Staff Engineer Data Collection 1 12Survey Technician or Staff Engineer Data Entry/Processing 1 4Survey Technician or Staff Engineer QC Field Work 1 2
Technician QC Data Entry 1 1
III.B.3 ProcedureThe procedure presented in the attached flowchart and described in the following textshould be followed to rate pavement condition for rehabilitation designs. Certain steps inthe visual survey for pavement rehabilitation design process and the pavementrehabilitation process overlap. It is important to keep in mind that although theseprocesses are broken out and written in separate sections, they are a part of an overallprocess to provide logically and technically sound recommendations. The evaluationdescribed below is conducted while walking slowly alongside the highway pavement.Protective clothing must be worn (safety vest and hard hat) at all times when conductingthe survey. In addition, a survey vehicle equipped with a mounted flashing light shouldbe parked behind the surveyor at all times.
Step 1. Ride full length of job in each direction slowly in the outside travellane to identify the following information:• predominant distresses• riding quality• traffic level• shoulder type and condition• curb and gutter existence• curb reveal• drainage type and condition• verification of pavement type
Responsible Party – Engineer or SPIDStep 2. Define evaluation sections to rate based on:
• any changes in pavement type

Pavement Design ProceduresPavement Structure and Soil Property Determination
Updated 8/1/2001 III-6
• considerable changes in pavement condition or, more importantly,any changes in the variability of pavement condition
• major changes in traffic level• major changes in shoulder or drainage structures
Responsible Party – Engineer or SPID
Step 3. Measure pavement lane width. Responsible Party – Engineer or SPID
Step 4. Determine sample unit length based on the following:• If lane width = 9 feet then length = 275 feet• If lane width = 10 feet then length = 250 feet• If lane width = 11 feet then length = 225 feet• If lane width = 12 feet then length = 200 feet
“General Rule of Thumb” – Maintain a consistent sample unitlength throughout the analysis section. This value will typically be200 feet. By maintaining a consistent length, the number ofsample units can be determined more quickly prior to the startingsurvey. However, do not have a sample unit with a width greaterthan 16 feet. Responsible Party – Engineer or SPID
Step 5. Identify the total number of sample units within each section basedon the number of lanes, project length, lane width, and the selectedsample unit length; most likely a 200 foot sample unit length. Themaximum number of sample units for any section shall be 250. Anysections that have more than 250 sample units following the sectioncriteria shall be broken up to ensure no section has more than 250sample units.
Responsible Party – Engineer or SPID
Step 6. Assess pavement condition variability and determine sampling ratebased on Form PD-03; and discussions with the Assistant PavementDivision Chief, if needed. Determine the number of sample units tobe surveyed based on Form PD-03 and the total number of sampleunits in each section. Complete Form PD-03 with informationregarding total number of sample units, estimated standard deviation,and the number of sample units to be survey.
Responsible Party – Engineer or SPIDStep 7. Document observations from Steps 1 through 6 on Form PD-04.
Responsible Party – Engineer or SPID

Pavement Design ProceduresPavement Structure and Soil Property Determination
Updated 8/1/2001 III-7
Examples of Surveyed Sample Units (Based on 30% Sampling Rate)
Figure 1 2 Lane – 2 Way Road 3 Lanes in one direction Or 2 Lanes in one Direction
Note: Selection of the first sample unit is random at the start of the section. Assuming 30%sampling, the first sample unit is random among the first three sample units. After the firstsample unit is selected, the following sample units to be surveyed will be based on the samplingrate; i.e. every third sample unit for 30% sampling.
Step 8. Complete a Field Work Request Form (Form PD-05) for a visualsurvey. Provide the detailed information on the form regarding thenumber of sample units, sample unit dimensions, and number ofsurveyed sample units. Submit to SPID to schedule testing if SPIDhas yet to complete visual survey. If SPID has completed visual PCI
11 12
13 14
15 16
18 17
19 20
9 10
7 8
5 6
3 4
1 2 1 2
4 5
7 8
3
6
9
10 11 12
13 14 15
16 17 18
19 20 21
22 23 24
25 26 27
28 29 30

Pavement Design ProceduresPavement Structure and Soil Property Determination
Updated 8/1/2001 III-8
survey, verify correct sampling rate was completed, and skip to Step10.
Responsible Party - EngineerStep 9. SPID should notify project engineer if requested completion date
cannot be accommodated. If so, request should be submitted toconsultant as a work assignment.
Responsible Party - SPIDStep 10. Select location of sample units to be surveyed. The selected units
should be distributed equally across all lanes and staggered. Inaddition, the samples should be roughly spaced equal distances fromone another. It is important to select the sample units at “random” inorder to get and accurate representation of the entire section. Figure1 diagrams an example of the total number of sample units and thesurveyed sample units in a project.
Responsible Party – SPID or ConsultantStep 11. Go to beginning of first sample unit to be surveyed.
Responsible Party – SPID or ConsultantStep 12. Mark beginning location and measure sample length with wheel.
Note distress types in sample unit. Record the sample unit locationon the “PCI Sample Unit Distress Form” (Form PD-02 or PD-02a).
Responsible Party – SPID or Consultant
Step 13. Record distress types, extent, and severity on the “PCI Sample UnitDistress Form” (Form PD-02 or PD-02a).
Responsible Party – SPID or Consultant
Step 14. Repeat Steps 9 through 13 for the remaining sample units to besurveyed.
Responsible Party – SPID or ConsultantStep 15. Calculate total sum of distress for each distress and severity level for
sample unit distress on Form PD-02 or PD-02a. Responsible Party – SPID or Consultant
Step 16. Provide tallied survey sheets for each sample unit, partially filled outform PD-04 (if applicable), and any additional field notes for theproject to the design engineer.
Responsible Party – SPID or ConsultantStep 17. Determine the PCI deduct value for each distress type and severity
for each sample unit using the distress deducts curves and record onPD-02 or PD-02a.
Responsible Party – Engineer or Consultant
Step 18. Enter the corrected PCI deduct value and record on For PD-02 orPD-02a.
Responsible Party – Engineer or Consultant

Pavement Design ProceduresPavement Structure and Soil Property Determination
Updated 8/1/2001 III-9
Step 19. Randomly select 5% (at least 2) of the sample units surveyedpreviously for quality control testing.
Responsible Party – Engineer or ConsultantStep 20. Repeat steps 9 through 13 to record distress quantities and steps 15
through 19 to calculate sample unit PCI values for each of the qualitycontrol test sample units. An independent rater should conduct QCsurveys.
Responsible Party – Engineer or ConsultantStep 21. Record the quality control PCI values on the original sample unit PCI
values on Form PD-06a. Calculate the average difference for allsurveyed sample units.
Responsible Party – Engineer or ConsultantStep 22. If the average difference is greater than 10 then discuss results with
the project engineer to determine if further testing is necessary.Otherwise, provide project engineer with field data and all forms.
Responsible Party – Engineer or Consultant
Step 23. Calculate PCI and PCI statistics for each section using the PCIsoftware application, (PCItool). It is located on the network atn:omr\everyone\pavedsgn\pci. This software is a MS Accessdatabase program. The PCItool software allows you to calculateindividual sample unit PCI values, PCI section statistics, andextrapolate distress quantities. At minimum, print out section reportsand extrapolated report for each section in the project for the file.Individual sample unit reports are not necessary in the project file,unless otherwise specified.
Responsible Party - Engineer
Step 24. Check the data entry for the PCI input for any errors and documenton Form PD-06a.
Responsible Party - Engineer
Step 25. If the sampling rate used for the survey was =< 30% and if the PCIstandard deviation is >= 2 from the assumed standard deviation inForm PD-03, then additional sample units need to be surveyed.Determine the additional number of sample units by completing FormPD-03 with the more accurate PCI standard deviation data andrequest additional testing if necessary.
Responsible Party - Engineer
Step 26. If the sampling rate used for the survey was > 30% and if the PCIstandard deviation is >= 3 from the assumed standard deviation inForm PD-03, then additional sample units need to be surveyed.Determine the additional number of sample units by completing FormPD-03 with the more accurate PCI standard deviation data andrequest additional testing if necessary.
Responsible Party - Engineer

Pavement Design ProceduresPavement Structure and Soil Property Determination
Updated 8/1/2001 III-10
Step 27. If additional sample units are necessary, repeat steps 9 through 13for each of the additional sample units and recalculate the sectionPCI following steps 15, 17, 18, and 23. The additional sample unitsshould be selected in locations outside of the original samplelocations.
Responsible Party - Engineer
Step 28. Place all completed forms in project file.Responsible Party - Engineer

Pavement Design ProceduresPavement Structure and Soil Property Determination
Updated 8/1/2001 III-11
III.B.4 Visual Survey Process Flowchart
Conduct "WindshieldEvaluation" of Project
andComplete Visual
Survey Request Formand Submit to SPID
Steps 1 thru 8
PD-03PD-04PD-05
Request DateCannot be Met
Request Visual SurveyFrom Consultant
Conduct Surveyand Calculate Sample
Unit PCI Values
Step 9
Steps 10 thru 18
Perform Visual SurveyQC Evaluation
Steps 18 thru 22
PD-06a
Calculate Section PCIStatistics and Conduct
Error Checks
Step 23 thru 24
DatabaseReports
Std. Dev. too high
PD-02or
PD-02a
No
Conduct new surveyif QC results indicate
high variability
Yes
Determine Number ofAdditional Sample
Units and AdditionalSurvey
Steps 25 thru 27
No
Yes
Place All Completedinto Project File
Step 28
Engineer
Engineer
SPID/Consult./Eng.
Engineer or Consult.
Engineer
Engineer
Engineer

Pavement Design ProceduresPavement Structure and Soil Property Determination
Updated 8/1/2001 III-12
III.C PAVEMENT STRUCTURE AND SOIL PROPERTYDETERMINATION
III.C.1 PurposePavement structure and soil determination is completed to:
• Identify the pavement structure of the roadway,• Identify condition of pavement layers beneath the surface,• Identify weak and thin areas in the pavement structure,• Determine soil characteristics and existing conditions, and• Identify depth to water table and bedrock.
III.C.2 Resource RequirementsThe actual operation of obtaining the pavement structure and soil properties iscompleted by OMT field crews from either Geotechnical Explorations or SPID. Thepavement engineer is responsible for determining the location and number of areas tocollect this information. Determining the number and location of areas to collectpavement and soil data requires the following staffing needs for a typical job:
Position Function Resources Effort Level(man-hours)
Staff Engineer or Project Engineer Site Visit 1 2Staff Engineer or Project Engineer Testing Request 1 2Staff Engineer or Project Engineer Field Crew Communication 1 1Staff Engineer or Project Engineer Reviewing Data 1 1
III.C.3 ProcedureThe procedure presented in the attached flowchart and described in the following textshould be followed in determining pavement structure and soil properties. The primaryfocus of this section is to provide guidance to the pavement engineer to request theproper number and location of cores/borings. Assistance from the GeotechnicalExploration contact will be required for determining locations of specific soil borings. Inmost cases requiring a Geotechnical Explorations contact, they will take the lead withregard to requesting and determining test locations and ask for input on roadwayborings. Pavement coring operations for pavement structure determination is typicallyhandled by SPID. Soil and pavement borings that collect soil samples are typicallyhandles by the field crews for Geotechnical Explorations Division. The steps identified inthis section are to be completed in conjunction with new or rehabilitation pavementdesign procedures.Follow the steps below to determine pavement structure and soil property test locations.
Step 1. Determine general areas or sections of roadways where eitherpavement cores and/or soil borings will be needed to developpavement recommendations. Pavement cores are needed to identifythe existing pavement structure in areas to be rehabilitated orreconstructed. Pavement cores should be obtained to identify theamount of pavement to be removed in cases where the roadway is tobe reconstructed; i.e. bridge approaches. Pavement cores should

Pavement Design ProceduresPavement Structure and Soil Property Determination
Updated 8/1/2001 III-13
also be obtained in proposed MOT pavement areas. TheGeotechnical designer on the project and the existing site conditionswill dictate locations for soil borings.
Responsible Party - EngineerStep 2. Determine the number of mainline cores for the resurfacing portion of
a project. Ideally, FWD testing has been completed prior to coring.This information can be used to assist in determining core locations.Changes in deflections, either an increase or decrease, can be usedto indicate the need for a core location. Cumulative sum analysis ofdeflection data can be used to identify different performing sectionsfor core locations. Without the aide of FWD data, a pavement coreshould be taken in each lane for each pavement structure that existsin the project. The existing conditions of the roadway will assist indetermining the frequency of test locations. A consistent pavementtype and conditions will typically require a pavement core every 2000to 4000 feet per lane. If pavement conditions change, then a sectioncould be identified for a core location. Use the same criteria used todetermine analysis sections to identify sections for core locations.
Responsible Party - EngineerStep 3. Determine the number of shoulder cores for the resurfacing portion of
a project. A pavement core should be taken in the shoulder (insideand outside) at about half the frequency as that of the mainline, whentraffic is not expected to use the shoulder. When traffic is expectedto use the shoulder, either for MOT and permanently afterconstruction is complete, a pavement core should be taken in theshoulder (inside and outside) at the same frequency as that of themainline.
Responsible Party - Engineer
Step 4. Identify any unusual pavement areas and have the pavementstructure and materials identified with cores. Examples of unusualpavement areas include the following:
• Obvious widening areas of the older narrower mainlinepavement
• Areas of poor performing patches• Areas of poor condition pavement• Over poor performing joints in composite pavement• Areas exhibiting wet conditions on the surface beyond the
typical time for drying after rain/snow• Parking areas / turn lanes / shoulders in projects identified for
cross slope adjustment that require the reduction in elevationof the edge of the roadway
• Areas of pavement that appear to have material relatedproblems
Step 5. Determine the number and location of pavement borings for thewidening portion of a project. A pavement boring shall be taken inevery location in the roadway that currently does not support mainlinetraffic. These locations include shoulders, gore areas, turn lanes,

Pavement Design ProceduresPavement Structure and Soil Property Determination
Updated 8/1/2001 III-14
ramps, and parking lanes. The frequency of the pavement boringswill vary depending on the conditions of the pavement, existing siteconditions, and project scope. However, for a rule of thumb, apavement boring should be taken every 1000 to 2000 feet for aconsistent appearing pavement structure for a project.
Responsible Party - Engineer
Step 6. Determine the number and location of soil borings for the wideningand new construction portion of a project. This decision will residewith the Geotechnical Designer on the project, but occasionally thepavement engineer will be required to make these decisions.Obviously, existing conditions will dictate, but as a guideline, thefollowing locations should have soil borings:
• Every 500 to 1000 feet along the centerline of widening or newconstruction, and alternative route locations
• Above proposed storm water management facilities• Above proposed utility locations• Above proposed storm drain locations• At the toe of proposed embankments• At pier or column locations• At sound wall footing locations
Responsible Party - EngineerStep 7. Determine the number and location of pavement cores for Bridge
Design projects. Bridge projects typically involve some mainlinepavement structure identification, but more important, MOTpavement structure identification. This typically requires numeroustest locations in the four shoulders near bridges. The frequency ofthe pavement borings will vary depending on the conditions of thepavement, existing site conditions, and project scope. Obviously,existing conditions will dictate, but as a guideline, the followinglocations should have soil borings:
• Every shoulder (inside and outside) and both side of the bridgeapproach shoulders shall have a test location within 50 to 75feet from the bridge.
• In the mainline on both the approach and leave side of thebridge within 50 feet of the bridge, each lane may not benecessary
• All areas proposed for MOT pavement that currently do notsupport mainline traffic, every 250 to 500 feet
Responsible Party - Engineer

Pavement Design ProceduresPatching Survey
Updated 8/1/2001 III-15
III.D PATCHING SURVEY
III.D.1 PurposePatching surveys are conducted on rehabilitation designs to:
• Identify type and location of patches• Establish detailed quantity of patching
III.D.2 Resource RequirementsThe patching survey procedure documented below requires the following staffing needsfor a typical job:
Position Function Resources Effort Level(man-hours)
Survey Technician, or Staff Engineer Data Collection 1 24Survey Technician, or Staff Engineer Data Entry/Processing 1 2Survey Technician, or Staff Engineer QC Field Work 1 2
III.D.3 ProcedureThe procedure presented in the attached flowchart and described in the following textshould be followed to identify patching locations. Certain steps in the patching surveyprocess and the pavement rehabilitation process overlap. It is important to keep in mindthat although these processes are broken out and written in separate sections, they area part of an overall process to provide logically and technically sound recommendations.Locations should be identified after the design customer has selected the preferreddesign alternate. The evaluation described below is conducted while walking slowlyalongside the highway pavement. Protective clothing must be worn (safety vest andhard hat) at all times when conducting the survey. In addition, a survey vehicleequipped with a mounted flashing light should be parked behind the surveyor at alltimes.
Step 1. Complete a Field Work Request Form (Form PD-05) for a patchingsurvey. Provide the detailed information on the form regarding theestimated partial-depth and full-depth patching in addition to relevantrehabilitation strategies that would effect patching survey. Submit toSPID to schedule survey.
Responsible Party - EngineerStep 2. SPID should notify project engineer if requested completion date
cannot be accommodated. If so, request should be submitted toconsultant as a work assignment.
Responsible Party - SPIDStep 3. Obtain the Patching Guidelines forms and talk to the design engineer
for specific criteria regarding patching. Responsible Party – SPID or Consultant
Pavement Design ProceduresPatching Survey
Updated 8/1/2001 III-16
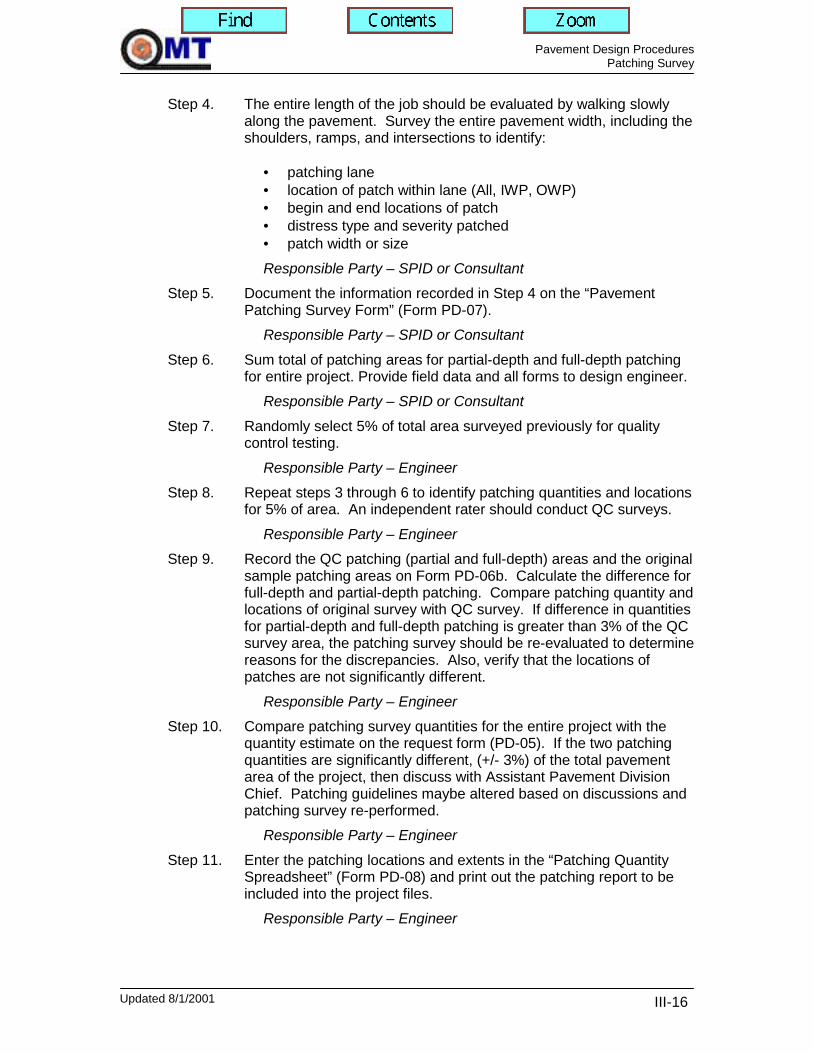
Step 4. The entire length of the job should be evaluated by walking slowlyalong the pavement. Survey the entire pavement width, including theshoulders, ramps, and intersections to identify:
• patching lane• location of patch within lane (All, IWP, OWP)• begin and end locations of patch• distress type and severity patched• patch width or size Responsible Party – SPID or Consultant
Step 5. Document the information recorded in Step 4 on the “PavementPatching Survey Form” (Form PD-07).
Responsible Party – SPID or Consultant
Step 6. Sum total of patching areas for partial-depth and full-depth patchingfor entire project. Provide field data and all forms to design engineer.
Responsible Party – SPID or Consultant
Step 7. Randomly select 5% of total area surveyed previously for qualitycontrol testing.
Responsible Party – EngineerStep 8. Repeat steps 3 through 6 to identify patching quantities and locations
for 5% of area. An independent rater should conduct QC surveys. Responsible Party – Engineer
Step 9. Record the QC patching (partial and full-depth) areas and the originalsample patching areas on Form PD-06b. Calculate the difference forfull-depth and partial-depth patching. Compare patching quantity andlocations of original survey with QC survey. If difference in quantitiesfor partial-depth and full-depth patching is greater than 3% of the QCsurvey area, the patching survey should be re-evaluated to determinereasons for the discrepancies. Also, verify that the locations ofpatches are not significantly different.
Responsible Party – EngineerStep 10. Compare patching survey quantities for the entire project with the
quantity estimate on the request form (PD-05). If the two patchingquantities are significantly different, (+/- 3%) of the total pavementarea of the project, then discuss with Assistant Pavement DivisionChief. Patching guidelines maybe altered based on discussions andpatching survey re-performed.
Responsible Party – Engineer
Step 11. Enter the patching locations and extents in the “Patching QuantitySpreadsheet” (Form PD-08) and print out the patching report to beincluded into the project files.
Responsible Party – Engineer

Pavement Design ProceduresPatching Survey
Updated 8/1/2001 III-17
Step 12. The entry of the patching quantities must be checked for input errorsby an independent reviewer. Corrections should be made to allerrors identified in the quality control process. The reviewer mustnote when the review process is completed and all corrections aremade on the “Patching Survey Quality Control Form” (Form PD-06b).
Responsible Party – Engineer
Step 13. Place all completed forms in project file.Responsible Party – Engineer

Pavement Design ProceduresPatching Survey
Updated 8/1/2001 III-18
III.D.4 Patching Survey Process Flowchart
Complete PatchingSurvey Request Formand Submit to SPID
Step 1
PD-05
Request DateCannot be Met
Request PatchingSurvey FromConsultant
Obtain Guidelines andConduct Patching
Survey
Step 2
Steps 3 thru 6
Enter Field Data inPatching Spreadsheet
Step 11
PD-08
Data EnteredCorrectly
GuidelinesPD-07
No
Determine Location ofErrors and Make
Corrections
Step 12Yes
No
Place All CompletedForms into Project File
Step 13
Yes
Engineer
Engineer
Engineer
Engineer
Engineer
SPID or Consult.
Compare PatchingSurvey Quantity with
Estimate
Step 10
Engineer or Consultant
Re-conduct patchingsurvey if patching
guidelines are altered
PD-06bPerform Patching QCEvaluation
Step 7 thru 9
Engineer or Consultant
Re-conduct patchingsurvey if QC results
indicate high variability

Pavement Design ProceduresTraffic Analysis
Updated 8/1/2001 III-19
III.E TRAFFIC ANALYSIS
III.E.1 PurposeTraffic Analysis is performed on new and rehabilitation pavement designs to:
• Develop the expected traffic volumes for a pavement section• Develop the expected truck weight characteristics for a pavement section• Develop the expected ESAL over the service life of a pavement section• Develop the expected ESAL for Superpave mix design information• Calculate the expected ESAL applications to failure for a pavement section• Calculate the expected ESAL applications since the last major rehabilitation
III.E.2 Resource RequirementsThe traffic analysis process documented below requires the following staffing needs fora typical job:
Position Function Resources Effort Level(man-hours)
Staff or Senior Engineer Data Collection 1 0.5Staff or Senior Engineer ADT Calculation 1 0.5Staff or Senior Engineer WIM Site Selection 1 0.5Staff or Senior Engineer Truck Factor Development 1 1.0Staff or Senior Engineer Future ESAL Calculation 1 0.5Staff or Senior Engineer Past ESAL Calculation 1 0.5Staff or Senior Engineer ESAL to Failure Calculation 1 0.5
III.E.3 ProcedureThe procedure presented in the attached flowchart and described in the following textshould be followed to perform traffic analysis. Certain steps in the traffic analysisprocess and the pavement rehabilitation process overlap. It is important to keep in mindthat although these processes are broken out and written in separate sections, they area part of an overall process to provide logically and technically sound recommendations.Numerous steps contained in this procedure can be completed within several softwareapplications that the Pavement Division currently uses and has under development. Thesoftware application tools available to the Pavement Division that can be principally usedto complete traffic analysis at this time are DARWin and other in-house programs. Thefollowing procedure was written to provide the design engineer with adequateinformation to complete a traffic analysis without specific knowledge or access tocomputer software applications, but with the assumption that these tools were available.
Step 1. Retrieve required project level traffic input data needed to initiate thetraffic analysis process. This data is typically provided by the Officeof Planning and Preliminary Engineering (OPPE), Travel ForecastingSection of the Project Planning Division. If project level traffic inputdata is not provided by OPPE, it needs to be requested from theOPPE. The traffic input data request is typically handled by theproject owner, but on occasion the Pavement Division may need tomake a request. The type of project level traffic input data needed isthe following:

Pavement Design ProceduresTraffic Analysis
Updated 8/1/2001 III-20
• Average Daily Traffic (ADT)• Percent Trucks• Percent Growth• Directional Distribution• Truck Counts – FHWA 13 classes and MDSHA 6 classes
The following hierarchy should be used to obtain traffic data in orderof preference:
• OPPE – Travel Forecasting• Adjacent or Older Projects• Highway Location Reference Manual• SHA GIS• Request from project ownerResponsible Party - Engineer
Step 2. Calculate the ADT and cumulative ADT for future and past years.The growth factor is not always provided specifically as a singlevalue. The OPPE generally provides growth rate in terms of the ADTin the expected construction year of the project and the estimatedADT sometime in the future after construction; typically 20 years. Inthis case, the growth rate can be calculated with the followingequation:
r = [(FADT / CADT) ^ (1/( FY - CY))] -1where:
r = growth rate (in decimal form)FY = future yearCY = construction yearFADT = future year ADTCADT = construction year ADT
Occasionally, the growth rate is available and not the future yearADT. Use the following equation to calculate the future ADT giventhe growth rate:
FADT = CADT * (1 + r)^ (FY – CY)where:
r = growth rate (in decimal form)FY = future yearCY = construction yearFADT = future year ADTCADT = construction year ADT
Use the following equation to calculate the total cumulative growthfactor:
G = [((1 + r )^ (FY – CY)) – 1] / rwhere:
G = total cumulative growth factorr = growth rate (in decimal form)FY = future yearCY = construction year

Pavement Design ProceduresTraffic Analysis
Updated 8/1/2001 III-21
Responsible Party - Engineer
Step 3. Identify the traffic group of the roadway at the project site. TheMDSHA roadway network is divided into individual traffic groups thatare intended to have similar truck weight characteristics. The trafficgroups are made up of District, area (rural, urban), functional class(interstate, arterial, and local), and local land use (residential,commercial, industrial, extractive, agriculture, and forest).
Responsible Party – Engineer
Step 4. Select a weigh-in-motion (WIM) that most closely represents trafficgroup of the roadway at the project site. OPPE provides theclassification and number of trucks for a project level design, but theweight of the trucks needs to be obtained from network level weightdata. The selection of the WIM site and the resulting truck weightcharacteristics combined with truck count data will be used todevelop a truck factor.
Responsible Party – EngineerStep 5. Select the terminal serviceability to be used for the pavement design
of the roadway. Refer to Section VI.A.a.5 “Pavement Design Policies– Terminal Serviceability” for details of selection.
Responsible Party – Engineer
Step 6. Select the future structural capacity (SCf) to be used for thepavement design of the roadway. This is an iterative processbecause in order to select SCf the engineer needs to know thecumulative ESALs over the service life of the pavement. Since weare following this procedure to develop ESALs, we do not know thecumulative ESALs over the service life of the pavement at this time.There will have to be an original estimate of SCf to initiate theiterative process. The numerical value of SCf will vary depending onthe pavement type of the roadway.
Responsible Party – Engineer
Step 7. Calculate the truck factor (TF). Inputs needed to calculate a truckfactor include the following:
• ADT• Percent Trucks• Percent Growth• Directional Distribution• Truck Counts – FHWA 13 classes• Truck weigh data – FHWA 13 classes• Terminal Serviceability• Future Structural Capacity (SCf)
There is an in-house software application to take the data providedabove and develop a truck factor.
Responsible Party – Engineer

Pavement Design ProceduresTraffic Analysis
Updated 8/1/2001 III-22
Step 8. Select the lane distribution of the roadway based on the proposednumber of lanes. Refer to Section VI.A.a.9 “Pavement DesignPolicies – Traffic Lane Distribution” for details of selection.
Responsible Party – EngineerStep 9. Calculate the future cumulative ESAL applications using the following
equation:Cumulative ESAL = (CADT) * 365 * (%T) * (TF) * (G) * (D) * (L)where:
CADT = average daily traffic in construction year%T = percent trucksTF = truck factorG = cumulative growth factorD = directional distributionL = Lane distribution
The cumulative growth factor (G) in the equation above is calculatedin Step 2 of Section III.E “Traffic Analysis.” The (G) is a function ofthe number of years into the future for the analysis, or design life ofthe pavement. Therefore, a different (G) must be calculated for eachESAL design life needed in the pavement design process and thenused in the equation above to develop the cumulative ESAL. Thetype of design lives needed for development of cumulative ESALvalues are the following:
• Resurfacing Design Life – several values possible• New/Reconstruction Design Life• Superpave Mix Design ESAL – 20 years
Place results of ESAL calculation and analysis inputs into project filein a summary sheet.
Responsible Party – Engineer
Step 10. Calculate ADT at time of last major rehabilitation of roadway atproject site. Use the following equation to calculate the ADT at ayear in the past:
PADT = CADT * (1 + r)^ (CY – PY)where:
r = growth rate (in decimal form)PY = past yearCY = construction yearPADT = past year ADTCADT = construction year ADT
Responsible Party – EngineerStep 11. The cumulative past ESALS applied to the roadway since the last
major rehabilitation can be calculated using the following equation:Cumulative ESAL = (PADT) * 365 * (%T) * (TF) * (G) * (D) * (L)where:

Pavement Design ProceduresTraffic Analysis
Updated 8/1/2001 III-23
PADT = average daily traffic at time of last rehabilitation%T = percent trucksTF = truck factorG = cumulative growth factorD = directional distributionL = Lane distribution
The cumulative growth factor (G) in the equation above is calculatedin Step 2 of Section III.E “Traffic Analysis.” The (G) is a function ofthe number of years into the past for the analysis, or number of yearssince last rehabilitation.
Place results of ESAL calculation and analysis inputs into project filein a summary sheet.
Responsible Party – EngineerStep 12. Calculate ESALs to failure based on the pavement structure at the
time of the last major rehabilitation. ESALS to failure is calculatedfrom Figures 3.1 and 3.7 and the nomograph equations on page II-32and II-45 in the “AASHTO Guide for Design of Pavement Structures”for flexible and rigid/composite sections respectively. Refer toSection VI.A.2 “Pavement Policies – ESALS to Failure” for specificdetails for inputs to calculate ESALS to failure. The following designinputs are required in order to use the nomograph or equation onpages II-32 and II-45:
• Flexible Pavements:• SCo – Original structural capacity of the pavement section following
the last rehabilitation.
• Design Subgrade Resilient Modulus (Mr) – Obtained from eithernondestructive testing or geotechnical soils investigation. SectionIII.J “FWD Data Analysis” will provide further details to thisprocedure. Section X.B “Material Library – Material Properties”includes default values for various types of subgrade materials.
• Initial Serviceability – See Section VI “Pavement Design Policies”.
• Terminal Serviceability – See Section VI “Pavement DesignPolicies”.
• Reliability – See Section VI “Pavement Design Policies”.
• Standard Deviation – See Section VI “Pavement Design Policies”.
• Rigid and Composite Pavements:• SCo – Original structural capacity of the pavement section following
the last rehabilitation.
• Modulus of Subgrade Reaction (k) – Obtained from eithernondestructive testing or geotechnical soils investigation. SectionIII.J “FWD Data Analysis” will provide further details to thisprocedure. Section X.B “Material Library – Material Properties”includes default values for various types of subgrade materials. The

Pavement Design ProceduresTraffic Analysis
Updated 8/1/2001 III-24
modulus of subgrade reaction can also be calculated following theprocedures identified in Section 3.2.1 of Chapter II of the “AASHTOGuide for Design of Pavement Structures.”
• Initial Serviceability – See Section VI “Pavement Design Policies”.
• Terminal Serviceability – See Section VI “Pavement DesignPolicies”.
• Reliability – See Section VI “Pavement Design Policies”.
• Standard Deviation – See Section VI “Pavement Design Policies”.
• J Factor (J) – Calculate the average load transfer for the designsection following Section III.J, “FWD Data Analysis” and select a JFactor as defined in Section VI “Pavement Design Polices”
• PCC Elastic Modulus (E)– Calculate the elastic modulus followingSection II.J, “FWD Data Analysis” or select a typical value fromSection X.B “Material Library – Material Properties” for concretematerials.
• PCC Modulus of Rupture (S’c)– Calculate the modulus of rupturebased on the PCC elastic modulus using the following equation
S’c = 43.5(E)+488.5where: E = PCC Elastic Modulus (psi/million)
Modulus of rupture can also be estimated using Section X.B“Material Library – Material Properties”
• Drainage Factor (Cd) – Select a drainage factor as defined inSection VI “Pavement Design Policies” based on materials andexisting conditions
Place results of ESAL calculation and analysis inputs into project filein a summary sheet.
Responsible Party – Engineer

Pavement Design ProceduresTraffic Analysis
Updated 8/1/2001 III-25
III.E.4 Traffic Analysis Process Flowchart
Data Collection
Steps 1
Engineer
ADT Calculation
Steps 2
Engineer
WIM Site Selection
Steps 3 - 4
Truck FactorDevelopment
Steps 5 - 7
Engineer
Engineer
Future and Past ESALCalculation
Steps 8 - 11
EngineerTraffic SummarySheet inputs and
ESAL values
ESALs to Failure
Steps 12
EngineerTraffic SummarySheet inputs and
ESAL values

Pavement Design ProceduresPavement Rehabilitation Design
Updated 8/1/2001 III-26
III.F PAVEMENT REHABILITATION DESIGN
III.F.1 PurposePavement rehabilitation designs are conducted to:
• Identify the exiting condition of the pavement• Identify the deterioration trend in the existing pavement• Determine the future structural requirements of the pavement• Determine the future functional requirements of the pavement• Determine the necessary improvements to the existing pavement• Identify the material requirements to improve the pavement following the
Pavement Design Policies
III.F.2 Resource RequirementsThe pavement rehabilitation design procedure documented below requires the followingstaffing needs for a typical job:
Position Function Resources Effort Level(man-hours)
Staff Engineer or Project Engineer Records Review 1 16Staff Engineer or Project Engineer Site Visit 1 16Staff Engineer or Project Engineer Data Analysis 1 16Staff Engineer or Project Engineer Project Communication 1 24Staff Engineer or Project Engineer Rehabilitation Design 1 32Staff Engineer or Project Engineer Memo Development 1 40
III.F.3 ProcedureThe procedure presented in the attached flowchart and described in the following textshould be followed in a typical pavement rehabilitation design recommendation.Reference to specific design inputs for rehabilitation design development can be locatedin Section IV “Pavement Design Policies”. Numerous steps contained in this procedurecan be completed within several software applications that the Pavement Divisioncurrently uses and has under development. The software application tool available tothe Pavement Division that can be principally used to complete pavement rehabilitationdesigns at this time is DARWin. The following procedure was written to provide thedesign engineer with adequate information to complete a rehabilitation design withoutspecific knowledge or access to computer software applications, but with the assumptionthat these tools were available.Certain steps in the pavement rehabilitation design process and other processesoverlap. It is important to keep in mind that although these processes are broken outand written in separate sections, they are a part of an overall process to provide logicallyand technically sound recommendations. The procedure described below is conductedafter receiving a request from a customer. This request can be completed via a memorequest, e-mail request, or verbal request. The scope of the project should be providedwith the pavement rehabilitation design request. If the scope of the project is notprovided in the request, Step 2 may need to be completed prior to Step 1. Otherwise, ifthe project scope is available with the design request, follow the steps below to completethe pavement rehabilitation design.

Pavement Design ProceduresPavement Rehabilitation Design
Updated 8/1/2001 III-27
Step 1. If the project involves any base-widening, reconstruction, storm watermanagement, embankment slopes, new construction, or has specialgeotechnical issues in the project, a geotech contact needs to beestablished for the project. If the Geotechnical Explorations Divisionis the customer, this step can be skipped. If not, send e-mail to theGeotechnical Exploration Division Chief to request contact for job.
Responsible Party - EngineerStep 2. Contact project engineer managing the project to request project
schedule and to establish contact person from OMT (ask that allfuture correspondence and requests be sent directly to the OMTcontact).
Responsible Party - EngineerStep 3. Notify Pavement Design Assistant Pavement Division Chief of the
recommendation due date with project description, scope, andschedule, if he/she is not already aware of the project.
Responsible Party – EngineerStep 4. Notify SPID of the project and the potential testing needs. Provide
SPID with the route number, county, project limit description, projectscope, mileposts, and charge number in addition to the anticipatedtesting requirements. This is not intended to be a formal testingrequest, but rather to allow SPID to estimate future testing workload.This will allow SPID will put project into testing schedule and attemptto complete the visual PCI survey as soon as possible by completingsteps 1 through 7 and steps 10 through 17 from Section IIIB “VisualSurvey for Pavement Rehabilitation Design.”
Responsible Party – EngineerStep 5. Setup a project folder with six sections. The following section
headings and contents will be the same for each project. All projectdocuments should be filed in the appropriate categories.
Section Heading Typical Contents1. Summary Data Collection and Analysis QC Forms (PD-06,a,b,c)
Pavement Rehabilitation Alternative Design Form (PD-10)2. Reports Memorandums or reports issued by OMT3. Correspondence Letters from requesting division
Printouts of project related e-mailsComments or supporting information sent to other divisionsProject Log-In SheetField Work Request Form
4. Records Review Traffic and ESAL dataConstruction history, as- built project dataMaintenance HistoryPerformance Data (IRI, Rut, etc.)Nearby or previous project data

Pavement Design ProceduresPavement Rehabilitation Design
Updated 8/1/2001 III-28
Section Heading Typical Contents5. Data Analysis Site visit notes
PCI survey forms (PD-02, PD-02a, and PD-06a)Boring logsPatching tables and forms (PD-07, PD-08, and PD-06b)FWD data and forms (PD-06c)
6. Design Output from Darwin or other pavement design programs
Responsible Party - EngineerStep 6. Gather and calculate the following traffic data as described in Section
IIIE “Traffic Analysis” of the Pavement Guide and place results in file.• Service Life Design ESALs• Superpave Mix Design ESALs• Cumulative ESALs to Failure• Cumulative ESALs Since Last Major Rehabilitation• ADT and ESAL production report
Responsible Party – EngineerStep 7. Retrieve construction history, performance data (ride quality, friction,
rutting, cracking), and other network level data for project site andplace in file.
Responsible Party – Engineer
Step 8. Contact District or Highway Designer to identify if any as-built plansexist that include any portion of the project limits. Request anyavailable plans and records relevant to construction history data andplace in file.
Responsible Party – Engineer
Step 9. Identify any projects designed by OMT from the “File RoomLogin/Sign Out Book” that include any portion of the project limits orare adjacent to or near by the project limits. Gather any relevantproject data and place in file.
Responsible Party – Engineer
Step 10. Verify with District Maintenance that construction history is accurateand up to date. Record any changes on the construction history printout and return to file.
Responsible Party – EngineerStep 11. Prepare a sketch of the project to identify any potential sections
within the project limits. This sketch is intended to communicatevariations within the project with other staff and is not intended to bedistributed outside OMT, therefore, the sketch should be hand drawnand rough.
Responsible Party - Engineer
Step 12. Assemble Records Review data and discuss project with AssistantPavement Division Chief. The discussion will involve identifying

Pavement Design ProceduresPavement Rehabilitation Design
Updated 8/1/2001 III-29
problem areas, special concerns, alternative design pavementstrategies, and identifying test setups and specific requests. Inaddition, any geotechnical testing needs will be identified anddiscussed.
Responsible Party – EngineerStep 13. Discuss geotechnical testing needs with geotech contact and agree
on testing schedule. Responsible Party – Engineer
Step 14. Determine status of visual PCI survey in the SPID testing schedule.If SPID has not completed the visual PCI survey to date, completesite visit by following Steps 1 through 8 from Section IIIB “VisualSurvey for Pavement Rehabilitation Design” of the Pavement Guide.If SPID has already been to the project and completed the visual PCIsurvey, follow Steps 1 through 7 in order to familiarize the pavementdesigner with the project pavement conditions and to verify theaccuracy of the data gathered by SPID.
Responsible Party – EngineerStep 15. Conduct PCI Survey following Section III.B “ Pavement Visual
Survey.” This step may be completed before this time as noted inStep 4.
Responsible Party – SPID or ConsultantStep 16. During the site visit, identify potential core locations, special testing
needs, different rehabilitation strategies, causes for existing distress,drainage problems, and unique project characteristics. In addition,verify Pavement Management System’s estimate for a rehabilitationstrategy. Document comments and thoughts onto field notes andplace in project file.
Responsible Party – Engineer
Step 17. Complete the Field Work Request Form (Form PD-05) for FWDtesting. Coring requests should only be requested at this time ifMOT requirements allow only one operation for FWD and coring.Otherwise, coring should be requested at a later time in the designprocess. Refer to Section III.I “FWD Testing” of the Pavement Guidefor guidelines for FWD testing setup. Observations from the site visitwill assist in determining testing setup and requirements.
Responsible Party – EngineerStep 18. Discuss testing set up with SPID and describe special testing needs.
Responsible Party – Engineer and SPID
Step 19. Conduct FWD testing following the procedures outlined in Section III.I“FWD Testing.”
Responsible Party – SPIDStep 20. Complete Quality Control of FWD data in field to ensure data is of
good quality, checking for sensors out of range and erroneous data

Pavement Design ProceduresPavement Rehabilitation Design
Updated 8/1/2001 III-30
outputs from the FWD equipment. Provide data after quality check toengineer once completed.
Responsible Party – SPID
Step 21. Store the FWD data file on the server under the project directory andnote on Form PD-06 that the quality checks of the FWD data wereconducted following Step 19 in Section III.I “FWD Testing”.
Responsible Party – EngineerStep 22. Conduct steps in Section III.J “FWD Data Analysis” to process the
raw FWD data and to determine erroneous test points and coringneeds/locations. In addition, the subgrade behavior (linear/ non-linear), the proper number of sensors to use in analysis, the properload levels to use in analysis, and the proper test locations to use inanalysis will be determined in this pre-processing data procedure.
Responsible Party – EngineerStep 23. Complete the Field Work Request Form (Form PD-05) for coring.
Identify core locations and any special instructions (i.e. coring over acrack or to a specific depth). Information obtained from the pre-processing of the FWD data will assist the engineer to determinecoring needs and locations. Refer to Section III.C for assistance andguidelines.
Responsible Party – EngineerStep 24. Conduct coring operations. Refer to Section III.C for assistance and
guidelines.Responsible Party – SPID
Step 25. Provide coring data to pavement designer.Responsible Party – SPID
Step 26. Place core results in project file.Responsible Party – Engineer
Step 27. Provide geotechnical test data to pavement designer.Responsible Party – Geotech
Step 28. Place geotechnical test data in project file.Responsible Party – Engineer
Step 29. Determine analysis sections by evaluating the following:• Sections as defined by FWD testing using the cumulative sum
procedure or deflection vs. station procedure following steps inSection III.J “FWD Data Analysis.
• Sections defined by changes in visual condition noted during thewindshield survey conducted in Steps 1 through 7 of Section III.B“Pavement Visual Survey.”
• Sections defined for the PCI survey.
Pavement Design ProceduresPavement Rehabilitation Design
Updated 8/1/2001 III-31
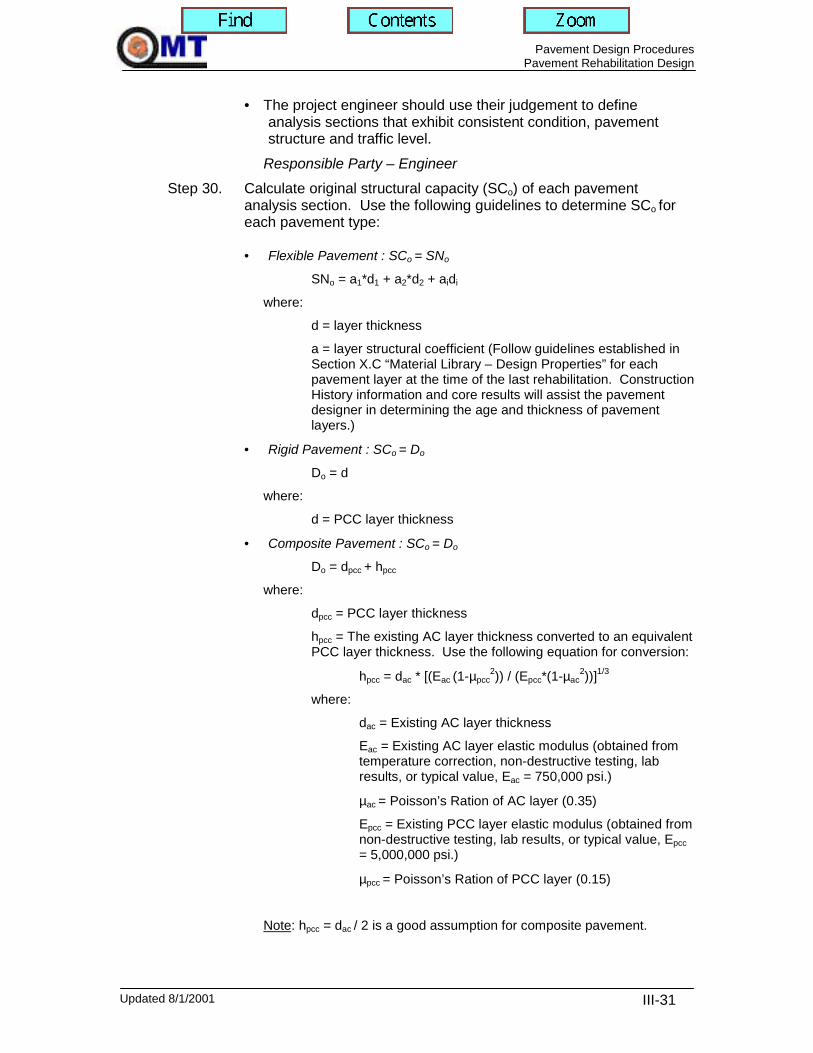
• The project engineer should use their judgement to defineanalysis sections that exhibit consistent condition, pavementstructure and traffic level.
Responsible Party – EngineerStep 30. Calculate original structural capacity (SCo) of each pavement
analysis section. Use the following guidelines to determine SCo foreach pavement type:
• Flexible Pavement : SCo = SNo
SNo = a1*d1 + a2*d2 + aidi
where:
d = layer thickness
a = layer structural coefficient (Follow guidelines established inSection X.C “Material Library – Design Properties” for eachpavement layer at the time of the last rehabilitation. ConstructionHistory information and core results will assist the pavementdesigner in determining the age and thickness of pavementlayers.)
• Rigid Pavement : SCo = Do
Do = d
where:
d = PCC layer thickness
• Composite Pavement : SCo = Do
Do = dpcc + hpcc
where:
dpcc = PCC layer thickness
hpcc = The existing AC layer thickness converted to an equivalentPCC layer thickness. Use the following equation for conversion:
hpcc = dac * [(Eac (1-µpcc2)) / (Epcc*(1-µac
2))]1/3
where:
dac = Existing AC layer thickness
Eac = Existing AC layer elastic modulus (obtained fromtemperature correction, non-destructive testing, labresults, or typical value, Eac = 750,000 psi.)
µac = Poisson’s Ration of AC layer (0.35)
Epcc = Existing PCC layer elastic modulus (obtained fromnon-destructive testing, lab results, or typical value, Epcc= 5,000,000 psi.)
µpcc = Poisson’s Ration of PCC layer (0.15)
Note: hpcc = dac / 2 is a good assumption for composite pavement.

Pavement Design ProceduresPavement Rehabilitation Design
Updated 8/1/2001 III-32
Responsible Party – Engineer
Step 31. Calculate the effective structural capacity (SCeff) of each analysissection following the condition (visual survey) analysis approach.SCeff can be calculated using the visual condition survey analysisapproach for flexible, rigid, and composite pavements. Use thefollowing guidelines to determine SCeff following the visual conditionsurvey analysis approach for each pavement type:
• Flexible Pavement : SCeff = SNeff
Option 1:
SNeff = SNo * Cx
where:
Cx = Condition Factor from visual condition analysis (=< 1.0). Toobtain Cx for flexible pavements use the following equation:
Cx = (PCI / 100)^1/2 > 0.65
where:
PCI = Average PCI for analysis section obtainedfollowing Steps described in Section III.B “PavementVisual Survey.”
Option 2:
SNeff = a1*d1 + a2*d2 + aidi
where:
d = layer thickness
a = layer structural coefficient (Follow guidelines established inby AASHTO found in Table 5.2 on page III-105 in the “AASHTOGuide for Design of Pavement Structures.”
• Rigid Pavement : SCeff = Deff
Option 1:
Deff = Do * Cx
where:
Cx = Condition Factor from visual condition analysis (=< 1.0). Toobtain Cx for rigid pavements use the following equation:
Cx = (PCI / 100)^1/2 > 0.65
where:
PCI = Average PCI for analysis section obtained followingSteps described in Section III.B “Pavement Visual Survey.”
Option 2:
Deff = Do * Fjc * Fdur * Ffat

Pavement Design ProceduresPavement Rehabilitation Design
Updated 8/1/2001 III-33
where:
Fjc = Joints and cracks adjustment factor. Fjc is calculated fromFigure 5.12 on page III-124 in the 1993 “AASHTO Guide for Designof Pavement Structures.” All of the input values needed to useFigure 5.12 can be tabulated in the field during the pavementdesigner windshield survey or estimated based on the distressquantities from the PCI visual survey results. Fjc ranges fromapproximately 0.4 to 1.0. In order to use Figure 5.12 the followingitems need to be summed:
- Number of unrepaired deteriorated joints per mile
- Number of unrepaired deteriorated cracks per mile
- Number of unrepaired punchouts per mile
- Number of expansion joints, exceptionally wide joints (>1.0”),and full-depth AC patches per mile
Fdur = Durability adjustment factor. Fdur is a function of the amount ofdurability problems such as D-cracking in the existing PCC slab. TheDurability adjustment factor range is 0.8 to 1.0. The summary resultsfrom the PCI survey will provide adequate information to develop anaccurate Durability adjustment factor. The 1993 AASHTO Guide forDesign of Pavement Structures” provides the following guidelines:
1.00: No signs of PCC durability problems
0.96 – 0.99: Durability cracking exists, but no spalling
0.88 – 0.95: Substantial cracking and some spalling exists
0.80 – 0.88: Extensive cracking and severe spalling exists
Durability related problems from reactive aggregate are not aprevalent distress in Maryland. The durability adjustment factor istypically close to 1.0 for a majority of Maryland roadways. Withextrapolated PCI survey results, use the following equation tocalculate Fdur:
Fdur = 1.0 – 0.2 * (A / B)
A = Extrapolated number of slabs with D-cracking of anyseverity
B = Total number of slab in section
Ffat = Fatigue damage adjustment factor. Ffat is a function of theamount of past fatigue or structural damage that may exist in thePCC slab. The fatigue damage adjustment factor range is 0.9 to 1.0.The summary results from the PCI survey will provide adequateinformation to develop an accurate Fatigue adjustment factor. The1993 AASHTO Guide for Design of Pavement Structures” providesthe following guidelines for each PCC pavement type:
JPCP (Plain):
0.97 – 1.00 < 5% of slabs are cracked
0.94 – 0.96: 5 to 15 % of slabs are cracked
0.90 – 0.93: > 15% of slabs are cracked
JRCP (Reinforced):

Pavement Design ProceduresPavement Rehabilitation Design
Updated 8/1/2001 III-34
0.97 – 1.00 < 25 cracks / lane mile
0.94 – 0.96: 25 to 75 cracks / lane mile
0.90 – 0.93: > 75 cracks / lane mile
CRCP (Continuously Reinforced):
0.97 – 1.00 < 4 punchouts / lane mile
0.94 – 0.96: 4 to 12 punchouts / lane mile
0.90 – 0.93: > 12 punchouts / lane mile
The AASHTO criteria to used to develop the Ffat factor can becalculated with extrapolated PCI survey results. The extrapolatednumber of linear cracks, divided slabs, and punchouts can besummed from the PCI results to help to determine the appropriatefatigue factor for the PCC.
• Composite Pavement : SCeff = Deff
Option 1:
Deff = Do * Cx
where:
Cx = Condition Factor from visual condition analysis (=< 1.0). Toobtain Cx for composite pavements use the following equation:
Cx = (PCI / 100)^1/2 > 0.65
where:
PCI = Average PCI for analysis section obtained followingSteps described in Section III.B “Pavement Visual Survey.”
Option 2:
Deff = (dpcc * Fjc * Fdur ) + (hpcc * Fac)
where:
dpcc = PCC layer thickness
Fjc = Joints and cracks adjustment factor. Fjc is calculated fromFigure 5.12 on page III-124 in the “AASHTO Guide for Design ofPavement Structures.” All of the input values needed to use Figure5.12 can be tabulated in the field during the pavement designerwindshield survey or estimated based on the distress quantities fromthe PCI visual survey results. Fjc ranges from approximately 0.4 to1.0. In order to use Figure 5.12 the following items need to besummed:
- Number of unrepaired deteriorated joints per mile
- Number of unrepaired deteriorated cracks per mile
- Number of unrepaired punchouts per mile
- Number of expansion joints, exceptionally wide joints(>1.0”), and full-depth AC patches per mile
Fdur = Durability adjustment factor. Fdur is a function of the amount ofdurability problems such as D-cracking in the existing PCC slab. TheDurability adjustment factor range is 0.8 to 1.0. The summary resultsfrom the PCI survey will provide adequate information to develop an

Pavement Design ProceduresPavement Rehabilitation Design
Updated 8/1/2001 III-35
accurate Durability adjustment factor. The 1993 AASHTO Guide forDesign of Pavement Structures” provides the following guidelines:
1.00: No history or evidence of PCC durabilityproblems
0.96 – 0.99: Pavement is known to have PCC durabilityproblems, but no localized failures or relateddistresses are visible
0.88 – 0.95: Some durability distress, localized failures, isvisible at pavement surface
0.80 – 0.88: Extensive durability distress, localized failures, isvisible at pavement surface
This value will be an estimated based on the visual survey and pasthistory of durability problems. For the most part, Maryland does nottypically have a reactive aggregate problem. The majority of theproblems with composite pavements in Maryland are from reflectivecracking, full-depth flexible patches, and flexible pavement widening.PCC durability factor is typically close to 1.0 for a majority ofMaryland roadways.
hpcc = The existing AC layer thickness converted to an equivalentPCC layer thickness. Use the equation from Step 30.
Fac = The AC quality adjustment factor. Fac adjusts for the quality ofthe asphalt concrete (AC) with respect to the effective structuralcapacity of the composite pavement. Fac is a function of the existingAC material quality related distress in the AC layer. AC materialquality distresses include the following: rutting, stripping, bleeding,weathering/raveling. Reflective cracking is not considered an ACmaterial quality related distress for pavement design purposesalthough the AC material properties may contribute to thedevelopment of the distress. Fac ranges from 0.8 to 1.0. Thesummary results from the PCI survey will provide adequateinformation to develop an accurate AC quality adjustment factor.The 1993 AASHTO Guide for Design of Pavement Structures”provides the following guidelines:
1.00: No AC material quality distress
0.96 – 0.99: Minor AC material quality distress
0.88 – 0.95: Significant AC material quality distress
0.80 – 0.88: Severe AC material quality distress
AC material quality factor can be calculated with extrapolated PCIsurvey results. The calculating procedure to develop the correctextrapolated distress quantities is provided in Section XIII “PavementRehabilitation Techniques”. Once the proper units for theextrapolated PCI distress quantities, use the following table todetermine Fac:
< 25% Weathering >= 25% Weathering< 10% Shoving >= 10% Shoving < 10% Shoving >= 10% Shoving
% Rutting % Rutting % Rutting % Rutting

Pavement Design ProceduresPavement Rehabilitation Design
Updated 8/1/2001 III-36
<10% 10-25% >25% <10% 10-25% >25% <10% 10-25% >25% <10% 10-25% >25%1.0 0.95 0.80 0.90 0.88 0.80 0.97 0.90 0.80 0.88 0.84 0.80
Not all analysis approaches are valid for every pavement type. Theguidelines established in the “AASHTO Guide for Design ofPavement Structures” will be followed by MDSHA. The analysisapproaches for determining the existing structural capacity of thepavement structure and the appropriate valid pavement types arelisted above.
Responsible Party – Engineer
Step 32. Calculate the effective structural capacity (SCeff) of each analysissection following the traffic analysis approach. The SCeff following thetraffic analysis approach can be found for flexible and rigidpavements. Use the following guidelines to determine SCeff followingthe traffic analysis approach:
SCeff = SCo * Cx
where:
Cx = Condition Factor from traffic analysis (=< 1.0). Cx from trafficanalysis is obtained using remaining life (RL) and Figure 5.2 on page III-90 in the “AASHTO Guide for Design of Pavement Structures.” RL isobtained from using the following equation:
RL = 100 * [1 – (Np/N1.5)]
where:
Np = Total number of ESALs applied to pavement since lastrehabilitation. Calculate the total number of ESALs since the lastmajor rehabilitation as outlined in steps ? through ? of SectionIII.E “Traffic Analysis”
N1.5 = Total number of ESALs applied to pavement to reach aterminal serviceability of 1.5 since last rehabilitation. Tocalculate N1.5 use the AASHTO flexible or rigid design equationas appropriate with design parameters as defined in PolicyVI.A.2 of Section VI “Pavement Design Policies”
Note: For flexible pavements SCeff = SNeff
For rigid pavements SCeff = Deff
Not all analysis approaches are valid for every pavement type. Theguidelines established in the “AASHTO Guide for Design of PavementStructures” will be followed by MDSHA. The analysis approaches fordetermining the existing structural capacity of the pavement structureand the appropriate valid pavement types are listed above.
Responsible Party – EngineerStep 33. Calculate the effective structural capacity (SCeff) of each analysis
section following the non-destructive testing analysis approach. The

Pavement Design ProceduresPavement Rehabilitation Design
Updated 8/1/2001 III-37
SCeff following the non-destructive testing analysis approach can befound for flexible pavements only. Use the following guidelines todetermine SCeff following the non-destructive testing analysisapproach:
Flexible Pavement : SCeff = SNeff
where:
SNeff = 0.0045 * D * (Ep)1/3
D = Total thickness of all pavement layers above the subgrade,inches
Ep = Effective modulus of the pavement layers above thesubgrade, psi
It is possible for SNeff to be greater than SNo. If this is true then SNoshould be redefined to be equal to SNeff and Step 31 and Step 32 shouldbe repeated to calculate SNeff based on visual survey results and traffic,respectively. Section III.J “FWD Data Analysis” will provide furtherdetails to this procedure.
Not all analysis approaches are valid for every pavement type. Theguidelines established in the “AASHTO Guide for Design of PavementStructures” will be followed by MDSHA. The analysis approaches fordetermining the existing structural capacity of the pavement structureand the appropriate valid pavement types are listed above.
Responsible Party – EngineerStep 34. Calculate the required structural capacity (SCf) for future traffic for
each analysis section. SCf is obtained from Figures 3.1 and 3.7 andthe nomograph equations on page II-32 and II-45 in the “AASHTOGuide for Design of Pavement Structures” for flexible andrigid/composite sections respectively. The following design inputsare required in order to use the nomograph or equation on pages II-32 and II-45:
• Flexible Pavements:• Design Subgrade Resilient Modulus (Mr) – Obtained from either
nondestructive testing or geotechnical soils investigation. SectionIII.J “FWD Data Analysis” will provide further details to thisprocedure. Section X.B “Material Library – Material Properties”includes default values for various types of subgrade materials.
• Initial Serviceability – See Section VI “Pavement Design Policies”.
• Terminal Serviceability – See Section VI “Pavement DesignPolicies”.
• Reliability – See Section VI “Pavement Design Policies”.
• Standard Deviation – See Section VI “Pavement Design Policies”.
• Design ESALs – See Section III.E “Traffic Analysis”

Pavement Design ProceduresPavement Rehabilitation Design
Updated 8/1/2001 III-38
• Rigid and Composite Pavements:• Modulus of Subgrade Reaction (k) – Obtained from either
nondestructive testing or geotechnical soils investigation. SectionIII.J “FWD Data Analysis” will provide further details to thisprocedure. Section X.B “Material Library – Material Properties”includes default values for various types of subgrade materials. Themodulus of subgrade reaction can also be calculated following theprocedures identified in Section 3.2.1 of Chapter II of the “AASHTOGuide for Design of Pavement Structures.”
• Initial Serviceability – See Section VI “Pavement Design Policies”.
• Terminal Serviceability – See Section VI “Pavement DesignPolicies”.
• Reliability – See Section VI “Pavement Design Policies”.
• Standard Deviation – See Section VI “Pavement Design Policies”.
• J Factor (J) – Calculate the average load transfer for the designsection following Section III.J, “FWD Data Analysis” and select a JFactor as defined in Section VI “Pavement Design Polices”
• PCC Elastic Modulus (E)– Calculate the elastic modulus followingSection II.J, “FWD Data Analysis” or select a typical value fromSection X.B “Material Library – Material Properties” for concretematerials.
• PCC Modulus of Rupture (S’c)– Calculate the modulus of rupturebased on the PCC elastic modulus using the following equation
S’c = 43.5(E)+488.5where: E = PCC Elastic Modulus (psi/million)
Modulus of rupture can also be estimated using Section X.B“Material Library – Material Properties”
• Drainage Factor (Cd) – Select a drainage factor as defined in SectionVI “Pavement Design Policies” based on materials and existingconditions
• Design ESALs – See Section III.E “Traffic Analysis”
Responsible Party – EngineerStep 35. Calculate the total required HMA overlay thickness without any pre-
overlay repair or other rehabilitation alternatives based on thefollowing guidelines:
• Flexible Pavement:
SNol = SNf - SNeff
Calculate overlay thickness using the following equation:
hol = SNol/0.44
• Rigid and Composite Pavements
hol = (Df - Deff) * A
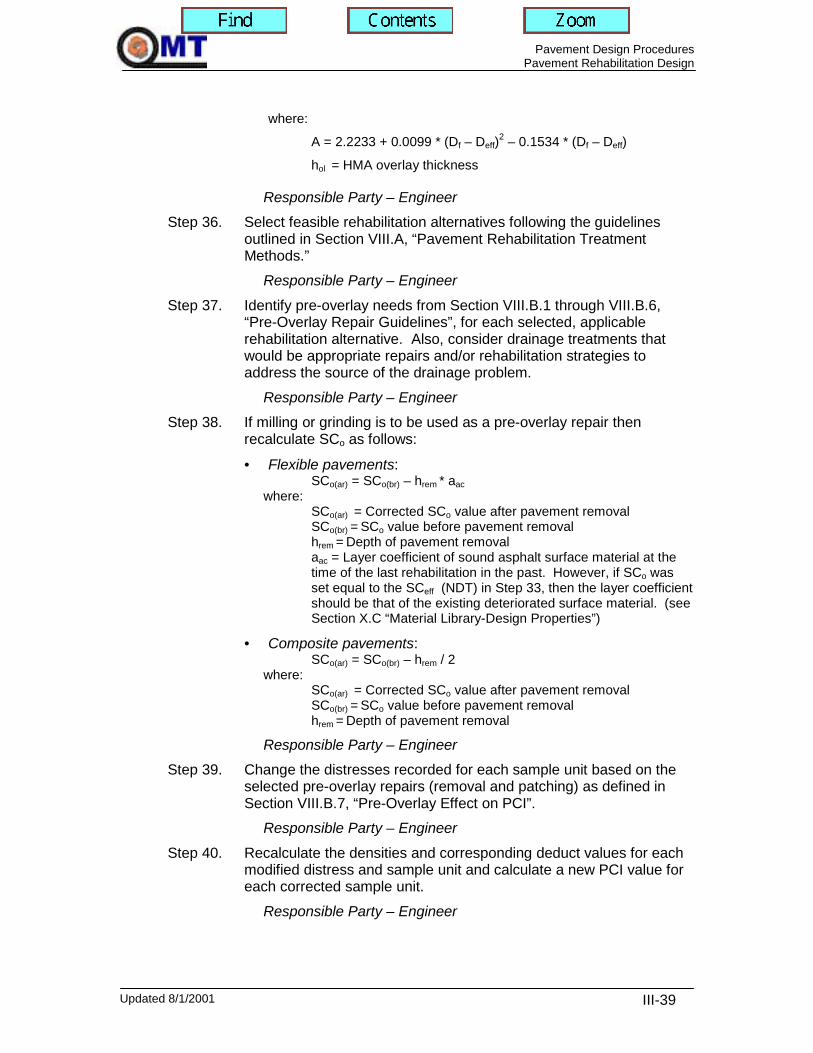
Pavement Design ProceduresPavement Rehabilitation Design
Updated 8/1/2001 III-39
where:
A = 2.2233 + 0.0099 * (Df – Deff)2 – 0.1534 * (Df – Deff)
hol = HMA overlay thickness
Responsible Party – EngineerStep 36. Select feasible rehabilitation alternatives following the guidelines
outlined in Section VIII.A, “Pavement Rehabilitation TreatmentMethods.”
Responsible Party – Engineer
Step 37. Identify pre-overlay needs from Section VIII.B.1 through VIII.B.6,“Pre-Overlay Repair Guidelines”, for each selected, applicablerehabilitation alternative. Also, consider drainage treatments thatwould be appropriate repairs and/or rehabilitation strategies toaddress the source of the drainage problem.
Responsible Party – EngineerStep 38. If milling or grinding is to be used as a pre-overlay repair then
recalculate SCo as follows:
• Flexible pavements:SCo(ar) = SCo(br) – hrem * aac
where:SCo(ar) = Corrected SCo value after pavement removalSCo(br) = SCo value before pavement removalhrem = Depth of pavement removalaac = Layer coefficient of sound asphalt surface material at thetime of the last rehabilitation in the past. However, if SCo wasset equal to the SCeff (NDT) in Step 33, then the layer coefficientshould be that of the existing deteriorated surface material. (seeSection X.C “Material Library-Design Properties”)
• Composite pavements:SCo(ar) = SCo(br) – hrem / 2
where:SCo(ar) = Corrected SCo value after pavement removalSCo(br) = SCo value before pavement removalhrem = Depth of pavement removal
Responsible Party – EngineerStep 39. Change the distresses recorded for each sample unit based on the
selected pre-overlay repairs (removal and patching) as defined inSection VIII.B.7, “Pre-Overlay Effect on PCI”.
Responsible Party – Engineer
Step 40. Recalculate the densities and corresponding deduct values for eachmodified distress and sample unit and calculate a new PCI value foreach corrected sample unit.
Responsible Party – Engineer

Pavement Design ProceduresPavement Rehabilitation Design
Updated 8/1/2001 III-40
Step 41. Determine the corrected PCI and related statistics for each sectionbased on the modified sample unit PCI values.
Responsible Party – Engineer
Step 42. Recalculate SCeff.as determined from visual survey following theprocedures outlined in Step 31.
Responsible Party – Engineer
Step 43. Identify the corrections resulting from the pre-overlay repairs asdefined in Section VIII.B.6, “Pre-Overlay Effect on PCI”. Use thisinformation to adjust the SCeff calculated based on AASHTO (Option2). Use Section X.C “Material Library-Design Properties” to assist indetermining the correct layer coefficient for each pavement layerfollowing pre-overlay repairs for flexible pavements. Use Tables 5.8and 5.10 on page III-126 and III-136 in the “AASHTO Guide forDesign of Pavement Structures” in determining the existingdistresses based on corrections made to the pavement from pre-overlay repairs for rigid and composite pavements.
Responsible Party – EngineerStep 44. If milling or grinding is to be used as a pre-overlay repair then
recalculate SCeff based on traffic analysis approach for flexiblepavements using the new SCo calculated in Step 38 in the followingequation.
SCeff(ar) = SCo(ar) * Cx
where:SCeff(ar) = Corrected SCeff value after pavement removal
Responsible Party – EngineerStep 45. If milling or grinding is to be used as a pre-overlay repair then
recalculate SCeff based on NDT for flexible pavements as follows:
SCeff(ar) = SCeff(br) –(hrem*aac)
where:SCeff(ar) = Corrected SCeff value after pavement removalSCeff(br) = SCeff value before pavement removalhrem = Depth of pavement removalaac = 0.44 or layer coefficient of existing asphalt surface material(see Section X.C “Material Library – Design Properties”)
Responsible Party – EngineerStep 46. Select the SCeff to use for each rehabilitation design based on the
following guidelines.
• Flexible Pavements• Compare SCeff calculated based on the corrected visual
survey (Option 1) to the SCeff calculated from NDT and selectthe lower of the two. Note: If SCeff was not calculated based

Pavement Design ProceduresPavement Rehabilitation Design
Updated 8/1/2001 III-41
on PCI results (Option 1) then compare the SCeff calculatedfollowing AASHTO procedures (Option 2) to the SCeffcalculated from NDT.
• If the SCeff calculated from the corrected visual survey isconsiderable lower then the SCeff calculated from NDT thendetermine if the distresses driving the PCI are predominantlyfunctional related. If so, then discuss the selection of the SCefffor design with the Assistant Pavement Division Chief.
• Compare the SCeff calculated based on traffic and determine ifit is considerably different from the selected SCeff for design. Ifso, discuss with the Assistant Pavement Division Chief.
• Rigid Pavements• Compare SCeff calculated based on the corrected PCI to the
SCeff calculated based on the corrected AASHTO survey andselect the lower of the two.
• If the two SCeff values are considerably different from eachother then discuss the selection with the Assistant PavementDivision Chief.
• Compare the SCeff calculated based on traffic and determine ifit is considerably different from the selected SCeff for design. Ifso, discuss with the Assistant Pavement Division Chief.
• Composite Pavements• Compare SCeff calcualted based on the corrected PCI to the
SCeff calculated based on the corrected AASHTO survey andselect the lower of the two.
• If the two SCeff values are considerably different from eachother then discuss the selection with the Assistant PavementDivision Chief.
Responsible Party – EngineerStep 47. Calculate the total required overlay thickness for all existing flexible
pavement sections and appropriate rehabilitation alternatives usingthe following guidelines:
• HMA Overlay and Recycled HMA:
SNol = SNf - SNeff
Calculate overlay thickness using the following equation:
where:
mi = drainage coefficient, refer to Section X.C “Material Library –Design Properties”
ol
n
iiii SNdam ≥�
=
∗∗
1

Pavement Design ProceduresPavement Rehabilitation Design
Updated 8/1/2001 III-42
ai = layer coefficient, refer to Section X.C “Material Library –Design Properties”
di = layer thickness
i = overlay layer
n = total number of layers in overlay
No structural improvement are required for In-Place Recycled HMA to bea viable rehabilitation alternative. Only functional improvements arerequired in this case.
• PCC Unbonded Overlay:
Repeat Step 34 to calculate the required structural capacity (SCf) usingthe following design inputs:
• Modulus of Subgrade Reaction (k-value) - Calculate the modulivalues for each pavement layer of the existing pavement. This isobtained either following the guidelines outlined in Section III.J “FWDAnalysis” or using typical values obtained from Section X.B “MaterialLibrary – Material Properties”. Use the pavement layer modulivalues to obtain the modulus of subgrade reaction (dynamic k-value)following the procedures identified in Section 3.2.1 of Chapter II ofthe “AASHTO Guide for Design of Pavement Structures.”
• Initial Serviceability – See Section VI “Pavement Design Policies”.
• Terminal Serviceability – See Section VI “Pavement DesignPolicies”.
• Reliability – See Section VI “Pavement Design Policies”.
• Standard Deviation – See Section VI “Pavement Design Policies”.
• J Factor (J) – See Section VI “Pavement Design Policies” for newconcrete pavement.
• PCC Elastic Modulus (E) - See Section X.B “Material Library –Material Properties” for new concrete pavement.
• PCC Modulus of Rupture (S’c)– Calculate the modulus of rupturebased on the PCC elastic modulus using the following equation orestimated using Section X.B “Material Library – Material Properties”:
S’c = 43.5 * (E) + 488.5
where: E = PCC Elastic Modulus (psi/million)
• Drainage Factor (Cd) – Select a drainage factor as defined inSection VI “Pavement Design Policies” based on materials andexisting conditions.
• Design ESALs – See Section III.E “Traffic Analysis”.
Calculate concrete overlay thickness using the following equation:
Dol = SCf
where:

Pavement Design ProceduresPavement Rehabilitation Design
Updated 8/1/2001 III-43
Dol = thickness of PCC overlay
• Ultra-Thin Whitetopping:
Refer to the attached report “Model Development and Interim DesignProcedure Guidelines for Ultra-Thin Whitetopping Pavement” forguidelines regarding Ultra-thin Whitetopping design procedure.
Responsible Party – Engineer
Step 48. Calculate the total required overlay thickness for all existing rigidpavement sections and appropriate rehabilitation alternatives usingthe following guidelines:
• HMA Overlay and HMA Overlay with Saw and Seal:
Calculate overlay thickness using the following equation:
hol = (Df - Deff) * A
where:
A = 2.2233 + 0.0099 * (Df – Deff)2 – 0.1534 * (Df – Deff)
hol = HMA overlay thickness
A minimum of a 4.0” of HMA overlay is required on rigid pavements. Theminimum HMA overlay thickness can be reduced if HMA Overlay withSaw and Seal rehabilitation method or joint tape is used.
• PCC Bonded Overlay:
Calculate overlay thickness using the following equation:
Dol = (Df - Deff)
where:
Dol = thickness of PCC overlay
Refer to standard in Section VII “Pavement Design Standards” for steeland joint spacing requirements.
• PCC Unbonded Overlay:
Calculate overlay thickness using the following equation:
where:
Dol = thickness of PCC overlay
Refer to standard in Section VII “Pavement Design Standards” for steel,joint spacing, and bond-breaker requirements.
22efffol DDD −=

Pavement Design ProceduresPavement Rehabilitation Design
Updated 8/1/2001 III-44
• Rubbilize and HMA Overlay and Break and Seat and HMAOverlay:
Calculate overlay thickness using the following equation:
where:
mi = drainage coefficient, refer to Section X.C “Material Library –Design Properties”
ai = layer coefficient, refer to Section X.C “Material Library –Design Properties”
di = layer thickness
i = overlay layer
n = total number of layers in overlay
apcc = layer coefficient of fractured PCC or rubbilized PCC, referto Section X.C “Material Library – Design Properties”
Dpcc = fractured PCC or rubbilized PCC thickness
Responsible Party – EngineerStep 49. Calculate the total required overlay thickness for all existing
composite pavement sections and appropriate rehabilitationalternatives using the following guidelines:
• HMA Overlay, Recycled HMA Overlay, and HMA Overlay withSaw and Seal.
Calculate overlay thickness using the following equation:
hol = (Df - Deff) * A
where:
A = 2.2233 + 0.0099 * (Df – Deff)2 – 0.1534 * (Df – Deff)
hol = HMA overlay thickness
In order for the rehabilitation alternative HMA Overlay with Saw and Sealto a viable method, the existing HMA material must be entirely removedto expose the bare concrete. The sum of any existing HMA material onthe PCC pavement in addition to any resurfacing shall be a minimum of4.0” in thickness. The minimum HMA overlay thickness can be reduced ifHMA Overlay with Saw and Seal rehabilitation method or joint tape isused.
• PCC Unbonded Overlay.
Calculate overlay thickness using the following equation:
fpccpcc
n
iiii SCDadam ≥�
�
���
� + ∗
=
∗∗�1

Pavement Design ProceduresPavement Rehabilitation Design
Updated 8/1/2001 III-45
where:
Dol = thickness of PCC overlay
Refer to standard in Section VII “Pavement Design Standards” for steel,joint spacing, and bond-breaker requirements.
• Rubbilize and HMA Overlay and Break and Seat and HMAOverlay:
Calculate overlay thickness using the following equation:
where:
mi = drainage coefficient, refer to Section X.C “Material Library –Design Properties”
ai = layer coefficient, refer to Section X.C “Material Library –Design Properties”
di = layer thickness
i = overlay layer
n = total number of layers in overlay
apcc = layer coefficient of fractured PCC or rubbilized PCC, referto Section X.C “Material Library – Design Properties”
Dpcc = fractured PCC or rubbilized PCC thickness
In order for the rehabilitation alternatives Rubbilize and HMA Overlayand Break and Seat and HMA Overlay to be viable methods, the existingHMA material must be entirely removed to expose the bare concrete.
• Ultra-Thin Whitetopping:
Refer to the attached report “Model Development and Interim DesignProcedure Guidelines for Ultra-Thin Whitetopping Pavement” forguidelines regarding Ultra-thin Whitetopping design procedure.
Responsible Party – EngineerStep 50. For new construction or reconstruction rehabilitation alternatives see
Section III.G “New Pavement Design.”Responsible Party – Engineer
Step 51. Complete shoulder pavement design following the guidelines inSection III.L “Shoulder Design” for each rehabilitation alternative.
2eff
2fol D - D D =
fpccpcc
n
iiii SCDadam ≥�
�
���
� + ∗
=
∗∗�1
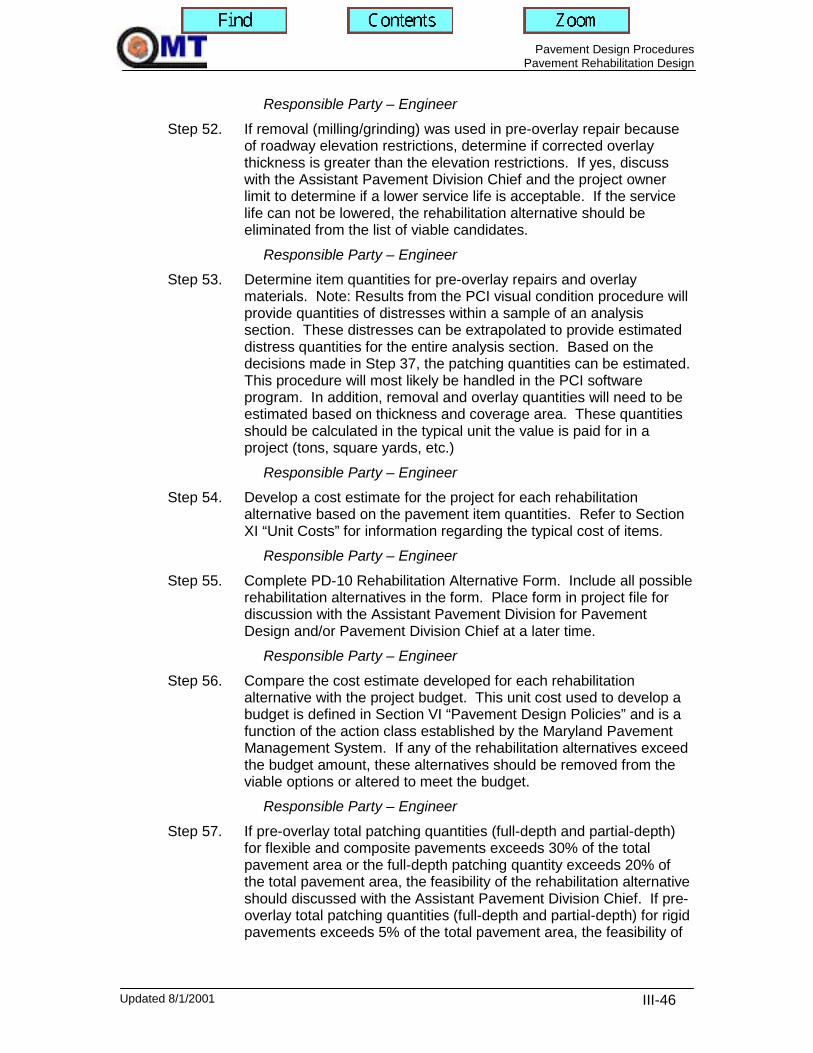
Pavement Design ProceduresPavement Rehabilitation Design
Updated 8/1/2001 III-46
Responsible Party – Engineer
Step 52. If removal (milling/grinding) was used in pre-overlay repair becauseof roadway elevation restrictions, determine if corrected overlaythickness is greater than the elevation restrictions. If yes, discusswith the Assistant Pavement Division Chief and the project ownerlimit to determine if a lower service life is acceptable. If the servicelife can not be lowered, the rehabilitation alternative should beeliminated from the list of viable candidates.
Responsible Party – EngineerStep 53. Determine item quantities for pre-overlay repairs and overlay
materials. Note: Results from the PCI visual condition procedure willprovide quantities of distresses within a sample of an analysissection. These distresses can be extrapolated to provide estimateddistress quantities for the entire analysis section. Based on thedecisions made in Step 37, the patching quantities can be estimated.This procedure will most likely be handled in the PCI softwareprogram. In addition, removal and overlay quantities will need to beestimated based on thickness and coverage area. These quantitiesshould be calculated in the typical unit the value is paid for in aproject (tons, square yards, etc.)
Responsible Party – EngineerStep 54. Develop a cost estimate for the project for each rehabilitation
alternative based on the pavement item quantities. Refer to SectionXI “Unit Costs” for information regarding the typical cost of items.
Responsible Party – Engineer
Step 55. Complete PD-10 Rehabilitation Alternative Form. Include all possiblerehabilitation alternatives in the form. Place form in project file fordiscussion with the Assistant Pavement Division for PavementDesign and/or Pavement Division Chief at a later time.
Responsible Party – Engineer
Step 56. Compare the cost estimate developed for each rehabilitationalternative with the project budget. This unit cost used to develop abudget is defined in Section VI “Pavement Design Policies” and is afunction of the action class established by the Maryland PavementManagement System. If any of the rehabilitation alternatives exceedthe budget amount, these alternatives should be removed from theviable options or altered to meet the budget.
Responsible Party – Engineer
Step 57. If pre-overlay total patching quantities (full-depth and partial-depth)for flexible and composite pavements exceeds 30% of the totalpavement area or the full-depth patching quantity exceeds 20% ofthe total pavement area, the feasibility of the rehabilitation alternativeshould discussed with the Assistant Pavement Division Chief. If pre-overlay total patching quantities (full-depth and partial-depth) for rigidpavements exceeds 5% of the total pavement area, the feasibility of

Pavement Design ProceduresPavement Rehabilitation Design
Updated 8/1/2001 III-47
the rehabilitation alternative should discussed with the AssistantPavement Division Chief.
Responsible Party – Engineer
Step 58. Discuss remaining possible rehabilitation alternatives with AssistantPavement Division Chief to prioritize rehabilitation alternatives. Note:If the project costs exceeds $20 million then a life cycle cost analysis,as outlined in Section III.H “Pavement Type Selection”, shall beperformed to select a preferred alternative.
Responsible Party – EngineerStep 59. Use Section VI “Pavement Design Policies” for assistance in
determining specific pavement materials and thickness of lifts torecommend for each rehabilitation alternatives.
Responsible Party – Engineer
Step 60. Discuss rehabilitation alternatives with project owner and appropriatetechnical teams to select final rehabilitation alternative. Thediscussion with the project owner should involve input fromConstruction Division regarding constructability issues with eachrehabilitation alternative. The technical material team should provideinput for special material requirements in the project.
Responsible Party – Engineer
Step 61. Prepare a memorandum using the typical rehabilitationrecommendation memorandum format(n:omr\everyone\pavedsgn\memoformat.doc). Complete thememorandum documenting the selected rehabilitation alternative andusing the quantities for pre-overlay developed previously.
Responsible Party – EngineerStep 62. Gather the appropriate Special Provisions and Detail Specifications
to be attached to the recommendation memorandum. Refer toSection VII “Pavement Design Standards” and Section IX “SpecialProvisions” for appropriate attachments. Also, the engineer shouldbe familiar with the appropriate Special Provisions Inserts that needto be included in the contract documents.
Responsible Party – Engineer
Step 63. Complete the appropriate portions of the Pavement RehabilitationDesign QC Form (PD-6). Complete Project Summary Informationform (PD-09). Place forms in project file. Submit project file andmemorandum with attachments to Assistant Pavement Division Chieffor review of design process and other QC checks.
Responsible Party – EngineerStep 64. Review design process and analysis for accuracy and quality of work.
Complete the Pavement Rehabilitation Design QC Form (PD-6).Submit project file and memorandum with attachments back toEngineer with any comments or notes.
Responsible Party – Assistant Pavement Division Chief

Pavement Design ProceduresPavement Rehabilitation Design
Updated 8/1/2001 III-48
Step 65. Make necessary edits and corrections to rehabilitation design andmemorandum. Submit project file and memorandum on letterheadwith attachments/specifications to Pavement Chief for final review.
Responsible Party – EngineerStep 66. Follow the steps outlined in Section III.D “Patching Survey” to request
a patching survey to identify patching quantities and locations. Note:This Step should be completed as close to the time of Final Reviewas possible to accurately define patching quantities.
Responsible Party – EngineerStep 67. Forward final patching results to project owner for inclusion in
contract documents.Responsible Party – Engineer

Pavement Design ProceduresPavement Rehabilitation Design
Updated 8/1/2001 III-49
III.F.4 Pavement Rehabilitation Process Flowchart
Setup Project
Steps 1 - 5
EngineerProject Database
Project FileNotice to SPID
Gather Data Records
Steps 6 - 10
EngineerPerformance DataConstruction HistoryOther Project FilesMaintenance Data
Traffic Data
Sketch out project anddiscuss with QM
Steps 11 and 13
EngineerProject Sketch
PD-05
Conduct Site VisitPCI Survey
Request TestingSteps 14 -17
Engineer and SPID
Conduct FWD Testing
Steps 18 - 22
Engineer and SPIDFWD Test ResultsCoring Locations
Request and ConductCoring
Steps 23 - 26
Engineer and SPID
Coring Logs
Receive and DiscussGeotech Test Data
Steps 27 and 28
Engineer and Geotech
Geotech Data
Define AnalysisSections
Step 29
Engineer
Calculate SCo, SCeff,and SCf
Steps 30 - 34
Engineer
Select RehabAlternatives
Steps 35 and 36
Engineer
Define Pre-OverlayNeeds
Step 37
Engineer
Adjust SCo and SCeff
Steps 38 - 45
Engineer
Select SCeff for Design
Steps 46
Engineer
Calculate OverlayThickness
Steps 47 - 50
Engineer
Develop Quantities andCost Estimate
51 - 55
Engineer
Compare Estimateto Budget
Check PatchingQuantities
Review Job with QMand Project Owner
Steps 56 and 60
Engineer
Prepare Memo andSpecial Provisions
Steps 61 - 65
Engineer
Request and ReportPatching Needs
Steps 66 and 67
Engineer
MemoSpecial
ProvisionsPD-06/PD-09
PatchingLocations
PD-10
1
1
2
2

Pavement Design ProceduresNew Pavement Design
Updated 8/1/2001 III-50
III.G NEW PAVEMENT DESIGN
III.G.1 PurposeNew pavement designs are conducted to:
• Determine the future structural requirements of the pavement• Determine the future functional requirements of the pavement• Determine the future structural and functional demands of the new pavement
necessary to support the expected traffic volumes• Identify the material requirements to provide a structurally and functionally
adequate pavement system.
III.G.2 Resource RequirementsThe new pavement design procedure documented below requires the following staffingneeds for a typical job:
Position Function Resources Effort Level(man-hours)
Staff Engineer or Project Engineer Records Review 1 16Staff Engineer or Project Engineer Site Visit 1 16Staff Engineer or Project Engineer Data Analysis 1 32Staff Engineer or Project Engineer Project Communication 1 48Staff Engineer or Project Engineer New Design 1 24Staff Engineer or Project Engineer Memo Development 1 40
III.G.3 ProcedureThe procedure presented in the attached flowchart and described in the following textshould be followed in a typical new pavement design recommendation. Reference tospecific design inputs for rehabilitation design development can be located in Section IV“Pavement Design Policies”. Numerous steps contained in this procedure can becompleted within several software applications that the Pavement Division currently usesand has under development. The software application tool available to the PavementDivision that can be principally used to complete new pavement designs at this time isDARWin. The following procedure was written to provide the design engineer withadequate information to complete a new design without specific knowledge or access tocomputer software applications, but with the assumption that these tools were available.Certain steps in the new pavement design process and other processes overlap. It isimportant to keep in mind that although these processes are broken out and written inseparate sections, they are a part of an overall process to provide logically andtechnically sound recommendations. The procedure described below is conducted afterreceiving a request from a customer. This request can be completed via a memorequest, e-mail request, or verbal request. The scope of the project should be providedwith the new pavement design request. If the scope of the project is not provided in therequest, Step 2 may need to be completed prior to Step 1. Otherwise, if the projectscope is available with the design request, follow the steps below to complete the newpavement design.

Pavement Design ProceduresNew Pavement Design
Updated 8/1/2001 III-51
In most cases, a new pavement design is completed in conjunction with a pavementrehabilitation design; i.e. “widening and resurfacing.” Therefore, the new andrehabilitation design process will occur concurrently and use the same data andinformation. The basic difference is that pavement rehabilitation design requires theevaluation and assessment of the existing roadway, both structurally and functionally.New pavement design does not take into account any of the existing conditions of thepavement other than geotechnical and drainage conditions because it is a new design.It is the pavement designers responsibility to use both design processes concurrentlywhere needed and take care to monitor that both designs are agreeable with oneanother both for design purposes and for construction related reasons.
Step 1. Geotechnical Explorations Division is highly involved in projectsrequiring a new pavement design. Geotechnical ExplorationsDivision need to be made aware of the project if they have notalready been notified by the project customer. Send an e-mail to theGeotechnical Exploration Division Chief to request contact for job ifone is not already been provided.
Responsible Party - EngineerStep 2. Contact project engineer managing the project to request project
schedule and to establish contact person from OMT (ask that allfuture correspondence and requests be sent directly to the OMTcontact).
Responsible Party - EngineerStep 3. Notify Pavement Design Assistant Pavement Division Chief of the
recommendation due date with project description, scope, andschedule, if he/she is not already aware of the project.
Responsible Party – EngineerStep 4. Notify SPID of the project and the potential testing needs. Provide
SPID with the route number, county, project limit description, projectscope, mileposts, and charge number in addition to the anticipatedtesting requirements. This is not intended to be a formal testingrequest, but rather to allow SPID to estimate future testing workload.This will allow SPID will put project into testing schedule and attemptto complete the visual PCI survey, if needed.
Responsible Party – EngineerStep 5. Setup a project folder with six sections. The following section
headings and contents will be the same for each project. All projectdocuments should be filed in the appropriate categories.
Section Heading Typical Contents1. Summary Data Collection and Analysis QC Forms (PD-06,a,b,c)
Pavement Rehabilitation Alternative Design Form (PD-10)2. Reports Memorandums or reports issued by OMT3. Correspondence Letters from requesting division
Printouts of project related e-mails

Pavement Design ProceduresNew Pavement Design
Updated 8/1/2001 III-52
Section Heading Typical ContentsComments or supporting information sent to other divisionsProject Log-In SheetField Work Request Form
4. Records Review Traffic and ESAL dataConstruction history, as- built project dataMaintenance HistoryPerformance Data (IRI, Rut, etc.)Nearby or previous project data
5. Data Analysis Site visit notesPCI survey forms (PD-02, PD-02a, and PD-06a)Boring logsPatching tables and forms (PD-07, PD-08, and PD-06b)FWD data and forms (PD-06c)
6. Design Output from Darwin or other pavement design programs
Responsible Party - Engineer
Step 6. Gather and calculate the following traffic data as described in SectionIIIE “Traffic Analysis” of the Pavement Guide and place results in file.• Service Life Design ESALs• Superpave Mix Design ESALs• Cumulative ESALs to Failure• Cumulative ESALs Since Last Major Rehabilitation• ADT and ESAL production report
Responsible Party – Engineer
Step 7. Retrieve construction history, performance data (ride quality, friction,rutting, cracking), and other network level data for project site andplace in file.
Responsible Party – EngineerStep 8. Contact District or Highway Designer to identify if any as-built plans
exist that include any adjacent projects. Request any available plansand relevant records. Place information in file folder.
Responsible Party – EngineerStep 9. Identify any projects designed by OMT from the “File Room
Login/Sign Out Book” that include are adjacent to or nearby theproject limits. Gather any relevant project data and place in file.
Responsible Party – Engineer
Step 10. Prepare a sketch of the project to identify any potential sectionswithin the project limits. This sketch is intended to communicatevariations within the project with other staff and is not intended to bedistributed outside OMT, therefore, the sketch should be hand drawnand rough.

Pavement Design ProceduresNew Pavement Design
Updated 8/1/2001 III-53
Responsible Party - Engineer
Step 11. Conduct site visit of project. Identify location of new roadway andneeded soil or roadway borings, special soil testing needs, differentpavement design strategies, and unique project characteristics.Document comments and thoughts onto field notes and place inproject file.
Responsible Party - EngineerStep 12. Assemble Records Review data and discuss project with Assistant
Pavement Division Chief. The discussion will involve identifyingproblem areas, special concerns, alternative design pavementstrategies, and identifying test setups and specific requests. Anygeotechnical testing needs and concerns will be identified anddiscussed. Testing for new roadways is handled throughGeotechnical Explorations Division and their drilling crews androadway borings.
Responsible Party – EngineerStep 13. Discuss geotechnical testing needs with geotech contact and agree
on testing schedule and data to be gathered from the field. Responsible Party – Engineer
Step 14. Complete the Field Work Request Form (Form PD-05) for FWDtesting of roadways that maybe rehabilitated or used for maintenanceof traffic (MOT). Typically, shoulders are used for MOT in roadwayrelocation or widening projects even if no other portion of theroadway is planned for rehabilitation. Refer to Section III.I “FWDTesting” of the Pavement Guide for guidelines for FWD testing setup.Observations from the site visit will assist in determining testing setupand requirements.
Responsible Party – Engineer
Step 15. Discuss testing set up with SPID, if needed.Responsible Party – Engineer and SPID
Step 16. Conduct FWD testing following the procedures outlined in Section III.I“FWD Testing”, if needed.
Responsible Party – SPID
Step 17. Complete Quality Control of FWD data in field to ensure data is ofgood quality, checking for sensors out of range and erroneous dataoutputs from the FWD equipment. Provide data after quality check toengineer once completed.
Responsible Party – SPID
Step 18. Store the FWD data file on the server under the project directory andnote on Form PD-06 that the quality checks of the FWD data wereconducted following Step 19 in Section III.I “FWD Testing”.
Responsible Party – Engineer

Pavement Design ProceduresNew Pavement Design
Updated 8/1/2001 III-54
Step 19. Conduct steps in Of Section III.J “FWD Data Analysis” to process theraw FWD data and to determine erroneous test points. In addition,the subgrade behavior (linear/ non-linear), the proper number ofsensors to use in analysis, the proper load levels to use in analysis,and the proper test locations to use in analysis will be determined inthis pre-processing data procedure.
Responsible Party – EngineerStep 20. Conduct pavement and soil borings and provide data to pavement
designer and geotech contact. Place boring log into file.Responsible Party – Geotech and Drillers
Step 21. Conduct soil testing of boring samples. Place geotechnical soil testdata in project file.
Responsible Party – Geotech and Engineer
Step 22. Determine analysis sections of sections of the roadway to be used forMOT by following the steps outlined in Section III.F “PavementRehabilitation Design” for evaluating existing structural capacity.
Responsible Party – EngineerStep 23. Calculate the required structural capacity (SCf) for future traffic for
each new pavement section. SCf is obtained from Figures 3.1 and3.7 and the nomograph equations on page II-32 and II-45 in the“AASHTO Guide for Design of Pavement Structures”, for flexible andrigid pavement sections respectively. The following design inputs arerequired in order to use the nomograph or equation on pages II-32and II-45:
• Flexible Pavements:• Design Subgrade Resilient Modulus (Mr) – Obtained from
geotechnical soils investigation for new pavement designs. SectionX.B “Material Library – Material Properties” includes default valuesfor various types of subgrade materials.
• Initial Serviceability – See Section VI “Pavement Design Policies”.
• Terminal Serviceability – See Section VI “Pavement DesignPolicies”.
• Reliability – See Section VI “Pavement Design Policies”.
• Standard Deviation – See Section VI “Pavement Design Policies”.
• Design ESALs – See Section III.E “Traffic Analysis”
• Rigid Pavements:• Modulus of Subgrade Reaction (k) – Obtained from geotechnical
soils investigation for new pavement designs. Section X.B “MaterialLibrary – Material Properties” includes default values for varioustypes of subgrade materials. The modulus of subgrade reaction canalso be calculated following the procedures identified in Section 3.2.1

Pavement Design ProceduresNew Pavement Design
Updated 8/1/2001 III-55
of Chapter II of the “AASHTO Guide for Design of PavementStructures.”
• Initial Serviceability – See Section VI “Pavement Design Policies”.
• Terminal Serviceability – See Section VI “Pavement DesignPolicies”.
• Reliability – See Section VI “Pavement Design Policies”.
• Standard Deviation – See Section VI “Pavement Design Policies”.
• J Factor (J) – Calculate the average load transfer for the designsection following Section III.J, “FWD Data Analysis” and select a JFactor as defined in Section VI “Pavement Design Polices”
• PCC Elastic Modulus (E)– Calculate the elastic modulus followingSection II.J, “FWD Data Analysis” or select a typical value fromSection X.B “Material Library – Material Properties” for concretematerials.
• PCC Modulus of Rupture (S’c)– Calculate the modulus of rupturebased on the PCC elastic modulus using the following equation:
S’c = 43.5(E)+488.5where: E = PCC Elastic Modulus (psi/million)
Modulus of rupture can also be estimated using Section X.B“Material Library – Material Properties
• Drainage Factor (Cd) – Select a drainage factor as defined in SectionVI “Pavement Design Policies” based on materials and existingconditions
• Design ESALs – See Section III.E “Traffic Analysis”
Responsible Party – EngineerStep 24. Identify the individual pavement layers and thickness that will provide
the structural capacity to satisfy our traffic demands represented bySCf. Use the following guidelines to determine the individualpavement layers and thickness:
• Flexible Pavements: SCf = SNf
SNf <= a1*d1 + a2*d2 + aidi
where:
d = layer thickness
a = layer structural coefficient (Follow guidelines established inSection X.C “Material Library – Design Properties” for each newpavement layer.
• Rigid Pavements: SCf = Df
Df <= d
where:
Pavement Design ProceduresNew Pavement Design
Updated 8/1/2001 III-56
d = PCC layer thickness
Responsible Party – Engineer
Step 25. Consider drainage treatments that would be appropriateimprovements or repair strategies to address the source of anypotential drainage concerns. Refer to Section VIII.B.5 “DrainageTreatment Guidelines.” Geotechnical assistance would beappropriate to determine the location and source of any drainageconcerns.
Responsible Party – EngineerStep 26. Use Section VI “Pavement Design Policies” for assistance in
determining specific pavement materials and thickness of lifts torecommend for the new pavement design alternatives.
Responsible Party – EngineerStep 27. If a jointed rigid pavement (JPCP and JRCP) is considered in design
process, joint geometry needs to be designed. Use the followingguidelines to design the joint geometry:
• Joint Spacing:Transverse contraction joints are constructed to control naturaltemperature related cracking in PCC. The construction of the transversecontraction joints is intended to limit the amount of mid slab cracking bycontrolling where the cracking occurs. For non-reinforced rigidpavements (JPCP), the joint spacing shall not be greater than 15 feet. Ageneral guideline is that the joint spacing in feet should be twice the slabthickness in inches. For reinforced rigid pavements (JRCP), the jointspacing shall not be greater than 30 feet.
• Joint Layout:Random joint spacing has been attempted in other states in order toeliminate harmonic induced ride quality problems. However, the benefitof reduced harmonic induced ride quality problems has not been provento account for the added aggravation and random joint spacing inconstruction. Therefore, consistently spaced joints shall be used in thedesign of rigid pavement for MDSHA.
Skewed joints have also been used by other states. Skewed jointsreduce the impact reaction of vehicles and inconclusively have reduceddeflection and stress at joints. However, skewed joints pose some repairproblems when the joint needs to be patched. Dowels should always beplaced parallel to the centerline of the pavement for skewed joints andnot perpendicular to the angle of the skew.
• Joint Construction:Joints can be created by sawing, inserts, or forming. The are twogeneral types of joints, transverse and longitudinal. Transverse jointsare perpendicular to the travel path of traffic and longitudinal joints areparallel the travel path of traffic. Longitudinal joints tend to be longerthan transverse joints because PCC slab are generally rectangular inshape and longer in the longitudinal direction.
Transverse Joints: The are two types of transverse joints contraction andexpansion. The depth of a transverse joint should be adequate enoughto ensure that cracking occurs at the desired location at the joint rather

Pavement Design ProceduresNew Pavement Design
Updated 8/1/2001
than in a random pattern. Typically, the depth of the transverse jointshould be ¼ of the slab thickness. Timing of sawing of joints is critical toconstructing a well performing pavement system. Sawing should bedone as soon as possible after adequate compressive strength as beenachieved by the PCC slab. Under normal conditions, depending oncuring conditions and concrete mix properties, sawing the joints shouldoccur 4 to 12 hours after placement.
Longitudinal Joints: Longitudinal joints are typically formed during PCCplacement when lanes are paved in separate passes. Longitudinal jointsmust also be formed with a keyway. A keyway is a trapezoidal notch andrespective tab in adjacent slabs as shown in the figure below:
The kmaximfigure
Resp
Step 28. If jointedprocess,requiredreinforce
• Load Unlesload trMDSHone Pplacedare thof the
r y
Tiebaeyway shall be located at mid-depth ofum strength. Standard dimensions fobelow:
onsible Party – Engineer
(JPCP and JRCP) rigid pavement steel design and load transfer mec. Use the following guidelines to dment and load transfer mechanism
Transfer Mechanism:s continuously reinforced concrete pavansfer mechanisms are required for aA. Load transfer devices mechanical
CC slab to an adjacent PCC slab. Loa at the transverse joints between adja
e most widely used type of load transfdowel bar is anchored into a PCC slab
0.2 D
0.1 D
Keywa
Longitudinal JointReservoir
III-57
the slab to provide forr the keyway are shown in
is considered in designhanism design is
esign the steel for transverse joints:
ement (CRCP) is proposed,ll rigid pavement designs byly transfer the load applied tod transfer devices arecent PCC slabs. Dowel barser device. Typically, one end and the other end of the
D

Pavement Design ProceduresNew Pavement Design
Updated 8/1/2001 III-58
dowel bar is lubricated to allow for expansion and contraction of thePCC.
The most commonly used material for dowels is round smooth steelbars, conforming to a Grade 60 or higher. Dowel bar diameter mustprovide large enough to provide enough mechanical advantage for loadtransfer, but yet thin enough not to limit the cross section and thestructural capacity of the PCC slab. As a guideline, the dowel diametershould be approximately one-eighth (1/8th) that of the slab thickness.The dowel bar length should be adequate to properly distribute the loadstresses across slab. Dowel bars are typically 18 inches in length.Dowel bars are typically spaced 12 inches on center and placed 6 inchesin from the longitudinal joint. This spacing will provide 12 dowel bars at atransverse joint of a lane 12 feet wide. Dowels are typically coated withepoxy to retard corrosion in the steel. Dowels are placed mid-depth ofthe PCC slab.
• Reinforcement Steel Design Inputs:The steel in JRCP consists of either bars or wire mesh that are placedbetween transverse joints. The steel is to provide addition tensionstrength to the limited tensile strength of PCC in order to resist mid slabcracking. The longitudinal reinforcement steel is not intended to preventcracking, but rather to hold the cracks tightly together after theirdevelopment. Temperature and moisture changes cause volumechanges in the PCC. A temperature and moisture decrease will causethe PCC slab to contract and an increase in temperature and moisturewill cause the PCC slab to expand. This volume change in combinationwith the friction and shear resistance of the underlying material createsstresses and strains to the slab in addition to the travelling vehicles.PCC is weak in tensile strength and occasionally with the forces actingupon the PCC in will cause a crack. In this case, the steel reinforcementmust carry the tension load without permanent or excessive elongation.Steel reinforcement shall not be placed at a point any higher than mid-slab and any point lower than two-thirds (2/3) into the slab. This range isintended to place the steel in the zone of tension in the slab and also tomaintain minimum cover depth around he steel.
The calculation for steel reinforcement type, size and spacing is basedupon steel grade, distance to the closest free edge, slab thickness,friction factor, and the design % of yield strength for the steel. Thefollowing are details of these design input material properties.
Steel Grade: The typical steel grade for reinforcement in Grade 60. Yieldstrength for Grade 60 steel is 60 ksi.
Distance to Free Edge: This is defined as the distance from thelongitudinal joint of concern to an unsupported PCC slab edge or theslab length for a transverse joint. An edge is considered unsupported if itis not tied to an adjacent lane or shoulder. The outside edge of a tiedrigid shoulder is a free edge. The distance to an unsupportedlongitudinal free edge is needed in determining transverse steelrequirements. The slab length is needed when determining longitudinalsteel requirements.
Slab Thickness: Thickness of PCC slab designed previously.
Friction Factor: The friction factor is a measure of the frictional resistancebetween the bottom of the slab and the top of the underlying base or

Pavement Design ProceduresNew Pavement Design
Updated 8/1/2001 III-59
subgrade layer. Recommended values for the subgrade and a variety ofbase materials are provided in Section X ”Material Library.”
Percent of Yield Strength: To guard against steel fracture and excessivepermanent deformation, a limiting stress of 75 percent of the ultimatetensile strength is used in steel design.
• Steel Reinforcement Requirements:The calculation of the amount of steel required in JRCP, As, is based onslab dimensions, steel and other material properties. Both dimensions ofthe steel requirements need to be estimated, both longitudinal andtransverse. The equation is the same to determine both dimensions, thevalue for the distance to the free edge determines the differencebetween longitudinal and transverse steel requirements. The amount ofsteel is designed to carry all the tensile stresses alone without benefit ofany PCC tensile strength. Use the following formula to determine theamount of steel requirements:
where:
As = area of steel (in2/ft)
W = unit weight of concrete (lb / ft3) ~ 150 lb/ft3
D = slab thickness (ft); 9.0” = 0.75 ft
L = distance to closest free edge (ft). For longitudinalsteel requirements, this value is the length of the slab.For transverse steel requirements, this value is thedistance to an untied longitudinal joint.
F = friction factor
fs = steel working stress (psi) = Yield strength * % Yield
The steel requirements in JRCP can also be expressed as percent steelas seen in the following equation:
where:
Ps = percent steel (%)
L = distance to closest free edge (ft). For longitudinalsteel requirements, this value is the length of the slab.For transverse steel requirements, this value is thedistance to an untied longitudinal joint.
F = friction factor
fs = steel working stress (psi) = Yield strength * % Yield
The selection of the spacing and size of the steel reinforcement is basedon the calculated value for the amount steel required for bothdimensions. Refer to the steel bar steel wire mesh properties in SectionX “Material Library” for the dimension properties of steel reinforcement.
100**2*
���
����
�=
ss f
FLP
���
����
�=
ss f
FLDWA*2
***

Pavement Design ProceduresNew Pavement Design
Updated 8/1/2001 III-60
The selected reinforcement shall have a cross-sectional area greaterthan the required amount of steel, but not excessively greater.Recommending more reinforcement steel than is necessary is costly andlimits the amount of possible cover depth. Typically, steel wire mesh isused as reinforcement for MDSHA. Steel bar reinforcement is typicallyonly used in CRCP and with joint length greater than 40 feet in length.The welded wire mesh can provide for different cross-sectional area inthe two different dimensions with different wire diameters and wirespacing.
Responsible Party – EngineerStep 29. If continuously reinforced rigid (CRCP) pavement is considered in
design process, a steel design process unique to CRCP is requiredto estimate the longitudinal steel requirements. Transverse steelrequirements for CRCP shall be designed in the same manner asJRCP. Use the following guidelines to design the longitudinal steelreinforcement for CRCP pavements:
• Longitudinal Steel Reinforcement Design Inputs:The steel in CRCP consists of reinforcement bars that are designed toprovide the PCC with tensile strength when subjected to environmentalstresses. Temperature and moisture changes cause volume changes inthe PCC. A temperature and moisture decrease will cause the PCC tocontract and an increase in temperature and moisture will cause thePCC to expand. This volume change in combination with the friction andshear resistance of the underlying material creates stresses and strainsin the PCC in addition to the travelling vehicles. PCC is weak in tensilestrength and occasionally with the forces acting upon the PCC in willcause a crack. In this case, the steel reinforcement must carry thetension load without permanent or excessive elongation. Steelreinforcement shall not be placed at a point any higher than mid-slab andany point lower than two-thirds (2/3) into the slab. This range is intendedto place the steel in the zone of tension in the slab and also to maintainminimum cover depth around he steel.
CRCP derives its name, “continuous”, from the longitudinal steel that isplaced continuously along the length of the PCC lane. CRCP does nothave any traditional contraction transverse joints, only an occasionalterminal joint placed at the end of day of paving. The longitudinal steel isnot intended to prevent transverse cracks, but rather to hold those crackstightly together. In fact transverse cracking is desired in CRCP and thespacing is designed to ensure critical stresses in the PCC are notreached. Unlike transverse cracking, longitudinal cracking is not desiredin CRCP. Transverse steel is provided in CRCP to prevent longitudinalcracking from developing. CRCP transverse steel reinforcement designis identical to the steel design for jointed PCC. The longitudinal steelrequirements for CRCP is discussed in the remaining portion of this step.
The following are details of the CRCP steel reinforcement design inputmaterial properties.
PCC Indirect Tensile Strength: The indirect tensile strength is tensilestrength a measurement of the PCC measured by applying a load alongthe longitudinal axis of a specimen. Both modulus of rupture and indirecttensile strength our measurements of the tensile strength of PCC.

Pavement Design ProceduresNew Pavement Design
Updated 8/1/2001 III-61
Typical values for indirect tensile strength are provided in Section X”Material Library.”
PCC Shrinkage Factor: This PCC shrinkage factor represents thevolume reduction in a PCC mix during curing. The amount of water lossin a concrete mix dictates the shrinkage factor amount. Typical values forthe PCC shrinkage factor are provided in Section X ”Material Library.”
PCC Thermal Coefficient: The PCC thermal coefficient represents thevolume change in PCC has a result of changing environmentalconditions. Typical values for PCC thermal coefficients are provided inSection X ”Material Library.”
Reinforcing Bar Diameter: The diameter of the bar used forreinforcement. Typical values for bar diameter are provided in Section X”Material Library.”
Reinforcing Bar Thermal Coefficient: The reinforcing bar thermalcoefficient represents the volume change in the steel has a result ofchanging environmental conditions. Typical values for reinforcing barthermal coefficient are provided in Section X ”Material Library.”
Design Temperature Drop: The design temperature drop is the differencebetween the average concrete curing temperature and a designminimum temperature. The average concrete curing temperature maybe taken as the average daily high temperature during the month thepavement is expected to be constructed. The design minimumtemperature is defined as the average daily low temperature for thecoldest month during the pavement life.
Wheel Load Stress: The wheel load stress is the tensile stressdeveloped during initial loading of the constructed pavement. Inputfactors required to calculate the wheel load stress include the slabthickness, modulus of subgrade reaction, and anticipated wheel loadmagnitude. The actual wheel load stress can be estimated using thegraph presented on page II-55 in the “1993 AASHTO Guide for Design ofPavement Structures.”
• Longitudinal Steel Reinforcement Limiting Criteria:In addition to the design inputs required of longitudinal reinforcing steel,there are three limiting criteria which must be considered: crack spacing,crack width, and steel stress. The limiting criteria are to ensure thatneither minimum nor maximum ranges of steel requirements are notviolated.
The following are details of the CRCP steel reinforcement design limitingcriteria.
Crack Spacing: Limiting criteria is placed on crack spacing to limit thepotential for spalling and punchouts. To minimize the potential for crackspalling, the maximum spacing between consecutive cracks should beno more than 8 feet. To minimize the potential for the development ofpunchouts, the minimum desirable crack spacing should be less than 3.5feet.
Crack Width: Limiting criteria is placed on crack width to limit thepotential for water penetration into the pavement structure and crackspalling. The allowable crack width should not exceed 0.04 inches.Ideally, the predicted crack width should be reduced as much as possible

Pavement Design ProceduresNew Pavement Design
Updated 8/1/2001 III-62
through selection of a higher steel percentage or smaller reinforcing bardiameter.
Steel Stress: Limiting criteria is placed on steel stress to prevent steelfracture and excessive permanent deformation. This limit is establishedto be 75% of the ultimate tensile strength of the steel.
• Longitudinal Steel Reinforcement Requirements:The calculation of the percent amount of steel required in CRCP, P, isbased on the input factors and limiting criteria described above. Thereare three nomographs in the “1993 AASHTO Guide for Design ofPavement Structures” on pages II-57 through II-59 based on the threelimiting criteria that produce the percent of steel required to adequatelyreinforce the CRCP. The nomographs are derived from the designinputs discussed earlier and customized for each limiting criterion. Eachnomograph provides the recommended longitudinal steel percentagebased on each limiting criterion. There are several computer softwareapplications available to the Pavement Division that are capable ofperforming the calculations of the nomographs in electronic form. Oncethe percent of steel is determined from the limiting criteria, the steelreinforcement specifications can be developed.
The following are the required design steps for the longitudinal steelreinforcement in CRCP. These steps can be completed in the computersoftware applications available to the Pavement Division.
Step A: Solve for the required longitudinal steel reinforcement (P) tosatisfy the limiting criterion using the design charts on pages II-57through II-59 in the “1993 AASHTO Guide for Design of PavementStructures.”
Step B: If the P based on the crack spacing criterion for the maximumcrack spacing (8 feet) is greater than any other limiting criterion P, thenadjustments must be made to the design inputs. This step is necessarybecause the if the P needed for 8 feet crack spacing is greater thananother P for a different criterion, then the input parameters used in thedesign will not provide the desired reinforcement necessary for anadequate pavement design. Therefore, the design inputs must bealtered in order for the steel reinforcement to provide the needed tensilestrength. Check for data entry errors prior to altering design inputs.After checking for data entry errors, the first iteration is to alter reinforcingbar diameters.
Step C: Determine the range in the number of reinforcing bars needed inthe CRCP. Using the following equations to determine that range:
where:
Nmin = minimum required number of reinforcing bars
Nmax = maximum required number of reinforcing bars
Pmin = minimum required percent steel
Pmax = maximum required percent steel
Ws = total width of pavement section (inches)
D = slab thickness (ft); 9.0” = 0.75 ft
2maxmax
2minmin
01273.0
01273.0
φφ
DWPNDWPN
s
s
×××=
×××=

Pavement Design ProceduresNew Pavement Design
Updated 8/1/2001 III-63
φ = diameter of reinforcing bar (inches)
Step D: Select the final steel design by selecting the actual total numberof bars (whole number) to be placed in the CRCP, which should bebetween Nmin and Nmax.
Responsible Party – EngineerStep 30. If any rigid pavement is considered in design process, tie bar steel
design is required for longitudinal joints. Use the following guidelinesto design the tie bar steel reinforcement for longitudinal joints:
• Tie Bar Design Inputs:Tie bars are deformed steel bars placed along longitudinal joints to holdtogether adjacent slabs and provide a load transfer mechanism acrosslongitudinal joints. Tie bars are used to tie adjacent lanes together andrigid shoulders. The spacing of tie bars is significantly greater thandowel bars used in transverse joints because the traffic crosseslongitudinal joints far less frequently than transverse joints. In addition,tie bars are used in combination with a keyway to provide additional loadtransfer capabilities.
There are three basic methods for tie bar placement for longitudinaljoints. The most common method is to place 90 degree bent tie bars intothe key during paving. The tie bars are then straightened before pavingadjacent lanes. Another method is to drill holes into the keyway afterpaving and inserting straight tie bars into the keyway and securing withan epoxy grout. The final method uses a two-part threaded tie bar inwhich the female end is inserted into the keyway during paving. Thethreaded portion of the tie bar is then placed prior to paving the adjacentlane.
The calculation for tie bar size and spacing is based upon steel grade,distance to the closest free edge, slab thickness, friction factor, and thedesign % of yield strength for the steel. The following are details of thesedesign input material properties.
Steel Grade: The typical steel grade for tie bars in Grade 40. Yieldstrength for Grade 40 steel is 40 ksi.
Distance to Free Edge: This is defined as the distance from thelongitudinal joint of concern to an unsupported PCC slab edge. A edgeis considered unsupported if it is not tied to an adjacent lane or shoulder.The outside edge of a tied rigid shoulder is a free edge.
Slab Thickness: Thickness of PCC slab.
Friction Factor: The friction factor is a measure of the frictional resistancebetween the bottom of the slab and the top of the underlying base orsubgrade layer. Recommended values for the subgrade and a variety ofbase materials are provided in Section X ”Material Library.”
Percent of Yield Strength: To guard against steel fracture and excessivepermanent deformation, a limiting stress of 75 percent of the ultimatetensile strength is used in steel design.
Bar Diameter: The bar diameter is the dimension of interest for steeldesign of rigid pavement. Tie bars are typically #4 (0.5” diameter) or #5(0.625” diameter) size bars. Recommended and common sizes of barsand wires are provided in Section X ”Material Library.”

Pavement Design ProceduresNew Pavement Design
Updated 8/1/2001 III-64
• Tie Bar Spacing:There is a formula equation to obtain tie bar spacing given the materialproperties, but maximum and minimum recommended spacing inaddition to engineering judgement should be strongly considered.Typical tie bar spacing is 30 to 40 inches. The maximum allowable tiebar spacing is 48 inches. The calculation of the tie bar spacing requiresthe calculation of an area of steel, As, required to support the slabdimensions given the steel and other material properties. Use thefollowing equation to calculate As:
where:
As = area of steel (in2/ft)
W = unit weight of concrete (lb / ft3) ~ 150 lb/ft3
D = slab thickness (ft); 9.0” = 0.75 ft
L = distance to closest free edge (ft)
F = friction factor
fs = steel working stress (psi) = Yield strength * % Yield
Once the area of steel for tie bars is determined, the spacing is thendetermined by dividing the cross-sectional area of the selected tie bar bythe area of steel required. An example of this equation is the following:
#4 tie bars = 0.2 in2
As = 0.0675 in2/ft
Spacing = 0.2 in2 / 0.0675 in2/ft = 2.96 ft = 36 in
• Tie Bar Length:The length of the tie bar is governed by the allowable bond stressbetween the PCC and the steel. For deformed steel, 350 psi can beassumed for the bond stress. There is an formula equation to obtain tiebar length given the PCC and steel material properties, but in addition toengineering judgement should be strongly considered. A typical tie barlength is 36 inches. The length of the tie bar is calculated by thefollowing formula:
where:
t = tie bar length (in)
d = bar diameter (in)
µ = bond stress (psi) ~ 350 psi
Responsible Party – Engineer
Step 31. The new pavement design shall be checked for constructabilityissues. For base widening and new pavement designs, care shall betaken to ensure that the new section does not effect the performance
���
����
�=
ss f
FLDWA ***
3*
*5.0 +���
����
�=
µdft s
Pavement Design ProceduresNew Pavement Design
Updated 8/1/2001 III-65
of the existing roadway; i.e. drainage problems from a “bathtub”effect or poor construction joint from different pavement types, etc. Inaddition, care shall be taken to ensure any pavement rehabilitationdesign is used in design combination and does not conflict with anynew pavement design on the project. For new construction orreconstruction, care shall be taken to ensure that the pavementdesign can be constructed and perform well over the pavementservice life; geometric and grade demands, MOT constraints,regional material constraints, etc.
Responsible Party – EngineerStep 32. Develop a cost estimate for the project for each new pavement
design based on the pavement item quantities. Refer to Section XI“Unit Costs” for information regarding the typical cost of items.
Responsible Party – EngineerStep 33. Complete PD-10 Rehabilitation Alternative form. Include all the
inputs applicable for a new design project. Some areas will be leftblank because they are intended for pavement rehabilitation design.Place form into project file for discussion with the Assistant PavementDivision Chief and/or Pavement Chief at a later time.
Responsible Party – Engineer
Step 34. Discuss new pavement design alternative with Assistant PavementDivision Chief. If the project costs exceeds $20 million or if project isdeemed to be a major corridor project by Pavement Division Chief,then a life cycle cost analysis, as outlined in Section III.H “PavementType Selection”, shall be performed to select a preferred alternative.
Responsible Party – EngineerStep 35. Discuss new pavement design alternatives with project owner and
appropriate technical teams to select final design alternative. Thediscussion with the project owner should involve input fromConstruction Division regarding constructability issues with eachalternative. The technical material team should provide input forspecial material requirements in the project.
Responsible Party – Engineer
Step 36. Prepare a memorandum using the typical pavement recommendationmemorandum format (n:omr\everyone\pavedsgn\memoformat.doc).Complete the memorandum documenting the selected newpavement design alternative.
Responsible Party – Engineer
Step 37. Gather the appropriate Special Provisions and Detail Specificationsto be attached to the recommendation memorandum. Refer toSection VII “Pavement Design Standards” and Section IX “SpecialProvisions” for appropriate attachments. Also, the engineer shouldbe familiar with the appropriate Special Provisions Inserts that needto be included in the contract documents.
Responsible Party – Engineer

Pavement Design ProceduresNew Pavement Design
Updated 8/1/2001 III-66
Step 38. Complete the appropriate portions for new pavement design of thePavement Rehabilitation Design QC Form (PD-06). CompleteProject Summary Information form (PD-09). Place forms in projectfile. Submit project file and memorandum with attachments toAssistant Pavement Division Chief for review of design process andother QC checks.
Responsible Party – EngineerStep 39. Review design process and analysis for accuracy and quality of work.
Complete the Pavement Rehabilitation Design QC Form (PD-06).Submit project file and memorandum with attachments back toEngineer with any comments or notes.
Responsible Party – Assistant Pavement Division ChiefStep 40. Make necessary edits and corrections to new pavement design and
memorandum. Submit project file and memorandum on letterheadwith attachments/specifications to Pavement Chief for final review.
Responsible Party – Engineer

Pavement Design ProceduresNew Pavement Design
Updated 8/1/2001 III-67
III.G.4 New Pavement Design Process Flowchart
Setup Project
Steps 1 - 5
EngineerProject Database
Project FileNotice to SPID
Geotech Contact
Gather Data Records
Steps 6 - 10
EngineerPerformance DataConstruction HistoryOther Project FilesMaintenance Data
Traffic Data
Conduct Site VisitVisual Survey
Request TestingSteps 11 and 15
Engineer and SPIDProject Sketch
PD-05
Conduct FWD TestingFWD Data Processing
Steps 16 -19
Engineer and SPID
Conduct SoilInvestigation
Steps 20
Geotech and SPID
FWD Test ResultsCoring Locations
Define AnalysisSections
Steps 21
Engineer
Calculate FutureStructural Needs - SCf
Steps 22 - 23
Engineer
Determine SpecificMaterial Layers
Steps 24 - 26
Engineer
PCC Joint Design
Steps 27
Engineer
Rigid Steel Design
Steps 28 - 30
Engineer
Constructability Review
Steps 31
Engineer
Cost Estimate - BudgetQC Review
LCCA - if neededSteps 32 - 34
Engineer
Discuss w/ ProjectOwner
Steps 35
Engineer
PrepareRecommendations and
Special ProvisionsSteps 36 - 37
Engineer
Final QC Review
Steps 38 - 40
Engineer
DetailsSpecial
Provisions
1
1
Soil and RoadwayMaterial Information
PD-10
Final Recomm.MemoPD-06PD-09

Pavement Design ProceduresLife Cycle Cost Analysis
Updated 11/1/2002 III-68
III.H LIFE CYCLE COST ANALYSIS (LCCA)MDSHA Pavement Division currently uses a probabilistic approach to life cycle cost analysisrather than the traditional deterministic approach. This approach allows for a range ofconstruction and material cost to be used in the analysis rather than a discrete unit cost. Theresults of this approach provide the pavement engineer the probability of user and agency costsoccurring over the analysis period. The probabilistic approach eliminates arguments over unitcost because a reasonable range is used that encompasses variations in the economy andconstruction costs.
In addition, MDSHA has put a tremendous amount of effort towards developing and calculatinguser costs involved in construction and rehabilitation projects. Various user delay costs arecalculated to develop the overall user cost. These items include, but are not limited to thefollowing: reduced speed costs, slow down costs, queuing costs, idling costs, and accelerationcosts. MDSHA has worked closely with FHWA to develop a LCCA approach that uses aprobabilistic approach and incorporates detailed user delay costs.
The current LCCA procedure is undocumented at this time. When the procedure has identifiedsteps and required parameters, it shall be incorporated into the MDSHA Pavement Design Guide.

Pavement Design Procedures FWD Testing
Updated 11/1/2002 III-69
III.I FWD TESTING
III.I.1 PurposeFWD Testing is conducted to:
• Collect data to assess the structural capacity of pavement structures• Collect data to determine the soil and subgrade strength• Collect data to estimate the structural capacity of the pavement structure and the
material properties of the individual pavement layers• Collect data to estimate the load transfer ability of joints in jointed rigid and
composite pavements• Determine statistically different performing pavement sections and sub-sections
III.I.2 Resource RequirementsThe FWD testing procedure documented below requires the following staffing needs fora typical job:
Position Function Resources Effort Level(man-hours)
Staff Engineer or Project Engineer Establish Project Features 1 1Staff Engineer or Project Engineer FWD Testing Set-Up 1 2
Project Engineer/ SPID Testing Communication w/ SPID 2 1SPID FWD Testing 1 12*
Staff Engineer or Project Engineer QC FWD Data 1 2* This value is dependent upon project size. This is based on 1-day of testing or 150 points/day.
III.I.3 ProcedureThe procedure presented in the attached flowchart and described in the following textshould be followed to complete FWD Testing. FWD testing shall be required on allprojects requiring pavement recommendations unless specified otherwise in thisPavement Guide or as directed by the Assistant Pavement Division Chief or PavementDivision Chief. The procedure described below is conducted within the pavementrehabilitation design process. Certain steps in the pavement rehabilitation designprocess and the FWD testing process overlap. It is important to keep in mind thatalthough these processes are broken out and written in separate sections, they are apart of an overall process to provide logically and technically sound recommendations.There are several assumptions that are made in the development of this process and thevalues used to establish FWD testing set-ups. The most important item that pavementdesigners need to be aware of is that is was assumed that the FWD equipment andoperator could collect approximately 150 test points a day. This is based on limitedtravel time, no constricting MOT demands, and no equipment failures. This is the testingschedule that should be used when estimating the testing time demands needed for aparticular project. Depending on the size and geometry of some projects, 150 pointsmay be an excessive amount of data; i.e. a short turn lane project. In addition, thetesting demands of the FWD occasionally become heavy and the amount of testing for aparticular project may need to be reduced in order to provide FWD data to all theprojects in the state within a reasonable time. In this case, communication between

Pavement Design Procedures FWD Testing
Updated 11/1/2002 III-70
SPID and the pavement engineer need to take place to ensure adequate data and timeconstraints are addressed for all interested parties.
Step 1. Determine the pavement type variations within the project limits. Aseparate test set-up needs to be established for each pavement typewithin the project. At this point, the records review and site visitshould have provided sufficient information to determine thepavement type variation within a project. Information collected inForms PD-04, for each project section, will also provide additionalrefresher information about the pavement types.
Responsible Party - EngineerStep 2. Determine the project layout and attributes. The project layout will
influence the FWD test set-up and pattern of testing. The projectsketch developed in the pavement rehabilitation design process to beused in discussions with Assistant Pavement Division Chief will be auseful tool. All state routes, intersections, turn lanes, ramps, serviceroads, and shoulders within the project limits should be identified anda decision made if FWD testing is required. A well-defined scope isrequired to make decisions about testing requirements for variousproject attributes. Discussion with the Assistant Pavement DivisionChief maybe needed, if necessary.
Responsible Party - EngineerStep 3. Determine the size (length and lanes) of each project attribute
(mainline, shoulders, ramps, etc.) to receive FWD testing. This willprovide the time demands on the FWD for this particular project.These demands are based on the assumptions stated above aboutthe FWD test pace being approximately 150 test points per day.
Responsible Party - EngineerStep 4. Determine the project geometry. The project geometry will influence
the FWD pattern of testing. For example, numerous intersections,closely spaced intersections, and single lane ramps may limit theamount of testing that can be feasibly done because on the demandsof the travelling public and MOT. These MOT concerns should benoted and discussed with SPID after the request is provided.
Responsible Party - EngineerStep 5. Determine FWD test sections. Use the information gathered in Steps
1 through 4 above to determine FWD test sections. A separate FWDtest sections should be established for different pavement types andproject attributes for a project. Section lengths and project geometrywill dictate FWD test set-up in a FWD test section.
Responsible Party - Engineer
Step 6. Determine FWD test type for each section. There are three basictypes of FWD tests: basin, joint, corner. Basin testing is used toevaluate the structural strength of the pavement structure andsubgrade in flexible and rigid pavements. The primary use of basintesting in composite pavements is to establish a HMA compression

Pavement Design Procedures FWD Testing
Updated 11/1/2002 III-71
or bending factor. Basin testing can also be used to produce ageneral estimate of the structural strength of the pavement structureand subgrade in composite pavements. Specific structuralcharacteristics of composite pavement are difficult to obtain with agreat deal of confidence with the current backcalculation analysismethods available today.Basin testing can also be done on subgrade and base materials.Basin testing on subgrade or unbound base materials should becompleted with the larger load plate (radius of 9”, 230 mm) to preventdamage to the underlying layers. All other testing should be donewith the smaller load plate (radius of 6”, 150 mm).Joint testing is used to assess the performance of existing joints totransfer loads across slabs in rigid and composite pavements. Inaddition, joint testing can be used to determine the presence of voidsunder the slabs at the joints. Corner testing is used to assess theperformance of existing corners (most highly stressed area of theslab) to transfer loads across slab corners in rigid pavements. Inaddition, corner testing can be used to determine the presence ofvoids under the corners of the slab. Use the table below todetermine the appropriate FWD test type for a given section. Figure2, 3, and 4 present the three FWD test types for the variouspavement types.
Pavement Type Test Type Load Plate Type Test Point Location in Lane
Flexible Basin Small (6” radius) Right Wheel Path
Basin Small (6” radius) Right Wheel Path / Mid slab
Joint Small (6” radius) Right Wheel Path / At joint
Rigid
Corner Small (6” radius) Corner of Slab / At joint
Basin Small (6” radius) Right Wheel Path / Mid slabComposite
Joint Small (6” radius) Right Wheel Path / At joint
Subgrade/UnboundBase
Basin Large (9” radius) Right Wheel Path
Responsible Party – Engineer

Pavement Design Procedures FWD Testing
Updated 11/1/2002 III-72
Flexible Rigid Composite
- FWD load plate
Figure 2 – FWD Basin Testing

Pavement Design Procedures FWD Testing
Updated 11/1/2002 III-73
Flexible Rigid CompositeNo Joint Testing Applicable
- FWD load plate
Figure 3 – Joint Testing
No Joint Testing Applicable

Pavement Design Procedures FWD Testing
Updated 11/1/2002 III-74
Flexible Rigid Composite
- FWD load plate
Figure 4 – Corner Testing
No Corner Testing Applicable No Corner Testing Applicable

Pavement Design Procedures FWD Testing
Updated 11/1/2002 III-75
Step 7. Determine sensor spacing of geophones on the FWD. There are fourbasic sensor spacing configurations, two for basin testing and two forjoint/corner testing. In basin testing, the critical locations for thesensors are on and next to the load plate and those furthest awayfrom the load plate. The sensor on the load plate provides layermaterial characteristic information about the entire pavementstructure. The further away you move from the load plate thosesensors provide information about pavement layers deeper in thepavement structure. The outer most sensors provide informationabout the subgrade performance. One of the two basin test sensorspacing configurations shown below is for typical basin testing, theother is for basin testing on subgrade or unbound base layers.There are only two critical sensors locations for joint testing. Thosecritical locations are the sensors on either side of the joint. If onlyjoint testing is required without basin testing, then one sensor can beplaced at (–12”) and the other at 0”. If basin testing is to becompleted in combination with joint testing, the typical basin testingsensor spacing configuration can be modified to allow for both testingin a single pass of the FWD by moving the sensor at 8” to 18”. Anexample of both of the joint testing sensor spacings is presented inFigure 5a/b and Figure 6a/b.The table below lists the four basic sensor spacing configurations.This table is based on a FWD configuration with 7 sensors. Thelatest Dynatest FWD equipment configuration has nine sensors. IfMDSHA upgrades its FWD equipment the sensor configuration willbe changed to reflect the additional two sensors.
Test Type Sensor Spacing
Basin 0”, 8”, 12”, 24”, 36”, 48”, 60”
Basin/Subgrade 0”, 12”, 18”, 24”, 36”, 48”, 60”
Joint -12”, 0”, 12”, 24”, 36”, 48”, 60”
Joint/Basin 0”, 12”, 18”, 24”, 36”, 48”, 60”
The sensor at 60” in basin testing is used to determine the subgradecharacteristics beneath the pavement structure. If an unusually thickpavement structure is existing, moving this sensor out to 72” isappropriate. An unusually thick pavement structure would be definedas a flexible pavement with > 16.0” of HMA, a rigid pavement withgreater than 11.0” of PCC, or a composite pavement with acombination of thickness greater than 14.0”.
Responsible Party - Engineer

Pavement Design Procedures FWD Testing
Updated 11/1/2002 III-76
Figure 5a : Joint Load Transfer Testing Sensor Spacing ID #3
Figure 5b : Joint Load Transfer Testing Sensor Spacing ID #3
PCC Slab(Approach Slab)
PCC Slab(Leave Slab)
Joint
Sensor at 0” Sensor at -12”Sensor at 12”Load Plate
Direction of Travel
PCC Slab(Approach Slab)
PCC Slab(Leave Slab)
Joint
Sensor at 0”Sensor at 12”Load Plate
Sensor at 24”
Direction of Travel
Sensor at 36”

Pavement Design Procedures FWD Testing
Updated 11/1/2002 III-77
Figure 6a : Joint Load Transfer Testing Sensor Spacing ID #7
Figure 6b : Joint Load Transfer Testing Sensor Spacing ID #8
HMA OL
PCC Slab(Approach Slab)
PCC Slab(Leave Slab)
Joint
Sensor at 0” Sensor at -12”Sensor at 12”Load Plate
Direction of Travel
PCC Slab(Approach Slab)
PCC Slab(Leave Slab)
Joint
Sensor at 0”Sensor at 12”Load Plate
Sensor at 24”
Direction of Travel
Sensor at 36”
HMA OL

Pavement Design Procedures FWD Testing
Updated 11/1/2002 III-78
Step 8. Determine the FWD Test Set-Up Identification number. Thisselection is based on the results from Step 6 and 7. The ID numberwill be used in the Field Work Request Form PD-05. This FWD TestSet-Up ID number will provide information concerning the test type,pavement type, and sensor spacing. Use the table below to selectthe proper FWD Test Set-Up ID number.
Test Set-Up ID Pavement Type Test Type Sensor Spacing
1 Flexible Basin 0”, 8”, 12”, 24”, 36”, 48”, 60”
2 Rigid Basin 0”, 8”, 12”, 24”, 36”, 48”, 60”
3 Rigid Joint -12”, 0”
4 Rigid Joint 0”, 12”
5 Rigid Corner -12”, 0”, 12”, 24”, 36”, 48”, 60”
6 Composite Basin 0”, 8”, 12”, 24”, 36”, 48”, 60”
7 Composite Joint -12”, 0”
8 Composite Joint/Basin 0”, 12”, 18”, 24”, 36”, 48”, 60”
9 Subgrade Basin 0”, 18”, 12”, 24”, 36”, 48”, 60”
Responsible Party - EngineerStep 9. Determine the FWD load package and drop sequence identification
number. This decision will dictate the force of the load applied to thepavement, the number of drops, the number of seating drops, andthe sequence of the drops. A seating drop is a load applied to thepavement to seat the load plate, perform a quality check on thesensors and load cell, and to warm the buffers beneath the weightson the FWD properly. No deflection or load data is recorded during aseating drop. It is typical to have at least one seating drop prior toany testing at a new test point and one seating drop prior to eachdrop height change. The height the weights of the FWD are raiseddictate the amount of load applied to the pavement. The are fourbasic drop heights known as 1, 2, 3, and 4. These heights typicallyresult in a load applied to the pavement of 6000 lbs., 9000 lbs.,12000 lbs., or 18000 lbs. The seating drops are done at the samedrop heights, but are know as A, B, C, and D. Therefore a loadpackage and drop sequence written as “BC3D4” would result in thefollowing:
- a seating drop at 9000 lbs. for a new test point,- a seating drop at 12000 lbs. for a new drop height,- a recorded drop at 12000 lbs.,- a seating drop at 18000 lbs. for a new drop height, and- a recorded drop at 18000 lbs.

Pavement Design Procedures FWD Testing
Updated 11/1/2002 III-79
The pavement type and thickness and FWD test type dictate the loadpackage. Use the table below to select the proper load package anddrop sequence for your particular section within a project. Additionaldrops and sequences can be selected, the list in the table below isonly a typical range of acceptable load packages and sequences.
Load Package ID PavementType
HMAThickness
Test Type Load Package andSequence
1 Flexible < 4” Basin BA1B2
2 Flexible > 4” and < 8” Basin BB2C3
3 Flexible > 8” Basin BB2D4
4 Rigid N/A Basin BC3D4
5 Rigid N/A Joint BB2C3D4
6 Composite N/A Basin BC3D4
7 Composite N/A Joint BB2C3D4
8 Composite N/A Joint/Basin BB2C3D4
9* Subgrade N/A Basin AA1B2
Note: Every effort should be made to ensure that at least 18,000 lbs. is achieved atdrop height 4 for rigid and composite pavements. In some cases, exceptionally thickor strong rigid or composite pavements, it may be necessary to apply greater than18,000 lbs. to the weight by adding additional weight to the FWD.
* The weights may need to be removed completely if FWD testing is to be completedon exceptionally weak soils or subgrade.
Responsible Party - Engineer
Step 10. Determine the test point spacing for each FWD test section. Thelength of the project, pavement type, and FWD test type dictates thetest point spacing. The basic goal of SPID and the FWD team is tocollect 150 test points per day. Our test spacing should be based ona test collection pace of 150 test points per day and the assumptionthat on average 1 project is completed per work-day. The tablebelow shows general guidelines for how those 150 test points shouldbe distributed among the different FWD test types.
Pumping Evident No PumpingPavement
Type Basin Joint Corner Basin Joint Corner
Flexible 150 N/A N/A N/A N/A N/A
Composite 25 125 N/A 50 100 N/A
Rigid 25 75 50 50 50 50

Pavement Design Procedures FWD Testing
Updated 11/1/2002 III-80
A typical point test spacing for a two lane undivided roadway isprovided in the table below. This is to be used as a guideline, butnumerous other engineering, FWD testing, MOT, and schedulefactors may alter the test point spacing. The typical test pointlocation is shown in Figure 2, 3, and 4. Testing done in bothdirections should be staggered as shown in figures 2 through 4 toensure a more efficient coverage of the project length. The test pointspacing in the table below is based on completing all FWD testing inone workday.
Test Point SpacingFlexible Composite Rigid
ProjectLength
(Centerline)Test Type N
oPu
mpi
ngEv
iden
t
Pum
ping
Evid
ent
No
Pum
ping
Evid
ent
Pum
ping
Evid
ent
3 miles Basin 250’ 640’ / 16th
slab1280’ /
32nd slab640’ / 16th
slab1280’ /
32nd slab
2 miles Basin 175’ 400’ / 10th
slab840’ /
21st slab400’ / 10th
slab840’ /
21st slab
1 mile Basin 100’ 200’ / 5th
slab400’ /
10th slab200’ / 5th
slab400’ /
10th slab
< 1 mile Basin 50’ 160’ / 4th
slab200’ / 5th
slab160’ / 4th
slab200’ / 5th
slab
3 miles Joint N/A 280’ / 7th
slab240’ / 6th
slab640’ / 16th
slab400’ /
10th slab
2 miles Joint N/A 200’ / 5th
slab160’ / 4th
slab400’ / 10th
slab280’ / 7th
slab
1 mile Joint N/A 120’ / 3rd
slab80’ / 2nd
slab200’ / 5th
slab120’ / 3rd
slab
< 1 mile Joint N/A 80’ / 2nd
slab
40’ /everyslab
160’ / 4th
slab80’ / 2nd
slab
3 miles Corner N/A N/A N/A 640’ / 16th
slab640’ /
16th slab
2 miles Corner N/A N/A N/A 400’ / 10th
slab400’ /
10th slab
1 mile Corner N/A N/A N/A 200’ / 5th
slab200’ / 5th
slab
< 1 mile Corner N/A N/A N/A 160’ / 4th
slab160’ / 4th
slab
At minimum, at least 30 test points should be collected per directionfor any project of reasonable length. Thirty test points in onedirection provide the minimal amount of information about the stretchof roadway to identify weak/strong areas and adequatelycharacterize the structural capacity of the pavement. Projects longerthan 3 centerline miles should be considered more than a more dayoperation for FWD testing.

Pavement Design Procedures FWD Testing
Updated 11/1/2002 III-81
Projects containing several different sections because of differentpavement types should have testing broken down according to thepercentage of each pavement type. Therefore, if half the project iscomposite and half is flexible, a one-day test point spacing should be50% of the test point spacing typically done for each pavement type.
Responsible Party - Engineer
Step 11. Complete the Field Work Request Form (PD-05) using theinformation gathered in Steps 1 through 10 of this section, FWDTesting. The work completed Step 8 provided the information forFWD test set-up, Step 9 provided information for the load package,and Step 10 provided information about the test point spacing. OnForm PD-05 complete the date of the request and the requestedcompletion date for the FWD testing. Once the form is filled out, givethe request form to SPID.
Responsible Party - Engineer
Step 12. Schedule FWD testing and MOT for testing for the submitted request.Every attempt should to schedule the testing in order to have itcompleted by the requested completion date.
Responsible Party - SPIDStep 13. The pavement design engineer and SPID should meet and discuss
the testing to ensure that all facets of the FWD testing areunderstood. Specific details about the project, testing, and otherconcerns can be addressed at this time.
Responsible Party – SPID and EngineerStep 14. Set-up the Dynatest FWD software for the FWD testing of the specific
section in the project. Use the following criteria when establishingthe software test set-up:
• Always store the length measurement in the FWD software infeet/stations, not miles, unless requested otherwise.
• Store FWD test type in the Lane field in the software, in addition tothe lane number; i.e. using “B” for basin, “J” for joint testing, and“C” for corner testing. For instance, joint testing in lane 1 wouldhave “J1” in the lane field and basin testing in lane 2 would have“B2” in the lane field. Testing in the shoulder will not have anumber, but rather a “S” in place of the number. Therefore, basintesting in the shoulder will be “BS”.
• For load transfer testing, the sensor spacing will dictate thepopulation of the test type field in the Dynatest software. Whenjoint testing with a sensor at (–12) inches, it shall be entered as“Approach” joint testing. When joint testing with a sensor at (+12)inches, it shall be entered as “Leave” joint testing.
• Create a separate electronic file for each direction for each sectionin the project, unless requested otherwise.

Pavement Design Procedures FWD Testing
Updated 11/1/2002 III-82
• Name the electronic file with the FWD data by the route, routenumber, route suffix, and direction. For instance testing on MD 32would have a filename of “MD32WB.FWD” and “MD32EB.FWD” Responsible Party - SPID
Step 15. Complete the FWD testing following the guidelines established in theoperations manual of Dynatest. Specific test set-up is provided in thefield work request form, Pavement Guide, and discussions with thepavement design engineer.
Responsible Party - SPIDStep 16. Measure the surface and air temperature regularly during FWD
testing and record it in the Dynatest FWD software. Make sure toindicate in the software that the temperature recorded is eithersurface or air. Only classify the temperature as mid-depthtemperature when the pavement surface is drilled, filled with mineraloil, and measured with a temperature probe.
Responsible Party – SPIDStep 17. Proper Quality Control shall be followed during the testing to ensure
that sensors and load cells stay within tolerable limits. Commentsand field notes about a particular point should be placed in thecomments field in the Dynatest software. A separate hand writtensheet is only needed if requested by the pavement design engineerwhen the temperature and field notes are added into the Dynatestsoftware program.
Responsible Party – SPIDStep 18. Provide the FWD file and hard copy printout of the deflection/load
results to the responsible pavement design engineer after FWDtesting is completed.
Responsible Party - SPIDStep 19. Quality Assurance shall be completed on the FWD data to ensure the
data is a good quality and free of data collection errors priorperforming data analysis. It is planned to develop a softwareprogram to assist in the QA of the FWD data. Complete FWD dataQA Form (PD-06c) after reviewing the FWD data for QA. The QA willinvolve, but not limited to the following:
• Eliminate test points with non-decreasing deflections
• Eliminate test points with sensors with “Out of Range” errors.
• Review recorded loads to ensure that erroneous measurementsare not recorded. Responsible Party – Engineer

Pavement Design Procedures FWD Testing
Updated 11/1/2002 III-83
III.I.4 FWD Testing Process Flowchart
Establish ProjectFeatures
Steps 1 - 5
Engineer
Use PD-04 and sitevisit information for
assistance
FWD Testing Set-Up
Steps 6 - 10
EngineerProject Sketch
PD-05
Communication withSPID
Steps 11 and 13
FWD Testing
Steps 14 -16
SPID
QC of FWD Testing
Steps 17 - 19
PD-06c FWD TestData QC
Engineer and SPID
Engineer
FWD electronic andhard copy file

Pavement Design Procedures FWD Data Analysis
Updated 11/1/2002 III-84
III.J FWD DATA ANALYSIS
III.J.1 PurposeFWD Data Analysis is conducted to:
• Verify the accuracy of FWD Data• Sub-section the FWD data in analysis sections• Determine general characteristics of analysis sections• Determine the structural capacity of the pavement structure and individual
pavement layers• Estimate the load transfer ability of joints in jointed rigid and composite
pavements• Report FWD analysis results in a form conducive to pavement rehabilitation
design
III.J.2 Resource RequirementsThe FWD Analysis procedure documented below requires the following staffing needsfor a typical job:
Position Function Resources Effort Level(man-hours)
Staff Engineer or Project Engineer Quality Control of FWD Data 1 1Staff Engineer or Project Engineer Pre-Process FWD Data 1 1Staff Engineer or Project Engineer Backcalculation Analysis of FWD
Data1 6
Staff Engineer or Project Engineer Quality Assurance ofBackcalculation Analysis
1 2
Staff Engineer or Project Engineer Reporting/Summary of AnalysisResults
1 3
III.J.3 ProcedureThe basic concept of FWD testing is to simulate typical traffic loads and monitor thedeflection response of the pavement structure from that load. FWD analysis is thescience of taking recorded deflections and loads and using knowledge of pavementmaterial characteristics to estimate the existing material properties of the pavementstructure. The primary data collected from FWD testing is a measured vertical load andthe resulting deflections in the pavement surface measured at radial distances from theload. The largest deflection from the load occurs under the load plate and decreasesoutwardly from the load plate. Deflections under the load plate provide an indication ofthe material properties of all the layers at that location. As recorded deflections movefurther away from the load plate, the data is representative of the layers deeper into thepavement structure with less influence from the layers near the surface. This concept ispresented in the following figure.

Pavement Design Procedures FWD Data Analysis
Updated 11/1/2002 III-85
The process of developing pavement layer properties from FWD data requiresknowledge of the art/science of analyzing loads and deflections and a goodunderstanding of pavement engineering and material properties. The MDSHAPavement Division’s process for checking FWD data quality, developing materialproperties for pavement rehabilitation design, and quality checks of the analysis aredescribed in this Section. It is the desire of the Pavement Division to develop a softwaretool to assist pavement designers to perform the majority of the steps involved in theFWD Analysis Section. At this time, that software tool does not exist for MDSHA.Therefore, this Section will not be written with specific step-by-step instructions, butrather objectives and concepts needed by the pavement design engineer to accomplishthe task of FWD data analysis. Several of the general headings in the FWD DataAnalysis Section at this time will need to be completed by hand, through engineeringjudgment, or using an assortment of software tools available to MDSHA at this time.The AASHTO pavement design software (DarWin), the backcalculation analysissoftware MODULUS 5.1, and several in-house software applications are capable ofassisting the engineer perform some of the sections described below. The followingoutline and description should be used to assist the engineer following the necessaryprocess to complete FWD data analysis.

Pavement Design Procedures FWD Data Analysis
Updated 11/1/2002 III-86
1.0 Quality Assurance of FWD Data1.1 Non-Decreasing Deflections1.2 Out of Range Errors1.3 Error Comments
2.0 Pre-process FWD Data2.1 Select FWD Load (drop height/s)
- Normalize Deflection Data2.2 Composite Modulus Plots
- Non-linear Soils- Erroneous Sensor Readings- Select # of Sensors to Analyze
2.3 Select Distinct Sections- Recorded Distinctions: Test Type, Lane, and Field Comments- Sensor/Deflection vs. Station- Cumulative Sum
3.0 Analysis of FWD Data3.1 Flexible Standard Calculations:
- Resilient Modulus of the Subgrade- Composite Modulus of Pavement Layers Above Subgrade- Effective Structural Number- Individual Layer Coefficients- Temperature Correction Factor
3.2 Rigid/Composite Standard Calculations:- Slab Bending Factor / AC Compression Factor- Load Transfer Efficiency (LTE)
- Void Detection- Area Method- Radius of Relative Stiffness- Modulus of Subgrade Reaction- PCC Elastic Modulus
3.3 Backcalculation Software- Use Modulus, WESDef, Modcomp, EverCalc, or other tools
4.0 Quality Control of FWD Analysis4.1 Percent Sensor Error4.2 Layer Moduli Reasonable Ranges4.3 Data Reasonableness Checks
5.0 Reporting/Summary of FWD Data Analysis Results

Pavement Design Procedures FWD Data Analysis
Updated 11/1/2002 III-87
III.J.3.1 Quality Assurance of FWD DataThe accuracy and reasonableness of the FWD analysis is only as good as the quality ofdata collected during testing. There are several internal quality control checks (QC) inthe FWD testing software to flag erroneous data. In these cases, the data is stillcollected are stored in the data file, but coupled with an error message. The FWD QCchecks are focused on obvious sensor and load cell errors and other equipmentmalfunctions. Data reasonableness also needs to be verified through quality assurance(QA) by the pavement design engineers after the data has been collected andsubmitted. This sub-section describes the steps needed to check the FWD data forerrors, data reasonableness, and quality. The following headings should be viewed, asthe general steps needed to assure the quality of the FWD data.
III.J.3.1.1 Non-Decreasing DeflectionsAn accurate FWD test data point has sensor readings with deflections that shouldtypically continually decrease as the sensors are placed further away from the loadplate. The case where the sensor readings do not decrease, i.e. (in mils) - 20, 15, 10, 5,8, 4, 2, the FWD test point is considered to have non-decreasing deflections. There areseveral reasons for non-decreasing deflections including the following:
• Sensor reading error,
• Sensor on piece of debris or crack,
• Severely deteriorated pavement surface,
• Pavement change boundary within range of sensors.The FWD test points with non-decreasing deflections need to be eliminated as outliersand not used any further in the analysis. Looking through the raw FWD data cancomplete the QA check for non-decreasing deflections. This is a QA check that will becompleted with the future FWD analysis software tool.
III.J.3.1.2 Out of Range ErrorsEach sensor on the FWD that records deflection has a total range of vertical movementavailable for recording data. An “out of range” error occurs when the maximum verticalmovement of the sensor has been exceeded. The FWD software that collects the testdata also recognizes the fact that the maximum sensor measurement has beenexceeded and tags an “out of range” error along with the specific test point data for thatsensor. There are several reasons for “out of range” deflections including the following:
• Sensor reading error,
• Severely deteriorated pavement surface,
• Weak structural capacity of the pavement structure,
• Load applied to pavement is too great for existing structure.
The FWD test points with an “out of range” error need to be eliminated as outliers andnot used any further in the analysis. If a significant number of out of range errors areencountered during testing, the load package may need to be lowered because the loadmay be too great for the existing pavement structural capacity. If the load package is notaltered in the field and cores indicate a thin pavement structure, additional testing at alower load may need to be completed. Looking through the raw FWD data can complete

Pavement Design Procedures FWD Data Analysis
Updated 11/1/2002 III-88
the QA check for out of range errors. This is a QA check that will be completed with thefuture FWD analysis software tool.
III.J.3.1.3 Field Error CommentsThe FWD operator shall record any important unusual field information for each testpoint in the comment field in the FWD data collection software. Occasionally, the FWDoperator will provide comments that indicate the test point may need to be eliminatedfrom data analysis. The FWD test points with error comments need to be eliminated asoutliers and not used any further in the analysis. Looking through the raw FWD data cancomplete the QA check for error comments. This is a QA check that will allow the fieldcomments to be viewed with the future FWD analysis software tool, but the engineer willmake the final determination of whether the data point is to be used in analysis.
III.J.3.2 Pre-Process FWD DataOnce FWD data has been ensured for reasonableness and accuracy, the data is furtherprocessed to arrange it into logical and manageable sub sets that will be used tocomplete the data analysis. The outline steps in this sub-section are designed to assistthe pavement designer to filter out the most beneficial FWD test data and establishsections for further analysis. Analysis sections are pavement sections with similarpavement structures and similar performing pavement materials properties.
III.J.3.2.1 Select FWD LoadThe typical roadway load plate is approximately 5.91” in radius and is designed to mimicthe contact area patch of a dual tire load from an 18-kip axle. Therefore, to simulate an18-kip axle load, the 9,000-pound load level or FWD drop height #2 should be used inFWD analysis. In some cases in the MDSHA roadway network, the pavement structureis significantly thick and a 9,000-pound load will not allow a sufficient amount of load tobe transferred to the lower layers in the pavement structure. In these cases, a largerload applied should be analyzed in addition to the to the 9,000 pound load. Guidelinesfor the designer to select the appropriate FWD load package are outlined in Section III.I“FWD Testing”.A deflection versus station plot allows the designer to identify weak areas and todelineate sections that are performing differently. In order to view a deflection versusstation plot accurately, every load should be normalized to the same standard load.Although the same drop height maybe applied to consecutive points, the actualmeasured applied load may vary due to slight variations in the pavement structure andFWD mechanical equipment. Normalizing the deflections will eliminate these slightchanges in load allow numerous test points to be compared equally. The collecteddeflection is converted into normalized deflection by equating the measured load to anormal load. The following equation shows the process to normalize a deflection to9,000 pounds:
Measured Load = 9,252# Measure Deflection = 15.2 mils Normal Load = 9,000#
Normalized Deflection = 15.2 * (9,000 / 9,252) = 14.8 mils
Several different drop heights are typically recorded at each test point. Some materialsbehave differently depending on the amount of load that applied; these are called “stress

Pavement Design Procedures FWD Data Analysis
Updated 11/1/2002 III-89
sensitive” or “non-linear“ materials. Applying more than one load provides anopportunity for the pavement design engineer to identify this type of material. Therefore,a stress-sensitive pavement structure can be identified if two separate FWD dataanalysis runs with different load levels result in different material properties at the sametest point. If different loads result in similar FWD data analysis results, then thepavement layers can be considered not to contain stress sensitive material. In eithercase, the selection of one, several, or all the load levels applied to the pavement via theFWD need to be selected and filtered for analysis.
III.J.3.2.2 Composite Modulus PlotsThe composite modulus of a pavement structure is a single-value representation of theoverall pavement stiffness based on the modulus of elasticity of all the pavement layersat a given point and radial distance from the load plate. The composite modulus is acomputed value based on the applied load, plate radius, sensor spacing, measureddeflection, and an assumed Poisson ratio of the entire pavement structure. A compositemodulus can be calculated for every test point at each sensor. The composite modulusis typically reported graphically to allow the designer to identify erroneous data or non-linear subgrade.The composite modulus derived from the sensor directly under the load provides arepresentation of the stiffness of all the pavement layers as a single layer system. Thecomposite moduli derived from the outer sensors lose the contributing effect of thestronger upper layers of the pavement while maintaining the influence of the subgradeand lower layers. Therefore, the composite modulus plot of all of the sensors from a testpoint should have a general decreasing or “half bowl” shape as the distance from theload increases. Sharp fluctuation or an irregular shaped composite modulus plot mayindicate an erroneous test point. The following two plots show a typical and an irregularshape composite modulus plot.
Typical Composite Modulus
0
100000
200000
300000
400000
500000
0 10 20 30 40 50 60 70
Sensor Spacing (in)

Pavement Design Procedures FWD Data Analysis
Updated 11/1/2002 III-90
The shape of the composite modulus plot can help to identify the presence of non-linearmaterials and subgrade. This is capable because the sensors further away from theload provide an indication of the material properties and behavior of the lower pavementlayers and subgrade. The amount of load experienced by the outer sensors decreasesthe as the distance from the load increases. Stress sensitive materials can eitherincrease or decrease in strength as the stress applied to the material increases.Typically with the materials in Maryland, the strength or stiffness of a stress sensitive ornon-linear subgrade is inversely proportional to the amount of the applied load.Therefore, a non-linear subgrade will appear to have a higher modulus with a lighter loadand as the applied load increases, the weaker the non-linear subgrade behaves. Thecomposite modulus plot allows the designer to identify non-linear subgrade because theamount of load decreases as the distance from the load increases and because thecomposite modulus is a numerical representation of the pavement stiffness at varyingdepths. Therefore, if at the outer sensors the composite modulus begins to increase, itis an indication of a non-linear subgrade. This is because the load is decreasing at theouter sensors, yet the composite modulus is increasing. The following compositemodulus is an example of plot displaying a pavement structure with a non-linearsubgrade.
Irregular Composite Modulus
0
100000
200000
300000
400000
500000
0 10 20 30 40 50 60 70
Sensor Spacing (in)

Pavement Design Procedures FWD Data Analysis
Updated 11/1/2002 III-91
Knowledge of the expected FWD data analysis tool and its specific technique forestimating the subgrade modulus are necessary when evaluating composite modulusplots. Most FWD data analysis tools use some type of combination of the outer sensordeflection and algorithms to estimate the subgrade modulus. Some FWD data analysistools use the farthest sensor from the load to estimate the subgrade strength. In thecase that a non-linear subgrade is present, the estimated subgrade modulus would betoo great if the last sensor were used in the calculation. The last sensor reading from atest point with a non-linear subgrade would be falsely greater because of the soilbehaving differently at varying loads. In the case of a pavement structure with a non-linear subgrade as we have in the previous plot, the subgrade modulus estimated fromdata collected from the sensor at 36” would produce a more representative subgrademodulus. The sensor reading at 36” provides a deflection based on the soil behavingwith the highest encountered load. In some cases like this, another FWD data analysisapproach may be needed to sufficiently estimate an accurate subgrade modulus. Ineither case, the designer needs to have the ability to eliminate sensor reading from theanalysis to develop accurate pavement properties through FWD data analysis.Therefore, in the case of the non-linear subgrade shown in the previous plot, the last 2sensors would not be used in the analysis to develop layer properties. Typically, allsoftware applications used for FWD data analysis need at least sensors out to 36” inorder to perform their internal algorithms.
III.J.3.2.3 Delineate Distinct SectionsThe FWD data collection software stores both test type and specific test point headerinformation. The header information can be used to sort out specific details of aparticular test point or a group of similar test points. The ability to sort out particulartests allows the pavement designer to analyze specific data points or areas of interestfor rehabilitation design. This type of header information includes, but is not limited to,the following:
• Test Type – Joint, Basin, Void, Subgrade
Non-Linear Composite Modulus Plot
0
100000
200000
300000
400000
500000
0 10 20 30 40 50 60 70
Sensor Spacing (in)

Pavement Design Procedures FWD Data Analysis
Updated 11/1/2002 III-92
• Test Lane – 1, 2, 3, …..
• Field Comments – FWD operator provides input about particular test pointoperations and pavement conditions
Refer to Section III.I “FWD Testing” for details about how header information is enteredand stored.In addition to header information, the normalized deflection data can be used todelineate similar sections of project for FWD data analysis. The response of a pavementstructure to a simulated traffic load can be used to identify thickness variations andareas of variability in material strengths. Variability in the pavement layer properties canbe observed by observing a plot of the normalized deflections versus station. To betterview the variations in material properties, each sensor can be viewed in a plot or onlyselected sensors. The most critical sensors to view in a normalized deflection plot arethe sensors at the load plate and the sensor farthest away from the load. These twoprovide an indication of the overall pavement structure (load plate sensor) and the onlythe subgrade (farthest sensor). The following plots are examples of normalizeddeflection plots versus station.
#1- Normalized Deflection vs Station
0
5
1015
20
25
30
35
0 500 1000 1500 2000 2500
Station
Do D6

Pavement Design Procedures FWD Data Analysis
Updated 11/1/2002 III-93
The #1 normalized deflection plot is a typical plot for a consistent pavement structurethroughout the testing limits. The #2 normalized deflection plot is a roadway that has adistinct pavement thickness or pavement material strength change from approximatelyStation 10+00 to 24+00. The pavement thickness is thicker or the material strength isgreater from Station 10+00 to 24+00 than the surrounding pavement, based on thedeflections in this area being significantly less. The pavement designer can select moreaccurate and beneficial locations for coring with this type of deflection plot information.In addition to assisting in the determination of core locations, this section of roadwaymaybe be designed and analyzed separately than the rest of the roadway and possiblyhave a separate pavement rehabilitation strategy.In many cases, the normalized deflection versus station plot does not show a pavementmaterial variation as distinctly as in plot #2 from above. The normalized deflection plotscan have more data noise and variation from point to point making identification of aseparate performing section difficult, especially with numerous consecutive data points.However, there is an algorithm using the average deflection within a test section todevelop a plot to determine unique pavement sections. The algorithm method is calledcumulative sum. The cumulative sum of deflection method is recommended byAASHTO to delineate section based on FWD data and is outlined in Appendix J of the“1993 AASHTO Guide for the Design of Pavement Structures.”The cumulative sum algorithm produces a function for interpreting trends in thepavement structure from FWD deflection data. Calculating the average deflection foreach sensor for all the test points within a test section is the first step in the cumulativesum algorithm. A substantial number of test points, at least 30, are needed in order todevelop a stable average and make the algorithm statistically significant. The next stepinvolves stepping through each test point and summing up the deflections. At each testpoint and sensor, the cumulative sum of the deflection is compared to the averagedeflection for that sensor multiplied by the total number of test points at that location.This cumulative difference is then plotted versus station. Upon viewing this plot, it is
#2- Normalized Deflection vs Station
0
5
10
15
20
25
30
35
0 500 1000 1500 2000 2500
Station
Do D6

Pavement Design Procedures FWD Data Analysis
Updated 11/1/2002 III-94
highly probable that there is a change in pavement properties at locations in the plotwhere the slope significantly changes. The following plot shows is an example of typicalcumulative sum plot.
As with the normalized deflection plot, the cumulative sum plot can be done for any ofthe sensor locations, but the sensor at the load and farthest from the load are the mostimportant to view initially. In the case of the plot above, two statistically homogeneousunits can be identified. The change in pavement material properties is at approximatelystation 32+50. This change could be a difference in thickness or material strengthproperties. In either case, cores taken in both sections would verify the case and allowthe pavement designer to analyze these sections separately for design.
III.J.3.3 Analysis of FWD DataThe analysis of FWD data involves evaluating the measured load and resultingdeflections to determine the material properties of the pavement structure. A typical“forward” material calculation requires knowledge of the material properties and thedeflection is estimated based on the applied load. The use of FWD requires a “back”calculation method because the deflections and load are known and the materialproperties are estimated. This method of obtaining the material response and estimatingthe material properties is called “backcalculation.”The FWD applies a simulated dual tire load to the pavement through a 12.0” diametercircular load plate for paved surfaces. The amount of load a particular pavement layerexperiences is based on the depth of the layer in the pavement structure. The deeper apavement layer is in the pavement structure, the less the amount of stress the layer issubjected to from the load. This decreasing stress is a result of the vertical load beingdistributed outwardly in a stress zone down and out from the load plate into thepavement structure.
Cumulative Sum
0
5
10
15
20
25
30
35
0 500 1000 1500 2000 2500 3000 3500 4000 4500 5000
Station
Do D6

Pavement Design Procedures FWD Data Analysis
Updated 11/1/2002 III-95
The distribution of FWD load allows the individual pavement layer properties to beestimated through backcalculation. From the load plate, the load is distributed outwardlyand down into the pavement structure at approximately a 30° angle. This angle variesdepending on the various layer properties. Directly under the load plate, the sensordeflection reading provides an indication of the layer properties of all the pavementlayers at that point. The sensor deflection readings further away from the load plateprovide an indication of the layer properties of the pavement layers deeper into thepavement at that point. This concept is presented in the following figure.
III.J.3.3.1 Flexible Standard CalculationsThe type of data analysis is dependent on the pavement type. More information aboutthe structural capacity of the pavement can be obtained through FWD testing of flexiblepavement. Subgrade strength values and overall composite modulus of the pavementstructure can be obtained from flexible pavement FWD testing. These values can beused directly in pavement rehabilitation design to assist in determining the effectivestructural capacity. The following sub-sections describe the FWD data analysisprocedures for flexible pavements.
III.J.3.3.1.1 Resilient Modulus of SubgradeEfforts shall be made to verify the subgrade resilient modulus calculated from FWDtesting is consistent with laboratory testing similar to that used to develop the subgradevalues in the AASHO Road Test subgrade. Typically, subgrade resilient modulus resultsobtained from dynamic field testing, FWD testing, will be less conservative and givehigher results than those obtained in the laboratory. This is because laboratory testingused for the subgrade at the AASHO Road Test was static load testing, CBR testing.The difference in testing mechanisms between static laboratory testing and dynamic fieldtesting will provide different strength properties of the subgrade. Therefore, any dynamictesting must be correlated to laboratory testing.
HMA/PCC
GAB/Base
Sensor at 0” SensorsLoad Plate
Subgrade
Zone of Stress

Pavement Design Procedures FWD Data Analysis
Updated 11/1/2002 III-96
The AASHTO equation to calculate the subgrade resilient modulus from FWD testing isthe following:
Mr = (0.24 * P) / (dr * r)where: Mr = resilient modulus of the subgrade
P = applied load , poundsdr = measured deflection at radial distance r, inchesr = radial distance of measured deflection, inches
The key to this equation is selecting the radial distance to ensure the measureddeflection is due to the subgrade and not other layers, but yet close enough to the loadplate to ensure data accuracy. The minimum distance can be determined using thefollowing AASHTO equation:
r >= 0.7 * aewhere: ae = radius of the stress bulb at the subgrade-pavement
interface, inches
The stress bulb is calculated using the following AASHTO equation:
��
���
��
���
��
���
+=
2
3r
p2e
ME*Daa
where: a = FWD load plate radius, inchesD = total pavement thickness of pavement layers abovethe subgrade, inchesEp = effective modulus of all pavement layers above thesubgrade, psi
Based on the equations provided above, the resilient modulus can not be calculatedwithout the effective modulus of all pavement layers above the subgrade. Yet, theeffective modulus of all pavement layers above the subgrade cannot be calculatedwithout the subgrade resilient modulus. Therefore, an iterative process is required toobtain both values using the equations provided above. However, engineeringjudgement can be used coupled with information from composite modulus plots toestimate the sensor to use to obtain the resilient subgrade modulus. To ensure that thesensor is only recording the effect from the subgrade, use the furthest sensor away fromthe load plate that does not show effects of a non-linear subgrade to calculate thesubgrade resilient modulus. Composite modulus plots and non-liner subgrade itemswere discussed in a previous section about pre-processing FWD data.
The resilient subgrade modulus calculated from the equations above provides the resultsas measured through dynamic testing at not correlated to laboratory testing. The correctmethod is develop a local agency correlation factor by performing a study to develop arelationship between subgrade resilient results obtained from FWD data analysis andthose from laboratory testing. However, AASHTO provides a general guideline of one-third the calculated subgrade resilient modulus from FWD data analysis shall be used forthe design subgrade resilient modulus. Therefore, the AASHTO equation to calculatesubgrade resilient modulus results in the following:
Mr = C * ((0.24 * P) / (dr * r))

Pavement Design Procedures FWD Data Analysis
Updated 11/1/2002 III-97
where: C = field to laboratory correlation for subgrade resilient modulus. This value is typically 0.33.
III.J.3.3.1.2 Composite Modulus of Pavement Layers Above SubgradeThe composite modulus, or the effective modulus, is the measure of the strength of allthe pavement layers above the subgrade in the pavement structure. This value providesan indication of the overall strength of the pavement structure at the test point. This canbe used to compare with other sections to identify change in pavement structure orpavement layer material strengths. The composite modulus is also needed to calculateboth the radius of the stress bulb at the subgrade-pavement interface and the effectivestructural capacity (structural number – SN) of the pavement structure. In order tocalculate the composite modulus, both the total thickness of all the layers abovesubgrade and the subgrade resilient modulus need to be known. This information andthe deflection from FWD testing directly under the load plate, is used in the followingequation to calculate the composite modulus:
������������
�
�
������������
�
�
�����
�
�
�
��
�
�+
−
+
���
�
�+
=p
2
2
3r
pr
oE
aD1
11
ME
aD1*M
1*a*p*1.5 d
where: do = deflection measured at the center of the load late(adjusted to a standard temperature of 68° F), inchesp = FWD load plate pressure, psia = FWD load plate radius, inchesD = total thickness of pavement layers above subgrade,inchesa = FWD load plate radius, inches
The calculation of composite modulus is also an iterative process with the temperature-corrected deflection under the load, based on the equation above. All deflections needto be adjusted to a reference temperature of 68° F for comparison purposes and to alsofollow the AASHTO deflection analysis procedure.
III.J.3.3.1.3 Effective Structural NumberThe effective structural number for flexible pavements is calculated based on theassumption that the structural capacity of a pavement is a function of the total thicknessand the composite modulus of the pavement structure above subgrade. Use thefollowing equation to calculate the effective structural capacity for flexible pavements:
3 peff E*D*0.0045SN =where: SNeff= effective structural capacity.

Pavement Design Procedures FWD Data Analysis
Updated 11/1/2002 III-98
III.J.3.3.1.4 Individual Layer CoefficientsIn some cases, the individual layer modulus will be backcalculated from deflection data.From the individual layer modulus, the AASHTO layer coefficient can be calculated. Thelayer coefficients for each pavement layer are estimated based on the ratio of a typicalasphalt concrete layer modulus 930,000 psi, with a layer coefficient of 0.44. Theindividual layer coefficient, for a given layer modulus, is calculated with the followingequation:
( )( )3
2
2ii
i 0.35-1930000µ-1*M*0.44a =
where: ai = layer coefficentMi = layer modulusµi = Poisson’s ratio of layer
III.J.3.3.1.5 Temperature Correction FactorIn order to allow to equal comparisons between FWD test points done at different undervarying weather and temperature conditions, all test data needs to be corrected to areference temperature. The material properties of a majority of pavement materials aretemperature dependent, some material like hot mix asphalt are more temperaturesusceptible than other materials. The same flexible pavement structure may providedrastically different strength characteristics in Maryland at mid-day testing in August thanin the morning testing in late October. Therefore, all FWD testing data must becorrected to a reference temperature of 68° F for valid comparison. There are two basicways to correct for temperature, either the measured deflection can be corrected or theresulting calculated modulus could be corrected to the reference temperature. Theequations used by AASHTO, and those used in DarWin software, require the correctionto occur for the deflection.
Temperature correction curves for deflections are contained on pages III-99 and III-100in the 1993 “AASHTO Guide for Design of Pavement Structures.” DarWin uses theseequations within the software calculations. These curves will be used to temperaturecorrect deflection for MDSHA pavement design projects. The BELLS equation will beused to temperature correct the backcalculated modulus for MDSHA pavement designprojects. The BELLS equation calculates the mid-depth HMA temperature andcalculates an adjustment factor to be applied to the uncorrected layer modulus. Thereare several other methods to temperature correct modulus values that are used byMDSHA, including Asphalt Institute and Washington DOT.
III.J.3.3.2 Rigid/Composite Standard CalculationsThe type of data analysis is dependent on the pavement type. More information aboutthe material properties can be obtained through FWD testing of rigid and compositepavement. Subgrade strength values, slab bending /compression factors, joint loadtransfer efficiency, void detection, and PCC material properties can be obtained fromrigid and composite pavement FWD testing. These values can be used directly inpavement rehabilitation design to assist in determining the effective structural capacityand used to assist in making rehabilitation strategy decisions. The following sub-sections describe the FWD data analysis procedures for composite and rigid pavements.
Pavement Design Procedures FWD Data Analysis
Updated 11/1/2002 III-99
III.J.3.3.2.1 Slab Bending Factor / AC Compression FactorThe slab bending factor / AC compression factor (B) is used in the calculation of loadtransfer efficiency of joints in rigid and composite pavements; slab bending factor forrigid pavements and AC compression factor for composite pavements. This factorcorrects for the differential bending of the slab under vertical loading in rigid andcomposite pavements. It also accounts for the compression of the AC material underloading in composite pavements. This correction is needed because of the slight slabbending that occurs even when testing sound concrete at the center of the slab. Eventhe deflections measured at the first 2 sensor locations at the center of a slab, withtheoretically 100% load transfer efficiency, would not be equal. Several basin tests atthe mid-slab away from the joints are needed to develop a reasonable bending factor(B). The bending/compression correction factor is obtained from the ratio of deflectionunder the load plate to the deflection 12.0” away from the center of the load plate, for atypical center slab location. Typical values for B range from 1.05 and 1.20. Valuesabove 1.25 should be reconsidered prior to using for analysis based on reasonable data.It is reasonable and conservative to base all load transfer analysis on a bending factorequal to 1.0.
III.J.3.3.2.2 Load Transfer EfficiencyLoad transfer efficiency is used in the AASHTO rigid and composite pavement designprocedures. MDSHA Pavement Division also uses load transfer efficiency to assist indetermining the type of pavement rehabilitation and pre-overlay repair strategies. Loadtransfer efficiency is calculated by taking a percentage value of the deflection measuredon the unloaded side of a joint to the deflection measured on the loaded side of a jointfrom FWD testing. Load transfer efficiency (LTE) is calculated with the followingequation:
LTE = (d1 / d0) * 100where: LTE = load transfer efficiency, percentage
d1 = deflection measured on unloaded side of joint, millsd0 = deflection measured on unloaded side of joint, mills
Load transfer efficiency can also be calculated using the slab bending / AC compressionfactor (B), discussed previously. Load transfer efficiency (LTE) with the bending factor(B) is calculated with the following equation:
LTE = B * (d1 / d0) * 100where: B = bending / compression factor
Load transfer efficiency is the widely used tool to assess the joint performance. Thesame deflection data can be used to calculate differential deflection which maybemore relevant to the rate of deterioration of joints and cracks, and to the likelihood ofreflection cracking in asphalt overlays. Differential deflection is the absolute differencebetween the loaded joint side deflection minus the unloaded joint side deflection. Even ifa definitive differential deflection value has yet to be established, poorer performingjoints can definitely be distinguished from those that are performing well.
III.J.3.3.2.3 Void DetectionVoid detection analysis is used to identify joints that have lost base material under theconcrete slab. AASHTO identifies three ways to assist in determining voids under slab;MDSHA Pavement Division will only use one of those methods for recommendation

Pavement Design Procedures FWD Data Analysis
Updated 11/1/2002 III-100
production means. FWD testing for void detection involves corner testing at three loadlevels, typically 6, 9, and 12 kips; greater loads can be used depending on the thicknessand type of pavement structure. The deflection versus load plot is produced for eachtest location in order to identify the presence of voids. If no voids exist, the slope of theline between the three load drop points will cross very near the origin (less than 2 mills).When the slope of the line crosses further away from the origin (greater than 2 mills), thepresence of a void is expected. This method identifies the presence of a void, but doesprovide any indication as to the size of the void. The graphs below demonstrate thisconcept.
Example without Void
0
5000
10000
15000
20000
0 10 20 30 40 50
Deflection (mills)
Example with Void
0
5000
10000
15000
20000
0 10 20 30 40 50
Deflection (mills)

Pavement Design Procedures FWD Data Analysis
Updated 11/1/2002 III-101
III.J.3.3.2.4 Area MethodA simple two-layer pavement system approach to backcalculation of FWD data that isused to determine the structural capacity of rigid and composite pavements is the AREAmethod. Each FWD test measures the load and resulting deflection basin from thatapplied load. The size and shape of the deflection basin provides an indication of thestructural capacity of the pavement structure at the test point. Therefore, the AREAmethod uses the deflection basin to calculate the pavement structural capacity. Forrigid pavements, AREA is calculated with the following equation:
���
����
�+��
�
����
�+��
�
����
�+��
�
����
�+��
�
����
�+��
�
����
�+=
0
60
0
36
0
24
0
18
0
12
0
87 d
d*12dd*18
dd*9
dd*6
dd*5
dd*64AREA
where: d0 = deflection in center of load plate, inchesdi = deflection at 0, 8, 12, 18, 36, and 60 inches from loadplate center, inches
AREA has units of length, not area, since each of the deflections is normalized withrespect to the deflection under the load plate in order to remove the effect of differentload levels and to restrict the range of values. For sound concrete, the AREA will rangefrom 29 to 32. For composite pavements, AREA is calculated with the followingequation:
���
����
�+��
�
����
�+��
�
����
�+��
�
����
�+=
12
60
0
36
12
24
12
185 d
d*12dd*18
dd*9
dd*63AREA
where: d0 = deflection in center of load plate, inchesdi = deflection at 0, 8, 12, 18, 36, and 60 inches from loadplate center, inches
The deflection at 12” rather than under the load plate is used for composite pavementsdue reduce the effect of the compression of the HMA that might occur under the loadplate during loading.
III.J.3.3.2.5 Radius of Relative StiffnessFor a given load radius and sensor configuration, a unique relationship exists betweenAREA and the dense liquid radius of relative stiffness (l) for the pavement system. Theradius of relative stiffness is basically a measure of the structural capacity of thepavement structure based on the dense liquid theory for PCC. The value by itself doesnot provide any beneficial qualifier of the structural capacity, but it is used in otherequations to calculate subgrade and pavement layer strengths. Calculating radius ofrelative stiffness is an iterative process, with the starting point being the assumption thatthe PCC slab has an infinite size. With this assumption in mind, the initial calculation ofthe radius of relative stiffness is an estimate; lest. For rigid pavements, the initialestimated radius of relative stiffness (lest) is calculated with the following equation:

Pavement Design Procedures FWD Data Analysis
Updated 11/1/2002 III-102
2.5667
est 0.698289.708
AREA60lnl
����
�
�
����
�
�
−
��
�
� −
=
For composite pavements, the initial estimated radius of relative stiffness (lest) iscalculated with the following equation:
2..2205
est 0.476157.40
AREA48lnl
����
�
�
����
�
�
−
��
�
� −
=
III.J.3.3.2.6 Modulus of Subgrade ReactionThe modulus of subgrade reaction (k) represents the support provided by all pavementlayers, including aggregate base and subgrade, under the PCC slab. The resilientmodulus (Mr) of the subgrade is used in analysis for flexible pavements and the modulusof subgrade reaction (k) is used in analysis for rigid and composite pavements. Theinitial calculation of the modulus of subgrade reaction (k) is an estimate because it iscalculated with estimated radius of relative stiffness (lest), based on the assumption thatthe PCC slab of infinite size. For rigid pavements, based on infinite slab assumption,the initial estimated modulus of subgrade reaction (kest) is calculated with the followingequation:
( )2esto
ocest l*d
d*Pk =
where: kest = estimated backcalculated modulus of subgradereactionP = load, poundsdo = deflection measured at the center of load plate, inchlest = estimated radius of relative stiffness, inches (seeabove)doc = nondimensional coefficient of deflection at center ofplate
����
�
�
����
�
�
���
�
�
���
�
�−−
=
stel*0.07565e*0.14707
e*0.1245ocd
For composite pavements, based on infinite slab assumption, the initial estimatedmodulus of subgrade reaction (kest) is calculated with the following equation:

Pavement Design Procedures FWD Data Analysis
Updated 11/1/2002 III-103
( )2est12
12cest l*d
d*Pk =
where: d12 = deflection measured 12” from center of load plate,inchd12c = nondimensional coefficient of deflection 12” fromcenter of plate
����
�
�
����
�
�
���
�
�
���
�
�−−
=
stel*0.07074e*0.79432
e*0.1218812cd
As discussed previously, all the previous equations were based on the assumption of aninfinite slab. The correction factor for the slab size is identified as, L. The next step is tocorrect for the size of slab in the pavement structure. If the slab length is less than orequal to twice the width, L, is the square root of the product of the slab length and width,with all dimensions in inches. If the PCC slab is greater than twice the width, L, is theproduct of the square of the root of two and the slab length, all dimensions in inches.This logic is identified in the following equations:
If length <= 2 * width, Width*Length=LIf length > 2 * width, 2*Length=L
There are two resulting adjustment factors based on the slab size correction factor, AFdoand AFl. The correction factor for the deflection under the load plate AFdo, for both rigidand composite pavements is the following equation:
������
�
�
������
�
�
��
�
�
��
�
�−
=
0.80151
estlL0.71878
e*1.15085-1odAF
The correction factor for the radius for relative stiffness AFl, for both rigid and compositepavements is the following equation:
������
�
�
������
�
�
��
�
�
��
�
�−
=
1.04831
estlL0.61662
e*10.89434-1lAF
The dynamic modulus of subgrade reaction, k, for both composite and rigid pavements,corrected for slab size, is the following equation:

Pavement Design Procedures FWD Data Analysis
Updated 11/1/2002 III-104
odAF*2lAF
estkk =
Using the FWD data and performing a backcalculation analysis to obtain the modulus ofsubgrade reaction provides a result based on a dynamic load applied in the field. AllAASHTO design equations were based on static loads applied in a laboratory.Therefore, to obtain a modulus of subgrade reaction design value for pavement design,the results obtained from backcalculation analysis must be corrected. Use the followingequation to determine the design modulus of subgrade reaction (kdesign)
2k
designk =
III.J.3.3.2.7 PCC Elastic ModulusThe PCC elastic modulus is a required input for the AASHTO pavement design process.Use the following equation to calculate PCC elastic modulus:
( )3PCC
designk*20.151*12*estl
pccE���
��� −
=
where: PCC = thickness of PCC slab, inchesEpcc = Elastic modulus of PCC layer, psi
III.J.3.3.3 Backcalculation SoftwareThere are several backcalculation software applications available on the market today.MDSHA currently primarily uses the backcalculation algorithms in the DarWin software,which is based on the AASHTO deflection analysis procedures. Most of theseprocedures have been documented in this section earlier and can be replicated by handwithout the assistance of a software application. The AASHTO deflection analysisprocedures do not produce individual pavement layer moduli for flexible pavement, onlya composite modulus for all layers. Other software applications are required if individualpavement layers strengths are desired.The most used software application by MDSHA, and industry wide, for the estimation ofindividual pavement layer strength is MODULUS. The MODULUS algorithm is based ontrying to match the collected FWD deflection basin with a database of deflection basinswith known layer moduli. The accuracy of the backcalculated layer moduli is based onthe percent sensor error between the measured deflection and the predicted deflectionfrom the MODULUS algorithm.There is several other software applications for backcalculation available on the markettoday. Some applications perform an iterative process to estimate the layer modulus,others use the database approach and match measured deflections, while others use afinite element analysis approach to solving for individual layers. Some of the other

Pavement Design Procedures FWD Data Analysis
Updated 11/1/2002 III-105
backcalculation software applications available today include the following: WESDEF,MODCOMP, ILLI-BACK, ELMOD, ELSYM, KENLAYER, KENSLAB, and ISLAB.
III.J.3.4 Quality Control of FWD AnalysisIn the same manner the quality of the data collected during deflection testing needs tobe controlled for quality to ensure accurate pavement design recommendations, so doesthe results of the backcalculation analysis. FWD deflection analysis produces estimatesof subgrade strengths, composite layer modulus (all layers), individual layer moduli, loadtransfer efficiencies, void detection, and etc, all of which need to be verified for logicaland reasonable results. This sub-section describes the steps needed to check the FWDdeflection analysis for backcalculation errors, data reasonableness, and quality. Thefollowing headings should be viewed, as the general steps needed to control the qualityof the FWD deflection analysis.
III.J.3.4.1 Percent Sensor ErrorBackcalculation software applications, like MODULUS, compare measured deflectionbasins with estimated deflection basins. These comparison results in the introduction ofthe error involved with matching deflection basins. Therefore, the percent sensor errorbecomes a critical element in determining the accuracy the results from backcalculationanalysis. The percent sensor error is the percent difference between the measured andexpected deflection. Errors less than 5% are considered to produce reasonable results.Errors between 5% and 10% should be questioned for validity. Errors greater 10% arenot valid and should not be used in analysis for the development of pavementrehabilitation recommendations.
III.J.3.4.2 Reasonable Layer Modulus RangeThe results produced from backcalculation analysis need to be reasonable for the typeof material under investigation. The Material Properties section of the Material Library,Section X.B, of this pavement design guide should be used to determine the reasonablestrength range for pavement materials used by MDSHA. In addition, these rangesshould be used to confirm the reasonableness of analysis results involving thecombining several pavement layer materials into one value, i.e. composite modulus.
III.J.3.4.3 Data Reasonableness ChecksOther results produced from backcalculation analysis, like load transfer efficiency (LTE),need to be reasonable for the type of material under investigation. LTE greater than100% is not reasonable under typical environmental and loading conditions and valuesgreater than 100% shall be used in the pavement data analysis.
III.J.3.5 Reporting/Plots of FWD Data Analysis ResultsIt is beneficial to present the results of FWD data analysis in a form that can be easilyinterpreted and presented to others not privy to the details of FWD data analysis. Inaddition, the task of formalizing the data into a presentable form will force the pavementdesigner to look over the data for errors and compile numerous data points intobeneficial summary data results. The two most powerful presentation tools for FWDdata analysis results are plots and tables or charts. Plots allows the pavementsdesigner and others to view the all the data in a section or project which provides focuson segments performing differently that the majority of the project or section. Tables andcharts provide a summary of an entire project or section in just a few descriptive material

Pavement Design Procedures FWD Data Analysis
Updated 11/1/2002 III-106
property items. Statistical analysis results in tables and charts provide additionalsummary of the performance of the project or analysis section.The following material properties from FWD data analysis are beneficial and informativefor flexible pavements when plotted versus station:
• subgrade resilient modulus (Mr),• effective structural capacity of pavement – structural number (SN),• backcalculated individual layer moduli.
The following material properties from FWD data analysis are beneficial and informativefor rigid or composite pavements when plotted versus station:
• modulus of subgrade reaction, k• strength of PCC - elastic modulus of PCC elastic - Epcc• strength of PCC - modulus of rupture of PCC - S’c• strength of PCC – Area,• load transfer efficiency – LTE % or load transfer deficit• backcalculated layer moduli
The following material properties from FWD data analysis are beneficial and informativefor flexible pavements when presented in table form and broken out into differentanalysis sections or segments:
• mean, minimum, maximum, standard deviation of Mr, SN, and backcalculatedlayer moduli.
The following material properties from FWD data analysis are beneficial and informativefor rigid or composite pavements when presented in table form and broken out intodifferent analysis sections or segments:
• mean, minimum, maximum, and standard deviation of k, Epcc, S’c, Area, LTE,and backcalculated layer moduli.

Pavement Design Procedures Preliminary Engineering Cost Estimate
Updated 11/1/2002 III-107
III.K PRELIMINARY ENGINEERING COST ESTIMATE
III.K.1 PurposePreliminary Engineering (PE) Cost Estimate is completed to:
• Provide the Project Owner an estimate of the of the cost required to complete thereview, testing, design, and analysis of the project
• Estimate the amount of testing required on the project, for Pavement Division,Geotechnical Investigation, Geology, and the testing laboratory
• Estimate the man days required to complete testing and design of the project
III.K.2 Resource RequirementsThe PE cost estimate procedure documented below requires the following staffing needsfor a typical job:
Position Function Resources Effort Level(man-hours)
Staff Engineer or Project Engineer Overview of Project 1 1Staff Engineer or Project Engineer Assess Testing Needs 1 1Staff Engineer or Project Engineer Assess Man-hour Requirements 1 1Staff Engineer or Project Engineer Verify with other Divisions 1 2Staff Engineer or Project Engineer Develop Cost Estimate 1 1
III.K.3 ProcedureThe procedure presented in the attached flowchart and described in the following textshould be followed to complete a PE cost estimate. The lead Division (Pavement orGeotechnical Explorations) should be the division responsible for developing andproviding the PE cost estimate to the project owner. However, an attempt to verify thatthe correct number of man-hours and testing needed by each Division should becompleted prior to submitting the PE cost estimate memorandum. The end result of thePE cost estimate process is a 1-page memorandum to the project owner that describesthe estimated engineering design costs needed to provide recommendations for a givenproject.The majority of the effort in this process is to develop the cost estimate value is donewithin the PE Cost Estimate Form (PD-13). This effort will involve entering estimatedhours directly into the spreadsheets in the MS Excel file named PD-13.xls, for formPD13. This will result in a monetary value for the PE cost estimate.In the PD-13.xls Excel file and form, the number of working days is requested in severallocations. Working days are the number of days it would take one individual to completeeach item. If more than one person is expected to work on that item, increase thenumber of working days by the number of individuals. The cost of travel and out of townexpenses are already figured into the calculation in the MS Excel file PD-13.xls.NOTE: If it is anticipated that consultants will be assisting on any particular item in thePE Cost estimate, the amount of workdays required be the consultant should be tripled(multiply by 3) to account for consultant overhead and profits costs. Therefore, 1workday should be estimated to be 3 workdays if a consultant is to perform the item.

Pavement Design Procedures Preliminary Engineering Cost Estimate
Updated 11/1/2002 III-108
Step 1. Receive a request for a PE cost estimate from project owner. If thisproject is a project that is new to OMT then, Steps 1 through 12 needto be followed in Section III.F “Pavement Rehabilitation Design.” Bycompleting these steps in Section III.F it will provide with adequateinformation to complete the PE cost estimate process. In somecases, not all the steps in Section III.F can be completed by the duedate of the PE cost estimate. In this case, certain assumptions and amore conservative PC cost estimate needs to be completed.
Responsible Party - EngineerStep 2. Start the cost estimating process after collecting the data from the
records review, open the MS Excel file named PD-13.xls located onthe network at n:\omr\everyone\pavedsgn\guide\forms.
Responsible Party - Engineer
Step 3. Open the Summary sheet in the PD-13 Excel file and enter theproject description information.
Responsible Party - EngineerStep 4. Select the region that the project is located from the table below. The
cost for certain items, i.e. testing and travel, will vary depending onthe regions of the state. This region will be used in the developmentof the cost estimate. Enter the region in the summary sheet in thePD-13.xls file.
Region CountyCaroline, Cecil, Kent, Queen Annes, Talbot
1 Dorchester, Somerset, Wicomico, WorcesterAnne Arundel and Calvert
Baltimore, Baltimore City, HarfordCarroll, Frederick, Howard2
Montegomery, Prince George’s
3 Charles and St. Mary’s
4 Allegany, Garrett, Washington
Responsible Party - Engineer
Step 5. Open the Pavement sheet in the PD-13 Excel file and enter thenumber of working days for each of the items under the MeetingsDesign/Analysis, and Report headings. The values entered in thePavement sheet are the expected working days required for thePavement Division to complete the project accurately and thoroughly.A summary of the total working days and cost will result from the dataentry for each heading and the Division. Print out the Pavementsheet when all the required fields are populated.
Responsible Party - Engineer

Pavement Design Procedures Preliminary Engineering Cost Estimate
Updated 11/1/2002 III-109
Step 6. Open the Geotechnical sheet in the PD-13 Excel file and enter thenumber of working days for each of the items under the MeetingsDesign/Analysis, and Report headings. The values entered in theGeotechnical sheet are the expected working days required for theGeotechnical Explorations Division to complete the project accuratelyand thoroughly. A summary of the total working days and cost willresult from the data entry for each heading and the Division. Printout the Geotechnical sheet when all the required fields are populated.
Responsible Party - EngineerStep 7. Open the Geology sheet in the PD-13 Excel file and enter the
number of working days or other information for each of the itemsunder the Meetings and and Design/Analysis headings. The valuesentered in the Geology sheet are the expected working days andother information required for the Geology Division to complete theproject accurately and thoroughly. A summary of the total workingdays and cost will result from the data entry for each heading and theDivision. Print out the Geology sheet when all the required fields arepopulated.
Responsible Party - EngineerStep 8. Open the SPID sheet in the PD-13 Excel file and enter the number of
working days for each of the items under the Testing heading. Thevalues entered in the SPID sheet are the expected working daysrequired for the SPID to complete the project accurately andthoroughly. A summary of the total working days and cost will resultfrom the data entry for the Division. Print out the SPID sheet whenall the required fields are populated.
Responsible Party - EngineerStep 9. Open the Drillers sheet in the PD-13 Excel file and enter the total
length of the project and the number of foundation borings for each ofthe items under the Soil Borings and Foundation Borings headings.The values entered in the Drillers sheet are the expected informationrequired for the Drillers to complete the project accurately andthoroughly. Foundation borings are necessary in cases that astructure (bridge) is involved in the project or exceptionally deeputilities need to be placed. It is typical to have 5 foundation boringsper normal structure. A summary of the cost will result from the dataentry for each heading and the Division. Print out the Drillers sheetwhen all the required fields are populated.
Responsible Party - EngineerStep 10. Open the Lab sheet in the PD-13 Excel file and enter the number of
working days for each of the items under the Testing heading. Thevalues entered in the Lab sheet are the expected informationrequired for the Lab to complete the project accurately andthoroughly. A summary of the total cost will result from the data entryfor the Division. Print out the Lab sheet when all the required fieldsare populated.

Pavement Design Procedures Preliminary Engineering Cost Estimate
Updated 11/1/2002 III-110
Responsible Party - Engineer
Step 11. Open the Summary sheet in the PD-13 Excel file and view theestimated PE cost of the project. Print out the Summary sheet.
Responsible Party - EngineerStep 12. Provide a copy of the PE cost estimate to each Division and allow
them to review their respective sections for verification of informationand costs. Give the Geotechnical, Drillers, and Lab sections to theGeotech contact for review. Give the Geology sections to theGeology Division Chief (Dave Martin) for review. The Pavement andSPID sections are the responsibility of the pavement designengineer.
Responsible Party - EngineerStep 13. After the respective Divisions have provided verification, make any
correction, if necessary. Print out all sections of Form PD-13 andplace in project file.
Responsible Party - EngineerStep 14. Prepare a PE cost estimate memorandum on MDSHA letterhead
following the typical format(n:\omr\everyone\pavedsgn\pecostformat.doc).
Responsible Party - Engineer
Step 15. Submit PE cost estimate memorandum to Pavement Chief forapproval and signature.
Responsible Party - Engineer

Pavement Design Procedures Preliminary Engineering Cost Estimate
Updated 11/1/2002 III-111
III.K.4 PE Cost Estimate Process Flowchart
Records Review
Steps 1
Engineer
PavementRehabilitation
Process Setps 1-12
Develop Cost Estimate
Steps 2 - 11
EngineerForm and MS Excel
file PD-13
Communication withOther Divisions
Steps 12 - 13
Develop Memo
Steps 14 -15
Engineer
Engineer
PE Cost EstimateMemo
PE Cost EstimateForm PD-13
Pavement Design ProceduresShoulder Design
Updated 8/1/2001 III-112
III.L SHOULDER DESIGN
III.L.1 PurposeShoulder designs are conducted to:
• Determine the future functional and structural requirements of the pavement,• Match the existing mainline pavement structure to provide adequate drainage
characteristics, and• Identify the material requirements for future demands of shoulder.
III.L.2 Resource RequirementsThe shoulder design process is typically done concurrently with a new pavement designfor the mainline. The majority of the data collection and design effort done for themainline shall complete a majority of the steps needed for shoulder design. Theshoulder design procedure documented below requires the following staffing needs for atypical job:
Position Function Resources Effort Level(man-hours)
Staff Engineer or Project Engineer Records Review 1 1Staff Engineer or Project Engineer Site Visit 1 0.5Staff Engineer or Project Engineer Data Analysis 1 0.5Staff Engineer or Project Engineer Project Communication 1 0.5Staff Engineer or Project Engineer Shoulder Design 1 1Staff Engineer or Project Engineer Memo Development 1 0.5
III.L.3 ProcedureThe procedure presented in the attached flowchart and described in the following textshould be followed in a typical shoulder pavement design recommendation. Referenceto specific design inputs for rehabilitation or new design development can be located inSection IV “Pavement Design Policies”. Numerous steps contained in this procedurecan be completed within several software applications that the Pavement Divisioncurrently uses and has under development. The software application tool available tothe Pavement Division that can be principally used to complete shoulder pavementdesigns at this time is DARWin. The following procedure was written to provide thedesign engineer with adequate information to complete a shoulder design withoutspecific knowledge or access to computer software applications, but with the assumptionthat these tools were available.Certain steps in the shoulder pavement design process and other processes overlap. Itis important to keep in mind that although these processes are broken out and written inseparate sections, they are a part of an overall process to provide logically andtechnically sound recommendations. The procedure described below is conducted afterreceiving a request from a customer. This request can be completed via a memorequest, e-mail request, or verbal request. The scope of the project should be providedwith the shoulder pavement design request. In most cases, a shoulder pavement designis completed in conjunction with a pavement rehabilitation design; i.e. “widening andresurfacing.” Therefore, the new, shoulder, and rehabilitation design process will occurconcurrently and use the same data and information. The basic difference is that

Pavement Design ProceduresShoulder Design
Updated 8/1/2001 III-113
pavement rehabilitation design requires the evaluation and assessment of the existingroadway, both structurally and functionally. Shoulder and new pavement design doesnot take into account any of the existing conditions of the pavement other thangeotechnical and drainage conditions because it is a new design. It is the pavementdesigners responsibility to use all design processes concurrently where needed and takecare to monitor that both designs are agreeable with one another both for designpurposes and for construction related reasons.The following guidelines should be considered when designing the shoulders:
• Median shoulders less than 4.0’ in width are designed with the same pavementstructure as the mainline roadway.
• Median shoulders greater than 4.0’ in width are designed with 2.0’ of the shouldernext to the mainline having the same pavement structure as the mainline roadway.The remaining width of the shoulder is designed following shoulder designguidelines.
• Outside shoulders with a requiring a ESAL range of 3 (greater than 3 million ESAL)or greater for Superpave mix design shall be designed with 2.0’ of the shoulder nextto the mainline match the pavement structure of the mainline roadway. Theremaining width of the shoulder is designed following shoulder design guidelines.
Follow the steps below to complete the shoulder pavement design.
Step 1. Complete Steps 1 through 5 as documented in Section III.G “NewPavement Design.”
Responsible Party - EngineerStep 2. Complete Step 6 as documented in Section III.G “New Pavement
Design” using the ESAL adjustment factor documented in Section VI.A.3.9 “Pavement Design Policies.”
Responsible Party - Engineer
Step 3. Complete Steps 7 through 40 as documented in Section III.G “NewPavement Design.”
Responsible Party - Engineer

Pavement Design ProceduresShoulder Design
Updated 8/1/2001 III-114
III.L.4 Shoulder Design (New Design) Flowchart
Setup Project
Steps 1 - 5
EngineerProject Database
Project FileNotice to SPID
Geotech Contact
Gather Data Records
Steps 6 - 10
EngineerPerformance DataConstruction HistoryOther Project FilesMaintenance Data
Traffic Data
Conduct Site VisitVisual Survey
Request TestingSteps 11 and 15
Engineer and SPIDProject Sketch
PD-05
Conduct FWD TestingFWD Data Processing
Steps 16 -19
Engineer and SPID
Conduct SoilInvestigation
Steps 20
Geotech and SPID
FWD Test ResultsCoring Locations
Define AnalysisSections
Steps 21
Engineer
Calculate FutureStructural Needs - SCf
Steps 22 - 23
Engineer
Determine SpecificMaterial Layers
Steps 24 - 26
Engineer
PCC Joint Design
Steps 27
Engineer
Rigid Steel Design
Steps 28 - 30
Engineer
Constructability Review
Steps 31
Engineer
Cost Estimate - BudgetQC Review
LCCA - if neededSteps 32 - 34
Engineer
Discuss w/ ProjectOwner
Steps 35
Engineer
PrepareRecommendations and
Special ProvisionsSteps 36 - 37
Engineer
Final QC Review
Steps 38 - 40
Engineer
DetailsSpecial
Provisions
1
1
Soil and RoadwayMaterial Information
PD-10
Final Recomm.MemoPD-06PD-09
Pavement Design ProceduresFinal Review
Updated 11/1/2002 III-115
III.M FINAL REVIEW
III.M.1 PurposeThe Final Review process is a critical step in the design process to ensure the designeffort is documented properly and to ensure designs from other divisions areincorporated accurately into the final advertised package. A Final Review processensures the accuracy and the correctness of the contract documents for a project priorto that project being advertised for bids. The review verifies that the designs, plans,specifications, bid quantities, and estimates are accurate and the most recent. Inaddition, it is an opportunity to verify that designs from different design groups arebrought together in an accurate MDSHA project design. For Pavement Division toprepare for Final Review, one must conduct a review or verify the following:• Verify the accuracy of plans and specifications• Ensure proposed pavement recommendations can be physically constructed within the
constraints of the project• Verify quantities provided in pavement recommendation are accurately included into the
advertised documents• Verify the pavement recommendations provided are presented accurately in the advertised
documents• Allow our Specification Team to check the entire package prior to advertisement• Reduce the number Addendum and Extra Work Orders
III.M.2 Resource RequirementsThe Final Review procedure documented below requires the following staffing needs fora typical job:
Position Function Resources Effort Level(man-hours)
Staff Engineer or Project Engineer Verify Recommendations 1 1*Staff Engineer or Project Engineer Review Plans 1 2*Staff Engineer or Project Engineer Internal Constructability Review 1 1*Staff Engineer or Project Engineer Review Specifications 1 1*
Spec Team Review Entire Package 1 8*Staff Engineer or Project Engineer Review Estimate and Quantities 1 2*
* The time required would vary depending on the size and complexity of a project.
III.M.3 ProcedureThe procedure presented in the attached flowchart and described in the following textshould be followed for a typical final review of a project. Several steps in the FinalReview process may be done out of sequence. It is important that all the steps arecompleted and not necessarily followed in the order in which they are presented in thissection. The Final Review process begins when OMT receives the notice for final reviewmeeting and the final review package. The contract document package could includeplans and specifications or in the case of a “proposal” only advertisement, details shouldbe included in the specifications. On projects involving the Geotechnical ExplorationsDivision, their Division should conduct their own review of the contract documentsconcentrating on Geotechnical issues. There will be some overlap between thePavement and Geotechnical review, but it is important to concentrate on our own area ofresponsibility and be aware of other’s areas. All divisions at OMT should work as a team

Pavement Design ProceduresFinal Review
Updated 11/1/2002 III-116
to ensure that all area’s OMT is responsible for are done accurately and are sounddesigns. The review should begin with the plans first and then the specifications.
Step 1. Verify with Geotechnical Explorations Division has received the finalcontract document package. Discuss with Geotech contact the areaseach division would review and attendance at the Final Reviewmeeting. In addition, discuss the time to provide the SpecificationTeam a set of the contract documents to review.
Responsible Party – Engineer and Geotech Contact
Step 2. Verify the existing conditions of the roadway have not significantlychanged since the pavement recommendations were developed.These changes include, but are not limited to the following: projectscope, alignment, distress conditions, traffic levels, other geometricimprovements. This step is critical for review of “shelf” projects andprojects done by others.
Responsible Party - Engineer
Step 3. Verify pavement recommendations used to develop final reviewpackage meet our current MDSHA Pavement Division designstandards and policy for structural and functional condition. This stepis critical for review of “shelf” projects and projects done by others.
Responsible Party – Engineer
Step 4. Verify the material used in the project follows MDSHA PavementDivision current material policies. This step is critical for review of“shelf” projects and projects done by others.
Responsible Party – EngineerStep 5. Review the Title sheet of plans to ensure that the traffic data provided
is correct and matches the data used in the rehabilitation design.Verify the soil legend provided on the Title sheet is accurate. Verifythe correct contract number and job description is shown.
Responsible Party - EngineerStep 6. Review the typical section sheets of the plans. Each of the following
items shall be reviewed for accuracy and correctness in the typicalsection sheets:
• Base-widening locations and dimensions shown.• Width of widening shown accurately.
• Reconstruction limits and dimensions shown.• Pavement details shown or referred to on typical sections.• Correct typical sections shown within specific station limits.
• Curb and gutter shown in correct location.• Varying roadway or widening widths shown as separate
typical sections.• Longitudinal underdrain (LUD) shown correctly.• Guardrail placements interfere with LUD.
Responsible Party - Engineer

Pavement Design ProceduresFinal Review
Updated 11/1/2002 III-117
Step 7. Review the pavement details sheets of the plans. Each of thefollowing items shall be reviewed for accuracy and correctness in thepavement details sheets:
• Pavement details match our recommendations.• Correct nomenclature and category code numbers.• Legend items refer to proper material in detail.• Notes for details correct.
• Steel reinforcement and load transfer.• Joint dimensions and layout.• Particular patching requirements.
Responsible Party - Engineer
Step 8. Review the plan sheets of the plans. Each of the following itemsshall be reviewed for accuracy and correctness in the plan sheets:
• Rehabilitation strategy shown correctly with shading/legend ofplan sheets.
• Identify possible conflicts with utility or hydraulic construction thatmay have been added since our recommendations wereprovided.
• Drain pipes in roadway, wheel path. Construction parallelto roadway or crossing roadway in transverse direction.Excavation needs and dimension. Reconstruction needsor utility patch. Utility patch details provided.
• Bridges – end walls/wingwalls. Pavement replacementdetail.
• Guardrail or other structure placement interferes withpavement section or construction.
• Identify between existing, new, and relocated utilitylines/drains.
• Project scope changes or limit adjustments. Additional roadwayarea inclusion after recommendations provided.
Responsible Party - EngineerStep 9. Review the profile sheets of the plans. This area of the review is the
responsibility of the Geotech contact, but the pavement engineershall be familiar and knowledgeable with the information on theprofile sheets. Each of the following items shall be reviewed foraccuracy and correctness in the profile sheets:
• Centerline roadway elevation changes – increase or decrease.Verify structural capacity needs.
• Identify low areas or sump areas for longitudinal underdrain needareas.
• Pavement/soil borings shown with results of field and laboratorytesting.
Responsible Party – Engineer and Geotech Contact

Pavement Design ProceduresFinal Review
Updated 11/1/2002 III-118
Step 10. Review the cross section sheets of plans. Some items in this area ofthe review is the responsibility of the Geotech contact, but thepavement engineer shall be familiar and knowledgeable with all theinformation on the cross section sheets. Each of the following itemsshall be reviewed for accuracy and correctness in the cross sectionsheets:
• Base-widening locations and dimensions shown.• Width of widening shown accurately.
• Reconstruction limits and dimensions shown.• Full width roadway elevation changes – increase or decrease.
Check at mainline/shoulder edge for reduction in pavementthickness.
• Cross slope improvements – removal of material to correct crossslope. Verify structural capacity needs. Reconstruction may beneeded for reduction requirements.
• Identify fill/cut areas. Identify grading slopes beyond roadway.Verify Class 1A needs based on fill/cut areas. Geotech isresponsible for this item.
Responsible Party - Engineer
Step 11. Review the grading chart of the plans, applicable in any newconstruction or widening projects. This area of the review is theresponsibility of the Geotech contact, but the pavement engineershall be familiar and knowledgeable with the information on thegrading chart. Each of the following items shall be reviewed foraccuracy and correctness in the grading chart:
• Ensure quantities from cross sections are transposed correctly.• Verify calculation of quantities is correct.
Responsible Party - EngineerStep 12. Review the Maintenance of Traffic (MOT) sheets of the plans. Each
of the following items shall be reviewed for accuracy and correctnessin the MOT sheets:
• Verify duration of MOT pavement sections.• Verify use of traffic bearing pavement sections exist during all
phases of MOT.• Ensure construction sequence does not conflict with the use of
traffic bearing pavement sections.• MOT pavement sections to be used after construction project
complete.• MOT pavement sections able to be constructed.
Responsible Party - EngineerStep 13. Review the landscaping sheets of the plans. Each of the following
items shall be reviewed for accuracy and correctness in thelandscaping sheets:

Pavement Design ProceduresFinal Review
Updated 11/1/2002 III-119
• Verify any cross walk is traffic bearing and at minimum has thesame service life of the pavement rehabilitation. Use of mortar orbedding sand for paver blocks.
• Verify that any unique landscaping, curbs, or other visualenhancements do not adversely effect pavement performance.
Responsible Party - EngineerStep 14. Review the hydraulic sheets of the plans. Some items in this area of
the review is the responsibility of the Geotech contact, but thepavement engineer shall be familiar and knowledgeable with all theinformation on the hydraulic sheets. Each of the following items shallbe reviewed for accuracy and correctness in the hydraulic sheets:
• Ensure storm water management facilities do not adversely effectstructural capacity of pavement section. Change of water flow ormovement.
Responsible Party - EngineerStep 15. Review project for construction issues. The construction review shall
used to verify pavement section can be constructed given theexisting conditions, geometry, MOT phasing, and materials. Everyunique aspect of each construction project can not be documentedinto one procedure. However, several key construction items areconsistent among the majority of the projects. The followingconstruction items shall be ease of construction:
• Depth of pavement sections compared to adjacent existing or newpavement sections. Eliminate “bathtub” conditions. Beconsistent with the thickness and material type with adjacentpavement sections.
• Utility patch and limit of utility work in roadway. Amount ofexcavation needed for placement and effect on roadway.
• Sequence of construction relative to placement of differentpavement sections. For example, ramps, mainlines, andintersecting roadways.
• Sequence of construction relative to MOT and structural capacityof pavement sections. For example, shoulders and turn lanesused for mainline traffic. Also, grinding, patching, and wideningoperations relative to functional and structural capacity.
• Width of paving less than 4.0’. Areas less than 4.0’ in widthdevelop compaction issues with HMA material.
• Location and placement of longitudinal underdrain.• Percentage of reconstruction and resurfacing on a project with
respect to the final ride quality and the structural integrity of theproject.
• Joint layout and steel design and construction of rigid pavements. Responsible Party - Engineer
Step 16. Review the specifications. Each of the following items shall bereviewed for accuracy and correctness in the specifications:

Pavement Design ProceduresFinal Review
Updated 11/1/2002 III-120
• Ensure specifications provided by Pavement Division are includedand unedited.
• Verify specifications in 500 and 900 section have the most recentand accurate information and revisions dates.
• Verify correct nomenclature used in “other” special provisionsprovided other divisions.
• If no plans will be used for advertised package, follow steps 2through 4 above with the details provided in the specifications.
Responsible Party - EngineerStep 17. Provide Specification Team with your edited copy of plans and
specifications for thorough review. Provide Specification Team withcharge number and due date for their comments; preferably a fewdays prior to the Final Review meeting.
Responsible Party - EngineerStep 18. Review plans and Specifications in their entirety. Provide comments
to engineer by requested due date. Responsible Party – Specification Team
Step 19. Review bid estimate and quantities. Communication with the projectowners is needed in this step to ensure the same correct area valuesare used to develop quantities. Each of the following items shall bereviewed for accuracy and correctness in the bid estimate andquantities:
• Verify all quantities needed for pavement rehabilitation areidentified and presented accurately.
• Verify actual quantity provided for each item in recommendation ispresented accurately. For example patching, Class 1A,removal/replacement of unsuitable material, and longitudinalunderdrain.
• Verify nomenclature of material types is correct and consistentwith plans and specifications.
• Verify unit costs for paving items are reasonable and accurate.• Verify actual quantity calculated by project owner provided for
each item in the recommendation is presented accurately. Forexample HMA tonnage or area, grinding, joint tape, etc.Responsible Party – Engineer
Step 20. Provide oral comments from design team (Pavement, Geotech, andGeology) review and specification team review at final reviewmeeting. If attendance at meeting is not possible, provide writtencomments from design and specification team to project owner. Ifcomments are significant or project is large and complex, attendanceat meeting and written comments are recommended. Comments canbe provided via e-mail or memorandum depending on significance ofproject. Place written comments into project file folder.
Responsible Party – Engineer

Pavement Design ProceduresFinal Review
Updated 11/1/2002 III-121
III.M.4 Final Review Process Flowchart
ReviewRecommendations
Steps 1 - 4
Engineer
Review Plans
Steps 5 - 14
Engineer
Constructability Review
Steps 15
Review Specifications
Steps 16 - 18
Engineer
Engineer
Review Bid Quantities
Steps 19
Engineer
Provide Comments
Steps 20
Engineer

Pavement Design ProceduresVerification of Classification Data
Updated 11/1/2002 III-122
III.N VERIFICATION OF CLASSIFICATION DATA
III.N.1 PurposeOn-site classification counts are done to:
• Verify that the classification data provided for design is reasonable• Verify that the predominant trucks from the selected WIM site are those for the
project
III.N.2 Resource RequirementsThe classification verification procedure documented below requires the followingstaffing for a typical job:
Position Function Resources Effort Level(man-hours)
Project or Staff Engineer Setup Testing 1 1Survey Technician or Staff Engineer Data Collection 1 2Survey Technician or Staff Engineer Data Entry/Processing 1 1
Reference: Federal Highway Administration’s Traffic Monitoring Guide; discussion ofvehicle classification system.
III.N.3 ProcedureThe procedure presented in the attached flowchart and described in the following textshould be followed to obtain a one-hour single lane count. It is expected that this countwill be included as a part of the routinely scheduled site survey activities and not as aseparate visit. The evaluation described below is conducted from the roadside andpreferably off the roadway to avoid distorting lane distribution patterns. Parking inadjacent parking lots or sitting on bridges above the project is recommended. Thesurveyor is responsible for obtaining any permission required to be on private propertyand to notify any local authorities of roadside activities as necessary. If the survey isconducted within the right-of-way, the surveyor should be in a survey vehicle equippedwith a mounted flashing light.
Step 1. Obtain a copy of the classification data used for traffic forecasts onthe project. If by lane data is not available, use data aggregated byby direction.
Responsible Party – Engineer
Step 2. Determine the underlying counts for the WIM location used for ESALestimation. If by lane data is not available, use the aggregated weightdata.
Responsible Party – Engineer
Step 3. Determine the direction convention used for the classification count.Identify the corresponding direction for the project. Both must beconsistent with Highway Location Reference. Any discrepanciesmust be resolved before commencing field work.

Pavement Design ProceduresVerification of Classification Data
Updated 11/1/2002 III-123
Responsible Party – Engineer
Step 4. Ride the full length of the project plus a mile in each direction todetermine if a major truck generator such as one of those listedbelow will influence the project loading estimate:• Industrial park with a majority of warehousing or manufacturing
tenants• Factory• Quarry• Batch mix plant• Truck stop or rest area• Freeway exit
Responsible Party – EngineerStep 5. Select data collection site based on:
• safety• proximity to an identified major truck generator• visibility of the roadway• relative truck volumes (either the heavier direction or larger
volume end on the project)Responsible Party – Engineer
Step 6. Do a 1-hour classification count of the outside lane nearest the datacollection location using Form PD-xx. Counts should begin on thehour and end on the hour. All vehicles in the lane are included in thecount. For high volume sites, or sites where bi-directional countverification is needed due to the presence of more than one majortruck generator, an hour of video tape may be taken for subsequentreduction in the office.
Responsible Party – EngineerStep 7. Total the observed hourly volumes for each class on Form PD –xx.
Responsible Party – EngineerStep 8. Enter the reported total daily lane (direction) volumes by class from
the classification count used for the traffic forecasts on Form PD-xx.Responsible Party – Engineer
Step 9. Enter the reported total daily lane (direction) volumes by class fromthe WIM count used for the ESAL estimate on Form PD-xxx.
Responsible Party – EngineerStep 10. Compute the comparison percentages as number of a given class
over the total number in classes 6 through 13 * 100 rounded to thenearest integer.
Responsible Party – EngineerStep 11. Determine whether appropriate matches exist. The same classes
should be present as 10 percent or more of the truck population inclasses 6 through 13 for a match to exist.
Responsible Party – Engineer

Pavement Design ProceduresVerification of Classification Data
Updated 11/1/2002 III-124
Step 12. If a match does not exist consult with MD SHA Traffic ForecastingSection the possible source of differences.
Responsible Party – Engineer
Step 13. Place all completed forms in project file.Responsible Party - Engineer
III.N.4 Classification Counting Training and QualificationAn individual is considered capable of conducting classification counts if they have a95% accuracy rate for a one-hour real time classification count. Training in classificationcounting is done on a self-paced basis and consists of a five-step process including twoseparate tests. Tests may be repeated until passed.
Step 1. Introduction to Classification Counting – A short PowerPoint slideshow on the training process and the classification system.
Responsible Party – Team Leader and Team MemberStep 2. Practice identifying vehicles by class using flash cards. Cards should
be shuffled and reviewed randomly.Responsible Party – Team Member
Step 3. Take a quiz using 25 randomly selected classification cards. There isno time limit. Cards should not be shuffled between selection andscoring of test. A passing score is 23 or more correctly identified.
Responsible Party – Team Leader and Team MemberStep 4. Practice identifying vehicles in real time using one or more CD-ROM
videos with sites which have volumes consistent with most projects inthe individual’s district. Five minute volumes are available to checkanswers.
Responsible Party –Team MemberStep 5. Take a quiz using one or more CD-ROMs and four 15-minute
intervals. A passing score is 95% or more correctly counted andidentified.
Responsible Party – Team Leader and Team Member

Pavement Design ProceduresVerification of Classification Data
Updated 11/1/2002 III-125
III.N.5 Verification of Classification Data Process Flowchart

Pavement Design Procedures Pavement Marking Eradication
Updated 2/12/2003 III-126
III.O PAVEMENT MARKING ERADICATION
III.O.1 PurposeThe type of lane marking and the condition of the lane marking will effect pavementrehabilitation recommendations. Identifying the type and condition of the lane marking will aidin the following:
• Establishing the overall condition of the pavement markings• Determining if the pavement markings need to be removed• Determining the procedure for removing pavement markings
III.O.2 Resource RequirementsThe pavement marking visual survey procedure documented below requires the followingstaffing needs for a typical job:
Position Function Resources Effort Level(man-hours)
Staff Engineer or Project Engineer Site Visit 1 4Staff Engineer or Project Engineer Data Collection 1 1Staff Engineer or Project Engineer Determination of Lane
Marking Eradication1 1
III.O.3 ProcedureThe procedure presented in the attached flowchart and described in the following text shouldbe followed to rate the pavement marking condition for all pavement related projects. Thevisual survey to determine the type of lane marking and its condition should be performedduring the Visual Survey for Pavement Rehabilitation Design. It is important to identify thepavement marking material and condition of the pavement markings because it may affect thePavement Rehabilitation Recommendations. The evaluation described below is conductedwhile walking slowly alongside the highway pavement. Protective clothing must be worn(safety vest and hard hat) at all times when conducting the survey. In addition, a surveyvehicle equipped with a mounted flashing light should be parked behind the surveyor or at alocation visible to traveling motorists.
Step 1. Ride full length of job in each direction in the slowest travel lane to identifythe overall condition of the pavement lane markings.
Responsible Party – Engineer
Step 2. Identify the following:
• The pavement marking material, which may be one or a combination ofthe following materials (see the chart on Page II.M-2 for definitions ofpavement marking materials):1. Paint (see Figure 1)2. Thermoplastic (see Figure 2)3. Paint over Thermoplastic
Pavement Design Procedures Pavement Marking Eradication
Updated 2/12/2003 III-127
4. Patterned or Non-Patterned Tape (see Figures 3 and 4)5. Epoxy
Pavement Marking Material Material DescriptionPaint Water-borne, non-durable pavement
markings composed of a mixture ofpigments, resins, fillers, and water.
Thermoplastic Durable, high-quality pavement marking.The 100% solid mixture formula iscomposed of either maleic-modifiedglycerol resin esters or hydrocarbonresins with plasticizers, and glass beadsthat become liquid with heat.
Patterned and Non-PatternedTape
Durable pavement marking that is coldapplied. Typically, tape is comprised ofthree layers: adhesive layer, backingmaterial, and pigment and glass beadlayer.
Epoxy Durable, high quality pavement markingthat is 100% solid. Two-componentmaterial composed of a pigmented resinand a catalyst for hardening.
Step 3: Determine the percentage of bead coverage (see Figures 5 and 6) :1. Low Bead Percentage (5%-50%)2. Medium Bead Percentage (50%)3. High Bead Percentage (50%-100%)
Rule of Thumb: Look at the pavement markings with your back to the sun(the shadow of your head should be near the movement marking) todetermine the percentage of bead coverage. Responsible Party – Engineer or (SPID)
Step 4. Determine the wear condition of the pavement lane markings. Thecondition of the lane markings will have severity level similar to that ofpavement distresses. See Table 1, "Pavement Marking Wear ConditionGuidelines", for guidelines to determine pavement lane marking condition.Responsible Party – Engineer or SPID
Pavement Design Procedures Pavement Marking Eradication
Updated 2/12/2003 III-128
Step 5. Determine how the lane markings should be removed. Keep in mind thatthe lane markings should be removed in the method that is leastdamaging to the pavement. Use the following guidelines to determine themethod of removal for pavement markings.
Pavement Marking Removal Guidelines:Paint:Low Severity Paint Markings on Asphalt Surface and adding an asphalt
lift </=1"
• Hydroblasting
• Hydroblasting with gritNote: Removal is necessary since an asphalt lift of </=1" will not adequatelycover paint markings.
Low Severity Paint Markings on Asphalt Surface and adding an asphalt lift>1"
• Removal is not necessary. An asphalt lift of >1" will adequately coverpaint markings.
Medium and High Severity Paint Markings
• Removal is not necessary
Thermoplastic:Low to High Severity Thermoplastic
• Hydroblasting
• Hydroblasting with grit
• Bead/Pellet blasting less than 1/8 in. depth
• Grinding
Tape:Low to High Severity Tape
• Manually Scrape
• Hydroblasting
• Hydroblasting with grit
• Bead/Pellet blasting less than 1/8 in. depth
• Grinding
Pavement Design Procedures Pavement Marking Eradication
Updated 2/12/2003 III-129
Epoxy:Low to High Severity Epoxy
• Hydroblasting
• Hydroblasting with grit
• Bead/pellet blasting less than 1/8 in. depth
• Grinding
Responsible Party – Engineer or SPID
Step 5. Information from Steps 2-5 should be gathered and Form PD-XX should becompleted. Place the completed forms in project file.Responsible Party - Engineer
Step 6. Follow the Steps in Section III.F "Pavement Rehabilitation Design" andconsider the pavement marking types and removal while developingrehabilitation recommendations. If applicable, include the PavementEradication Specification.

Pavement Design Procedures Pavement Marking Eradication
Updated 2/12/2003 III-130
III.O.4 Pavement Marking Photos
Figure 1. High SeverityWear Paint Lane Marking.
Figure 2. High SeverityWear Thermoplastic LaneMarking.
Figure 3. Medium SeverityWear Patterned Tape LaneMarking.
Figure 4. High SeverityWear Non-Patterned TapeLane Marking.

Pavement Design Procedures Pavement Marking Eradication
Updated 2/12/2003 III-131
III.O.5 Percentage of Bead Coverage
Figure 5. 5% Bead Coverage
Figure 6. 50% Bead Coverage


Pavement Design Procedures Pavement Marking Eradication
Updated 2/12/2003 III-132
III.O.6 Pavement Marking Condition GuidelinesTable 1.PavementMarkingCondition
Paint and ThinThermoplastic
Thermoplastic Paint overThermoplastic
Tape Epoxy
Low SeverityWear
• Paint is highlyvisible
• High beadpercentage
• Paint and beadsare reflective
• Lane markingsadhere to thepavement
• Lane markings arenot delaminating
• Lane markings arehighly visible
• Lane markings areadhering to thepavement
• Paint is reflective
• Lane markings arenot delaminating
• Lane markingsadhere to thepavement
• Lane markings arenot delaminating
• Epoxy is highlyvisible
• High beadpercentage
• Epoxy and beadsare reflective
Medium SeverityWear
• Paint is starting towear away fromthe pavementsurface
• Paint is fading andnot highlyreflective
• Medium beadpercentage
• Lane marking isstarting to chipaway from thepavement surface
• Paint is fading andnot highly effective
• Lane markings arestarting to chip awayfrom the pavementsurface
• Lane marking isstarting to chipaway from thepavement surface
• Epoxy is starting towear away from thepavement surface
• Epoxy is fading andnot highly reflective
• Medium beadpercentage
High SeverityWear
• Paint is not easilyvisible
• Paint is notreflective
• Lane markings arepeeling away fromthe pavementsurface
• A lot of delaminationis present
• Paint is faded and nothighly reflective
• Lane markings arepealing away from thepavement surface
• A lot of delamination ispresent
• Lane markings arepeeling away fromthe pavementsurface
• A lot ofdelamination ispresent
• Epoxy is not easilyvisible
• Epoxy is notreflective
Responsible Party – Engineer or SPID

Pavement Design Policies Pavement Marking Eradication
Updated 2/12/2003
III.O.7 Visual Survey Process Flowchart
Identify thepavement marking
material and the % ofbead coverage
Steps 1 and 2
Engineer
Determine the wearcondition of the
pavement markings
Step 3
Determine the Methodof removal
Step 4
Prepare PavementRehabilitation
Step 5
Insert PavementMarking Eradication
Specification
Ste 6Step 6
FormPD-14
III-133

Forms
Updated 11/1/2002 IV-1
IV FORMSIn order to standardize pavement data collection analysis efforts, several forms weredeveloped for pavement designers to use while developing pavement recommendations.These forms are referred to and described in the procedures in Section III of thispavement design guide. The following table lists all the current forms, their purpose, andwhether the form currently is used as part of the standard operating procedure:
Form Form Name Purpose Used?PD-01 FY Project Estimate Summary Form Estimate YesPD-02 Flexible/Composite Pavement Visual Survey Form PCI Surveys YesPD-02a Rigid Pavement Visual Survey Form PCI Surveys YesPD-03 Sampling Rate Form PCI Surveys YesPD-04 Rehabilitation Design Condition Summary Form Estimate YesPD-05 Field Testing Request Form Request YesPD-06 Pavement Rehabilitation Design QC Form QC YesPD-06a PCI Visual Survey Quality Control Form QC YesPD-06b Patching Survey Quality Control Form QC YesPD-06c FWD Data Quality Control Form QCPD-07 Pavement Patching Survey Form Patching YesPD-08 Patching Quantity Spreadsheet Patching YesPD-09 Project Summary Information Form Design YesPD-10 Pavement Rehabilitation Alternatives Form Design YesPD-11 Ride Quality Specification Guideline Form Design YesPD-12PD-13 PE Cost Estimate Form Estimate Yes
The remaining portion of this section provides copies of the current forms used by thepavement design unit of the Pavement Division of OMT.

Unit Cost
Updated 11/1/2002 V-1
V UNIT COSTThe cost of materials and construction operations is a critical element in determining themost beneficial and cost effective pavement recommendation for MDSHA projects. Theunit cost of particular construction materials and operations has been used extensively inlife cycle costs analysis (LCCA) procedures like the MDSHA process described inSection III.H. The MDSHA Pavement Division of OMT has taken the unit costinformation beyond LCCA for use in determining the most economical rehabilitationalternatives for MDSHA. This approach is documented in several areas of Section III.
MDSHA regularly produces a “Price Index”, that provides the specific bid prices of amajority of the construction materials and operations used in MDSHA projects. Thecontract numbers, quantity, and bid price of all advertised contract materials andoperations are stored in the MDSHA Transport system. A category code numberreferences each item in the database. Price differences based on quantity amounts canbe calculated from this data. Regional and local price difference can also be observedwith this type of data storage. Not all items have category code numbers that wouldallow the data to be collected and stored, therefore some “write-in” items will not beavailable in the “Price Index.” An electronic form of this data can also be obtained byusing the software program “Estimator.” This program provides the same information asthe “Price Index”, but allows greater flexibility with the type and number of filters on therequested information. Both of these items are readily available to all pavementdesigners who are expected to use the information in the development of their pavementrecommendations.
The Pavement Management Unit of the Pavement Division also keeps a database ofpavement-related materials and operations. These include special items and “write-in”items to recorded in the other two sources for unit prices. All unit prices are extremelydependent on the quantity of material in the project. Actual prices will vary widelydepending on the contractor and their approach to bidding and figuring profit in variousproject items. In the tables below are some common pavement materials andoperations and the current range of unit prices:
HMA Items Typical Unit Price Reasonable RangeHMA 12.5 mm Gap Graded PG 76-22 $50 / ton $40 – 65 / tonHMA 12.5 mm Gap Graded PG 70-22 $45 / ton $35 – 55 / tonHMA 12.5 mm PG 76-22, 8 PV $48 / ton $40 – 55 / tonHMA 12.5 mm PG 70-22, 8 PV $42 / ton $37 – 50 / tonHMA 12.5 mm PG 64-22 $36 / ton $30 – 40 / tonHMA 19.0 mm or 25.0 mm PG 64-22 $32 / ton $25 – 36 / tonPCC Items Typical Unit Price Reasonable RangeNew PCC with no steel – 10.0” $40 / sy $30 – 50 / syNew PCC with steel reinforcement – 10.0” $50 / sy $40 – 60 / syPCC Patching $125 / sy $100 – 200 / syNote: At the time of the developing of this page, there has been no difference in pricebetween PG 70-22 versus PG 64-22. All evidence has shown that PG 64-28 is also thesame price, or $1 or $ 2 more a ton. There has been no significant difference in contractprice for different HMA traffic levels. All HMA prices are highly dependent on oil prices.

Unit Cost
Updated 11/1/2002 V-2
Geotechnical Items Typical Unit Price Reasonable RangeCommon Borrow $7 / cy $5 – 10 / cySelect Borrow $10 / cy $8 – 12 / cyCapping Borrow $12 / cy $10 – 15 / cyModified Borrow $14 / cy $12 – 17 / cyGraded Aggregate Base – 6.0” $ 7 / sy $4 – 10 / syUnsuitable Material Replacement $33 / cy $25 – 40 / cyClass 1 Excavation $10 / cy $6 – 15 / cyClass 1A Excavation $16 / cy $10 – 25 / cyClass 2 Excavation $13 / cy $10 – 20 / cyPre-Overlay/Maintenance Items Typical Unit Price Reasonable RangeHMA 4.75 mm PG 64-22, Wedge/Level $40 / ton $30 – 50 / tonHMA 9.5 mm PG 64-22, Wedge/Level $35 / ton $25 – 40 / tonHMA 19.0 / 25.0 mm PG 64-22,Partial-Depth Patching
$45 / ton$25 / sy
$35 – 55 / ton$15 – 35 / sy
HMA 19.0 / 25.0 mm PG 64-22,Full-Depth Patching
$55 / ton$30 / sy
$45 – 65 / ton$20 – 40 / sy
Milling / Grinding $1.50 / sy $1.00 – 2.00 / syLatex Modified Slurry Seal – One application $1.00 / sy $0.75 – 1.25 / syNovachip $4.00 / sy $3.00 – 5.00 / syTypical HMA Overlay – 1.0” $2.00 / sy $1.75 – 2.25 / sy
Pavement Design Policies
Updated 11/1/2002 VI-1
VI PAVEMENT DESIGN POLICIESPavement recommendations for MDSHA construction projects require both pavementand material design. Pavement design and material policies were developed to provideguidance to and consistency between MDSHA pavement designers. The following is alist of the current pavement design and material policies and their appropriate sections:
VI.A – Design Input PropertiesVI.A.1 – New and Rehabilitation Pavement Design
VI.A.1.1 – Design LifeVI.A.1.2 – Reliability, RVI.A.1.3 – Standard Deviation, SVI.A.1.4 – Initial Serviceability, PSIiVI.A.1.5 – Terminal Serviceability, PSItVI.A.1.6 – Load Transfer Coefficient, JVI.A.1.7 – Loss of Support, LSVI.A.1.8 – Overall Drainage Coefficent, CdVI.A.1.9 – Traffic Lane Distribution
VI.A.2 – ESALs to FailureVI.A.2.1 – Reliability, RVI.A.2.2 – Standard Deviation, SVI.A.2.3 – Initial Serviceability, PSIiVI.A.2.4 – Terminal Serviceability, PSItVI.A.2.5 – Load Transfer Coefficient, JVI.A.2.6 – Loss of Support, LSVI.A.2.7 – Traffic Lane Distribution
VI.A.3 – Shoulder DesignVI.A.3.1 – Design LifeVI.A.3.2 – Reliability, RVI.A.3.3 – Standard Deviation, SVI.A.3.4 – Initial Serviceability, PSIiVI.A.3.5 – Terminal Serviceability, PSItVI.A.3.6 – Load Transfer Coefficient, JVI.A.3.7 – Loss of Support, LSVI.A.3.8 – Overall Drainage Coefficent, CdVI.A.3.9 – ESAL Adjustment Factor - ShoulderVI.A.3.10 – Traffic Lane Distribution
VI.A.4 – Temporary / Detour Road DesignVI.A.4.1 – Design LifeVI.A.4.2 – Reliability, RVI.A.4.3 – Standard Deviation, SVI.A.4.4 – Initial Serviceability, PSIiVI.A.4.5 – Terminal Serviceability, PSItVI.A.4.6 – Other FactorsVI.A.4.7 – Traffic Lane Distribution
VI.B – Material Selection PropertiesVI.B.1 – Superpave Criteria
VI.B.1.1 – PG Binder SelectionVI.B.1.2 – ESAL Category Selection

Pavement Design Policies
Updated 11/1/2002 VI-2
VI.B.1.3 – HMA Mix SelectionVI.B.1.4 – Number of ESAL Categories per MixVI.B.1.5 – Number of PG Binders per ContractVI.A.1.6 – Number of HMA Mixes per ContractVI.A.1.7 – Placement of Final Surface Material
VI.B.2 – Wearing Coarse SelectionVI.B.2.1 – Specifying Gap Graded HMA MixesVI.B.2.2 – Specifying High Polish Value HMA Mixes
VI.B.3 – Reflective Crack ControlVI.B.3.1 – Minimum HMA Overlay ThicknessVI.B.3.2 – Joint Tape
VI.B.3.2.1 – Application of Joint TapeVI.B.3.2.2 – Resurfacing with Joint TapeVI.B.3.2.3 – Location of Joint Tape
VI.B.4 – Lay-down OperationsVI.A.4.1 – Material Transfer Vehicle (MTV)
VI.C – Economic Analysis Properties
VI.D – Traffic Analysis Properties
VI.E – Miscellaneous PropertiesVI.E.1 – Application of Ride SpecificationVI.E.2 – Ride Incentive
VI.A DESIGN INPUT POLICIESThe MDSHA pavement design process requires several AASHTO and MDSHA standarddesign inputs. These inputs vary depending on the type of design that is developed,new and rehabilitation design, ESALs to Failure, shoulder design, and temporary roaddesign. These design inputs will provide a level of consistency between designers andacross the state of Maryland.
VI.A.1 New and Rehabilitation Pavement DesignThe design inputs required for new and rehabilitation pavement design vary dependingon the existing conditions at the project site, the functional classification of the roadway,and the pavement type. These design inputs follow the same guidelines as thosedeveloped by AASHTO, but modified for local conditions. The design inputs in SectionVI.A.1 are needed to develop new and rehabilitation pavement designrecommendations.
VI.A.1.1 Design Life (New/Rehab)If a project is assigned a design life through the use of the tools in the MarylandPavement Management System (PMS), then the selected design service life shall beused in pavement design. Otherwise, if the PMS did not assign the project an actionclass, select the design service life based on the following table:

Pavement Design Policies
Updated 11/1/2002 VI-3
Pavement Rehabilitation Technique Desired DesignService Life
Minimum DesignService Life
HMA Overlay 12 8
PCC Bonded Overlay 15 12
PCC Unbonded Overlay 20 20
Rubblize and HMA Overlay 15 15
Break and Seat and HMA Overlay 15 12
Saw and Seal with HMA Overlay 12 8
Ultra-Thin Whitetopping 10 8
In-Place Recycled HMA Overlay 8 5
Recycled HMA Overlay 12 8
CPR 8 5
New Flexible Construction and Widening 15 15
New Rigid Construction and Widening 25 25
VI.A.1.2 Reliability, R (New/Rehab)Use the following table to select the appropriate Reliability based on the functional classof the roadway:
Urban RuralFunctional Class Desired
ReliabilityMinimumReliability
DesiredReliability
MinimumReliability
Interstate 95 90 95 85
Freeways andExpressways 90 85
Principal Arterial –Other 90 85 90 80
Minor Arterial 90 80 85 80
Major Collector 80 75
Minor Collector 80 75
Collector 85 75
Local 80 70 75 70
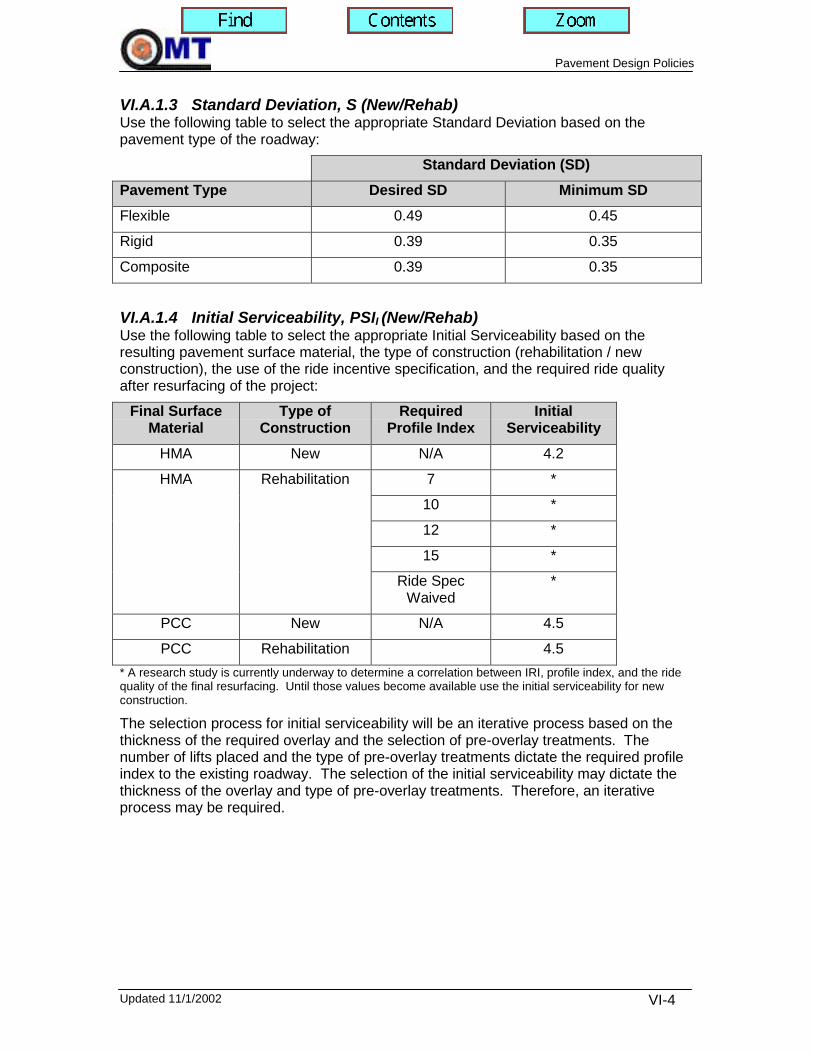
Pavement Design Policies
Updated 11/1/2002 VI-4
VI.A.1.3 Standard Deviation, S (New/Rehab)Use the following table to select the appropriate Standard Deviation based on thepavement type of the roadway:
Standard Deviation (SD)Pavement Type Desired SD Minimum SDFlexible 0.49 0.45
Rigid 0.39 0.35
Composite 0.39 0.35
VI.A.1.4 Initial Serviceability, PSII (New/Rehab)Use the following table to select the appropriate Initial Serviceability based on theresulting pavement surface material, the type of construction (rehabilitation / newconstruction), the use of the ride incentive specification, and the required ride qualityafter resurfacing of the project:
Final SurfaceMaterial
Type ofConstruction
RequiredProfile Index
InitialServiceability
HMA New N/A 4.2
7 *
10 *
12 *
15 *
HMA Rehabilitation
Ride SpecWaived
*
PCC New N/A 4.5
PCC Rehabilitation 4.5* A research study is currently underway to determine a correlation between IRI, profile index, and the ridequality of the final resurfacing. Until those values become available use the initial serviceability for newconstruction.
The selection process for initial serviceability will be an iterative process based on thethickness of the required overlay and the selection of pre-overlay treatments. Thenumber of lifts placed and the type of pre-overlay treatments dictate the required profileindex to the existing roadway. The selection of the initial serviceability may dictate thethickness of the overlay and type of pre-overlay treatments. Therefore, an iterativeprocess may be required.
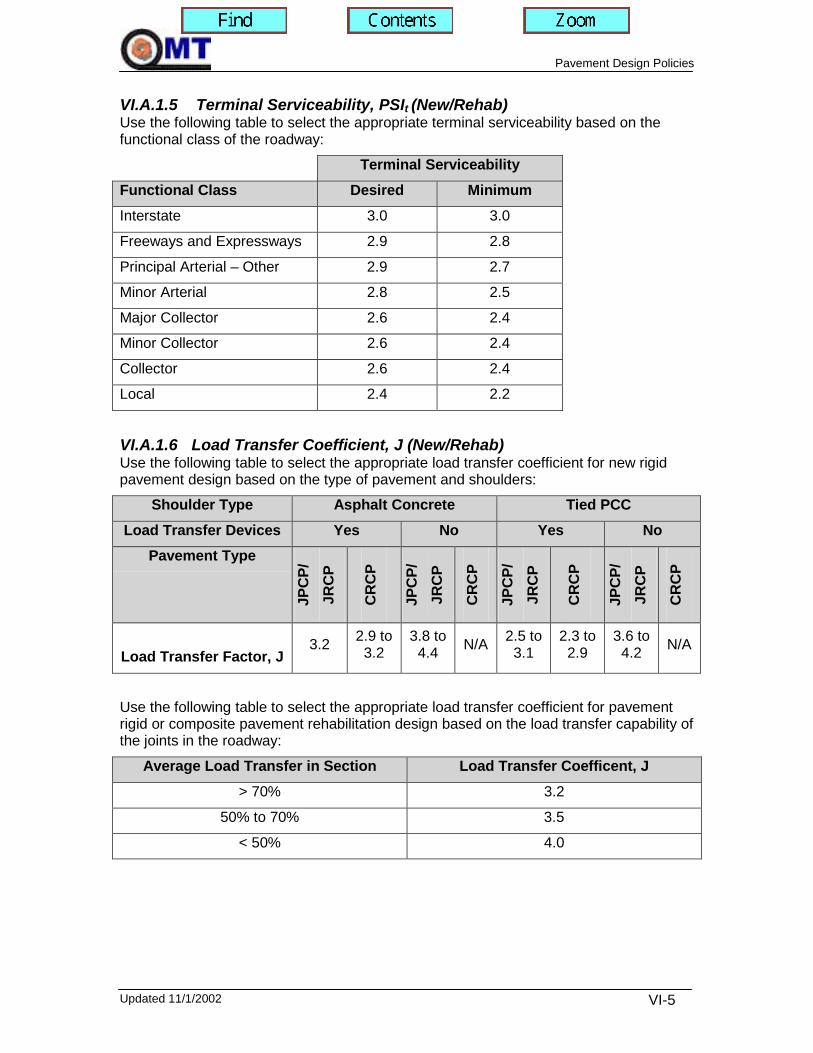
Pavement Design Policies
Updated 11/1/2002 VI-5
VI.A.1.5 Terminal Serviceability, PSIt (New/Rehab)Use the following table to select the appropriate terminal serviceability based on thefunctional class of the roadway:
Terminal ServiceabilityFunctional Class Desired MinimumInterstate 3.0 3.0
Freeways and Expressways 2.9 2.8
Principal Arterial – Other 2.9 2.7
Minor Arterial 2.8 2.5
Major Collector 2.6 2.4
Minor Collector 2.6 2.4
Collector 2.6 2.4
Local 2.4 2.2
VI.A.1.6 Load Transfer Coefficient, J (New/Rehab)Use the following table to select the appropriate load transfer coefficient for new rigidpavement design based on the type of pavement and shoulders:
Shoulder Type Asphalt Concrete Tied PCCLoad Transfer Devices Yes No Yes No
Pavement Type
JPC
P/JR
CP
CR
CP
JPC
P/JR
CP
CR
CP
JPC
P/JR
CP
CR
CP
JPC
P/JR
CP
CR
CP
Load Transfer Factor, J3.2 2.9 to
3.23.8 to4.4 N/A 2.5 to
3.12.3 to2.9
3.6 to4.2 N/A
Use the following table to select the appropriate load transfer coefficient for pavementrigid or composite pavement rehabilitation design based on the load transfer capability ofthe joints in the roadway:
Average Load Transfer in Section Load Transfer Coefficent, J> 70% 3.2
50% to 70% 3.5
< 50% 4.0

Pavement Design Policies
Updated 11/1/2002 VI-6
VI.A.1.7 Loss of Support, LS (New/Rehab)Use the following table to select the appropriate loss of support value for determining themodulus of subgrade reaction (k) without FWD testing based on the base material typesin the pavement structure:
TreatmentA
ll R
ehab
Met
hods
New
PC
Cw
/ AC
or
PCC
trea
ted
base
New
PC
Cw
/ lim
est
abili
zed
subg
rade
or c
emen
tso
il
New
PC
Cw
/un
boun
dG
AB
New
PC
Cw
/ no
base
mat
eria
l
0 0 1 2 3
VI.A.1.8 Overall Drainage Coefficient, Cd (New/Rehab)Refer to Table 2.5 on page II-26 in the AASHTO “Guide for Design of PavementStructures”. Confer with some from Geotechnical Explorations to provide a moredetailed description for moisture and soil conditions particular to Maryland.
VI.A.1.9 Traffic Lane Distribution (New/Rehab)Use the following table to select the appropriate traffic lane distribution factor based onthe number lanes in each (design) direction.
Number of Lanes inDesign Direction
Range of Percent of ESALin Design Lane
Desired Percent of ESALin Design Lane
1 100 100
2 80 – 100 90
3 60 – 80 80
4 50 – 75 70
5+ 40 – 70 60
VI.A.2 ESALs to FailureESALs to failure is needed to calculate the effective structural capacity of a pavementstructure based on traffic remaining life analysis. ESALs to failure is the number of 18-kip axle applications required to fail a given pavement structure, a terminal serviceabilityof 1.5. This number of applications is then compared to actual number of applications toa pavement structure.
VI.A.2.1 Reliability, R (ESALs to Failure)All pavement types are designed with a reliability of 50% for ESALs to failure.

Pavement Design Policies
Updated 11/1/2002 VI-7
VI.A.2.2 Standard Deviation, S (ESALs to Failure)Use the following table to select the appropriate Standard Deviation based on thepavement type of the roadway:
Standard Deviation (SD)Pavement Type Desired SD Minimum SDFlexible 0.49 0.45
Rigid 0.39 0.35
Composite 0.39 0.35
VI.A.2.3 Initial Serviceability, PSII (ESALs to Failure)Use the following table to select the appropriate Initial Serviceability based on theresulting pavement surface material of the project:
Final Surface Material Initial ServiceabilityHMA 4.2
PCC 4.5
VI.A.2.4 Terminal Serviceability, PSIt (ESALs to Failure)The terminal serviceability for all pavement types is specified to be 1.5.
VI.A.2.5 Load Transfer Coefficient, J (ESALs to Failure)Use the following table to select the appropriate load transfer coefficient based on theload transfer capability of the joints, existing pavement type at the time of the lastrehabilitation, type of shoulder, and the existence of the load transfer devices in theroadway:
Existing Pavement Type atTime of Last Rehabilitation
Type ofShoulder
Load TransferDevice
Load TransferCoefficent, J
JPCP, JRCP AC Yes 3.2
JPCP, JRCP AC No 3.8 – 4.0
JPCP, JRCP Tied PCC Yes 2.8 – 3.1
JPCP, JRCP Tied PCC No 3.6 – 3.8
CRCP AC N/A 2.9 – 3.2
CRCP Tied PCC N/A 2.6 – 2.9
Composite Pavement N/A N/A 3.2 – 3.5

Pavement Design Policies
Updated 11/1/2002 VI-8
VI.A.2.6 Overall Drainage Coefficient, Cd (ESALs to Failure)Refer to Table 2.5 on page II-26 in the AASHTO “Guide for Design of PavementStructures”. Confer with someone from Geotechnical Explorations Division to provide amore detailed description for moisture and soil conditions particular to Maryland.
VI.A.2.7 Traffic Lane Distribution (ESALs to Failure)Use the following table to select the appropriate traffic lane distribution factor based onthe number lanes in each (design) direction.
Number of Lanes inDesign Direction
Range of Percent of ESALin Design Lane
Desired Percent of ESALin Design Lane
1 100 100
2 80 – 100 90
3 60 – 80 80
4 50 – 75 70
5+ 40 – 70 60
VI.A.3 Shoulder DesignThe design inputs required for shoulder pavement design vary depending on the existingconditions at the project site, the functional classification of the roadway, and thepavement type. These design inputs follow the same guidelines as those developed byAASHTO, but modified for local conditions. The design inputs are similar to those fornew and rehabilitation design with the exception of the ESAL adjustment factor.
VI.A.3.1 Design Life (Shoulder)If a project is assigned a design life through the use of the tools in the MarylandPavement Management System (PMS), then the selected design service life shall beused in pavement design. Otherwise, if the PMS did not assign the project an actionclass, select the design service life based on the following table:
Pavement Rehabilitation Technique Desired DesignService Life
Minimum DesignService Life
HMA Overlay 12 8
PCC Bonded Overlay 15 12
PCC Unbonded Overlay 20 20
Rubblize and HMA Overlay 15 15
Break and Seat and HMA Overlay 15 12
Saw and Seal with HMA Overlay 12 8
Ultra-Thin Whitetopping 10 8
In-Place Recycled HMA Overlay 8 5
Recycled HMA Overlay 12 8

Pavement Design Policies
Updated 11/1/2002 VI-9
Pavement Rehabilitation Technique Desired DesignService Life
Minimum DesignService Life
CPR 8 5
New Flexible Construction and Widening 15 15
New Rigid Construction and Widening 25 25
VI.A.3.2 Reliability, R (Shoulder)Use the following table to select the appropriate Reliability based on the functional classof the roadway:
Urban Rural
Functional Class DesiredReliability
MinimumReliability
DesiredReliability
MinimumReliability
Interstate 95 90 95 85
Freeways andExpressways 95 90
Principal Arterial –Other 95 85 90 85
Minor Arterial 90 80 85 80
Major Collector 80 75
Minor Collector 80 75
Collector 85 75
Local 80 70 75 70
VI.A.3.3 Standard Deviation, S (Shoulder)Use the following table to select the appropriate Standard Deviation based on thepavement type of the roadway:
Standard Deviation (SD)Pavement Type Desired SD Minimum SDFlexible 0.49 0.45
Rigid 0.39 0.35
Composite 0.39 0.35
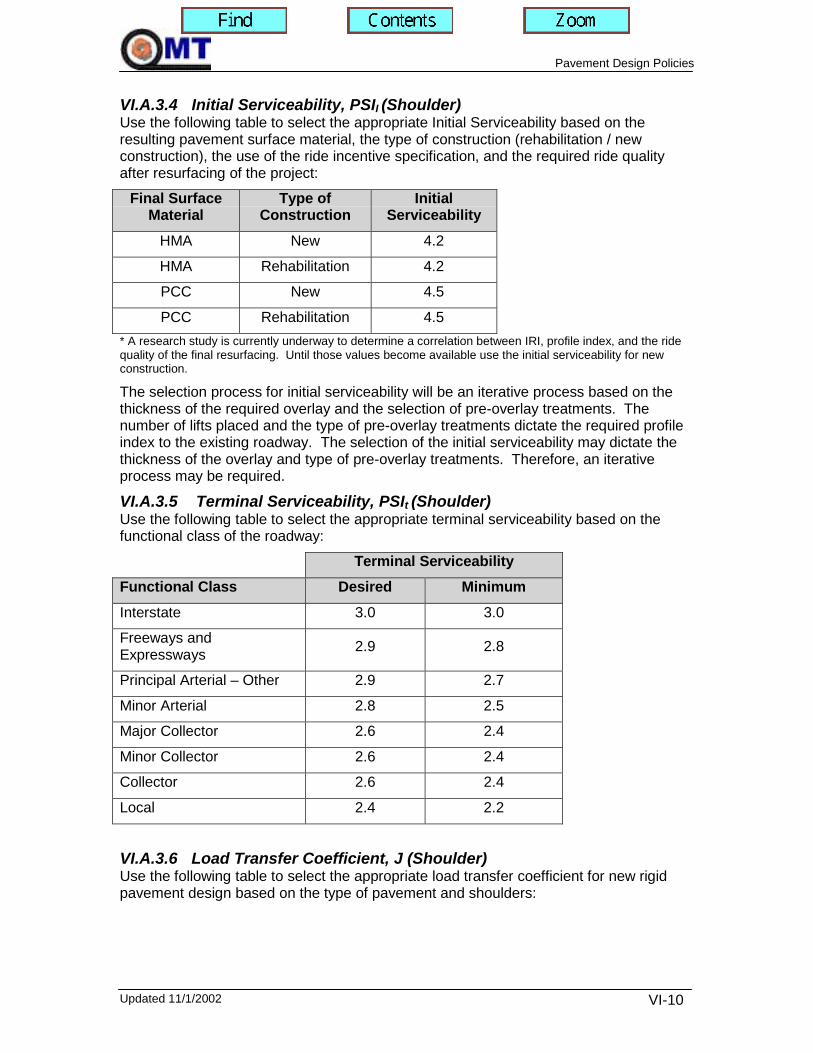
Pavement Design Policies
Updated 11/1/2002 VI-10
VI.A.3.4 Initial Serviceability, PSII (Shoulder)Use the following table to select the appropriate Initial Serviceability based on theresulting pavement surface material, the type of construction (rehabilitation / newconstruction), the use of the ride incentive specification, and the required ride qualityafter resurfacing of the project:
Final SurfaceMaterial
Type ofConstruction
InitialServiceability
HMA New 4.2
HMA Rehabilitation 4.2
PCC New 4.5
PCC Rehabilitation 4.5* A research study is currently underway to determine a correlation between IRI, profile index, and the ridequality of the final resurfacing. Until those values become available use the initial serviceability for newconstruction.
The selection process for initial serviceability will be an iterative process based on thethickness of the required overlay and the selection of pre-overlay treatments. Thenumber of lifts placed and the type of pre-overlay treatments dictate the required profileindex to the existing roadway. The selection of the initial serviceability may dictate thethickness of the overlay and type of pre-overlay treatments. Therefore, an iterativeprocess may be required.
VI.A.3.5 Terminal Serviceability, PSIt (Shoulder)Use the following table to select the appropriate terminal serviceability based on thefunctional class of the roadway:
Terminal ServiceabilityFunctional Class Desired MinimumInterstate 3.0 3.0
Freeways andExpressways 2.9 2.8
Principal Arterial – Other 2.9 2.7
Minor Arterial 2.8 2.5
Major Collector 2.6 2.4
Minor Collector 2.6 2.4
Collector 2.6 2.4
Local 2.4 2.2
VI.A.3.6 Load Transfer Coefficient, J (Shoulder)Use the following table to select the appropriate load transfer coefficient for new rigidpavement design based on the type of pavement and shoulders:

Pavement Design Policies
Updated 11/1/2002 VI-11
Shoulder Type Asphalt Concrete Tied PCCLoad Transfer Devices Yes No Yes No
Pavement Type
JPC
P/JR
CP
CR
CP
JPC
P/JR
CP
CR
CP
JPC
P/JR
CP
CR
CP
JPC
P/JR
CP
CR
CP
Load Transfer Factor, J3.2 2.9 to
3.23.8 to4.4 N/A 2.5 to
3.12.3 to2.9
3.6 to4.2 N/A
Use the following table to select the appropriate load transfer coefficient for pavementrigid or composite pavement rehabilitation design based on the load transfer capability ofthe joints in the roadway:
Average Load Transfer in Section Load Transfer Coefficent, J> 70% 3.2
50% to 70% 3.5
< 50% 4.0
VI.A.3.7 Loss of Support, LS (Shoulder)Use the following table to select the appropriate loss of support value for determining themodulus of subgrade reaction (k) without FWD testing based on the base material typesin the pavement structure:
Treatment
All
Reh
abM
etho
ds
New
PC
Cw
/ AC
or
PCC
trea
ted
base
New
PC
Cw
/ lim
est
abili
zed
subg
rade
or c
emen
tso
il
New
PC
Cw
/un
boun
dG
AB
New
PC
Cw
/ no
base
mat
eria
l0 0 1 2 3
VI.A.3.8 Overall Drainage Coefficient, Cd (Shoulder)Refer to Table 2.5 on page II-26 in the AASHTO “Guide for Design of PavementStructures”. Confer with some from Geotechnical Explorations to provide a moredetailed description for moisture and soil conditions particular to Maryland.
VI.A.3.9 ESAL Adjustment Factor (Shoulder)The design ESALs for the pavement design of the shoulder will be based on apercentage of the design ESALs for the mainline roadway. Use the following table toselect the appropriate ESAL adjustment factor based on the functional class of theroadway:
Functional Class Percent of DesignESALs

Pavement Design Policies
Updated 11/1/2002 VI-12
Interstate 100%
Freeways and Expressways 100%
Principal Arterial – Other 100%
Minor Arterial 10%
Major Collector 10%
Minor Collector 10%
Collector 10%
Local 10%
VI.A.3.10 Traffic Lane Distribution (Shoulder)Use the following table to select the appropriate traffic lane distribution factor based onthe number lanes in each (design) direction.
Number of Lanes inDesign Direction
Range of Percent of ESALin Design Lane
Desired Percent of ESALin Design Lane
1 100 100
2 80 – 100 90
3 60 – 80 80
4 50 – 75 70
5+ 40 – 70 60
VI.A.4 Temporary / Detour Road DesignThe design inputs required for temporary / detour road pavement design vary depending on theexisting conditions at the project site, the functional classification of the roadway, and thepavement type. These design inputs follow the same guidelines as those developed byAASHTO, but modified for local conditions. The design inputs vary from new and rehabilitationdesign to account for the abbreviated service life and into account that the pavement is taken tofailure at the conclusion of the service life.
VI.A.4.1 Design Life (Temporary)The design life for a temporary or detour road shall be the maximum of 1 of thefollowing:
• MOT construction duration – verify with highway design and constructioninspection
• 2 years
VI.A.4.2 Reliability, R (Temporary)Temporary / detour roads shall be designed with a Reliability of 50%.

Pavement Design Policies
Updated 11/1/2002 VI-13
VI.A.4.3 Standard Deviation, S (Temporary)Use the following Standard Deviation to design temporary / detour roads:
Standard Deviation (SD)Desired SD Minimum SD
0.49 0.45
VI.A.4.4 Initial Serviceability, PSII (Temporary)Temporary / detour roads shall be designed with an Initial Serviceability of 4.2.
VI.A.4.5 Terminal Serviceability, PSIt (Temporary)Temporary / detour roads shall be designed with a Terminal Serviceability of 2.0.
VI.A.4.6 Other Factors (Temporary)Temporary / detour roads shall be designed with the goal to minimize the amount ofHMA material placed in the temporary pavement structure. The goal should be to utilizegraded aggregate base to the fullest extend to keep material costs for a temporarypavement structure to a minimum.
VI.A.4.7 Traffic Lane Distribution (Temporary)Use the following table to select the appropriate traffic lane distribution factor based onthe number lanes in each (design) direction.
Number of Lanes inDesign Direction
Range of Percent of ESALin Design Lane
Desired Percent of ESALin Design Lane
1 100 100
2 80 – 100 90
3 60 – 80 80
4 50 – 75 70
5+ 40 – 70 60

Pavement Design Policies
Updated 11/1/2002 VI-14
VI.B MATERIAL SELECTION POLICIESThere was a need to develop a section of material selection policies because of thenumerous pavement material designations available to a MDSHA pavement designer.Policies for material selection provide both guidance to and consistency betweenMDSHA pavement designers. This need is especially true with the adoption of theSuperpave HMA mix design criteria and the numerous types of HMA mixes that weregenerated. In addition, policy and guidance for wearing coarse selection and reflectivecrack control are also addressed in this section.
VI.B.1 Superpave HMA CriteriaThis adoption of the Superpave HMA mix design criteria and the numerous types ofHMA mixes that were generated sparked the need for policy in material selection.Material selection items crucial to the Superpave HMA mix criteria include theperformance grade binder, traffic or compaction level (ESAL category), and HMA mixsize. In addition, policies regarding the type and number of HMA mixes on a typicalconstruction project are also provided.
VI.B.1.1 Performance Grade Binder SelectionThe base performance grade (PG) Binder for the state of Maryland is PG 64-22. AllHMA mixes, with the exception of the wearing coarse, shall always be designed with PG64-22 as the binder, unless the Pavement Design Policies or the Asphalt Team or siteconditions dictate otherwise. The wearing coarse PG binder can vary from PG 64-22based on the following conditions: geographic area, ESAL category, and ruttingconditions. Use the following table to select the appropriate PG binder for the project:
Wearing Surface for All Counties except Garrett:< 0.3 0.3 to 30 > 30
No Rut Rut No Rut Rut No Rut RutStandard 64-22 64-22 64-22 70-22 70-22 70-22 P
Slow 64-22 64-22 70-22 70-22 P 70-22 70-22 P< 1000 tons
Standing 64-22 70-22 70-22 P 70-22 P 70-22 P 70-22 P
Standard 64-22 64-22 64-22 70-22 70-22 76-22
Slow 64-22 64-22 70-22 76-22 70-22 76-22> 1000 tons
Standing 64-22 70-22 76-22 76-22 76-22 76-22Standing Traffic - where the average traffic speed is less than 12 mph (20 km/h).
Slow Traffic - where the average traffic speed ranges from 12 to 43 mph (20 to 70 km/h).
Standard Traffic - where the average traffic speed is greater than 43 mph (70 km/h).
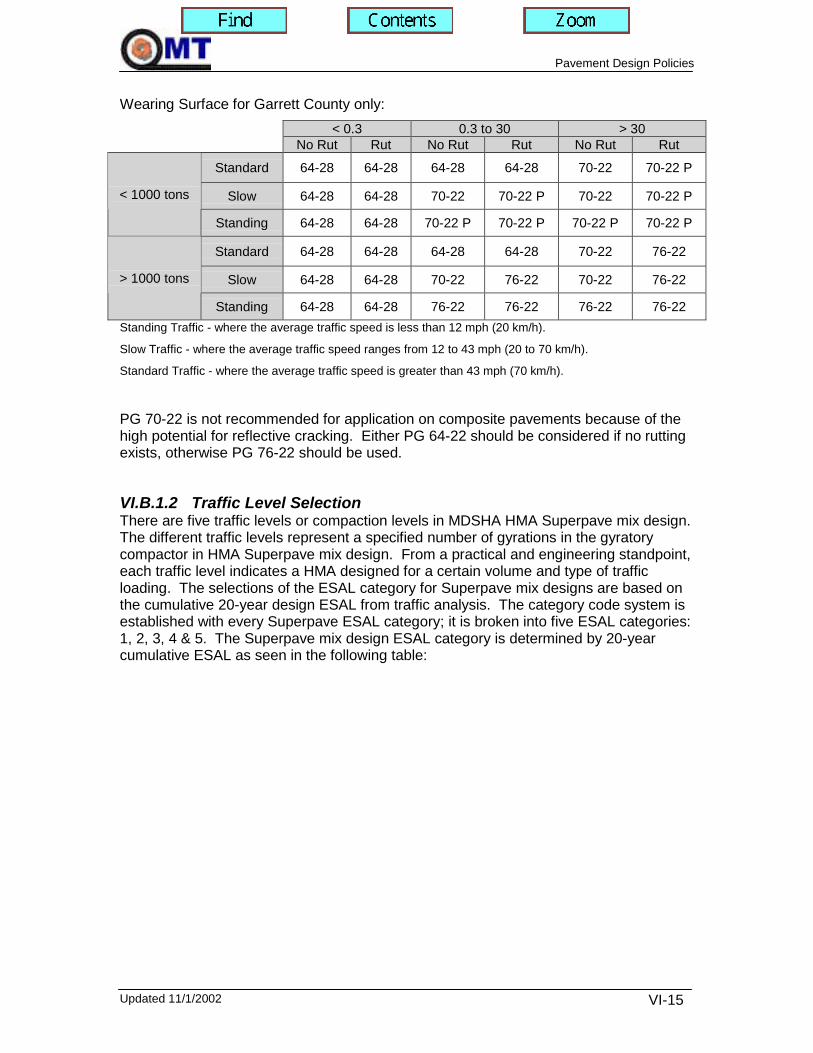
Pavement Design Policies
Updated 11/1/2002 VI-15
Wearing Surface for Garrett County only:< 0.3 0.3 to 30 > 30
No Rut Rut No Rut Rut No Rut Rut
Standard 64-28 64-28 64-28 64-28 70-22 70-22 P
Slow 64-28 64-28 70-22 70-22 P 70-22 70-22 P< 1000 tons
Standing 64-28 64-28 70-22 P 70-22 P 70-22 P 70-22 P
Standard 64-28 64-28 64-28 64-28 70-22 76-22
Slow 64-28 64-28 70-22 76-22 70-22 76-22> 1000 tons
Standing 64-28 64-28 76-22 76-22 76-22 76-22Standing Traffic - where the average traffic speed is less than 12 mph (20 km/h).
Slow Traffic - where the average traffic speed ranges from 12 to 43 mph (20 to 70 km/h).
Standard Traffic - where the average traffic speed is greater than 43 mph (70 km/h).
PG 70-22 is not recommended for application on composite pavements because of thehigh potential for reflective cracking. Either PG 64-22 should be considered if no ruttingexists, otherwise PG 76-22 should be used.
VI.B.1.2 Traffic Level SelectionThere are five traffic levels or compaction levels in MDSHA HMA Superpave mix design.The different traffic levels represent a specified number of gyrations in the gyratorycompactor in HMA Superpave mix design. From a practical and engineering standpoint,each traffic level indicates a HMA designed for a certain volume and type of trafficloading. The selections of the ESAL category for Superpave mix designs are based onthe cumulative 20-year design ESAL from traffic analysis. The category code system isestablished with every Superpave ESAL category; it is broken into five ESAL categories:1, 2, 3, 4 & 5. The Superpave mix design ESAL category is determined by 20-yearcumulative ESAL as seen in the following table:

Pavement Design Policies
Updated 11/1/2002 VI-16
CompactionParameters
CompactionLevel
DesignESALs1
(Millions) Ninitial Ndesign Nmax Typical Roadway Application 2
1 < 0.3 6 50 75
Applications include roadways with very light traffic volumes such as local roads,county roads, and city streets where truck traffic is prohibited or at a very minimallevel. Traffic on these roadways would be considered local in nature, not regional,intrastate, or interstate. Special purpose roadways serving recreational sites or areas,parking lots and driveways may also be applicable to this level.
2 0.3 to < 3.0 7 75 115 Applications include many collector roads or access streets. Medium traffic citystreets and the majority of county roadways may be applicable to this level.
3 3.0 to < 10 8 100 160Applications include many two lane, multilane, divided, and partially or completelycontrolled access roadways. Among these are medium to highly trafficked city streets,many state routes, some rural interstates and US highways.
4 10 to < 30 8 100 160Applications include many two lane, multilane, divided, and partially or completelycontrolled access roadways. Among these are medium to highly trafficked city streets,many state routes, some rural interstates and US highways.
5 > 30 9 125 205Applications include the vast majority of the US Interstate system, both rural and urbanin nature. Special applications such as truck weighing stations or truck climbing laneson two lane roadways may also be applicable to this level.
GAP > 3.0 8 100 160Gap Graded mixes are used for special application final wearing surfaces.Applications include many two lane, multilane, divided, and partially or completelycontrolled access roadways. Among these are medium to highly trafficked stateroutes, rural and urban interstates and rural and urban US highways.
Note 1 – Design ESALs are the anticipated project traffic level expected on the design lane over a 20 year period. Regardless of the actualdesign life of the roadway, determine the design ESALs for 20 years, and choose the appropriate Ndesign level.
Note 2 – When the top of the layer being designed is ≥ 100 mm from the pavement surface and the estimated design traffic level > 0.3 millionESALs, decrease the estimated design traffic level by one, unless the mixture will be exposed to significant traffic prior to being overlaid.If less than 25% of the layer is within 100 mm of the surface, the layer should be considered to be below 100 mm for mixture designpurposes.

Pavement Design Policies
Updated 11/1/2002 VI-17
VI.B.1.3 HMA Mix SelectionUse the table to select the appropriate HMA Superpave mix based on the application ofthat mix in the pavement structure:
Lift Thickness
Minimum Preferred Maximum TotalMaximum
Mix Size Design Application
4.0” 5.0” 6.0” 37.5 mm Base, DeepPatching
3.0” 3.5” 5.0” 10.5” 25.0 mm Base, Patching
2.0” 2.5” 4.0” 9.0” 19.0 mm Surface, Base,Patching
2.0” 2.5” 2.0” 2.5” 19.0 mm GAP Graded
1.5” 2.0” 3.0” 6.0” 12.5 mm Surface
1.5” 1.5” 2.0” 2.0” 12.5 mm GAP Graded
1.0” 1.5” 2.0” 3.0” 9.5 mm Surface, Leveling
1.0” 1.0” 1.5” 1.5” 9.5 mm GAP Graded
0.5” 0.75” 0.75” 0.75” 4.75 mm Surface, Rut Fill
VI.B.1.4 Number of ESAL Categories per MixOne (1) ESAL category will be specified for each mix within a contract. Exceptions tothis policy will be granted if the quantity of the mixes exceed 1,000 tons for each ESALcategory. The Asphalt Team must approve any exception to this policy.
VI.B.1.5 Number of PG Binders per ContractTwo (2) PG binders will be specified as the maximum number of PG Binders allowablewithin a contract. If a minimum PG binder can be specified for a particular project, thecontractor can provide a higher grade PG binder without objection. The temperaturerange for the PG Binder has to be the same or greater than that specified in the contractspecifications.
VI.B.1.6 Number of HMA Mixes per ContractAt a maximum, the goal is to have three (3) HMA Superpave mixes per contract.Exceptions to this policy will be granted if the quantity of the mixes exceed 1,000 tons forHMA mix.
VI.B.1.7 Placement of Final Surface MaterialThe final surface layer shall be placed on a HMA Superpave 19.0 mm base layer or finermaterial when grinding is not included in the project. This surface layer policy alsoincludes the placement of the surface layer over full-depth and partial-depth patch areas.
VI.B.2 Wearing Coarse SelectionThe wearing coarse in an HMA pavement can vary depending on the existing siteconditions, anticipated traffic conditions, and material availability. Some of the decisionsmade about the wearing coarse selection can greatly alter the cost of the materials in aparticular project. For that reason and to provide a level of consistency through thestate, material selection policies were developed for a wearing coarse.

Pavement Design Policies
Updated 11/1/2002 VI-18
VI.B.2.1 Specifying Gap Graded HMA MixesThe selection of a Gap Graded HMA mix should be discussed with the Asphalt Teamwhen the criteria for selecting a Gap Graded HMA mix is met, but other conditions mayhave more influence in the material selection. The following conditions need to thepresent prior to considering the selection of a Gap Graded HMA mix for the wearingcoarse:
• 20,000 ADT (Two-way) in the design year, and• ESAL category 4 or higher, and• With a functional class of Freeway/Expressway or greater.
VI.B.2.2 Specifying High Polish Value HMA MixesThe selection of a High Polish HMA mix should be discussed with the Asphalt Teamwhen the criteria for selecting a High Polish HMA mix are met, but other conditions mayhave more influence in the material selection. The following conditions need to thepresent prior to considering the selection of a High Polish HMA mix for the wearingcoarse:
• ESAL category 3 or lower, and• With a functional class of expressway/freeway or lower, and• At least 1 of the following items:
• 20,000 ADT (Two-way) in the design year, or• Skid Number values < 40, or• Greater than 25% of the mainline area is exhibiting polished aggregate as a
distress.
VI.B.3 Reflective Crack ControlIn 2001, composite pavements make up the largest percentage of MDSHA’s pavementnetwork. Reflective cracking is the most predominant distress present in compositepavements in Maryland. For this reason, several policies were developed in an attemptto limit the amount of reflective cracking in Maryland’s composite pavements.
VI.B.3.1 Minimum HMA Overlay ThicknessFour (4.0”) inches is the minimum thickness for a plain HMA overlay, without the use ofany other material to limit reflective cracking, on bare rigid pavement.
VI.B.3.2 Joint TapeJoint tape consists of a stress relieving and crack reduction mastic layer with polyesterwebbing. Joint tape is intended to reduce the amount of stress transferred to upperpavement layers from the horizontal environmental movement of PCC at the joints. Thesuccess of joint tape has been mixed to numerous reasons ranging from placement toappropriateness of joint tape for existing conditions. Theoretically, joint tape shouldprovide some stress relief for movement in the horizontal direction, but it would providebenefit with vertical movement at the joints resulting from poor load transfer acrossjoints.

Pavement Design Policies
Updated 11/1/2002 VI-19
VI.B.3.2.1 Application of Joint TapeAll of the following criteria need to be met in order for joint tape to be an appropriaterehabilitation tool for joint reflective cracking:
• In composite pavement, at least 25% of the joints are exhibiting at least lowseverity joint reflective cracking
• Load transfer at the joints is greater than 70% on average• Joint tape is only applied to joints with greater than 70% load transfer
VI.B.3.2.2 Resurfacing with Joint TapeUse the following criteria when determining the HMA overlay on a project that has jointtape specified as a rehabilitation tool:
• Minimum of 2 lifts• Minimum of 3.0” overlay over bare rigid pavement
VI.B.3.2.3 Location of Joint TapeJoint tape will only be placed at transverse joints. Joint tape will not be placedlongitudinal joints. Joint tape shall only be placed directly on PCC, not HMA.
VI.C LAY-DOWN OPERATIONSConstruction specifications can significantly effect the lay down operations of a HMA matand ultimately the performance of the pavement. MDSHA pavement designer’s havecontrol over some of those specifications and should use consistent policies to ensurethat quality material is placed to provide the potential for most improvement to theMDSHA pavement network.
VI.C.1.1 Material Transfer Vehicle (MTV)An MTV shall always be used for placement of Gap Graded Mixes. For other cases, theAsphalt Team, District Construction, and Construction Inspection Division need to beconsulted about the necessity for a MTV. Criteria to consider when selecting thepotential need for a MTV include the following:
• Amount of material being placed (greater than 20,000 ton for the surface material)
• Interstate resurfacing
• Other special construction needs

Pavement Design Policies
Updated 11/1/2002 VI-20
VI.D RIDE QUALITY POLICIESMaterial acceptance specifications can significantly effect the lay down operations of aHMA mat and ultimately the performance of the pavement. MDSHA pavementdesigner’s have control over some of those specifications and should use consistentpolicies to ensure that quality material is placed to provide the potential for mostimprovement to the MDSHA pavement network. The ride quality of the roadway istypically one of the first criteria the travelling public notices about a roadway.
VI.D.1 Ride SpecificationCurrently, MDSHA is in the process of implementing a new ride quality specification. Inthe past, MDSHA used the California Profilograph to measure ride quality with a 0.2”blanking band. The contractor was responsible for performing quality control of ridequality for paving projects and MDSHA would complete ride quality assurance on an as-needed basis. The new ride specification eliminates the blanking band, allows the useof high speed profilers, specifies more aggressive quality assurance practices, andmodifies the practices of determining incentive, disincentive, and corrective action. Theuse of the California Profilograph is currently planned to be phased out of use after twoyears, but that is dependent on the success of the implementation of the new ridespecification.
The new ride specification, 535 – Pavement Surface Profile, requires the pavementdesign engineer to make decisions concerning the required ride quality for thespecification. The maximum limit of ride quality to determine for full pay, correctiveaction, and disincentive vary depending on the constraints on the project, the materialsbeing placed, and the proposed construction operations. The pavement design engineershall use Form PD-11, Section IV, to assist in the decision process. The followingfactors are the type of factors used in Form PD-11 to assist the engineer to determineride quality limits.
• Required to match existing curb and gutter grade• Considerable manholes and other utilities• Intersections, entrances, driveways that must be tied into• Night time paving with reduced closure times• Use of PG 76-22 late in the season• Work area confined with barrier wall or other obstacles• Existing pavement in poor condition and no w/l or removal• Crack sealing in the pavement surface

Pavement Design Policies
Updated 11/1/2002 VI-21
VI.D.1.1 Incentive & Disincentive PaymentsUse the following table to select the appropriate Incentive (Pmax) and Disincentive (Pmin)based on the functional class of the roadway:
Urban RuralFunctional Class Desired
ReliabilityMinimumReliability
DesiredReliability
MinimumReliability
Interstate 500 -500 500 -500
Freeways andExpressways 450 -450
Principal Arterial –Other 450 -450 450 -450
Minor Arterial 450 -400 400 -400
Major Collector 400 -400
Minor Collector 400 -400
Collector 350 -350
Local 350 -350 350 -350

Pavement Design Standards
Updated 11/1/2002 VII-1
VII PAVEMENT DESIGN STANDARDSThe pavement design standards contained in this section are to be used by PavementDivision of the OMT only and are not considered to be part of the MDSHA “Book ofStandards.” The standards are intended to maintain consistency in the distribution ofrecommendations from the Pavement Division. The following standards are provided inthis section:
A. Roundabout1. Truck Apron
1) Material and Thickness Design2) Joint Design and Spacing3) Steel Design
2. Curb and Truck Apron Tie3. Travel Way
B. Park and Ride1. Passenger Vehicle2. Bus Lane3. Bus Stop Pad
C. Narrow Base Widening with Curb (< 4 ft)
D. Composite Patch (HMA and PCC)

Pavement Design Standards
Updated 11/1/2002 VII-2
VII.A ROUNDABOUTA roundabout is a circular intersection intended to regulate traffic flow with the use of asignalized lighting. A roundabout consists of travel way, which maybe either a flexible orrigid pavement, and a truck apron at the inner radius of the circle intended for truck withtrailers incapable of making a tight radius turn. A mountable curb resides between thepaved travel way and the truck apron. Typically some type of curb or wall at theboundary with the truck apron with landscaping at the very center of the roundabout.The mainline travel way shall be design following the guidelines.
VII.A.1 Truck ApronThe truck apron of a roundabout shall be Jointed Reinforced Concrete Pavement(JRCP) to limit pavement distress from the slow moving, turning truck traffic. The innerand outer radius of the truck apron will differ because in is a circle. The joints in thetruck apron shall be doweled to provide for load transfer. Depending on the dimensionsof the roundabout, truck aprons are not typically reinforced. Truck aprons are typicallyconstructed in conjunction with a Type ‘C” mountable curb that is 8.0” to 10.0” in depthwith a 3.0” high mountable lip.
VII.A.1.1 Material and Thickness DesignThe truck apron shall be constructed with the following pavement structure:
9.0” Portland Cement Concrete – Mix #78.0” Graded Aggregate Base
The thickness of the lifts of the graded aggregate base (GAB) will vary depending on thethickness of the Type “C” curb, but the overall GAB thickness shall remain at 8.0”. Thethickness of the lifts will vary because of the construction sequence to place a base onwhich to construct the Type “C” curb. Given the 9.0” thickness of the JRCP layer in atruck apron, the Type “C” curb shall be either 9.0” or 10.0” in depth. If a 9.0” Type “C”curb is placed, the GAB shall be placed in one 3.0” lift and one 5.0” lift. If a 10.0” Type“C” curb is placed, the GAB shall be placed in two one 4.0” lifts. This information can beseen in the detail at the end of this section.
VII.A.1.2 Joint Design and SpacingAll longitudinal joints on a truck apron shall be either formed or constructed with a slipform paver. All transverse joints shall be contraction joints with the exception of twojoints on opposite side of the truck apron. There shall be two expansion joints (only two)on opposite sides of the truck apron to allow for the expansion of the unique geometry ofa circular truck apron. The maximum joint spacing at the outer radius of the truck apronshall be 30 feet. Every attempt shall be attempt to have equal and consistent jointspacing around the truck apron. The need for mid-slab reinforcement can be eliminatedif joint spacing at the outer radius is limited to a maximum of 15 feet.
VII.A.1.3 Steel DesignIt may be more advantageous to limit the joint spacing at outer radius of the truck apronto be less than is 15 feet because mid slab steel reinforcement would not be necessary.If the joint spacing is greater than 15 feet at the outer radius, then mid-slab steelreinforcement is required. The dimensions of the truck apron may warrant a shorter jointspacing to eliminate the additional construction issues involved with mid slab

Pavement Design Standards
Updated 11/1/2002 VII-3
reinforcement. In cases where steel design is required, the truck apron shall beconstructed with the following mid slab steel design:
6 X 6 – W4 X W4
The dowel bars shall have the following design:
#8 bars – 18.0” long, 12” on center, placed 6 “ from longitudinal joint
Longitudinal tie bars shall be placed at all longitudinal joints and slab /curb interfacesand have the following design:
#4 bars – 14.0” (J) Bar, placed 36” on center
VII.A.2 Curb and Truck Apron TieThe truck apron and curb shall be tied together with the specified steel design asdescribed above. The “j” shaped longitudinal devices shall be placed with the bend inthe horizontal plane, i.e. the entire bar is at the same elevation. The following detail isprovided:
1) Modified Curb and Gutter2) Longitudinal Tie Devices - #4 “J” Bar, 14.0” long, placed on 36.0” center3) 9.0” Portland Cement Concrete – Mix #74) 4.0” Graded Aggregate Base5) Type “C” Curb and Gutter – 10.0” Depth
VII.A.3 Travel WayThe material type and thickness of the travel portion of the roundabout shall be designedas new pavement section is typically designed in accordance to Section III.G “NewDesign.” An attempt shall be made to match the thickness of the aggregate base layer
Travel wayPavementSection
3.0”
12 3 2
5
4
6.0”

Pavement Design Standards
Updated 11/1/2002 VII-4
in the travel way with that of the truck apron, for ease of construction. This isdemonstrated in the pavement detail for the truck apron shown above.
VII.B PARK AND RIDEThe Park and Ride as three possible pavement sections: passenger vehicle area, buslane area, and bus stop pad area. Adjustments to the design can be made to suit localtraffic patterns and regional climates; for example, the use of PG 64-28 in Garrett Countyor the use of polyolifin for I-95 park and ride lots. The typical pavement sections for allthree cases are shown in the following section.
VII.B.1 Passenger VehicleThe passenger vehicle area shall be designed with the following pavement section:
2.0” HMA Superpave 9.5mm for Surface – PG64-22, Level 23.0” HMA Superpave 19.0mm for Base – PG64-22, Level 26.0” Graded Aggregate Base
VII.B.2 Bus LaneThe bus lane area shall be designed with the following pavement section:
2.0” HMA Superpave 9.5mm for Surface – PG64-22, Level 25.0” HMA Superpave 19.0mm for Base – PG64-22, Level 2(2 – 2.5” lifts)6.0” Graded Aggregate Base
VII.B.3 Bus Stop PadThe bus stop pad area shall be designed with the following pavement section:
9.0” Portland Cement Concrete – Mix #76.0” Graded Aggregate Base
The joint spacing shall be 15 feet or less. This length of joint spacing allows for theplacement of unreinforced PCC slabs. Therefore, there will be no mid slab steelreinforcement.
The dowel bars shall have the following design:
#8 bars – 18.0” long, 12” on center, placed 6 “ from longitudinal joint
Longitudinal tie bars shall be placed at all longitudinal joints and slab /curb interfacesand have the following design:
#4 bars – 14.0” (J) Bar, placed 36” on center

Pavement Design Standards
Updated 11/1/2002 VII-5
VII.C NARROW BASE WIDENING WITH CURB (LESS THAN 4FEET)
This entire issue arose from the concern that it is extremely difficult to achieve adequatecompaction of HMA in tight, narrow areas like in the case of narrow base widening withcurb. The lack of available equipment to compact in such area less than 4 feet has ledto the selection of different materials and new details. There are two cases when thisoccurs, either MDSHA is placing new curb or the roadway is actually being widened lessthan 4 feet. In the case with new curb, the contractor can either saw cut the existingpavement and place the new curb directly against the sawed edge (skilled contractor).The alternative is remove a portion of the existing pavement to allow for placement offorms for the new curb and that area needs to be replaced after form removal. With thisoption, the contractor will complete the removal and replacement incidental to theplacement of the new curb.
VII.C.1 New Curb PlacementThe contractor may elect to remove a portion of the existing pavement for placement offorms for the new curb. The replacement of this area is too small for placement of HMAbased on District Construction’s opinion. Therefore, PCC is used as a replacementmaterial. PCC mix #2 is typically used for curb placement and either modified PCC mix#6 or PCC mix #7 for pavement. When dealing with new curb placement, it reasonableto use PCC mix #2 for pavement placement. The joints in the narrow widening for curbplacement shall match those placed for the new curb. No steel reinforcement or dowelbars shall be used in the PCC used in the pavement replacement for the new curb. Thefollowing detail is provided:
1) Curb and Gutter2) PCC Mix #23) Final HMA Resurfacing4) Graded Aggregate Base Layer
1
3
6.0”
2
< 1.0’
4

Pavement Design Standards
Updated 11/1/2002 VII-6
VII.C.2 Narrow Base Widening (less 4 feet)In this case, the widening is a capacity or geometric design improvement. Thereplacement of this area is too small for placement of HMA based on DistrictConstruction’s opinion. Therefore, PCC is used as a replacement material. PCC mix #2is typically used for curb placement and either modified PCC mix #6 or PCC mix #7 forpavement. In this case, engineering judgement and the quantity of widening will dictatethe selection of PCC mix. If there is a limited amount of widening and the width is small,using PCC mix #2 is reasonable. If there is substantial quantity of widening and thewidth is 3 plus feet, then modified mix #6 is appropriate. The quantity is critical becauseit will involve the introduction of another material on the project. The joints in the narrowwidening shall match those placed for the new curb. No steel reinforcement or dowelbars shall be used in the PCC for narrow widening. The following detail is provided:
1) Curb and Gutter2) Modified PCC Mix #63) Final HMA Resurfacing4) Graded Aggregate Base Layer
VII.D COMPOSITE PATCH (HMA OVER PCC)The composite patch is placed in exiting composite pavement to repair an existingpavement distress. The success of composite patches has been mixed because of thedimension details of the patches, type of materials, and construction techniques used inthe past. These patches involve the use of modified PCC mix #7, dowel bar placement,and HMA placement above he PCC. The MDSHA “Book of Standards” shall be used torepair different dimensions of distress in the PCC layer. This is true for both jointed andcontinuous PCC pavement.
Typically, the majority of distress types in jointed rigid pavements occur at the joint. ThePCC patch standards in the “Book of Standards” and the construction specification inSection 522 shall control the PCC portion of the patch construction. The HMAplacement shall be 2.0 feet greater than the underlying PCC patch to limit the length of
1
3
4
6.0”
2
< 4.0’

Pavement Design Standards
Updated 11/1/2002 VII-7
the shear plane and limit the potential for “sinking” patches. The following detail isprovided:
1) Final HMA Resurfacing2) Modified PCC Mix #6 – steel reinforcement dependent on size and location of patchand type of PCC3) HMA Patching4) Dowel bar or tie bar – dependent on size and location of patch
VII.E DRIVEWAYS & BIKE PATHSThe typical pavement sections for both cases shall be designed with the followingpavement section:
1.5” HMA Superpave 9.5mm for Surface – PG64-22, Level 12.5” HMA Superpave 19.0mm for Base – PG64-22, Level 14.0” Graded Aggregate Base
In cases where roadway resurfacing is to be done in the same contract, make an effortto use the same mixes that are to be used on the roadway resurfacing.
Existing HMA
Existing PCC Pavement
Existing HMA
Existing PCC Pavement
2’ 2’
1 2 3
4

Pavement Rehabilitation Techniques
Updated 11/1/2002 VIII-1
VIII PAVEMENT REHABILITATION TECHNIQUESThe purposes of this section is to assist the pavement design engineer identify therehabilitation technique best suited to correct existing distress types and achieve thefunctional and structural condition objectives established by MDSHA. Rehabilitationtechniques encompass all operations from partial-depth patching, grinding, functionalHMA overlay to reconstruction. Several rehabilitation techniques are often used onsame project as part of the pavement rehabilitation project strategy.
This section provides numerous rehabilitation methods and a description and definitionof each technique. In addition, this sections provides assistance in the form ofguidelines as to when certain rehabilitation techniques are most appropriate. Thissection also provides input into several data analysis steps for pavement rehabilitationrecommendations involve tasks involving the selection of rehabilitation techniques.

Pavement Rehabilitation Techniques
Updated 11/1/2002 VIII-2
VIII.A PAVEMENT REHABILITATION METHODSPavement
TypeFunctional
ClassRehabTechnique
Rig
id
Flex
ible
Com
posi
te
Inte
rsta
te,
Prin
c. A
rt.
All
Oth
ers
Exte
nded
Lan
eC
losu
reR
equi
red
App
licab
le P
CI
Ran
ge
Serv
ice
Life
(yrs
) Applicable Uses
HMA Overlay � � � � � > 25 8 - 12 • structural or functional improvement
PCC BondedOverlay � � � > 70 12 – 15
• PCC pavement in very good, sound condition• minimal to no pre-overlay required• structural overlay required
PCC UnbondedOverlay � � � � � < 55 > 20
• PCC pavement in poor condition• structural overlay required• adequate vertical clearances
Rubblize andHMA Overlay � � � � � < 55 15
• PCC pavement in poor condition• joint deterioration prevalent• removal of AC overlay required• adequate vertical clearances
Break & Seatand HMAOverlay
� � � � � < 70 12 - 15• PCC pavement in fair to poor condition• Removal of AC overlay required
HMA Overlaywith Saw & Seal � � � � > 70 8 - 12
• joints in good working condition• load transfer > 70% on average• minimal joint patching exists or required• removal of AC overlay required
Ultra-ThinWhitetopping � � � � > 55 < 10
• rutting exists throughout project limits (> 50% of theproject length)
• rutting resulting from material related problem• pavement structurally sound

Pavement Rehabilitation Techniques
Updated 11/1/2002 VIII-3
PavementType
FunctionalClass
RehabTechnique
Rig
id
Flex
ible
Com
posi
te
Inte
rsta
te,
Prin
c. A
rt.
All
Oth
ers
Exte
nded
Lan
eC
losu
reR
equi
red
App
licab
le P
CI
Ran
ge
Serv
ice
Life
(yrs
) Applicable Uses
In-placeRecycled HMA � � � � > 70 5 - 8
• minimal structural distress• minimal patching required• limited to approx. 3 inches in depth• good surface materials• not recommended for heavily oxidized material
Recycled HMA � � � � > 25 8 - 12• structural or functional improvement• good material to recycle• not recommended for heavily oxidized material
ConcretePavement
Restoration� � � > 55 5 - 8
• joints in good condition• load transfer > 70% on average• no high steel problems• existing structure is adequate
ACReconstruction � � � � � � < 40 15
• significant structural improvement required• no allowance to increase grade• extensive (>40%) patching required
PCCReconstruction � � � � � � < 40 20
• significant structural improvement required• heavy truck loadings expected (potential to rut)• no allowance to increase grade• extensive (>40%) patching required
Pre-OverlayTechniques � � � � �
See Section VIII.B
MaintenanceTreatments � � � � �
See Section VIII.C
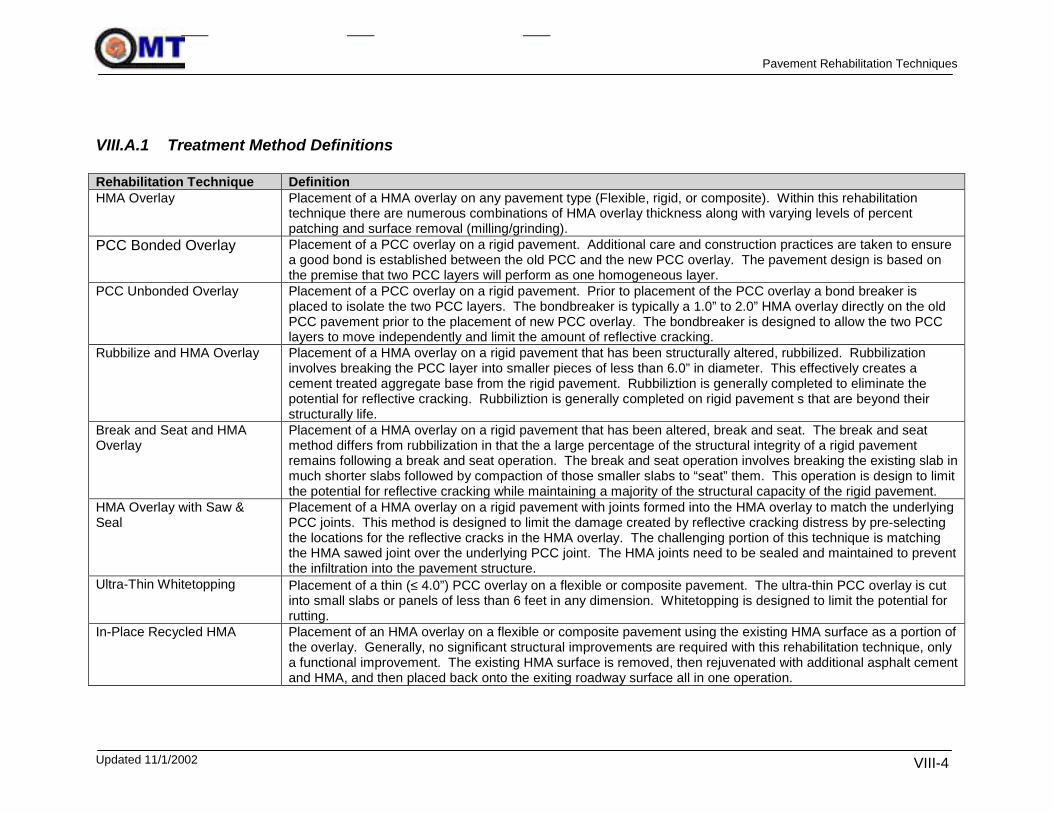
Pavement Rehabilitation Techniques
Updated 11/1/2002 VIII-4
VIII.A.1 Treatment Method Definitions
Rehabilitation Technique DefinitionHMA Overlay Placement of a HMA overlay on any pavement type (Flexible, rigid, or composite). Within this rehabilitation
technique there are numerous combinations of HMA overlay thickness along with varying levels of percentpatching and surface removal (milling/grinding).
PCC Bonded Overlay Placement of a PCC overlay on a rigid pavement. Additional care and construction practices are taken to ensurea good bond is established between the old PCC and the new PCC overlay. The pavement design is based onthe premise that two PCC layers will perform as one homogeneous layer.
PCC Unbonded Overlay Placement of a PCC overlay on a rigid pavement. Prior to placement of the PCC overlay a bond breaker isplaced to isolate the two PCC layers. The bondbreaker is typically a 1.0” to 2.0” HMA overlay directly on the oldPCC pavement prior to the placement of new PCC overlay. The bondbreaker is designed to allow the two PCClayers to move independently and limit the amount of reflective cracking.
Rubbilize and HMA Overlay Placement of a HMA overlay on a rigid pavement that has been structurally altered, rubbilized. Rubbilizationinvolves breaking the PCC layer into smaller pieces of less than 6.0” in diameter. This effectively creates acement treated aggregate base from the rigid pavement. Rubbiliztion is generally completed to eliminate thepotential for reflective cracking. Rubbiliztion is generally completed on rigid pavement s that are beyond theirstructurally life.
Break and Seat and HMAOverlay
Placement of a HMA overlay on a rigid pavement that has been altered, break and seat. The break and seatmethod differs from rubbilization in that the a large percentage of the structural integrity of a rigid pavementremains following a break and seat operation. The break and seat operation involves breaking the existing slab inmuch shorter slabs followed by compaction of those smaller slabs to “seat” them. This operation is design to limitthe potential for reflective cracking while maintaining a majority of the structural capacity of the rigid pavement.
HMA Overlay with Saw &Seal
Placement of a HMA overlay on a rigid pavement with joints formed into the HMA overlay to match the underlyingPCC joints. This method is designed to limit the damage created by reflective cracking distress by pre-selectingthe locations for the reflective cracks in the HMA overlay. The challenging portion of this technique is matchingthe HMA sawed joint over the underlying PCC joint. The HMA joints need to be sealed and maintained to preventthe infiltration into the pavement structure.
Ultra-Thin Whitetopping Placement of a thin (≤ 4.0”) PCC overlay on a flexible or composite pavement. The ultra-thin PCC overlay is cutinto small slabs or panels of less than 6 feet in any dimension. Whitetopping is designed to limit the potential forrutting.
In-Place Recycled HMA Placement of an HMA overlay on a flexible or composite pavement using the existing HMA surface as a portion ofthe overlay. Generally, no significant structural improvements are required with this rehabilitation technique, onlya functional improvement. The existing HMA surface is removed, then rejuvenated with additional asphalt cementand HMA, and then placed back onto the exiting roadway surface all in one operation.
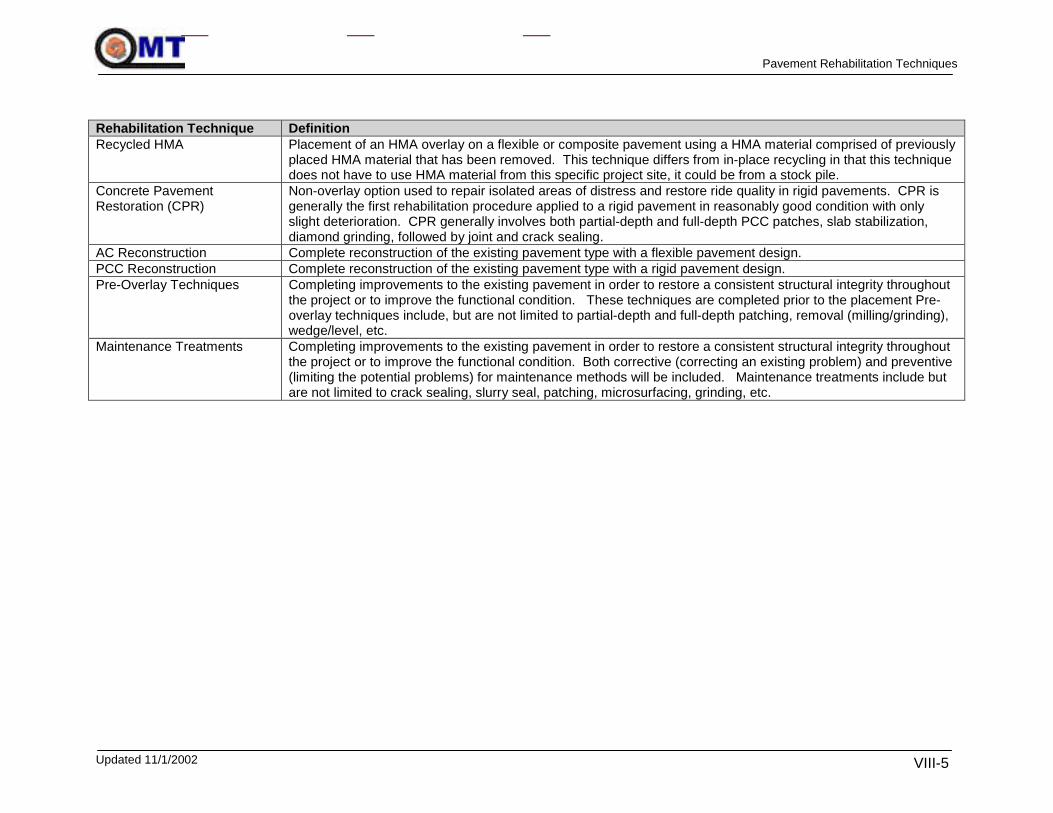
Pavement Rehabilitation Techniques
Updated 11/1/2002 VIII-5
Rehabilitation Technique DefinitionRecycled HMA Placement of an HMA overlay on a flexible or composite pavement using a HMA material comprised of previously
placed HMA material that has been removed. This technique differs from in-place recycling in that this techniquedoes not have to use HMA material from this specific project site, it could be from a stock pile.
Concrete PavementRestoration (CPR)
Non-overlay option used to repair isolated areas of distress and restore ride quality in rigid pavements. CPR isgenerally the first rehabilitation procedure applied to a rigid pavement in reasonably good condition with onlyslight deterioration. CPR generally involves both partial-depth and full-depth PCC patches, slab stabilization,diamond grinding, followed by joint and crack sealing.
AC Reconstruction Complete reconstruction of the existing pavement type with a flexible pavement design.PCC Reconstruction Complete reconstruction of the existing pavement type with a rigid pavement design.Pre-Overlay Techniques Completing improvements to the existing pavement in order to restore a consistent structural integrity throughout
the project or to improve the functional condition. These techniques are completed prior to the placement Pre-overlay techniques include, but are not limited to partial-depth and full-depth patching, removal (milling/grinding),wedge/level, etc.
Maintenance Treatments Completing improvements to the existing pavement in order to restore a consistent structural integrity throughoutthe project or to improve the functional condition. Both corrective (correcting an existing problem) and preventive(limiting the potential problems) for maintenance methods will be included. Maintenance treatments include butare not limited to crack sealing, slurry seal, patching, microsurfacing, grinding, etc.

Pavement Rehabilitation Techniques
Updated 11/1/2002 VIII-6
VIII.B PRE-OVERLAY REPAIR GUIDELINES
VIII.B.1 Application for Removal (Milling/Grinding)Patching operations shall proceed all other construction operations within the existingroadway is the basic assumption that shall be followed when considering criteria todetermine the need for removal. Therefore, some distress types shall be repairedthrough patching and effect the total distress quantities used in the guidelines forremoval criteria.
Criteria Depth of Removal
hol > proposed roadway elevation1 Overlay thickness
Medium and high severity rutting > 30% of the length Depth of max rutting
Functional distress > 50% of area2 Depth of last surface layer3
> 30% of joints are medium or high severity joint reflectioncracking Depth of last surface layer3
Patching > 25% of area Depth of last surface layer3
IRI > 170 in/mile for interstates Depth of last surface layer3
IRI > 220 in/mile for non-interstates Depth of last surface layer3
1 – If the removal and replacement thickness does not provide adequate structural capacity for the expectedservice life, additional discussion will needed to determine if a lower service life is acceptable. If not, thisrehabilitation technique alternative should be eliminated from the viable alternatives.2 – Functional distress consists of bleeding (sf), block cracking (sf), bumps/sags [(lf) * 6ft] = (sf), depression(sf), joint reflective cracking [(lf) * 6ft] = (sf), polished aggregate (sf), swell (sf), and weathering and raveling(sf).3 – The depth of removal could be increased based on the depth of the cracks and the thickness of theexisting HMA. It is not recommended to leave less than 1.5” of HMA material above PCC pavement. If lessthan 1.5” of HMA material will be left following required removal, all of the HMA material should be removedto the bare concrete surface.
The thickness of partial-depth, full-depth, and Type A partial depth patches should beevaluated following the determination for the need for removal process. The need forpartial-depth patching could vary depending on the results of the removal selectionprocess. The thickness of partial-depth and full-depth patches could vary depending onthe results of the removal selection process, especially in composite pavements.
The thickness of the existing shoulders should be considered when determining thedepth of removal. Shoulders with thin pavement structures may dictate minimumremoval depths or the need for other alternative rehabilitation techniques.
Reasons to specify grinding over milling:• recommend if only one lift is to be placed above removal area• recommend if removing for poor ride conditions only

Pavement Rehabilitation Techniques
Updated 11/1/2002 VIII-7
• recommend if removed pavement section is to be opened to traffic
Removal of the pavement by milling or grinding effects the existing condition of thepavement in addition to affecting the existing structural capacity of the pavement.Specific distresses are reduced or eliminated by removal of the pavement. Please referto Section VIII.B.7 for information regarding the effect of pavement removal has ondistresses based on the visual PCI procedure. In addition, the original structuralcapacity (SCo) of the pavement is reduced as a result of milling or grinding. Thecalculation to adjust SCo based on a removal depth is described in Section III.F.
VIII.B.2 Wedge/Level Guidelines
Applications for Wedge/Level Layer
Criteria Comments
Patching > 25% of project area Full-depth and partial-depth
Any severity rutting > 30% of area Based on length not area
Joint tape is used with a single HMA lift1
Designed elevation increase in roadway2 Superelevation or cross slope> 30% of joints are medium or high severity jointreflection cracking Compared to total # of joints
IRI > 170 in/mile for interstates
IRI > 220 in/mile for non-interstates1 – The existing composite or rigid pavement is structurally adequate (SCeff > = SCf). The wedge/level layeris intended to provide an additional layer between the joint tape and the final HMA overlay layer, resulting intwo lifts of HMA between the joint tape and the final roadway surface.2 – If a significant increase in elevation is required (>2.0”), then the 19.0 mm should also be used incombination with the 9.5 mm for wedge/level.
The use a wedge/level layer is dictated by the amount the roadway elevation can beraised. If there is restrictions regarding the roadway elevation, removal (milling/grinding)should be the selected alternative. Otherwise if there are no roadway elevationrestrictions, wedge/level is the preferred alternative. District Construction should beconsulted to confirm the preference of removal versus wedge/level.
The type of mix generally used for wedge/level is the HMA Superpave 9.5 mm. In thecase of a significant increase in roadway elevation (> 1.5”), the HMA Superpave 19.0mm mix should be used instead of or in addition to the 9.5 mm, depending on the totalincrease in elevation. The ranges for lift thickness for the wedge/level mixes are thesame as the typical range for each mix and are in the following table:

Pavement Rehabilitation Techniques
Updated 11/1/2002 VIII-8
Recommended Wedge/Level Lift ThicknessHMA Superpave Mix
TypeMinimum Thickness Maximum Thickness
9.5 mm 0.75” 1.5”12.5 mm 1.5” 2.0”19.0 mm 2.0” 3.0”
VIII.B.3 Patching and Joint Tape Guidelines for PCC SurfacesDistress Severity Comments
Low Medium HighBlow-Up Full Full FullDivided Slab None Full FullCorner Break None Full FullDurability Full Full FullFaulting None Full Full Consider grinding or undersealing the
joint to remove fault.LinearCracking
None Partial Full Consider grinding, undersealing orcrack sealing for Low and MediumSeverity.
Patching None Full FullPumping None None Full Consider undersealing to correct
PumpingPunchout Full Full Full Type II patch if punchout greater that 6'
longSpalling AC Partial Full Clean out spalled area and replace with
AC prior to overlay.
Type I PCC Patch is less than 15 feet in lengthType II PCC Patch is greater than 15 feet in length
Note: Joint sealant damage, lane/shoulder drop off, polished aggregate, popouts, RR Xing, MapCracking, and shrinkage cracking are not patched.If LTE < 70% then a flexible full-depth patch is not recommended (Use rigid patch).If Mr subgrade is weak - PCC patch required.If Pumping is evident - PCC patch required.

Pavement Rehabilitation Techniques
Updated 11/1/2002 VIII-9
VIII.B.4 Patching and Joint Tape Guidelines for AC SurfacesMilling (1" - 2") Comments
Distress Severity No YesAC MaterialThickness
> 6" < 6"Fatigue Cracking Low None None None
Medium Partial Partial FullHigh Full Full Full
Rutting Low None None None Soil/Subgrade could be causeareas < 500’ long Medium Partial None None for rutting.
High Partial Partial PartialLinear Cracking Low None None None If the crack depth is greater thanEdge Cracking Medium Partial None None ½ AC layer thickness, then use
High Partial Partial Partial full-depth patch.Potholes/Failures Low Partial None None
Medium Partial Partial FullHigh Full Full Full
Block CrackingSlippage Crack Low None None None Full-depth patching may be
required if distress isShoving Medium Partial None None significantly deep (>1/2 AC).Corrugation High Partial Partial PartialDepression Low None None None Soil/Subgrade could be cause ofBumps/Sags Medium Partial None None depression, bumps/sags, andSwelling High Full Full Full swelling.Patches Low None None None
Medium Partial Partial FullHigh Full Full Full
Joint Reflection Low None None None Potential to use Joint TapeCracking Medium Partial Partial Partial (Type A Patch) remove to PCCLTE >70% - Good High Partial Partial PartialJoint Reflection Low None None None Patch with PCC.Cracking Medium Partial Partial PartialLTE < 70% - Bad High Full Full Full
Note: 1) Polished aggregate, bleeding, RR Xing, weathering, and lane/shoulder drop off are not patched.2) Minimum patch size is generally 6 ft x 6 ft3) Partial depth patching should not exceed 50% of the pavement in depth
Section VIII.B.3 and VIII.B.4 are to be used as guidelines to determine specific patchingrequirements. These guidelines can be customized to specific project conditions anddemands. Any major changes to the patching guidelines should be discussed with theAssistant Pavement Division Chief.

Pavement Rehabilitation Techniques
Updated 11/1/2002 VIII-10
VIII.B.5 Drainage Treatment GuidelinesDrainage Tool Applicable UseLongitudinalUnderdrain(LUD)
• Used for roadways in areas with fine grain frost susceptible or highcapillary soils.
• Place continuously through all cuts and fills.• On divided highways use 4 lines; with paved median use 3 lines
(one under barrier).• For closed sections place only through non-piped areas, i.e.
opposite the storm drains.• Always use on PCC pavements, pavements open graded base
courses and Interstate pavements.• Use LUD on other pavements if the following conditions exist:
• Presence of high water tables• High moisture conditions in the soil (saturated soils)• Poorly draining soils encountered on the project• Topography is condusive to placing longitudinal underdrain
• Do not use LUD when the following conditions exist:• Generally in rock cuts• Projects that are mostly fill and have low water tables• Projects that are very dry and have easily drainable soils• Projects located where sand capping material is available and
moisture conditions are not extreme• Projects with poor topography (i.e. flat)
Pre-Fab EdgeDrains
Application similar to Longitudinal Underdrain but usually whereanticipated water amounts are low, or as retro-fits.
Cap with Selector CappingBorrow
• Use a 6" to 12" layer; daylight or to the back face of curbs.• Use Capping Borrow beneath pavement in areas having "dead" A-3
soils. Note: capping may not drain as well as is expected.Open-GradedBase (OGB)
• OGB should be used to control water infiltrating through thepavement surface only. It should not be used to correct a highwater table problem.
• All PCC pavements will be considered for OGB and LongitudinalUnderdrain. Generally OGB shall not be used with flexiblepavements.
• Truck traffic and Soil type shall also be considered whenevaluating the need for OGB. Silty and clayey soils are primecandidates for use of OGB.
• Good vertical drainage, clean sands and gravels for aconsiderable depth at subgrades may diminish the need for OGBprovided that the base course used is not erodible andpermeable(greater than 1x10⁻³ cm/sec).
• Use 4" layer beneath PCC roadway placed on a Graded AggregateBase.
• Use longitudinal underdrain to provide an outlet for water in theOGB
• OGB is a stabilized mix using either asphalt or cement concrete.
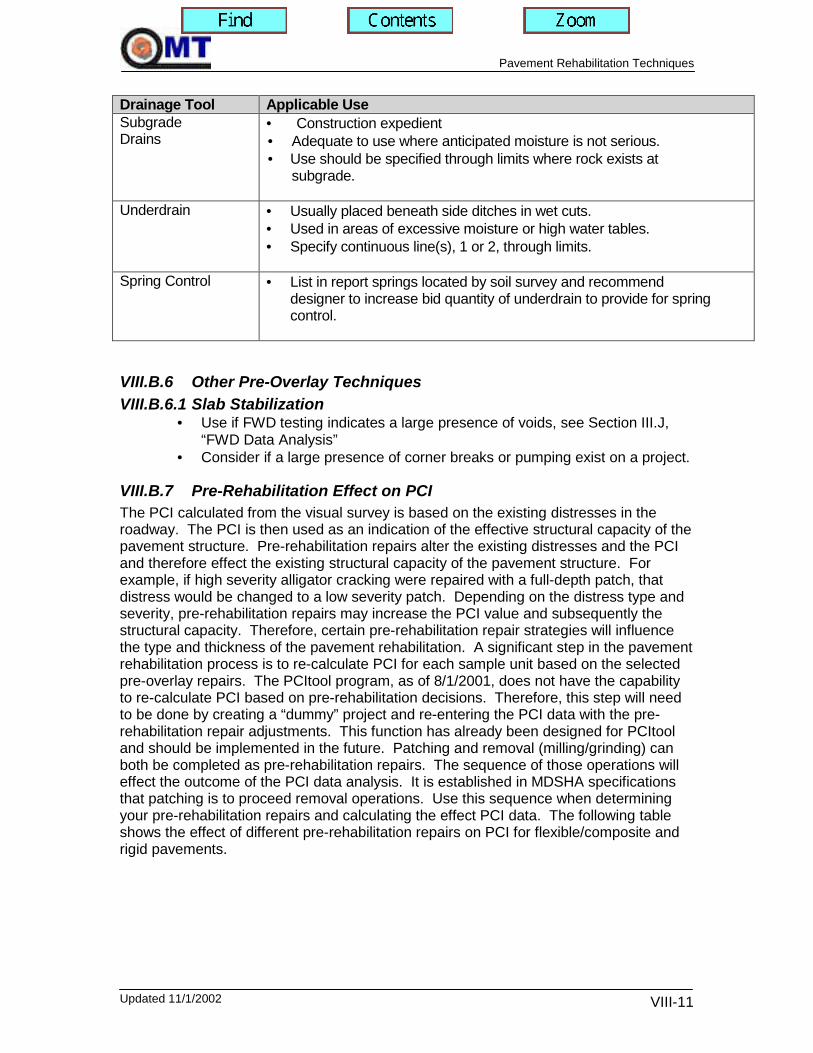
Pavement Rehabilitation Techniques
Updated 11/1/2002 VIII-11
Drainage Tool Applicable UseSubgradeDrains
• Construction expedient• Adequate to use where anticipated moisture is not serious.• Use should be specified through limits where rock exists at
subgrade.
Underdrain • Usually placed beneath side ditches in wet cuts.• Used in areas of excessive moisture or high water tables.• Specify continuous line(s), 1 or 2, through limits.
Spring Control • List in report springs located by soil survey and recommenddesigner to increase bid quantity of underdrain to provide for springcontrol.
VIII.B.6 Other Pre-Overlay TechniquesVIII.B.6.1 Slab Stabilization
• Use if FWD testing indicates a large presence of voids, see Section III.J,“FWD Data Analysis”
• Consider if a large presence of corner breaks or pumping exist on a project.
VIII.B.7 Pre-Rehabilitation Effect on PCIThe PCI calculated from the visual survey is based on the existing distresses in theroadway. The PCI is then used as an indication of the effective structural capacity of thepavement structure. Pre-rehabilitation repairs alter the existing distresses and the PCIand therefore effect the existing structural capacity of the pavement structure. Forexample, if high severity alligator cracking were repaired with a full-depth patch, thatdistress would be changed to a low severity patch. Depending on the distress type andseverity, pre-rehabilitation repairs may increase the PCI value and subsequently thestructural capacity. Therefore, certain pre-rehabilitation repair strategies will influencethe type and thickness of the pavement rehabilitation. A significant step in the pavementrehabilitation process is to re-calculate PCI for each sample unit based on the selectedpre-overlay repairs. The PCItool program, as of 8/1/2001, does not have the capabilityto re-calculate PCI based on pre-rehabilitation decisions. Therefore, this step will needto be done by creating a “dummy” project and re-entering the PCI data with the pre-rehabilitation repair adjustments. This function has already been designed for PCItooland should be implemented in the future. Patching and removal (milling/grinding) canboth be completed as pre-rehabilitation repairs. The sequence of those operations willeffect the outcome of the PCI data analysis. It is established in MDSHA specificationsthat patching is to proceed removal operations. Use this sequence when determiningyour pre-rehabilitation repairs and calculating the effect PCI data. The following tableshows the effect of different pre-rehabilitation repairs on PCI for flexible/composite andrigid pavements.

Pavement Rehabilitation Techniques
Updated 11/1/2002 VIII-12
Pre-Overlay Repairs for AC Surfaced PavementsDistress Partial Depth Full Depth Patch Removal
Alligator Low patch Low patch -1 SeverityBleeding No No No DistressBlock Low patch Low patch -2 SeverityBumps/Sags Low patch Low patch -2 SeverityCorrugation Low patch Low patch -2 SeverityDepression Low patch Low patch -1 SeverityEdge Cracking Low patch Low patch -1 SeverityJoint Reflection Low patch Low patch -1 SeverityLn/Shld Drop No No NoLinear Cracking Low patch Low patch -1 SeverityPatch Low patch Low patch -1 SeverityPolished Agg. No Low patch No DistressPothole Low patch Low patch -1 SeverityRR Crossing No No NoRutting Low patch Low patch -2 SeverityShoving Low patch Low patch -2 SeveritySlippage Low patch Low patch No DistressSwell Low patch Low patch -1 SeverityWeathering No No No Distress
Pre-Overlay Repairs for PCC Surfaced PavementsDistress HMA Patch PCC Patch CPR
Blow-up Low patch Low patch Low patchCorner Break Low patch Low patch Low patchDivided Slab Low patch No Distress No Distress“D” Cracking Low patch Low patch Low patchFaulting Low patch Low patch Low patchJoint Seal Damage No No Low SeverityShoulder Drop off No No NoLinear Cracking Low patch Low patch Low patchPatch – Large and Small Low patch Low patch Low patchPolished Aggregate No No No DistressPopouts No No No DistressPumping Low patch Low patch Low patchPunchouts No Low patch Low patchRR Crossing No No NoScaling No No No DistressShrinkage Cracks No No No DistressSpalling, Corner Low patch Low patch Low patchSpalling, Joint Low patch Low patch Low patch

Pavement Rehabilitation Techniques
Updated 11/1/2002 VIII-13
VIII.B.8 Estimating Patching Quantities from PCI DataThe distress quantities summed from the PCI visual condition survey can be used todevelop estimates for patching quantities. The patching quantity developed from a PCIsurvey is not intended to be the final quantity used in the contract documents, but ratheran estimate to be provided to the project owner early (pre-semi-final) in the projectdesign schedule. The extrapolated distress quantities are to be used in the developmentof the patching quantity estimate. The specific dimensions of the PCI distresses are notdirectly transferable into patch area. Besides the obvious PCI distresses measured inlinear feet, the distresses measured in square feet are not always equivalent to a patcharea. This is because MDSHA typically has standard minimum patch sizes and the PCIdistress can be a small as 1 square foot. Therefore, in order to develop patchingquantity estimates from extrapolated PCI distresses, a conversion factored is necessary.The following tables show the conversion factors to convert extrapolated PCI distressesinto a patch estimate.
Flexible / Composite Pavements
Distress Type Patch Area (sf)Alligator Extrapolated Area * 2Bleeding No Patch
Block Extrapolated Area * 2Bumps and Sags Extrapolated Length * 6
Corrugation Extrapolated Area * 2Depression Extrapolated Area * 2
Edge Cracking Extrapolated Length * 6Joint Reflection Extrapolated Length * 6
Lane/Shld Drop off No PatchLinear Cracking Extrapolated Length * 6
Patching Extrapolated Area * 2Polished Aggregate No Patch
Pothole Extrapolated Number * 72RR Crossing No Patch
Rutting Extrapolated Area * 2Shoving Extrapolated Area * 2Slippage Extrapolated Area * 2
Swell Extrapolated Area * 2Weathering/Raveling No Patch

Pavement Rehabilitation Techniques
Updated 11/1/2002 VIII-14
Rigid Pavements
Distress Type Patch Area (sf)*Blow Up 480
Corner Break 36#
Divided Slab 480Durability No PatchFaulting 72
Joint Seal Damage No PatchLane/Shld Drop Off No Patch
Linear Crack 72Patch / Large 72Patch / Small 36
Polished Aggregate No PatchPopouts No PatchPumping 72Punchout 72
RR Crossing No PatchScaling No Patch
Shrinkage No PatchSpall / Corner 36#
Spall / Joint 36#
* Based on a 12’ x 40’ slab. Three basic patch type sizes: entire slab, joint, andpartial width. Exact area may change if slab dimensions are different.# Partial width patches may not be recommended depending on PCC type, steelconfiguration, distress extent, and expected rehabilitation strategy.

Construction and Material Specifications
Updated 11/1/2002 IX-1
IX CONSTRUCTION AND MATERIALSPECIFICATIONS
A pavement designer in the Pavement Division of OMT must be familiar withconstruction operations and the specifications required by MDSHA on the contractorperforming the work. The most beneficial and economical pavement recommendation isuseless if it cannot be constructed or built with the existing construction or materialspecifications. Therefore, the pavement designer must be intimately familiar withexisting materials and construction specifications and be possess the ability to developnew specifications.
MDSHA currently has two documents that all dictates the specifications and standardsby which all projects shall be constructed, “Standard Specification for Construction andMaterials” book and “Book of Standards.” Obviously, other specification documents areoccasionally required for construction, but the initial reference and bindingdocumentation are the two books previously mentioned. The “Standard Specification forConstruction and Materials” book controls material and construction specifications. The“Specification” book is broken out into a Terms and Condition (TC) section and aTechnical Requirements section. The TC section establishes the scope of work,definitions of terms, legal relations, restrictions and permits, and payment practices. TheTechnical Requirements section is broken out into the following category items:
• Category 100 – Preliminary• Category 200 – Grading• Category 300 – Drainage• Category 400 – Structures• Category 500 – Paving• Category 600 – Shoulders• Category 700 – Landscaping• Category 800 – Traffic• Category 900 – Materials
The “Book of Standards” controls typical details and dimensions of items. The “Book ofStandards” is broken out into the same category section as the Technical Requirementssection of the “Specification” book. Category 500 and 900 shall be of particular interest,and familiar, to the pavement designer in the Pavement division of the OMT.
Typically, MDSHA provides contractors desiring to bid on a construction project aproposal book and plans as part of the invitation for bid package. The plans provide aplan view of the project, typical sections, and specific details of construction. Theproposal book provides additions to the “Standard Specification for Construction andMaterials” and specific specification unique to the project. Special Provisions Inserts(SPI) are specifications that are revisions or an addendum to the current “StandardSpecification for Construction and Materials” book. A SPI is a general specification thatis applicable to all construction projects. A Special Provision (SP) is also a specificationthat is a revision or an addendum to the current “Standard Specification for Constructionand Materials” book. However, a SP is specific to a particular project and is notapplicable to all construction projects.

Construction and Material Specifications
Updated 11/1/2002 IX-2
When a particular item or subject is not covered by the plans or proposal book, then the“Standard Specification for Construction and Materials” book and the “Book ofStandards” are the controlling articles of documentation. The following is the order inwhich all construction and material specification / standard documentation shall beviewed, increasing in importance and controlling factor downward:
• Book of Standards & Specification Book• Special Provision Inserts (SPI)• Plans• Special Provisions (SP)• Addendum• Redline Revision
The Specification Team of the Pavement Division of the OMT provides regular updatesof all current SPIs and potential SPs to all pavement designers. Included in this sectionis a copy of the specification update provided by the Specification Team.

Material Library
Updated 11/1/2002 X-1
X MATERIAL LIBRARYThe Material Library provides the pavement design engineer with information about theconstruction materials used by MDSHA. The Material Library provides both thelaboratory material properties and the AASHTO Pavement design properties of theconstruction materials
X.A MATERIAL DESCRIPTION
The following table provides a list and description of the material types used to constructpavements by MDSHA:
Material DescriptionPCC Surface material comprised of aggregate, portland
cement, water, and potential admixtures.HMA Superpave 4.75 mmHMA Superpave 9.5 mm GapGradedHMA Superpave 9.5 mmHMA Superpave 12.5 mm GapGradedHMA Superpave 12.5 mmHMA Superpave 19.0 mm GapGradedHMA Superpave 19.0 mmHMA Superpave 25.0 mmHMA Superpave 37.5 mm
Surface or base materials comprised of aggregate,asphalt cement, and potential admixtures. Gap gradedmix do not have a dense graded gradation curvebecause a band of aggregate sizes are excluded fromthe HMA mix to prevent rutting.
Microsurfacing Surface sealer comprised of sequential applications ofasphalt and stone chips in either single or repetitivelayers. Traditional seal coating done by agencies.
Slurry Seal Surface sealer comprised of sand-sized aggregatemixed with diluted asphalt emulsion, squeegeed ontothe pavement surface. Usually 3/8” thickness.
Novachip Surface sealer that places an ultra-thin coarseaggregate hot mix over a special polymer modifiedliquid asphalt membrane
Cement Treated GranularBase
Base material comprised of aggregate mixed withportland cement, typically 3.25% to 5% by weight.Generally mixed in plant. Target strength of 750 psi forunconfined compressive strength.
Asphalt Treated AggregateBase
Base material comprised of aggregate mixed withasphalt cement, typically 3.25% to 5% by weight.
Penetration Macadam Commonly used prior to the 1950’s. A stone matrix oflarge stones at the bottom of the lift choked withincreasingly larger aggregate sizes. A crude form ofasphalt cement, tar, was then poured over the stonematrix after compaction.

Material Library
Updated 11/1/2002 X-2
Material DescriptionMacadam Commonly used prior to the 1950’s. A stone matrix of
large stones at the bottom of the lift choked withincreasingly larger aggregate sizes. The term useused for a wide variety of materials that may meet thisdescription; i.e. old bituminous concrete.
Soil Cement Base material with granular soil mixed with portlandcement, typically 8% to 10% by weight and mixed inplace. Target strength of 450 psi unconfinedcompressive strength.
Cement Modified Subgrade Subgrade material of on-site non-plastic soil mixed withportland cement, typically 3% to 5% by weight andmixed in place. Generally a poorer quality than SoilCement with a target strength of 300 psi for unconfinedcompressive strength.
Graded Aggregate Base(GAB)
Base material of graded aggregates from crushedstone. GAB has narrow and defined sieve controlpoints compared to CR-6. Typically of higher qualitythan CR-6 and more coarse.
Geosynthetically StabilizedSubgrade Using GradedAggregate Base (GSS w/GAB)
GAB material placed on geotextile that is placed at theaggregate-soil interface. Used in placed ofundercutting in potential Class 1A excavation areas.Not typically considered part of the pavement section,but as a construction platform.
CR-6 – Crusher Run Base material of graded aggregates from crushedstone. CR-6 has wider sieve control points andtypically of poorer quality and finer than GAB.
Gravel – Bank Run Gravel Base material typically rounded and uncrushed.Usually from riverbed areas.
Soil Contaminated AggregateBase
Base material that has been contaminated from the soilbeneath the layer or an aggregate layer that has beenpushed into a soft subgrade.
Common Borrow A soil and aggregate mixture with a minimum drydensity of 100 pcf.
Select Borrow A soil and aggregate mixture with A-2, A-3 or A-2-4material with a maximum dry density of 105 pcf.
Capping Borrow A soil and aggregate mixture identical to select borrowwith the exception that when A-3 material has less than10% retained on #10 sieve, at least 15% shall pass the#200 sieve. This specification is to ensure that thecapping borrow has a broader band gradation.
Modified Borrow A soil and aggregate mixture with a minimum of 25%retained on #10 sieve, liquid limit not greater than 30and a plasticity index not greater than 9. Minimummaximum dry density of 115 pcf.

Material Library
Updated 11/1/2002 X-3
The following table provides a list and description of the various pavement types used byMDSHA:
Material DescriptionFlexible Pavement Pavement structure composed of hot mix asphalt
material without any portland cement concretelayers.
Rigid Pavement Pavement structure composed of portland cementconcrete material on the surface.
Composite Pavement Pavement structure composed of hot mix asphaltmaterial layer above a portland cement concretematerial layer.
Jointed Plain Concrete Pavement(JPCP)
Rigid pavement built with transverse joints, butwithout any steel reinforcement.
Jointed Reinforced ConcretePavement (JRCP)
Rigid pavement built with transverse joints and withsteel reinforcement between the joints.
Continuously Reinforced ConcretePavement (CRCP)
Rigid pavement built without transverse joints andwith steel reinforcement throughout the length ofthe pavement.
The following table provides a list and description of the soil types identified by MDSHA:
Material DescriptionA-2 Sand and FinesA-2-4 Silty SandA-2-7 Clayey SandA-3 SandA-4 SiltA-4-2 Sandy SiltA-4-7 Clayey SiltA-5 Mica, Diatoms, Decomposed RockA-6 Colloidal ClayA-7 ClayA-7-2 Sandy ClaysA-7-4 Silty clayA-8 Swamp MuckRock Refusal

Material Library
Updated 11/1/2002 X-4
X.B MATERIAL PROPERTIESMaterial properties are general material characteristics of common MDSHA pavementmaterials. Typical material property values are obtained from laboratory testing andassumed from engineering experience of the materials commonly used by MDSHA.
Elastic modulus and resilient modulus provide an indication of the strength of thematerial and are fundamentally the same material property. The higher the elastic orresilient modulus the stronger the material will behave under traffic loading. Elasticmodulus defined is the slope of the stress-strain curve of a material specimen underloading. Elastic modulus is based on the principle the material does not permanentlydeform under loading. This is not true for a majority of the paving materials with theexception of maybe portland cement concrete (PCC). Resilient modulus is also definedas the slope of the stress-strain curve of a material specimen under loading. However,resilient modulus is based on the principle that the material may permanently deformunder loading. This permanent deformation is monitored during the laboratory testing.Therefore, resilient modulus testing is basically elastic modulus testing while monitoringpermanent deformation.
X.B.1 Elastic Modulus / Resilient ModulusThe following sections provide the pavement designer a frame of reference for therespective strengths of common pavement materials. This information can be used indetermining the application of different materials based on a strength comparison. Inaddition, the ranges of elastic moduli values for the pavement materials in the followingsections shall be used in backcalculation analysis of FWD data.
X.B.1.1 Surface / Base Elastic ModulusThe elastic modulus of surface and base materials are relatively independent of thesubgrade strength. The weaker the surface and base material, the more its strength willbe influenced by the strength of the underlying subgrade soil. The following tableprovides typical elastic modulus values for surface and base materials typical forMDSHA. The materials with asphalt concrete are temperature dependent materials.Hot mix asphalt will have a higher elastic modulus in colder temperatures and a weakerelastic modulus when exposed to warmer temperatures. Some of the manufactured orproduced materials listed below are general ranges because they very dependent on theproduction method and the care taken during construction.
Surface / Base Elastic ModulusMaterial Minimum
Modulus (psi)Typical
Modulus (psi)Maximum
Modulus (psi)Portland Cement Concrete1 3,000,000 5,000,000 8,000,000HMA, Surface2 250,000 750,000 1,500,000HMA, Base2 200,000 600,000 1,250,000Break/Crack and SeatPortland Cement Concrete 50,000 150,000 500,000
Cement Treated GranularBase3 50,000 1,000,000 1,500,000
Asphalt Treated AggregateBase 50,000 150,000 500,000
Penetration Macadam 30,000 75,000 250,000

Material Library
Updated 11/1/2002 X-5
Material MinimumModulus (psi)
TypicalModulus (psi)
MaximumModulus (psi)
Rubbilized Portland CementConcrete3 25,000 75,000 250,000
Macadam 25,000 30,000 75,000Graded Aggregate Base,Stone 15,000 25,000 45,000
Soil Cement3 15,000 400,000 750,000Gravel 10,000 15,000 30,000Cement Modified Subgrade3 5,000 250,000 500,000Soil ContaminatedAggregate Base 3,000 10,000 20,000
Capping Borrow 10,500 10,500 10,5001- American Concrete Institute correlation between elastic modulus and compressive strength is thefollowing:
Elastic Modulus (psi) = 57000 * (Compressive Strength (psi)) ^0.5
2 - Temperature dependent3 – Construction/Production dependent
X.B.1.2 Subgrade Resilient Modulus (Mr)MDSHA Pavement Division records and designs flexible pavements based on thesubgrade strength reported in terms of resilient modulus. Several other tests can beused to assess the strength of the subgrade; i.e. CBR. However, all analysis, designs,and reports will be done in terms of resilient modulus for the soil subgrade of flexiblepavements. A simple conversion from CBR to resilient modulus for soil subgrade is thefollowing equation:
Mr = 1500 * CBR
This equation has been questioned in terms of accuracy and properly identifying therelationship between Mr and CBR by the technical pavement industry. The highest levelof confidence for this equation is for low CBR values, typically under a CBR value of 10.
The subgrade resilient modulus used for new or rehabilitation design shall be theaverage modulus for a particular section, not the lowest. If distinct smaller sections canbe identified with different subgrade resilient moduli within a longer section, then thesections shall be broken out as separate sections and pavement rehabilitation designsshall be done for each section. It is the policy of MDSHA Pavement Division to have amaximum design subgrade modulus of soil conditions in their natural state without anytreatment or modification. The maximum design Mr is 10,500 psi or a CBR ofapproximately 7. Occasionally, higher subgrade moduli values are found throughout thestate, but because of the rather moist climate and the natural soils of Maryland, it hasbeen decided to cap the maximum design subgrade modulus. The following tableprovides typical resilient modulus values for materials typical for MDSHA.

Material Library
Updated 11/1/2002 X-6
Subgrade Resilient ModulusMaterial General
StrengthTypical
Modulus (psi)Typical CBR
Silts and Clays(w/ high compressibility) Very Low 1,000 – 2,000 Less than 2
Fine Grain Soils with Silts and Clays(w/ low compressibility) Low 2,000 – 3,000 2 to 2.5
Poorly Graded Sands Medium 3,000 – 4,500 2.5 to 3Gravely Soils, Well Graded Sands,and Sand/Gravel Mixtures High 4,500 – 10,500 3 to 7
The values in the table above shall be used when FWD analysis data, laboratoryinformation, or expert Geotechnical opinions are not available. The subgrade strength isan extremely influential parameter in the AASHTO pavement design process and everyeffort shall be completed to obtain an accurate and specific value for each section.
X.B.2 Modulus of Subgrade Reaction (k)MDSHA Pavement Division records and designs rigid and composite pavements basedon the subgrade strength reported in terms of modulus of subgrade reaction (k). In thesame manner as flexible pavements, several other tests can be used to assess thestrength of the subgrade; i.e. CBR. However, all analysis, designs, and reports will bedone in terms of resilient modulus for the soil subgrade of flexible pavements and interms of modulus of subgrade reaction for rigid and composite pavements.
In the case of flexible pavements, the resilient modulus is simply a material property ofthe soil subgrade. In the case of rigid and composite pavements, the modulus ofsubgrade reaction is a material property of the subgrade and aggregate base material asa whole. The aggregate base layer in AASHTO pavement design procedures does notcontribute to the structural capacity of the pavement structure, it provides additionalsupport to the subgrade. Therefore, subsequent rehabilitation strategies involving aHMA overlay of a rigid pavement, or additional HMA overlays of a composite pavement,the aggregate base layer and subgrade are viewed and analyzed a single materialproperty, referred to a modulus of subgrade reaction. Unlike the resilient modulus of thesubgrade in flexible pavements, the effect of k value is minimal in terms of structuralimprovements required for rigid and composite pavements.
A relationship has been developed between resilient modulus of the subgrade and themodulus of subgrade reaction of the subgrade/aggregate base combination. Thatrelationship is represented in the following equation:
k = Mr / 19.4
An approach to evaluating the k value from FWD data is described in Section III.J “FWDData Analysis”. The AASHTO DarWin software program typically provides a reasonablek value for rigid and composite pavement sections. Occasionally, the pavementstructure deflection behavior of the pavement structure does not provide a reasonable kvalue from the FWD analysis in DarWin. A typical range a k values for MDSHApavement materials is from 100 pci to a maximum of 600 pci. Modulus of subgradereaction greater than 700 should be closely evaluated to assure that any error in testing

Material Library
Updated 11/1/2002 X-7
or analysis has not occurred. The following table provides typical ranges of k values forsubgrade and aggregate materials.
Modulus of Subgrade Reaction (k)*Material Aggregate
ThicknessGreater than 6.0“
MinimumValue (pci)
TypicalValue (pci)
MaximumValue (pci)
No 50 75 100Silts and Clays (w/ highcompressibility) Yes 75 100 150
No 100 125 150Fine Grain Soils with Siltsand Clays (w/ lowcompressibility) Yes 125 150 180
No 150 175 220Poorly Graded SandsYes 175 200 250No 220 350 550Gravely Soils, Well
Graded Sands, andSand/Gravel Mixtures Yes 250 400 600* Bituminous or Cement treated bases or soils will obviously provide a greater amount support and aresulting higher k value.
X.B.3 Possion RatioThe Poisson Ratio is a measure of a material’s lateral strain compared to the axial strain.In other words, it the ratio of lateral movement compared to vertical movement of amaterial under a vertical load. Therefore, very stiff materials (PCC) will have a smallerPoisson Ratio compared to those materials that are elastic and have a flowable nature(soil and HMA). Poisson ratio can measure during resilient modulus testing.
Poisson Ratio is a critical material property when performing backcalculation analysis.Poisson Ratio allows the pavement designer to model the behavior of a material underloading. The following table provides typical ranges of Poisson Ratio for commonMDSHA pavement materials.
Poisson RatioMaterial Minimum Value Typical Value Maximum Value
Portland Cement Concrete* 0.15 0.15 0.20Break/Crack and SeatPortland Cement Concrete 0.15 0.20 0.30
Rubbilized Portland CementConcrete 0.15 0.25 0.30
Cement Treated GranularBase 0.15 0.20 0.30
HMA, Surface 0.30 0.35 0.40HMA, Base 0.30 0.35 0.40Soil Cement 0.20 0.30 0.40Asphalt Treated AggregateBase 0.20 0.35 0.40
Penetration Macadam 0.20 0.35 0.40

Material Library
Updated 11/1/2002 X-8
Material Minimum Value Typical Value Maximum ValueMacadam 0.20 0.40 0.45Graded Aggregate Base,Stone 0.20 0.40 0.45
Gravel 0.30 0.40 0.45Soil ContaminatedAggregate Base 0.30 0.40 0.50
Sandy Soil Subgrade 0.30 0.45 0.50Silt or Clay Soil Subgrade 0.40 0.45 0.50
X.B.4 Tensile Strength Modulus of PCCThere are two methods to measure the tensile strength of PCC, modulus of rupture (S’c)and indirect tensile strength (ft). The modulus of rupture (S’c) is an indication of theflexural strength of PCC and is used in the AASHTO pavement design procedure tocalculate slab thickness. The indirect tensile strength (ft) is used in the AASHTOpavement design procedure to calculate steel reinforcement requirements. Typicalvalues of modulus of rupture are from 550 psi to 850 psi for sound PCC. A goodestimate for pavement design purposes is 650 psi. The modulus of rupture of jointedrigid pavement can be calculated using the following equation:
S’c = 43.5 * (Elastic Modulus of PCC / (1*106)) + 488.5
The indirect tensile strength should be consistent with the modulus of rupture. For theAASHTO pavement design procedure, the indirect tensile strength will normally be about86 percent of the concrete modulus of rupture.
X.B.5 Coefficient of Thermal ExpansionThe coefficient of thermal expansion is a measure of the change in volume of a materialsubjected to a change in temperature. There are two areas interest with regard tothermal expansion for pavement design purposes, PCC and steel.
The PCC coefficient of thermal expansion varies with such factors as the water-cementratio, concrete age, cement content, and relative humidity. However, the coarseaggregate thermal properties are the most significant influence on the thermal expansionand contraction of a PCC slab. The recommended PCC thermal coefficients ofexpansion are presented in the following table:
Type ofAggregate
Concrete of ThermalCoefficient (1x10⁻⁶ in/in/°°°°F)
Quartz 6.6Sandstone 6.5
Gravel 6.0Granite 5.3Basalt 4.8
Limestone 3.8
The steel coefficient of thermal expansion should be dependent on the steel typemanufacturer. Without that knowledge, the designer should use the following value forthe reinforcing steel coefficient of expansion:

Material Library
Updated 11/1/2002 X-9
5.0 X 10⁻⁶ in/in/°°°°F
X.B.6 Drying Shrinkage Coefficient of PCC SlabThe shrinkage that occurs in a curing PCC slab needs to be considered in the design ofthe longitudinal reinforcement steel design in CRCP and the joint reservoir in jointed rigidpavements. Drying shrinkage is a result of water loss from curing PCC that is affectedby cement content, the types of admixtures, the curing method, the aggregates, andcuring conditions. The value of shrinkage at 28 days is used for the design shrinkagevalue. The shrinkage factor of a PCC slab is inversely proportional to the to thestrength. Therefore, the more water that is added to a PCC mix the greater the potentialfor shrinkage becomes and the strength of the PCC will decrease. So, the 28-dayindirect tensile strength can be used as a guide in selecting a drying shrinkagecoefficient. The recommended drying shrinkage coefficients for PCC slabs arepresented in the following table:
Indirect Tensile Strength (psi) Shrinkage (in/in)300 or < 0.0008
400 0.0006500 0.00045600 0.0003
700 or > 0.0002
X.B.7 Steel Reinforcement Bar DimensionsThe following is a listing of the typical reinforcement bar dimensions in terms of diameterand cross sectional area for dowels and tie bars.
Bar Size Diameter Cross-sectional Area (in2)#3 0.375 0.11#4 0.500 0.20#5 0.625 0.31#6 0.750 0.44#7 0.875 0.60#8 1.000 0.79#9 1.128 1.00
#10 1.270 1.27#11 1.410 1.56
X.B.8 Steel Mesh DimensionsThe following is a listing of the typical welded wire mesh dimensions in terms of spacingbetween wires and the cross sectional area for both smooth and deformed wire mesh.

Material Library
Updated 11/1/2002 X-10
Wire Size # Cross-sectional Area (in2/ft)Center-to-Center Spacing (in)Smooth Deformed
Diameter(in)
4 6 8 10 12W31 D31 0.628 0.93 0.62 0.465 0.372 0.31W30 D30 0.618 0.90 0.60 0.45 0.36 0.30W28 D28 0.597 0.84 0.56 0.42 0.336 0.28W26 D26 0.575 0.78 0.52 0.39 0.312 0.26W24 D24 0.553 0.72 0.48 0.36 0.288 0.24W22 D22 0.529 0.66 0.44 0.33 0.264 0.22W20 D20 0.504 0.60 0.40 0.30 0.24 0.20W18 D18 0.478 0.54 0.36 0.27 0.216 0.18W16 D16 0.451 0.48 0.32 0.24 0.192 0.16W14 D14 0.422 0.42 0.28 0.21 0.168 0.14W12 D12 0.390 0.36 0.24 0.18 0.144 0.12W11 D11 0.374 0.33 0.22 0.165 0.132 0.11
W10.5 0.366 0.315 0.21 0.157 0.126 0.105W10 D10 0.356 0.30 0.20 0.15 0.12 0.10W9.5 0.348 0.285 0.19 0.142 0.114 0.095W9 D9 0.338 0.27 0.18 0.135 0.108 0.09
W8.5 0.329 0.255 0.17 0.127 0.102 0.085W8 D8 0.319 0.24 0.16 0.12 0.096 0.08
W7.5 0.309 0.225 0.15 0.112 0.09 0.075W7 D7 0.298 0.21 0.14 0.105 0.084 0.07
W6.5 0.288 0.195 0.13 0.097 0.078 0.065W6 D6 0.276 0.18 0.12 0.09 0.072 0.06
W5.5 0.264 0.165 0.11 0.082 0.066 0.055W5 D5 0.252 0.15 0.10 0.075 0.06 0.05
W4.5 0.240 0.135 0.09 0.067 0.054 0.45W4 D4 0.225 0.12 0.08 0.06 0.048 0.04
Welded wire mesh is prefabricated reinforcement consisting of parallel series of high-strength, cold drawn wires welded together in square or rectangular grids. Thenomenclature for specifying wires is identified by the spacing between the wires andthen the wire size number as follows; 6 X 12 – W8 X W6. The spacing of thelongitudinal wires is the first number (6) and the spacing of the transverse wires is thesecond number (12). The size of the longitudinal wire is the third number (W8) and thesize of the transverse wire is the last number (W6). The size of the wires also indicatesthe cross-sectional area per foot of wire; i.e. W8 is equivalent to 0.08 in2 per foot.
X.B.9 HMA Unit WeightThe material unit weight is critical information in order to develop accurate quantities tobe placed into contract documents. The unit weight of HMA is the most used unit weightwhen developing material quantities. At this time, the only substantial historicalinformation concerning measured unit weights of HMA mixes is for the older Marshallmix design mixes. Historical unit weight information for placed HMA Superpave mixeswill be available in the near future. Until that information becomes available, theMarshall mixes will be adequate for estimating purposes.

Material Library
Updated 11/1/2002 X-11
Several factors contribute to the unit weight of HMA that are beyond the control of thedesigner developing the material quantities. These factors include, but are not limited tothe following:
• Specific gravity of aggregate – varies by supplier• Compaction effort by contractor• Climatic conditions at time of construction• Construction practices of contractor
The following table presents the historical (1999) unit weights of Superpave mixesdeveloped from maximum specific gravity and based on a 4% air void assumption.
Material Average Unit Weight (lbs/ft3)4.75 mm 153.29.5 mm 147.5
12.5 mm 148.519.0 mm 149.925.0 mm 150.9
12.5 mm Gap Graded 152.119.0 mm Gap Graded 150.2
Non GG Surface Mixes 149.7Base Mixes 150.4All Mixes 150.3
The majority of the pavement design analysis effort is to develop a thickness ofrehabilitation and an area of the rehabilitation treatment. The following equation showsa simplified method of developing HMA quantities knowing the thickness of the materialand the predicted area of the treatment.
HMA Quantity (tons) = [Area (yd2) * Thickness of Lift (inches)] / 17
The simplified equation is developed from the following equation that involvesconservative unit weight estimate and material unit conversions.
HMA Quantity (tons) = Area (yd2) * Thickness of Lift (inches) * (1 yd / 36 inches) *(27 ft3 / 1 yd3) * Unit Weight HMA (#/ft3) * (1 ton / 2000 #)
A denominator of 17 in the simplified equation is equivalent to a HMA unit weight of156.9 lbs/ft3. This value is slightly higher than our historical average for HMA unitweights shown in the table above, but this is designed to be a conservative estimate andit is determined this simplified equation provides an adequate quantity.
X.C DESIGN PROPERTIESDesign properties are the input parameters of pavement materials used in new orpavement rehabilitation design procedures. Design properties are based on the materialproperties, but are expressed in a form to be used in the pavement design process. ThisSection describes the design input properties used by MDSHA Pavement Division.

Material Library
Updated 11/1/2002 X-12
X.C.1 Drainage Coefficient FactorThe drainage coefficient or any variation of the structural coefficient based on saturationlevels shall only be considered for unbound material layers. The drainage coefficient forbound materials shall be equal to one (1.0). MDSHA has adopted an approach to adjustthe structural coefficient of unbound layers based on the saturation level rather thanintroduce a drainage coefficient. The following equations present the relation betweenthe subgrade strength, degree of saturation, and material type to the structuralcoefficient of unbound layers.
Graded Aggregate Base, Stone
HMA Thickness <= 5.0”a2 = (0.14 + 0.0029 * (Subgrade (CBR)) + fs
HMA Thickness > 5.0”a2 = (0.14 + 0.0029 * (Subgrade (CBR)) – 0.035 + fs
fs = 0.0 for dry conditionsfs = -0.033 for wet conditions
Gravel
HMA Thickness <= 5.0”a2 = (0.08 + 0.0064 * (Subgrade (CBR)) + fs
HMA Thickness > 5.0”a2 = (0.10 + 0.0021 * (Subgrade (CBR)) + fs
fs = 0.0 for dry conditionsfs = -0.046 for wet conditions
Wet conditions are defined as when the unbound material is saturated more than 60% ofthe time. Based on the climatic conditions and the natural soils in Maryland, it isrecommended to assume that wet conditions exist unless evidence can be provided toshow that the unbound base is dry a majority of the time. These special cases wouldonly exist where an open-graded base was used or in topographical conditions withgood vertical drainage and clean sands/gravel exists for several feet beneath the top ofsubgrade.
X.C.2 Friction FactorThe following are recommended friction values for the subgrade and a variety of basematerials to be used in rigid pavement design:
Material Beneath Slab Friction FactorSurface Treatment 2.2Lime Stabilization 1.8
Asphalt Stabilization 1.8Cement Stabilization 1.8
River Gravel 1.5Crushed Stone 1.5
Sandstone 1.2Natural Subgrade 0.9

Material Library
Updated 11/1/2002 X-13
X.C.3 Design Properties for Pavement MaterialsThe following table presents numerous design parameters for materials commonly used by MDSHA.
Mat
eria
l
Des
ign
Use
Stru
ctur
alC
oeffi
cien
tR
ange
for N
ewM
ater
ial
Des
ired
Stru
ctur
alC
oeffi
cien
t
Min
. Lift
Thic
knes
s
Des
ired
Lift
Thic
knes
s
Max
. Lift
Thic
knes
s
Stru
ctur
alC
oeffi
cien
tR
ange
Afte
rD
eter
iora
tion
Stru
ctur
alC
oeffi
cien
t for
Det
erio
rate
dM
ater
ial
Dra
inag
eC
oeffi
cien
t
PCC Surface N/A N/A 6.0” N/A 14.0” N/A N/A N/ABreak/Crack and Seat PCC Base 0.20 – 0.35 0.25 6.0” N/A 14.0” N/A N/A 1.0Rubbilized PCC Base 0.15 – 0.30 0.20 6.0” N/A 14.0” N/A N/A 1.0HMA Superpave 4.75 mm Surface 0.44 0.44 0.5” 0.75” 0.75” 0.3 – 0.44 0.38 1.0HMA Superpave 9.5 mm GapGraded Surface 0.44 0.44 1.0” 1.5” 1.5” 0.3 – 0.44 0.38 1.0
HMA Superpave 9.5 mm Surface,W/L 0.44 0.44 1.0” 1.5” 2.0” 0.3 – 0.44 0.38 1.0
HMA Superpave 12.5 mmGap Graded Surface 0.44 0.44 1.5” 2.0” 2.0” 0.3 – 0.44 0.38 1.0
HMA Superpave 12.5 mm Surface 0.44 0.44 1.5” 2.0” 2.5” 0.3 – 0.44 0.38 1.0HMA Superpave 19.0 mmGap Graded Surface 0.44 0.44 2.0” 2.0” 2.5” 0.3 – 0.44 0.38 1.0
HMA Superpave 19.0 mm Base,Surface 0.40 0.40 2.0” 2.5” 4.0” 0.3 – 0.40 0.36 1.0
HMA Superpave 25.0 mm Base 0.40 0.40 3.0” 3.5” 5.0” 0.3 – 0.40 0.36 1.0HMA Superpave 37.5 mm Base 0.38 0.38 4.0” 5.0” 6.5” 0.3 – 0.38 0.34 1.0Cement Treated GranularBase Base 0.15 – 0.30 0.25 4.0” 6.0” 6.0” 0.15 – 0.30 0.25 1.0
Asphalt Treated AggregateBase Base 0.10 – 0.25 0.20 4.0” 6.0” 6.0” 0.10 – 0.25 0.20 1.0
Penetration Macadam Base 0.10 – 0.25 0.20 3.0” 6.0” 8.0” 0.10 – 0.25 0.20 1.0Macadam Base 0.10 – 0.20 0.15 3.0” 6.0” 8.0” 0.10 – 0.20 0.15 *Soil Cement Base 0.15 – 0.25 0.20 4.0” 6.0” 6.0” 0.15 – 0.25 0.20 1.0

Material Library
Updated 11/1/2002 X-14
Mat
eria
l
Des
ign
Use
Stru
ctur
alC
oeffi
cien
tR
ange
for N
ewM
ater
ial
Des
ired
Stru
ctur
alC
oeffi
cien
t
Min
. Lift
Thic
knes
s
Des
ired
Lift
Thic
knes
s
Max
. Lift
Thic
knes
s
Stru
ctur
alC
oeffi
cien
tR
ange
Afte
rD
eter
iora
tion
Stru
ctur
alC
oeffi
cien
t for
Det
erio
rate
dM
ater
ial
Dra
inag
eC
oeffi
cien
t
Cement Modified Subgrade* Subbase 0.05 – 0.07 0.06 4.0” 6.0” 8.0” 0.05 – 0.07 0.06 1.0Graded Aggregate Base,GAB Base 0.08 – 0.14 0.12 3.0” 6.0” 6.0” 0.08 – 0.14 0.11 *
Bank Run Gravel Base 0.06 – 0.12 0.10 3.0” 6.0” 6.0” 0.06 – 0.12 0.10 *CR-6 Crusher Run Base 0.06 – 0.12 0.09 3.0” 6.0” 6.0” 0.06 – 0.12 0.09 *GSS w/ GAB Base 0.05 – 0.10 0.08 3.0” 6.0” 12.0” 0.05 – 0.10 0.08 *Soil Contaminated AggregateBase Base 0.05 – 0.10 0.08 3.0” 6.0” 6.0” 0.05 – 0.10 0.08 *
Common Borrow Subbase 0.03 – 0.06 0.04 3.0” 6.0” 8.0” 0.03 – 0.06 0.04 *Select Borrow Subbase 0.04 – 0.08 0.05 3.0” 6.0” 8.0” 0.04 – 0.08 0.05 *Capping Borrow Subbase 0.04 – 0.08 0.06 3.0” 6.0” 8.0” 0.04 – 0.08 0.06 *Modified Borrow Subbase 0.05 – 0.09 0.07 3.0” 6.0” 8.0” 0.05 – 0.09 0.07 *
* MDSHA has adopted an approach to adjust the structural coefficient of unbound base rather than introduce a drainage coefficient. The structural coefficient ofthe unbound layer is effected by the thickness of the overlying material and degree of saturation of the base layer. This section further describes this relationshipbetween degree of saturation and the effect on structural coefficient.