· the pavement cracking in the district’s bicycle and pedestrian ... dates from a nomograph in...
TRANSCRIPT


Memo to the Programs, Projects, and Operations Subcommittee Subject: Big Papio Trail Date: July 2, 2004 From: Gerry Bowen The recently-constructed Big Papio Trail Project between Center and Blondo has experienced cracking of the concrete trail on 4,008 of the 14,025 feet (29%) of trail installed. The project was designed by Kirkham Michael and constructed by Hawkins Construction Company of Omaha. The first concrete was poured on July 22, 2002. The District then hired Terracon, Inc. to conduct the necessary scientific tests to determine the causes(s) of the cracking. Their report (see attached) indicates two periods of cracking occurred (early and late). The early cracking is concluded to be primarily caused by placement of “fly ash” concrete on a dry sub-grade during hot, dry, and windy afternoons. The later cracking is concluded to be primarily caused by poor sub-grade support (compaction) which allowed the concrete to fail under traffic load. The early cracks were routed and sealed, or sections replaced, by the contractor. The later cracks have not been repaired. Management recommends that the Subcommittee recommend to the Board that the General Manager be authorized to negotiate with the responsible parties for correction of the pavement cracking in the District’s bicycle and pedestrian trail along the Big Papillion Creek between West Center Road and Blondo Street, and report back to the Board at its August meeting.


Big Papio Trail Pavement Distress TerraconOmaha, NebraskaProject No. 05035181July 1, 2004
05035181R01a 2
soon after they were noted. Localized distressed areas were also removed and replaced aroundthe same time.
Subsequent to repair of approximately 1,300 lineal feet of cracks, an additional 2,000 lineal feetof cracks were noted. The cracks do not extend the full length of the trail but are generallycontinuous along relatively long stretches. A summary of the crack locations, prepared byKirkham Michael in late 2003, was provided to Terracon and is referenced later in this report.
FIELD SERVICES
Terracon performed Heavy Weight Deflectometer testing on April 13, 2004. Testing wasconducted in a single pass along the centerline of the trail at intervals of 100-feet for a total of190 test locations. A target load level of 6,000 lbf was used and actual load and deflectionmeasurements were automatically recorded along with distance from the start location. Thisdata was analyzed using techniques published in Appendix L of the AASHTO Guide for Designof Pavement Structures, 1993.
Ground Penetrating Radar measurements were made on April 14, 2004 in an effort todetermine Portland Cement Concrete thickness along the entire length of the trail.Measurements were obtained along the centerline of the trail and recorded at one-foot intervals.The GPR data was analyzed using techniques presented in ASTM D-4748 “Standard TestMethod for Determining the Thickness of Bound Pavement Layers Using Short-Pulse Radar,”with software incorporating enhanced processing functionality for automatic determination oflayer dielectric constant. Horizontal control was maintained using a commercial distance-measuring instrument connected to the transmission of the survey vehicle. All GPR datacollected was referenced to existing landmarks (including core locations) and our referencestationing established for this project. (Plan Station minus 370 feet). GPR measurements werecross-referenced to measured core lengths and strengths to verify the types and thicknesses ofpavement and subgrade materials and to provide ground truth for calibration of the GPR data.
Sets of three, 3-foot deep borings were performed at each of the following sections:
• Two locations (at sealed and new cracks) in Section No. 1, one location (at new crack)in Section No. 2, one “control” location (no cracking) in Section No. 3, Two locations (atsealed and new cracks) in Section No. 4, and one “control” location (no cracking) inSection No. 5.
• At each referenced location, one boring was performed about 1-foot in from eachpavement edge and one boring was performed near the center of the trail.! At each boring location, the pavement was cored using a 4-inch I.D. core barrel.! At locations of cracks, the center core was centered on the crack.

Big Papio Trail Pavement Distress TerraconOmaha, NebraskaProject No. 05035181July 1, 2004
05035181R01a 3
At each referenced station, transverse elevation profiles were obtained with a FACE Dipstick2000 across the trail pavement at locations about one-foot north and south of the cores. Theelevation profiles are included in the Appendix of this report.
Sampling in the soil borings was performed in accordance with our standard procedureswherein thin-walled samples (ASTM D-1587) are obtained in cohesive soils. In each boring,two samples were obtained in the top 2 ½ feet of soil subgrade. In addition, bulk samples ofthe auger cuttings were collected.
Field logs of each boring were prepared by the drill crew. These logs included visualclassifications of the materials encountered during drilling as well as the driller's interpretation ofthe subsurface conditions between samples. Final boring logs included with this reportrepresent an interpretation of the field logs and include modifications based on laboratoryobservation and tests of the samples.
Descriptive classifications of the soils indicated on the boring logs are in accordance with theenclosed General Notes and the Unified Soil Classification System. Also shown are estimatedUnified Soil Classification Symbols. A brief description of this classification system is attachedto this report. All classification was by visual-manual procedures and was performed byexperienced personnel
Boring layout was approximate. Distances from available reference features were measuredusing a calibrated wheel. The locations of the borings should be considered accurate only tothe degree implied by these methods. The bore holes were backfilled after completion ofsampling and the pavement surface was patched with non-shrink cement grout mix.
Laboratory Evaluations: Unconfined compressive strength or hand penetrometer tests, watercontent, and density tests were performed on representative portions of thin-walled tubesamples. Each of the tube samples obtained in the field was tested and classified. In additionto this standard soil testing, selected samples of the soil subgrade were tested for moisture-density relationship (Standard Proctor) and plasticity index (Atterberg Limits). Shrinkage limitsof the soils were estimated based on empirical relationship with the Atterberg Limits. Theresults of the laboratory soil tests are presented on the Boring Logs and in attachmentsincluded in the Appendix of this report.
Four of the concrete cores were selected by Terracon and sent to Mr. Tom Patty of WissJanney Elstner Associates, Inc. in Austin, Texas to have petrographic examinations performed. Cores from each of the following conditions were examined petrographically: a sealed crack,an open crack and two “control” cores from non-cracked areas. Core length and density weremeasured on each of the cores that were not obtained on a crack. One of the uncracked coresobtained from each location was tested for compressive strength and the other uncracked core

Big Papio Trail Pavement Distress TerraconOmaha, NebraskaProject No. 05035181July 1, 2004
05035181R01a 4
was tested for split-tensile strength. Results of the core testing are presented in a summaryincluded in the report appendix.
ENGINEERING ANALYSES
Detailed monthly and daily weather records from Eppley Airfield for July and August, 2002 wereobtained from the National Oceanic and Atmospheric Administration (NOAA). This information,as presented in the report appendix, was used to estimate evaporative loss rates for the pourdates from a nomograph in ACI 305 “Guide for Hot Weather Concreting”. Monthly summariesof daily high and average temperatures, wind speed, and total precipitation were also compiledand are included in the appendix.
Other interpretive aids that have been produced and are included in the appendix include:
• The Petrographic Analysis Report• Plots, for each day of concrete placement, of individual and averaged modulus of
subgrade reaction values, GPR pavement thickness measurements and variations inpavement condition; annotated with the time and direction of concrete placement, coreset locations, core thickness measurements, evaporative loss rate, soil compaction testdata, and percent occurrence of different pavement conditions.
• Plots comparing measured strengths, water contents, and densities vs. depth for eachset of soil borings.
• Plots of changes in pavement elevation and horizontal movements derived fromselected data summaries from surveys performed and provided to Terracon by NRDstaff on six occasions between November, 2003 and May, 2004, and
• Plots of pavement elevation profiles taken at each core set location
HWD and GPR Analyses: Determining pavement layer properties from HWD deflection datarequires layer thickness. We analyzed the GPR data to determine the thickness of the slab foreach data record. From this set of results we selected the thickness value (D) corresponding toeach location of an HWD test. The HWD data (load, deflections) for each test were used alongwith the thickness value to calculate structural properties including elastic modulus of the PCC(EPCC), flexural strength of the PCC (S’c), and static modulus of subgrade reaction (k).
Table 1 presents the statistics for the results obtained from the analyses. Variability of theresults is indicated by the CV (coefficient of variance; the ratio of standard deviation to themean). The thickness variation is low indicating fairly consistent construction of the slabs.Subgrade variation is much higher indicating support conditions are much less consistent. ThePCC elastic modulus is highly variable reflecting the observed conditions; cracked slabs willhave reduced elastic modulus relative to uncracked slabs constructed of the same lot of freshconcrete placed at the same time.

Big Papio Trail Pavement Distress TerraconOmaha, NebraskaProject No. 05035181July 1, 2004
05035181R01a 5
Table 1 - Summary of Analysis ResultsProperty Average Maximum Minimum Std. Dev. CV
DGPR 6.2 8.6 4.8 0.7 11%EPCC 3.5 x 10⁶ 10.1 x 10⁶ 0.147 x 10⁶ 1.49 x 10⁶ 42%S’c 641 929 495 64.8 10%k 50 92 12 15.7 31%
Note: One outlier removed, statistics are based on remaining189 values
All HWD testing was performed at the slab centerline. The majority of cracking observed waslongitudinal cracking also generally located near the centerline. Because the cracks weremostly narrow and did not appear to exhibit signs of movement (they were not “working” cracks)we believe the deflection measurements are reasonable and consistent with the assumptionsused in developing the AASHTO relationships cited above. In some cases the cracks mayhave been more active and the resulting poor results indicative of conditions outside the rangeassumed for the relationships. Overall, we believe the data and analysis results reflect fieldconditions despite the presence of cracks at some test locations.
Pavement Load analyses: We understand normal traffic along the trail consists of occasionalmaintenance truck traffic (2-axle, 6-tire configuration) and occasional traffic due to mowingequipment (John Deere 4020 type tractors). We also understand portions of the trail may havereceived occasional heavier truck or equipment traffic during construction (milling machine,graders, etc.).
Based on our analysis of the load-deflection and laboratory test data, the subgrade soils exhibita significantly softer response than is normally associated with similar soil materials. Based onour analysis, an average modulus of subgrade reaction of 30 to 50 pci appears to berepresentative of the majority of the project. We anticipate that seasonal moisture variation atand under the edges of the trail pavement could also create zones of alternating shrinkage andswelling in the underlying subgrade soils, causing further loss of support during periods of theyear.
We analyzed the existing slabs using the data collected from the field and laboratory testprograms to evaluate whether load effects combined with seasonal subgrade stiffness variationcould result in cracking similar to that observed in the field. The analysis was based on a finiteelement analysis of the slab-subgrade interaction under various load combinations in addition toIonnides' modified forms of the original Westergard formulations for maximum stresses due toedge loading. Based on these analyses, the load due to a tractor tire, if applied near the edgeof the slab, could result in bending stresses in the slab on the order of 75 to 95 percent of theconcrete modulus of rupture. The load due to a loaded concrete transit truck applied near theedge of the slab could also result in bending stresses in the slab on the order of 80 to 100percent of the concrete modulus of rupture. The load due to a heavily loaded, single axle

Big Papio Trail Pavement Distress TerraconOmaha, NebraskaProject No. 05035181July 1, 2004
05035181R01a 6
maintenance truck (at 16,000 to 24,000 GVW) could cause bending stresses in the slab on theorder of 60 to 75 percent of the concrete modulus of rupture. These values are for a uniform 50pci subgrade with no loss or concentration of support at the edges. The presence of non-uniform edge support and softer subgrade below the center would increase the risk of structuralfailure.
Based on these analyses, it appears the occasional heavier loads that the trail has experiencedmay have a significant role in the later longitudinal cracking that has been observed. At stresslevels greater than about 85 percent of the concrete rupture strength, it would only require afew passes to initiate cracking in the slab. These load conditions combined with the otherseasonally related subgrade support issues and the potential for some built in tensile stressesdue to plastic and drying shrinkage could easily result in the observed cracking.
CONCLUSIONS
The first observed cracking in the trail, most of that which was routed and sealed, typicallyappears to have a different general pattern than most of the cracking that has occurred since.The early cracks generally do not as often run continuous through the transverse sawed joints,and are more prone to deviate from the center line of the trail and to sometimes curve towardsthe pavement edge near the transverse joints. A dual crack occasionally splits off the originalcrack at these locations in the early cracking areas. The later cracking is more oftencontinuous through the transverse joints and tends to more commonly follow the pavementcenterline.
The petrographic analyses indicates that the crack from the routed and sealed location did notappear to go through as much aggregate as the core with the later open crack. This suggestsearlier crack development, or initiation, before the concrete had gained full strength in therouted and sealed location. Although the petrographic examination did not detect signs ofsevere water deprivation, such as excessive amounts of unhydrated cement, there was likelysome water loss and internal tension stresses developed.
Both the more random cracking patterns and the petrographic findings indicate that the initialcracks were more likely affected by internal tension stresses generated by concrete shrinkage,while the later cracks appear to generally be more characteristic of a typical traffic load-inducedfailures. The concrete shrinkage affecting the early cracks was probably a result of not only thehigh evaporative loss rate during hot, dry and windy afternoons, but also by absorption of waterfrom the fluid concrete by relatively dry subgrade soils. Due to the design slope of thesubgrade, water contents were probably higher on the low side if rainwater ponded in areasexposed to rain events. This could have caused variable non-uniformity in the subgradeabsorption and support conditions

Big Papio Trail Pavement Distress TerraconOmaha, NebraskaProject No. 05035181July 1, 2004
05035181R01a 7
In areas of relatively dry subgrade, wetting of the edge soils due to rains subsequent topavement placement could also have caused local subgrade heave along the pavement edgesdue to swelling of the underlying clays. This non-uniform support condition, combined withinternal shrinkage stress, could have significantly reduced the traffic load required to initiatecracking in the bottom of the pavement section. These cracks may not have become apparentuntil hot and dry weather and vegetative water withdrawal caused the edge soils to dry andshrink again, allowing the crack to propagate to the surface.
The characteristics observed to be most commonly associated with the areas of later crackdevelopment are comparatively low subgrade modulus, soil strength and density. The drying ofthe edge soils due to hot, dry weather and vegetative demand also likely caused shrinkage ofthe soils to some distance under the pavement edges. The volumetric shrinkage of the soilmass along the pavement edges could have also resulted in development of some outwardtensile stress due to subgrade adhesion on the bottom of the pavement. These effects couldhave reduced the effective edge support of the pavement and significantly reduced the trafficloads required to cause cracking. It is our opinion that the majority of the later cracking wascaused by traffic loading combined with relatively poor subgrade support capacity. This appearsto typically have been primarily caused by inadequate subgrade strength, but may have beenexacerbated by internal shrinkage stresses due to the effect of the flyash on the concrete mix.
The subgrade compaction tests that were performed indicated that the subgrade compaction met project specifications, except for the tests performed at STA 117. However, the number,frequency and/or locations of the compaction tests do not appear to have been adequate to besufficiently representative of the actual subgrade conditions, based on the borings anddeflectometer tests. The reports indicated that after three failing tests at STA 117, theengineer’s on-site representative stated the subgrade was deemed adequate, regardless of thetest results. This is one of the most marked areas of low subgrade strength and later crackdevelopment.
In general, the concrete characteristics (strengths, air content, density, and thickness) appearnot to have typically been a major contributor to the cracking problems. However, the flyashutilized in the concrete mix reduces the bleed rate and increases the likelihood for evaporationrates to exceed the bleed rate, increasing the risk of plastic shrinkage problems. Plasticshrinkage generally appeared to play a more significant role in the early cracking. But it isdifficult to quantify whether internal tension stresses due to plastic shrinkage could havepersisted long enough in the pavement section to play a significant role in the later cracking.
There has also been mention by a Lyman Richey representative that the combined effects ofthe flyash and water reducer may have caused an adverse effect on the normal hydrationregulation action of the sulfates (gypsum) provided in the Portland cement. Little informationappears available about the specifics of this problem termed “sulfate deprivation”, but there is

Big Papio Trail Pavement Distress TerraconOmaha, NebraskaProject No. 05035181July 1, 2004
05035181R01a 8
anecdotal evidence that it may increase the risk of shrinkage cracking. A new procedure forcalorimetric testing of the PCC mixes to help evaluate the effect on hydration characteristics offlyash and admixture combinations appears to warrant consideration to help better evaluate thepotential for future problems in this regard. Persistent internal tension stress due to this type ofshrinkage could have exacerbated the later cracking problems the trail has exhibited.
ENGINEERING RECOMMENDATIONS
The existing cracked pavements will necessitate increased maintenance, on a regular basis, torout and keep the cracks effectively sealed. This will be required to control against progressivedeterioration due to water infiltration and local spalling of the crack edges. Although someadditional cracking would be expected, the amount of new cracking would generally beexpected to be progressively less over time. Protecting the trail from exposure to heavyequipment loads will also be important in reducing additional cracking. Establishing vegetationselected for low water demand and limited root system depth along the edges of the trail wouldalso help reduce the potential magnitude of subgrade shrinkage along the pavement edges.With these factors adequately addressed, the trail in affected areas would be expected toremain relatively intact and serviceable for its intended use for support of light traffic loads.
From the perspective of reducing the risks of similar cracking problems on future projects,improvement of the strength and uniformity of the subgrade is considered the most importantfactor. Increasing the number, frequency and reliance on compaction and moisture testing isconsidered central to this issue. Visual observations can be particularly misleading when thesubgrade surface appears relatively dry.
It would also be prudent to increase the level of subgrade improvement by specifying deepercompaction or chemical stabilization with flyash or cement. Alternatively, design of thepavement section on a more pronounced embankment to increase drainage, or use ofimpermeable shoulders could be considered to reduce shrink/swell of the subgrade soils alongthe pavement edges. High water demand vegetation should be avoided in close proximity tothe pavements.
Not using flyash in the PCC mix, or possibly performing testing to help avoid adverse admixtureinteractions, may reduce the potential for shrinkage crack development during hot, dry andwindy placement conditions. Alternatively, placing the concrete during the early morning or lateafternoon, or other times of low evaporation rate, may help in this regard. If the flyash iscausing long-term shrinkage, its elimination may also reduce the pavement’s sensitivity tocracking in soft subgrade areas.


Big Papio TrailAmbient Weather Conditions, July 2002
13
1 1 1
72
1 5
20
5 1
28
126
0102030405060708090
100110120130
1 6 11 16 21 26 31
Date
Dgr
ees
f, 10
0ths
/in, M
PH
TavgTmaxPrecipTotalAvg Wind Spd

Big Papio TrailAmbient Weather Conditions, August 2002
54
7 1 1
230
4 1
67
1 1
27
147
237
1
45
0102030405060708090
100110120130140150160170180190200210220230240
1 6 11 16 21 26 31
Date
Dgr
ees
f, 10
0ths
/in, M
PH
TavgTmaxPrecipTotalAvg Wind Spd

Big Papio TrailAmbient Weather Cond., 7/22/02
0
10
20
30
40
50
60
70
80
90
100
110
0:00 6:00 12:00 18:00 0:00
Time
Degr
ees
f, %
, mph
TempRel. Hmd.Wind spd
Avg. Temp = 83
Avg. RH = 45%
Avg. Wind = 9mph Evap. Rate=0.18avg
Conc. Temp = 84

Big Papio TrailSubgrade Modulus vs. Condition
July 22, 2002
0
10
20
30
40
50
60
70
0 100 200 300 400 500 600 700 800 900 1000 1100 1200 1300 1400 1500 1600 1700
Station, feet
Subg
rade
mod
ulus
Measured Moduli
Avg Moduli
Condition
Pvmt. Thickness
6" Design thickness
Evap. Rate = 0.18
% Uncracked = 47
(avg k = 50)
% Early Cracks = 47
(avg k = 37)
% Later Cracks = 6
(avg k = 21)
ConditionReplaced
Later Cracks
Sealed Cracks
Uncracked
Core Set #11B = 6.1”
Core Set #22B = 6.0”
7/[email protected] 7/[email protected] Tests
Afternoon Pour N-S

Big Papio TrailSoil Properties - Sta 3+12
0
1
2
3
0 10 20 30 40 50 60 70 80 90 100 110
Qc, ksf - Water Content, % - Density, pcf
Dep
th, f
tLegendLeftCenterRight
Slope - Away from Creek (Lt)Condition - Sealed Crack


Trail Elevation Survey data
-0.05
-0.04
-0.03
-0.02
-0.01
0
0.01
0.02
0.03
6-Oct-03 25-Nov-03 14-Jan-04 4-Mar-04 23-Apr-04 12-Jun-04
Date
Chan
ge fr
om In
itial
Ele
v, ft
2+00L2+00R3+00R3+00L4+00L4+00R
Trail Elevation Survey data
0
0.02
0.04
0.06
0.08
0.1
0.12
0.14
6-Oct-03 25-Nov-03 14-Jan-04 4-Mar-04 23-Apr-04 12-Jun-04
Date
Chan
ge fr
om In
itial
Hor
iz.,
ft
2+00L2+00R3+00R3+00L4+00L4+00R
Trail Elevation Survey data
-0.03
-0.02
-0.01
0
0.01
0.02
0.03
6-Oct-03 25-Nov-03 14-Jan-04 4-Mar-04 23-Apr-04 12-Jun-04
Date
Chan
ge fr
om In
itial
Ele
v, ft
5+00R5+00L6+00L6+00R7+00R7+00L
Trail Elevation Survey data
0
0.005
0.01
0.015
0.02
0.025
0.03
0.035
0.04
0.045
6-Oct-03 25-Nov-03 14-Jan-04 4-Mar-04 23-Apr-04 12-Jun-04
Date
Chan
ge fr
om In
itial
Hor
iz.,
ft5+00R5+00L6+00L6+00R7+00R7+00L

Big Papio TrailSoil Properties - Sta 13+09
0
1
2
3
0 10 20 30 40 50 60 70 80 90 100 110
Qc, ksf - Water Content, % - Density, pcf
Dept
h, ft
Slope - Away from Creek (Lt)Condition - Open Crack
LegendLeftCenterRight


Trail Elevation Survey data
-0.07
-0.06
-0.05
-0.04
-0.03
-0.02
-0.01
0
0.01
0.02
0.03
6-Oct-03 25-Nov-03 14-Jan-04 4-Mar-04 23-Apr-04 12-Jun-04
Date
Cha
nge
from
Initi
al E
lev,
ft17+00R17+00L18+00L18+00R19+00R19+00L
Trail Elevation Survey data
-0.04
-0.03
-0.02
-0.01
0
0.01
0.02
0.03
6-Oct-03 25-Nov-03 14-Jan-04 4-Mar-04 23-Apr-04 12-Jun-04
Date
Chan
ge fr
om In
itial
Ele
v, ft
14+00L14+00R15+00R15+00L16+00L16+00R
Trail Elevation Survey data
-0.025
-0.02
-0.015
-0.01
-0.005
0
0.005
0.01
0.015
6-Oct-03 25-Nov-03 14-Jan-04 4-Mar-04 23-Apr-04 12-Jun-04
Date
Cha
nge
from
Initi
al E
lev,
ft
11+00R11+00L12+00L12+00R13+00R13+00L
Trail Elevation Survey data
-0.03
-0.02
-0.01
0
0.01
0.02
0.03
6-Oct-03 25-Nov-03 14-Jan-04 4-Mar-04 23-Apr-04 12-Jun-04
Date
Cha
nge
from
Initi
al E
lev,
ft
8+00L8+00R9+00R9+00L10+00L10+00R

Trail Elevation Survey data
0
0.02
0.04
0.06
0.08
0.1
0.12
6-Oct-03 25-Nov-03 14-Jan-04 4-Mar-04 23-Apr-04 12-Jun-04
Date
Chan
ge fr
om In
itial
Hor
iz.,
ft17+00R17+00L18+00L18+00R19+00R19+00L
Trail Elevation Survey data
0
0.01
0.02
0.03
0.04
0.05
0.06
0.07
0.08
6-Oct-03 25-Nov-03 14-Jan-04 4-Mar-04 23-Apr-04 12-Jun-04
Date
Chan
ge fr
om In
itial
hor
iz.,
ft
14+00L14+00R15+00R15+00L16+00L16+00R
Trail Elevation Survey data
0
0.01
0.02
0.03
0.04
0.05
0.06
6-Oct-03 25-Nov-03 14-Jan-04 4-Mar-04 23-Apr-04 12-Jun-04
Date
Chan
ge fr
om In
itial
Hor
iz.,
ft
11+00R11+00L12+00L12+00R13+00R13+00L
Trail Elevation Survey data
0
0.005
0.01
0.015
0.02
0.025
0.03
0.035
0.04
0.045
0.05
6-Oct-03 25-Nov-03 14-Jan-04 4-Mar-04 23-Apr-04 12-Jun-04
Date
Chan
ge fr
om In
itial
Hor
iz.,
ft
8+00L8+00R9+00R9+00L10+00L10+00R

Big Papio TrailAmbient Weather Cond., 7/30/02
0
10
20
30
40
50
60
70
80
90
100
0:00 6:00 12:00 18:00 0:00
Time
Degr
ees
f, %
, mph
TempRel HmdWind Spd
Avg. Temp = 90
Avg. RH = 45%
Avg. Wind = 12mphEvap. Rate=0.24avg
Conc. Temp = 88

Evap. Rate = 0.24
% Uncracked = 100
(avg k = 58)
% Early Cracks = 0
% Later Cracks = 0
ConditionReplacedLater CracksSealed CracksUncracked
Sloped Towards Creek
Big Papio TrailSubgrade Modulus vs. Condition
July 30, 2002
0
10
20
30
40
50
60
70
80
90
100
1500 2000 2500 3000 3500 4000 4500
Station, feet
Subg
rade
mod
ulus
Measured Moduli
Avg Moduli
Condition
Pvmt. Thickness
6" design Thickness
7/[email protected] 7/[email protected] Tests
Morning Pour S-N

Big Papio TrailAmbient Weather Cond., 7/31/02
0
10
20
30
40
50
60
70
80
90
100
0:00 6:00 12:00 18:00 0:00
Time
Degr
ees
f, %
, mph
TempRel HmdWind Spd
Avg. Temp = 95
Avg. RH = 39%
Avg. Wind = 16mph Evap. Rate=0.35avg
Conc. Temp = 92

Big Papio TrailSubgrade Modulus vs. Condition
July 31, 2002
0
10
20
30
40
50
60
70
4350 4450 4550 4650 4750 4850 4950 5050 5150 5250 5350 5450 5550 5650 5750 5850 5950
Station, feet
Subg
rade
mod
ulus Measured Moduli
Avg Moduli
Condition
Pvmt. Thickness
6" Design Thickness
Evap. Rate = 0.35
% Uncracked = 46
(avg k = 42)
% Early Cracks = 0
% Later Cracks = 54
(Avg k = 29)
Sloped Towards Creek
Condition
Replaced
Later Cracks
Sealed Cracks
Uncracked
Core Set #33B = 5.7”
7/[email protected] Test
Morning Pour S-N

Big Papio TrailSoil Properties - Sta 47+06
0
1
2
3
0 10 20 30 40 50 60 70 80 90 100 110
Qc, ksf - Water Content, % - Density, pcf
Dept
h, ft
Slope - Towards Creek (Lt)Condition - Open Crack
LegendLeftCenterRight


Big Papio Trail Subgrade Modulus vs. Condition
December 5, 2002
0
10
20
30
40
50
60
70
80
5900 6100 6300 6500 6700 6900 7100 7300 7500 7700 7900 8100
Station, feet
Subg
rade
mod
ulus
Measured Moduli
Avg Moduli
Condition
Pvmt. Thickness
6" design Thickness
Evap. Rate = low
% Uncracked = 84
(avg k = 50)
% Early Cracks = 0
% Later Cracks = 16
(Avg k = 37)
Condition
Replaced
Later Cracks
Sealed Cracks
Uncracked
Sloped Towards Creek
7/[email protected] 7/[email protected] Compaction Tests

Big Papio TrailAmbient Weather Cond., 8/1/02
0
10
20
30
40
50
60
70
80
90
100
0:00 6:00 12:00 18:00 0:00
Time
Degr
ees
f, %
, mph
TempRel HmdWind Spd
Avg. Temp = 82
Conc. Temp = 86
Avg. RH = 43%
Avg. Wind = 17mph Evap. Rate=0.32avg

Big Papio TrailSubgrade Modulus vs. Condition
August 1, 2002
0
10
20
30
40
50
60
70
80
8000 8100 8200 8300 8400 8500 8600 8700 8800 8900 9000
Station, feet
Subg
rade
mod
ulus Measured Moduli
Avg Moduli
Condition
Pvmt. Thickness
6" Design Thickness
Evap. Rate = 0.32
% Uncracked = 100
(avg k = 54)
% Early Cracks = 0
% Later Cracks = 0
Condition
Replaced
Later Cracks
Sealed Cracks
Uncracked
Sloped Towards Creek
Afternoon Pour S-N

Big Papio TrailAmbient Weather Cond., 8/7/02
0
10
20
30
40
50
60
70
80
90
100
0:00 6:00 12:00 18:00 0:00
Time
Degr
ees
f, %
, mph
TempRel HmdWind Spd
Avg. Temp = 85
Conc. Temp = 88
Avg. RH = 57%
Avg. Wind = 10mph
Evap. Rate=0.17avg

Big Papio TrailSubgrade Modulus vs. Condition
August 7, 2002
0
10
20
30
40
50
60
70
8900 9000 9100 9200 9300 9400 9500 9600
Station, feet
Subg
rade
mod
ulus Measured Moduli
Avg Moduli
Condition
Pvmt. Thickness
6" Design Thickness
Evap. Rate = 0.17
% Uncracked = 93
(avg k = 51)
% Early Cracks = 7
(avg k = 39)
% Later Cracks = 0
Sloped Towards Creek
Condition
Replaced
Later Cracks
Sealed Cracks
Uncracked
Core Set #44B = 6.45”
Afternoon Pour S-N

Big Papio TrailSoil Properties - Sta 94+20
0
1
2
3
0 10 20 30 40 50 60 70 80 90 100 110
Qc, ksf - Water Content, % - Density, pcf
Dept
h, ft
Slope - Away from Creek (Rt)Condition - No Crack
LegendLeftCenterRight


Big Papio TrailAmbient Weather Cond., 8/8/02
0
10
20
30
40
50
60
70
80
90
100
0:00 6:00 12:00 18:00 0:00
Time
Degr
ees
f, %
, mph
TempRel HmdWind Spd
Avg. Temp = 82
Conc. Temp = 90
Avg. RH = 39%
Avg. Wind = 10mphEvap. Rate=0.26avg

Big Papio TrailSubgrade Modulus vs. Condition
August 8, 2002
0
10
20
30
40
50
60
70
80
90
100
9500 9600 9700 9800 9900 10000 10100 10200 10300 10400 10500
Station, feet
Subg
rade
mod
ulus Measured Moduli
Avg Moduli
Condition
Pvmt. Thickness
6" Design Thickness
Evap. Rate = 0.26
% Uncracked = 71
(avg k = 60)
% Early Cracks = 29
(avg k = 41)
% Later Cracks = 0
ConditionReplacedLater CracksSealed CracksUncracked
Sloped Towards Creek
8/[email protected] Compaction Test
Afternoon Pour S-N

Big Papio TrailAmbient Weather Cond., 8/9/02
0
10
20
30
40
50
60
70
80
90
100
0:00 6:00 12:00 18:00 0:00
Time
Degr
ees
f, %
, mph
TempRel HmdWind Spd
Avg. Temp = 83
Conc. Temp = 87
Avg. RH = 41%
Avg. Wind = 10mph
Evap. Rate=0. 22avg

Big Papio Trail Subgrade Modulus vs. Condition
August 9, 2002
0
10
20
30
40
50
60
70
80
90
10400 10600 10800 11000 11200 11400 11600 11800 12000 12200 12400
Station, feet
Subg
rade
mod
ulus
Measured Moduli
Avg Moduli
Condition
Pvmt. Thickness
6" Design Thickness
Evap. Rate = 0.22
% Uncracked = 34
(avg k = 52)
% Early Cracks = 9
(avg k = 41)
% Later Cracks = 57
(avg k = 33)
ConditionReplacedLater CracksSealed CracksUncracked
Sloped Towards Creek Core Set #5
5B = 5.3”(5C=6”)
8/[email protected], 8/[email protected], 8/[email protected] 8/[email protected] Compaction Tests
Morning Pour S-N

Big Papio TrailSoil Properties - Sta 111+19
0
1
2
3
0 10 20 30 40 50 60 70 80 90 100 110
Qc, ksf - Water Content, % - Density, pcf
Dept
h, ft
Slope - Away from Creek (Rt)Condition - Open Crack
LegendLeftCenterRight


Big Papio TrailAmbient Weather Cond., 8/10/02
0
10
20
30
40
50
60
70
80
90
100
0:00 6:00 12:00 18:00 0:00
Time
Degr
ees
f, %
, mph
TempRel HmdWind Spd
Avg. Temp = 87
Conc. Temp = 86
Avg. RH = 49%
Avg. Wind = 5mph
Evap. Rate=0.10avg

Big Papio TrailSubgrade Modulus vs. Condition
August 10, 2002
0
10
20
30
40
50
60
70
80
12400 12500 12600 12700 12800 12900 13000 13100 13200 13300 13400 13500 13600 13700 13800
Station, feet
Subg
rade
mod
ulus
Measured Moduli
Avg ModuliCondition
Pvmt. Thickness6" Design Thickness
Evap. Rate = 0.10
% Uncracked = 44
(avg k = 50)
% Early Cracks = 16
(avg k = 32)
% Later Cracks = 40
(avg k = 33)
Condition
Replaced
Later Cracks
Sealed Cracks
Uncracked
Sloped Towards CreekCore Set #6
6B = 5.5”
Morning Pour S-N
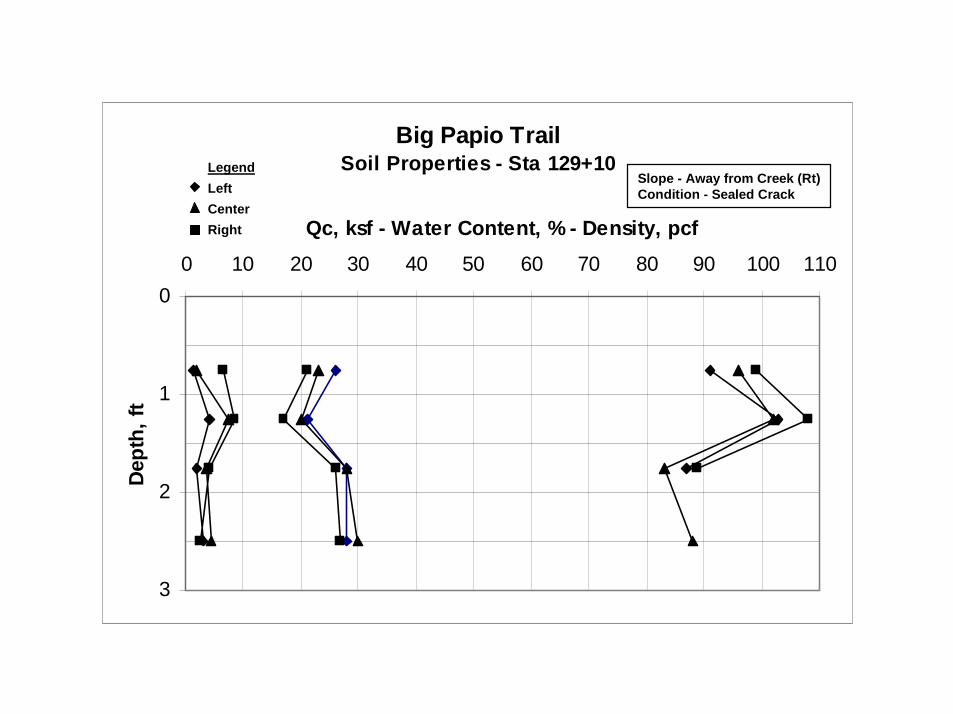
Big Papio TrailSoil Properties - Sta 129+10
0
1
2
3
0 10 20 30 40 50 60 70 80 90 100 110
Qc, ksf - Water Content, % - Density, pcf
Dept
h, ft
Slope - Away from Creek (Rt)Condition - Sealed Crack
LegendLeftCenterRight


Big Papio TrailAmbient Weather Cond., 8/29/02
0
10
20
30
40
50
60
70
80
90
100
0:00 6:00 12:00 18:00 0:00
Time
Degr
ees
f, %
, mph
TempRel HmdWind Spd
Avg. Temp = 80
Conc. Temp = 82
Avg. RH = 58%
Avg. Wind = 9mphEvap. Rate=0.13avg

Big Papio TrailSubgrade Modulus vs. Condition
August 29, 2002
0
10
20
30
40
50
60
70
80
15000 15100 15200 15300 15400 15500 15600 15700
Station, feet
Subg
rade
mod
ulus
measured moduli
Condition
Avg Moduli
Pvmt. Thickness
6" Design Thickness
Evap. Rate = 0.13
% Uncracked = 100
(avg k = 59)
% Early Cracks = 0
% Later Cracks = 0
Condition
Replaced
Later Cracks
Sealed Cracks
Uncracked
Morning Pour S-NCore Set #77B = 5.65”

Big Papio TrailSoil Properties - Sta 155+06
0
1
2
3
0 10 20 30 40 50 60 70 80 90 100 110
Qc, ksf - Water Content, % - Density, pcf
Dept
h, ft
Slope - Towards Creek (Lt)Condition - No Crack
LegendLeftCenterRight


Big Papio TrailAmbient Weather Cond., 8/30/02
0
10
20
30
40
50
60
70
80
90
100
0:00 6:00 12:00 18:00 0:00
Time
Degr
ees
f, %
, mph
TempRel HmdWind Spd
Avg. Temp = 80
Conc. Temp = 86
Avg. RH = 53%
Avg. Wind = 10mphEvap. Rate=0.19avg

Big Papio TrailSubgrade Modulus vs. Condition
August 30, 2002
0
10
20
30
40
50
60
70
80
90
100
15600 15850 16100 16350 16600 16850 17100 17350 17600 17850 18100 18350 18600 18850 19100
Station, feet
Subg
rade
mod
ulus measured moduli
Condition
Avg Moduli
Pvmt. Thickness
6" Design Thickness
ConditionReplacedLater CracksSealed CracksUncracked
Evap. Rate = 0.19
% Uncracked = 100
(avg k = 58)
% Early Cracks = 0
% Later Cracks = 0
8/[email protected] 8/[email protected] Compaction Tests
Morning Pour S-N

Big Papio TrailSubgrade Modulus vs. Condition
August 31, 2002
0
10
20
30
40
50
60
70
80
90
100
19100 19200 19300 19400 19500 19600 19700 19800 19900 20000 20100 20200
Station, feet
Subg
rade
mod
ulus
measured moduli
Condition
Avg Moduli
Pvmt. Thickness
6" Design Thickness
ConditionReplacedLater CracksSealed CracksUncracked
Evap. Rate = 0.32
% Uncracked = 100
(avg k = 58)
% Early Cracks = 0
% Later Cracks = 0
Morning Pour S-N

Big Papio Trail Pavement Distress
Pavement Condition Summary
Location Condition KM Summary Current Change0+00 to Ped Bridge Routed and Sealed (or rpl.) 714 775 +61?(2025’) Open Cracks 242 100 ?
Ped Bridge to Pacific Routed and Sealed (or rpl.) 0 0 0(7000’) Open Cracks 592 811 +219
Pacific to I-680 Routed and Sealed(or rpl.) 246 260 ~(1530’) Open Cracks 21 0 ~
I-680 to ACC Trail Routed and Sealed (or rpl.) 323 394 +62(3470’) Open Cracks 1169 1668 +499
North Bridge to Blondo Routed and Sealed 0 0 0Open Cracks 0 0 0
Approximately 2579’ of open crackApproximately 1429’ of sealed crack
Total = 4008’/14025’ = 29%

BIG PAPIO TRAILPetrographic Examination of Four Concrete Cores
Center to Blondo StreetsOmaha, Nebraska
Tom S. PattyConsultant/Petrographer
Final Report28 June 2004WJE No. 2004.2668
Prepared for:Terracon2221 South 156th CircleOmaha, Nebraska 68130
Prepared by:Wiss, Janney, Elstner Associates, Inc.13581 Pond Springs Road #107Austin, Texas 78729512.835.0940 tel | 512.835.6268 fax

BIG PAPIO TRAILPetrographic Examination of Four Concrete Cores
Center to Blondo StreetsOmaha, Nebraska
INTRODUCTION
At the request of Mr. Joe Waxse of Terracon located in Omaha, Nebraska, Wiss, Janney, ElstnerAssociates, Inc., (WJE) has performed petrographic studies for four concrete cores removed from theOmaha hike and bike facility known as Big Papio Trail. It is our understanding that the concrete for thefour-mile long hike and bike trail was placed during 2003, and soon after placement significantlongitudinal cracks developed in some areas. Some cracks have since been routed and sealed. Thepurpose of the studies was to assess the basic composition of the cores and characterize the cracks to aidin determining if properties of the mix contributed to the cracking. Accordingly, the cores, identified as 1-B, 3-B, 4-B, and 7-B, were examined using methods given in ASTM C856, Petrographic Examination ofHardened Concrete.
STUDIES
Sample Description
The four cores had diameters of 4 in. and lengths ranging from 5-7/8 in. to 6-3/8 in. Each core wasmarked with the Terracon Job No. 05035181 and identified with the following station numbers:
Core No. Station Number1-B 3123-B 47064-B 94207-B 15506
Cores 1-B and 3-B were drilled over cracks, and elastomeric joint filler was in the routed crack in Core 1-B (see Figure 1).
The top surfaces of the cores had received broom-texture finishes; however, the surface of Core 1-B hadbeen tine-grooved using diamond-blade equipment. The bottom surfaces of the cores showed thatplacement was on a granular-clay loam base material.
Mix Design
A mix design, marked as Lyman Richey and reportedly used on the “NRD Trail Project” from CenterStreet to Blondo Street, called for 513 lbs. cement, 51 lbs. fly ash, and 0.45 lb. /lb. water. The strengthrequirement was reported to be 4000 psi.

City Hike and Bike TrailPetrographic Examination of Four Concrete Cores
28 June 2004Page 2
Petrographic Examination
The concrete mix represented by all four cores contained a crushed limestone coarse aggregate having anominal top size of 3/4 in. The fine aggregate was natural siliceous sand. The aggregates appeared normalin gradation, distribution, and soundness.
The cementitious materials content (cement plus fly ash) was estimated at 5-1/2 to 6 bags per cubic yard.The fly ash component was estimated at 15 to 20 percent of the total cementitious materials. The opticaland textural features of the hydration products were consistent with concrete having a water-cementitiousmaterials ratio (w/cm) in the range of 0.45 to 0.50. Although consolidation appeared normal andadequate, entrapped air voids were present in all four cores.
Each of the cores was air-entrained with estimated air contents as follows:
Core No. Estimated Air (%)1-B 6 to 6-1/23-B 5-1/2 to 64-B 6 to 6-1/27B 5 to 5-1/2
Crack Features
The cracks observed in Core 1-B passed vertically through some of the coarse limestone aggregateparticles and several of the coarse particles in Core 3-B indicating that the slab had gained significantstrength before the cracking occurred. Indications of some water loss into the base material were slight,but a zone of darker paste adjacent to the bottom of Core 1-B was readily apparent. Dark zones at thebottoms of Cores 3-B, 4-B, and 7-B were less apparent (see Figures 2, 3, and 4).
CONCLUSIONS
The petrographic studies indicated that all four cores were consistent with the submitted mix design.Features of the mix did not indicate the cause of the cracking. Since the cracks are longitudinal andpassed through some of the coarse aggregate particles, the cause for the cracking may be related toenvironmental influences (soil mechanics) and/or loading by equipment using the trail as a roadway.
NOTE: Samples will be discarded after 90 days unless other disposition is requested. Charges will be made forstorage after that period.

City Hike and Bike TrailPetrographic Examination of Four Concrete Cores
28 June 2004Page 3
Figure 1. Scanned image of section through Core 1-B showingrouted crack with sealer and full-depth view of crack. Note thedarkened paste zone adjacent to the bottom, indicating water lossinto the base material while the mix was still plastic.

City Hike and Bike TrailPetrographic Examination of Four Concrete Cores
28 June 2004Page 4
Figure 2. Full-depth crack in Core 3-B. The cracks pass throughlimestone coarse aggregates and some of the siliceous graniticgravel particles.

City Hike and Bike TrailPetrographic Examination of Four Concrete Cores
28 June 2004Page 5
Figure 3. Scanned image of Core 4-B.

City Hike and Bike TrailPetrographic Examination of Four Concrete Cores
28 June 2004Page 6
Figure 4. Scanned image of Core 7-B.