pavement condition report - in.gov · pavement condition report, starke county airport 2 1.2.2...
TRANSCRIPT

Pavement Condition Report
Knox-Starke County Airport Project 1480370
Prepared for: Indiana Department of Transportation Office of Aviation 100 N. Senate Ave. Indianapolis, IN 46204 Indiana Department of Transportation Prepared by: Applied Research Associates, Inc. 6314 Odana Rd. Madison, WI 53719 (608) 274-6409 January 2014

Pavement Condition Report, Starke County Airport i
Executive Summary
Background
Since 1995, airports have been required to implement a pavement maintenance-management program to receive funding for any project constructed using Federal money. To assist individual airports in meeting this requirement and help improve airport pavement conditions statewide, the Indiana Department of Transportation, Office of Aviation contracted with Applied Research Associates, Inc. to provide pavement evaluation surveys at local airports. This report documents pavement condition at Starke County Airport in September 2013. A primary objective of the pavement management program is to determine maintenance and rehabilitation needs by comparing pavement condition to a standardized benchmark called the minimum service level (MSL), defined as the minimum pavement condition acceptable in managing Indiana’s airfield pavements. The benchmark MSL values used to trigger rehabilitation are shown below.
Runway Taxiway Apron
60 55 55
Pavement Condition
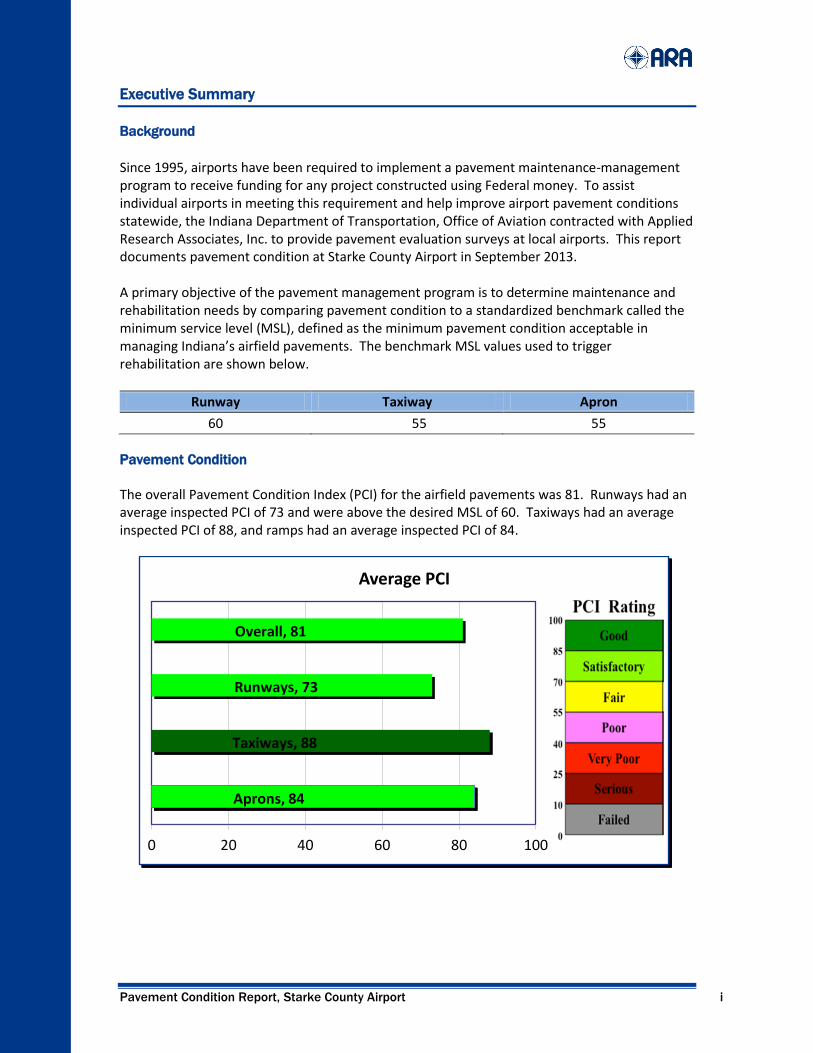
The overall Pavement Condition Index (PCI) for the airfield pavements was 81. Runways had an average inspected PCI of 73 and were above the desired MSL of 60. Taxiways had an average inspected PCI of 88, and ramps had an average inspected PCI of 84.
Aprons, 84
Taxiways, 88
Runways, 73
Overall, 81
0 20 40 60 80 100
Average PCI
Pavement Condition Report, Anderson Municipal Airport ii
Capital Improvement Program
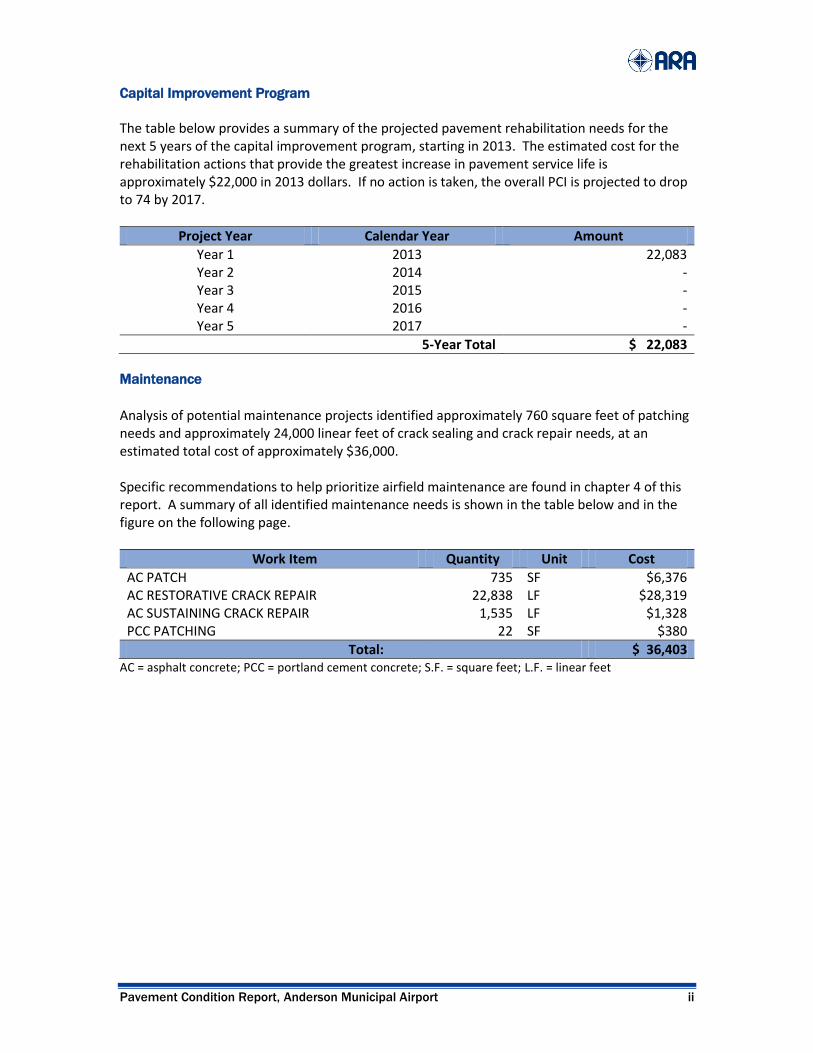
The table below provides a summary of the projected pavement rehabilitation needs for the next 5 years of the capital improvement program, starting in 2013. The estimated cost for the rehabilitation actions that provide the greatest increase in pavement service life is approximately $22,000 in 2013 dollars. If no action is taken, the overall PCI is projected to drop to 74 by 2017.
Project Year Calendar Year Amount
Year 1 2013 22,083 Year 2 2014 - Year 3 2015 - Year 4 2016 - Year 5 2017 -
5-Year Total $ 22,083
Maintenance
Analysis of potential maintenance projects identified approximately 760 square feet of patching needs and approximately 24,000 linear feet of crack sealing and crack repair needs, at an estimated total cost of approximately $36,000. Specific recommendations to help prioritize airfield maintenance are found in chapter 4 of this report. A summary of all identified maintenance needs is shown in the table below and in the figure on the following page.
Work Item Quantity Unit Cost
AC PATCH 735 SF $6,376 AC RESTORATIVE CRACK REPAIR 22,838 LF $28,319 AC SUSTAINING CRACK REPAIR 1,535 LF $1,328 PCC PATCHING 22 SF $380
Total: $ 36,403 AC = asphalt concrete; PCC = portland cement concrete; S.F. = square feet; L.F. = linear feet

Pavement Condition Report, Starke County Airport iii
2013 PCI Inspection
0 200 400 600
STARKE COUNTY AIRPORT
4005
4010
3005
3010
105
125
120
115
2005
6005
6010
2010
3015
130
A2
A3
A4
A5
A6
Ru
nw
ay 1
8-3
6
Pavement Condition Report, Anderson Municipal Airport iv
Table of Contents
1. Introduction ............................................................................................................................... 1
1.1 Objective and Scope ........................................................................................................................ 1 1.2 Description of Tasks Performed....................................................................................................... 1
2. Pavement Condition Evaluation ................................................................................................. 7
2.1 Overview .......................................................................................................................................... 7 2.2 Distress Types and Frequency ....................................................................................................... 11 2.3 PCI Summary .................................................................................................................................. 12 2.4 Analysis Commentary .................................................................................................................... 12
3. Capital Improvement Program ................................................................................................ 15
3.1 Analysis .......................................................................................................................................... 15 3.2 Cost Estimates ............................................................................................................................... 15 3.3 Capital Improvement Strategies .................................................................................................... 21
4. Maintenance Management Program ....................................................................................... 23
4.1 General Comments ........................................................................................................................ 23 4.2 Recommended Maintenance Actions............................................................................................ 23 4.3 Pavement Deterioration ................................................................................................................ 27 4.4 Best Practices ................................................................................................................................. 30 4.5 Pavement Repair Materials ........................................................................................................... 33 4.6 Pavement Repair Equipment ......................................................................................................... 33
Appendix A. AIRPAV Software .................................................................................................... 35
Appendix B. Feature Analysis ..................................................................................................... 37
Appendix C. General Maintenance Techniques ......................................................................... 71
Appendix D. PCI Summary .......................................................................................................... 79
Appendix E. Distress Identification ............................................................................................ 83
Appendix F. Airport Responsibilities .......................................................................................... 91

Pavement Condition Report, Starke County Airport v
Table of Figures
Figure 1-1. Pavement Numbering System ...................................................................................... 3 Figure 1-2. PCI Value and Descriptive Rating ................................................................................. 4 Figure 2-1. Inspected Pavement Condition .................................................................................... 8 Figure 2-2. Pavement Condition by Branch Use ............................................................................. 9 Figure 2-3. Good AC Taxiway Pavement (Feature 130) .................................................................. 9 Figure 2-4. Good PCC Ramp Pavement (Feature 3005) ............................................................... 10 Figure 2-5. Good AC Runway Pavement with Weathering (Feature 6005) .................................. 10 Figure 3-1. Programmed CIP ......................................................................................................... 21 Figure 4-1. Recommended Maintenance ..................................................................................... 26 Table of Tables
Table 1-1. Minimum Service Levels ................................................................................................ 1 Table 1-2. Inspection Density ......................................................................................................... 3 Table 2-1. Definition and Distribution of PCI Ratings ..................................................................... 7 Table 2-2. Distress Frequency in AC Pavement ............................................................................ 11 Table 2-3. Distress Frequency in PCC Pavement .......................................................................... 11 Table 2-4. PCI Results ................................................................................................................... 12 Table 2-5. Runway Condition Distribution ................................................................................... 12 Table 2-6. Taxiway Condition Distribution ................................................................................... 13 Table 2-7. Apron Condition Distribution ...................................................................................... 13 Table 3-1. Unit Costs ..................................................................................................................... 16 Table 3-2. Most Comprehensive Repair ....................................................................................... 21 Table 3-3. Lowest Annual Cost Repair .......................................................................................... 22 Table 3-4. All Viable Options ........................................................................................................ 22 Table 4-1. Recommend Maintenance Actions ............................................................................. 23 Table 4-2. Recommend AC Patching ............................................................................................ 24 Table 4-3. Recommend PCC Patching........................................................................................... 24 Table 4-4. Recommend AC Restorative Crack Repair ................................................................... 25 Table 4-5. Recommend AC Sustaining Crack Repair ..................................................................... 25 Table 4-6. General Maintenance Policy (AC) ................................................................................ 31 Table 4-7. General Maintenance Policy (PCC) .............................................................................. 32
Pavement Condition Report, Anderson Municipal Airport vi
GLOSSARY OF ABBREVIATIONS
AC - asphalt concrete
ACC - asphalt overlay on existing asphalt
APC - asphalt overlay on existing concrete
APMS - airport pavement management system
ARA - Applied Research Associates, Inc.
CADD - computer-aided design and drafting
CIP - capital improvement program
FAA - Federal Aviation Administration
FOD - foreign object damage
GIS - geographic information system
INDOT - Indiana Department of Transportation
L&T - longitudinal and transverse
LTD - longitudinal, transverse, and diagonal
M&R - maintenance and rehabilitation
MSL - minimum service level
PCC - portland cement concrete
PCI - Pavement Condition Index
PCN - Pavement Classification Number
PDF - portable electronic document

Pavement Condition Report, Starke County Airport 1
1. Introduction
1.1 Objective and Scope
The Indiana Department of Transportation, Office of Aviation (INDOT) retained Applied Research Associates, Inc., (ARA) to provide airfield pavement inspection, pavement evaluation, and pavement management services for Indiana’s statewide network of airfield pavements. The pavement evaluations documented in this report were performed under purchase order number 14803170. A primary objective of INDOT’s ongoing pavement evaluation and management program is to determine maintenance and rehabilitation (M&R) needs by comparing the Pavement Condition Index (PCI) to a standardized benchmark called the minimum service level (MSL). The MSL is defined as the minimum pavement condition acceptable in managing INDOT’s airside pavement. The benchmark MSL values used to trigger rehabilitation vary by airport classification and are shown in Table 1-1.
Table 1-1. Minimum Service Levels
Facility Primary Commercial
Service Large GA
> 3600’Rwy Large GA
< 3600’Rwy
Runway 70 65 60 55
Taxiway 65 60 55 50
Apron 65 60 55 50
Additional goals of this project were to implement a software program to manage the pavement network, develop performance curves based on historical rates of pavement deterioration, forecast future pavement conditions, identify and recommend specific M&R actions to address the root cause of the documented pavement distress, and estimate the cost and ideal timing of the recommend M&R. The following tasks were performed in support of the project goals:
Review record documents
Define the pavement network
Conduct an airfield condition survey
Update the AIRPAV database & software
Develop a 5-year airfield M&R work plan
Report findings to INDOT 1.2 Description of Tasks Performed
1.2.1 Records Review
A detailed records review was performed to determine the airport’s construction history and the as-built cross section for each pavement feature. Plan sets for recent projects were provided to ARA in computer-aided design and drafting (CADD) format. Older plans sets were provided as hard copies or in portable electronic document (PDF) format.
Pavement Condition Report, Starke County Airport 2
1.2.2 Define Pavement Network
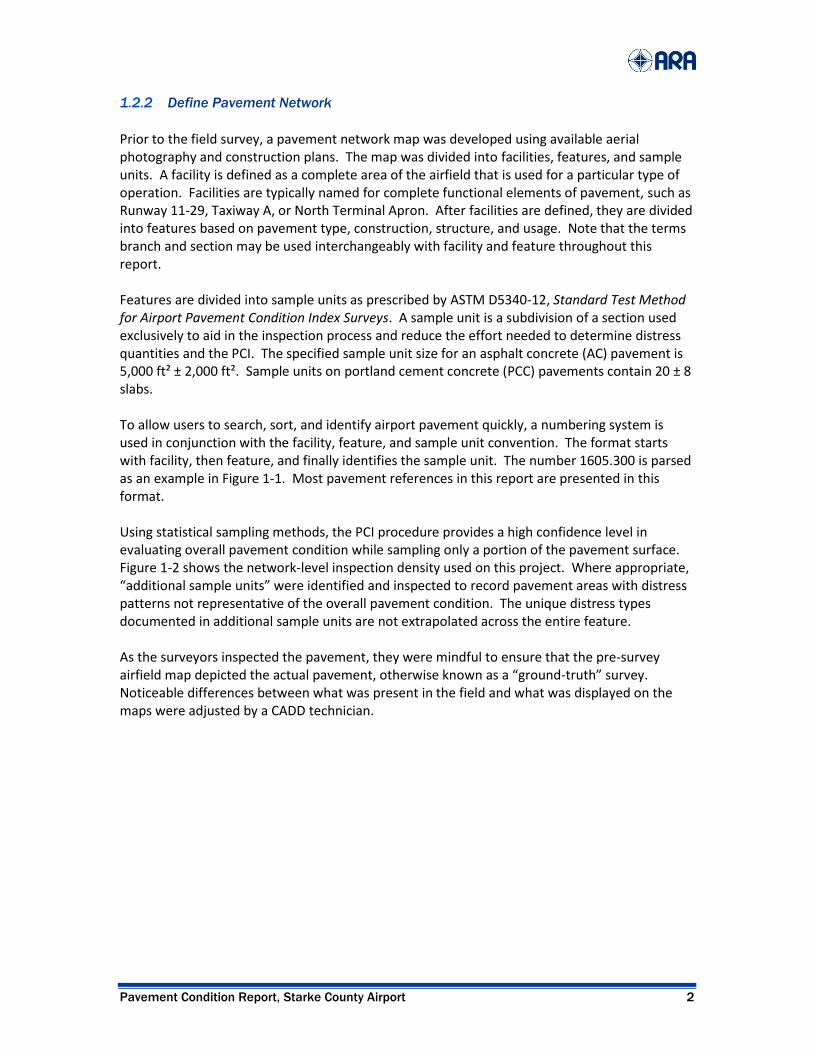
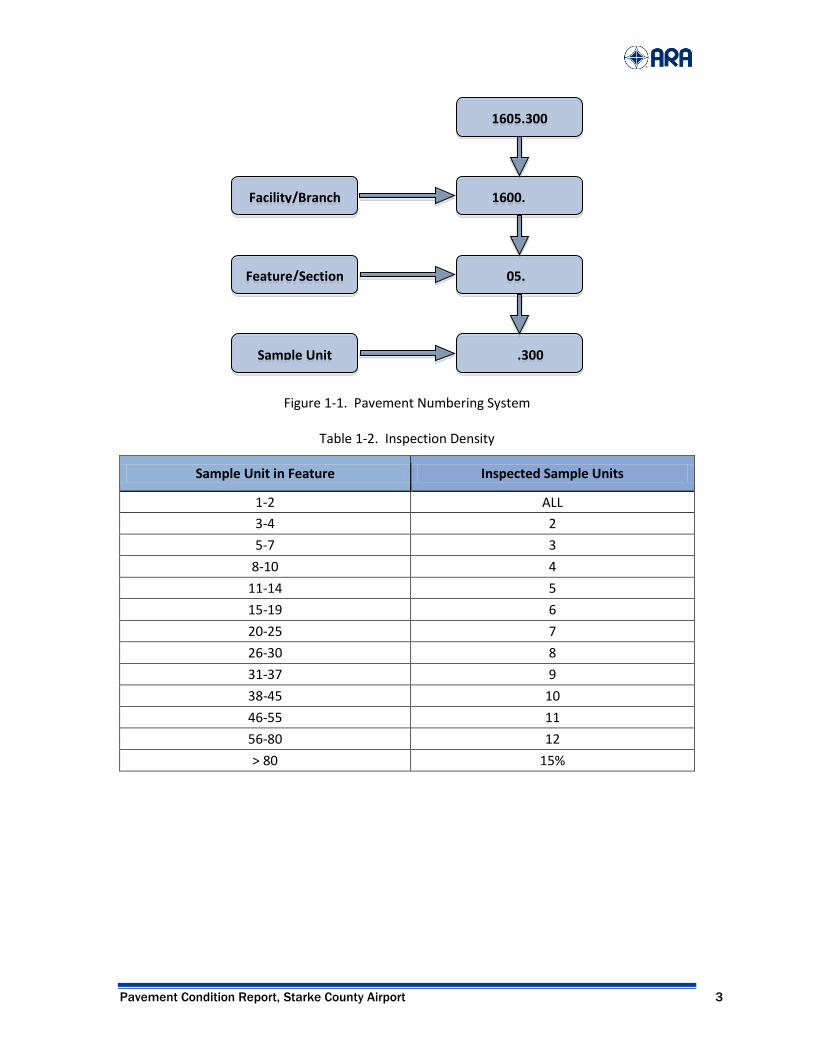
Prior to the field survey, a pavement network map was developed using available aerial photography and construction plans. The map was divided into facilities, features, and sample units. A facility is defined as a complete area of the airfield that is used for a particular type of operation. Facilities are typically named for complete functional elements of pavement, such as Runway 11-29, Taxiway A, or North Terminal Apron. After facilities are defined, they are divided into features based on pavement type, construction, structure, and usage. Note that the terms branch and section may be used interchangeably with facility and feature throughout this report. Features are divided into sample units as prescribed by ASTM D5340-12, Standard Test Method for Airport Pavement Condition Index Surveys. A sample unit is a subdivision of a section used exclusively to aid in the inspection process and reduce the effort needed to determine distress quantities and the PCI. The specified sample unit size for an asphalt concrete (AC) pavement is 5,000 ft² ± 2,000 ft². Sample units on portland cement concrete (PCC) pavements contain 20 ± 8 slabs. To allow users to search, sort, and identify airport pavement quickly, a numbering system is used in conjunction with the facility, feature, and sample unit convention. The format starts with facility, then feature, and finally identifies the sample unit. The number 1605.300 is parsed as an example in Figure 1-1. Most pavement references in this report are presented in this format. Using statistical sampling methods, the PCI procedure provides a high confidence level in evaluating overall pavement condition while sampling only a portion of the pavement surface. Figure 1-2 shows the network-level inspection density used on this project. Where appropriate, “additional sample units” were identified and inspected to record pavement areas with distress patterns not representative of the overall pavement condition. The unique distress types documented in additional sample units are not extrapolated across the entire feature. As the surveyors inspected the pavement, they were mindful to ensure that the pre-survey airfield map depicted the actual pavement, otherwise known as a “ground-truth” survey. Noticeable differences between what was present in the field and what was displayed on the maps were adjusted by a CADD technician.
Pavement Condition Report, Starke County Airport 3
Figure 1-1. Pavement Numbering System
Table 1-2. Inspection Density
Sample Unit in Feature Inspected Sample Units
1-2 ALL
3-4 2
5-7 3
8-10 4
11-14 5
15-19 6
20-25 7
26-30 8
31-37 9
38-45 10
46-55 11
56-80 12
> 80 15%
1605.300
___.300
__05.___
1600.___ Facility/Branch
Feature/Section
Sample Unit
Pavement Condition Report, Starke County Airport 4
1.2.3 Conduct Airfield Condition Survey
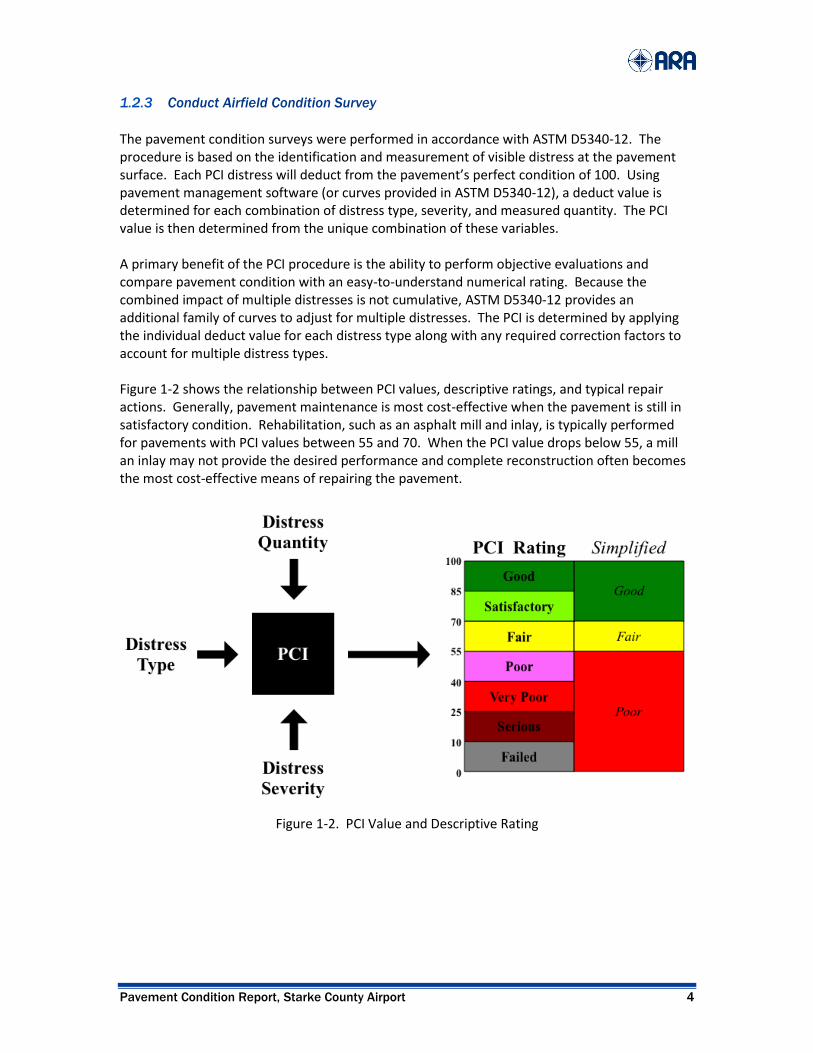
The pavement condition surveys were performed in accordance with ASTM D5340-12. The procedure is based on the identification and measurement of visible distress at the pavement surface. Each PCI distress will deduct from the pavement’s perfect condition of 100. Using pavement management software (or curves provided in ASTM D5340-12), a deduct value is determined for each combination of distress type, severity, and measured quantity. The PCI value is then determined from the unique combination of these variables. A primary benefit of the PCI procedure is the ability to perform objective evaluations and compare pavement condition with an easy-to-understand numerical rating. Because the combined impact of multiple distresses is not cumulative, ASTM D5340-12 provides an additional family of curves to adjust for multiple distresses. The PCI is determined by applying the individual deduct value for each distress type along with any required correction factors to account for multiple distress types. Figure 1-2 shows the relationship between PCI values, descriptive ratings, and typical repair actions. Generally, pavement maintenance is most cost-effective when the pavement is still in satisfactory condition. Rehabilitation, such as an asphalt mill and inlay, is typically performed for pavements with PCI values between 55 and 70. When the PCI value drops below 55, a mill an inlay may not provide the desired performance and complete reconstruction often becomes the most cost-effective means of repairing the pavement.
Figure 1-2. PCI Value and Descriptive Rating
Pavement Condition Report, Starke County Airport 5
1.2.4 Update AIRPAV Database & Software
The network definition, construction history, and data from the survey were entered into the AIRPAV pavement management system (APMS) software. After all data were entered, family curves were developed to model the change in pavement condition over time. These family curves are used to estimate future pavement condition. Typically, several curves are developed, with separate curves defined for different pavement surface types, such as AC, PCC, asphalt overlay on existing asphalt (ACC), and asphalt overlay on existing concrete (APC). The latest version of AIRPAV containing all survey data, deterioration curves, M&R policies, budgets, and construction history, was provided to INDOT on CD-ROM. 1.2.5 Develop 5-Year Airfield M&R Work Plans
A 5-year capital improvement program (CIP) was developed showing the year that each pavement feature was expected to fall below the MSL. The 5-year plan detailed in chapter 3 shows rehabilitation alternatives for each feature based on the PCI and the individual distress types observed during the pavement evaluation. The timing of each project is shown as the year that the PCI falls below the MSL and does not consider other important factors. Using reports like this for each airport in the State, INDOT engineers and planners develop a final 5-year statewide CIP plan that balances the sometimes conflicting priorities of pavement condition, operational constraints, construction staging considerations, and available funding. 1.2.6 Report Finding to INDOT
This report includes background information, PCI results and recommendations, and M&R budget scenarios. Photographs depicting typical pavement conditions observed during the survey are included in chapter 2. Appendix A contains general information about the AIRPAV pavement management software. Appendix B provides an analysis of each pavement section based on recorded distress. Appendix C contains a summary of general maintenance techniques and best practices. Appendix D provides a detailed summary of the airfield pavement condition. Appendix E describes common airfield distress types, and Appendix F contains exhibits to help the airport owner manage the airfield pavement system.

Pavement Condition Report, Starke County Airport 6
Pavement Condition Report, Starke County Airport 7
2. Pavement Condition Evaluation
2.1 Overview
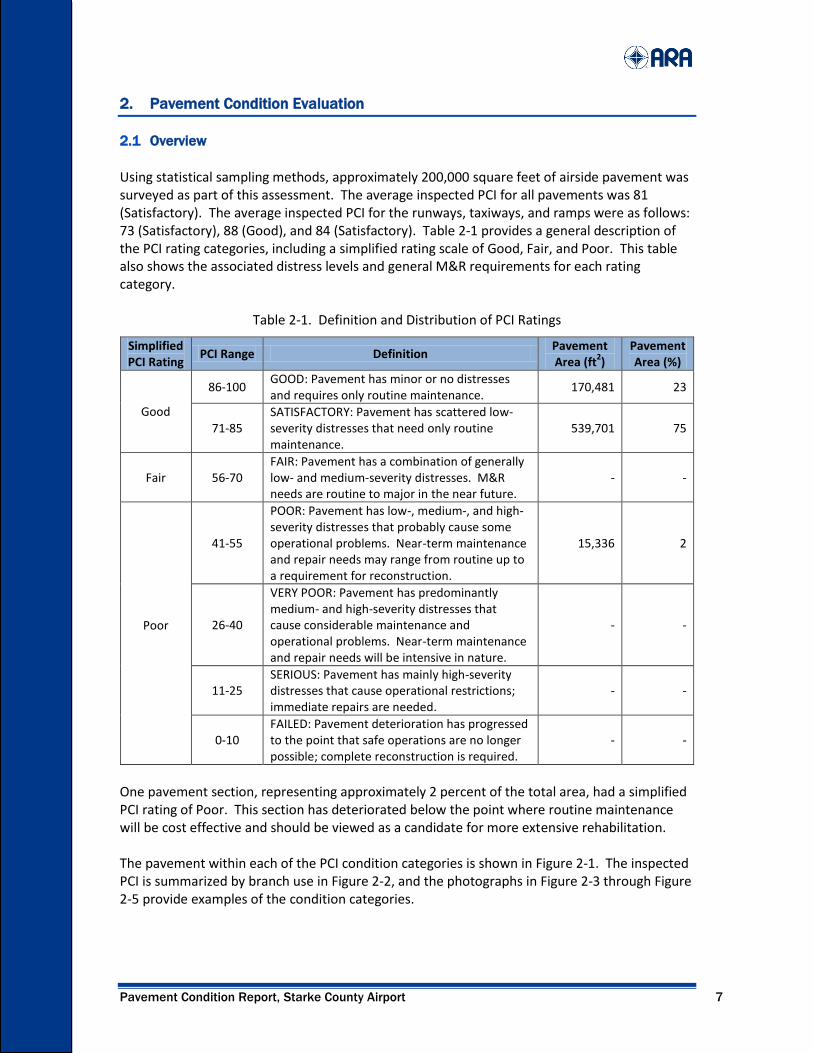
Using statistical sampling methods, approximately 200,000 square feet of airside pavement was surveyed as part of this assessment. The average inspected PCI for all pavements was 81 (Satisfactory). The average inspected PCI for the runways, taxiways, and ramps were as follows: 73 (Satisfactory), 88 (Good), and 84 (Satisfactory). Table 2-1 provides a general description of the PCI rating categories, including a simplified rating scale of Good, Fair, and Poor. This table also shows the associated distress levels and general M&R requirements for each rating category.
Table 2-1. Definition and Distribution of PCI Ratings
Simplified PCI Rating
PCI Range Definition Pavement Area (ft
2)
Pavement Area (%)
Good
86-100 GOOD: Pavement has minor or no distresses and requires only routine maintenance.
170,481 23
71-85 SATISFACTORY: Pavement has scattered low-severity distresses that need only routine maintenance.
539,701 75
Fair 56-70 FAIR: Pavement has a combination of generally low- and medium-severity distresses. M&R needs are routine to major in the near future.
- -
Poor
41-55
POOR: Pavement has low-, medium-, and high-severity distresses that probably cause some operational problems. Near-term maintenance and repair needs may range from routine up to a requirement for reconstruction.
15,336 2
26-40
VERY POOR: Pavement has predominantly medium- and high-severity distresses that cause considerable maintenance and operational problems. Near-term maintenance and repair needs will be intensive in nature.
- -
11-25 SERIOUS: Pavement has mainly high-severity distresses that cause operational restrictions; immediate repairs are needed.
- -
0-10 FAILED: Pavement deterioration has progressed to the point that safe operations are no longer possible; complete reconstruction is required.
- -
One pavement section, representing approximately 2 percent of the total area, had a simplified PCI rating of Poor. This section has deteriorated below the point where routine maintenance will be cost effective and should be viewed as a candidate for more extensive rehabilitation. The pavement within each of the PCI condition categories is shown in Figure 2-1. The inspected PCI is summarized by branch use in Figure 2-2, and the photographs in Figure 2-3 through Figure 2-5 provide examples of the condition categories.

Pavement Condition Report, Starke County Airport 8
2013 PCI Inspection
0 200 400 600
STARKE COUNTY AIRPORT
4005
4010
3005
3010
105
125
120
115
2005
6005
6010
2010
3015
130
A2
A3
A4
A5
A6
Ru
nw
ay 1
8-3
6
Figure 2-1. Inspected Pavement Condition
Pavement Condition Report, Starke County Airport 9
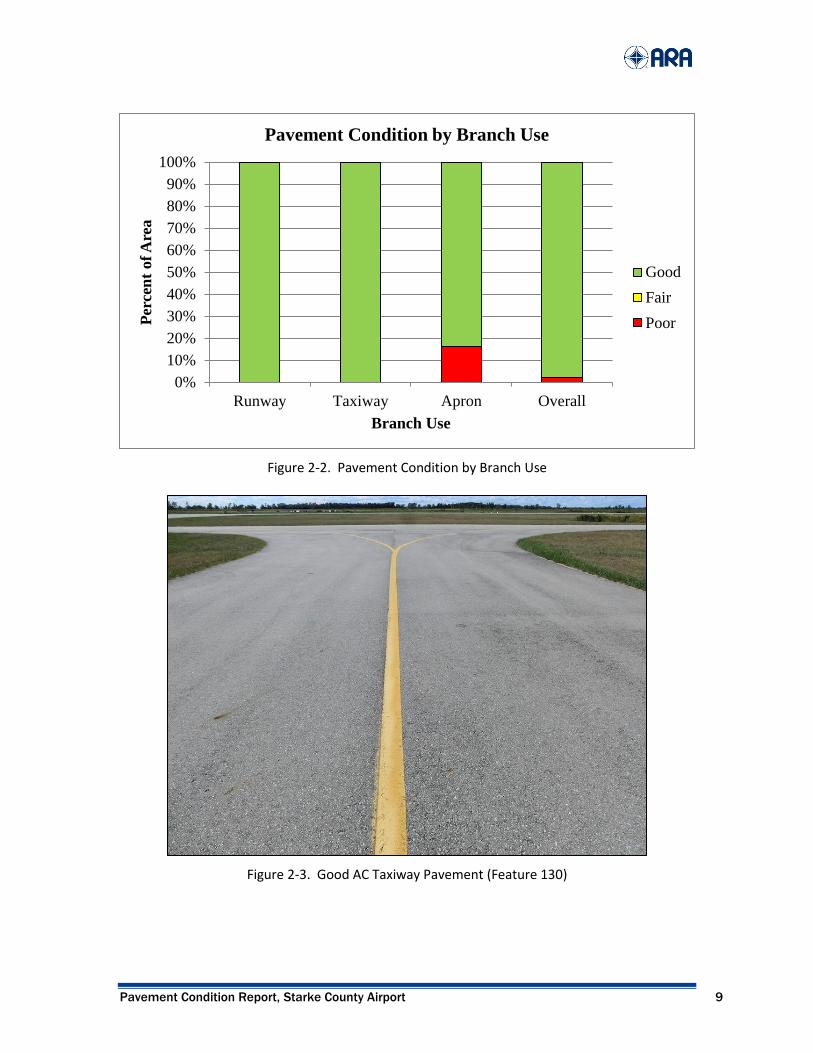
Figure 2-2. Pavement Condition by Branch Use
Figure 2-3. Good AC Taxiway Pavement (Feature 130)
0%
10%
20%
30%
40%
50%
60%
70%
80%
90%
100%
Runway Taxiway Apron Overall
Per
cen
t of
Are
a
Branch Use
Pavement Condition by Branch Use
Good
Fair
Poor

Pavement Condition Report, Starke County Airport 10
Figure 2-4. Good PCC Ramp Pavement (Feature 3005)
Figure 2-5. Good AC Runway Pavement with Weathering (Feature 6005)

Pavement Condition Report, Starke County Airport 11
2.2 Distress Types and Frequency
The inspectors surveyed approximately 180,000 ft2 of AC pavement. The frequency of each distress type is shown in Table 2-2. The most common distress types were longitudinal and transverse (L&T) cracking, patching, and weathering.
Table 2-2. Distress Frequency in AC Pavement
Distress Sample Units % Inspected Sample Units
L&T CRACKING 45 90
PATCHING 5 10
WEATHERING 5 10
ALLIGATOR CRACKING 4 8
RAVELING 3 6
DEPRESSIONS 2 4
BLEEDING 1 2
RUTTING 1 2
The inspectors surveyed approximately 28,000 ft2 of PCC pavement. The frequency of each distress type is shown in Table 2-3. The most common distress types were shrinkage cracks, LTD cracks, and spalls.
Table 2-3. Distress Frequency in PCC Pavement
Distress Sample Units
% Inspected Sample Units
Slabs % Inspected
Slabs
SHRINKAGE CRACKS 2 29 4 3
LONG/TRANS/DIAG CRACKS 2 29 3 2
CORNER SPALLING 2 29 2 1
JOINT SPALLING 1 14 1 1

Pavement Condition Report, Starke County Airport 12
2.3 PCI Summary
The branch and section PCI values are shown below, along with the surface type, area, and last year construction occurred.
Table 2-4. PCI Results
Branch ID Branch PCI Section Surface Area (sf) Built 2010 PCI 2013 PCI
100
86
105 AC 184,382 2006 91 84
115 AC 11,960 2006 99 96
120 AC 12,107 2006 100 96
125 AC 12,295 2006 89 93
130 AC 9,159 2009 100 97
2000
95
2005 AC 39,283 2006 98 94
2010 AC 26,923 2009 100 99
3000
94
3005 PCC 47,688 2006 97 96
3010 AC 14,124 2006 91 81
3015 PCC 11,066 2009 100 99
4000
51
4005 AC 15,336 1995 51 42
4010 AC/AC 7,045 1995 82 71
6000
73
6005 AC 30,337 1995 79 73
6010 AC/AC 303,813 1995 81 73
2.4 Analysis Commentary
The following pages provide a brief overview of the 2013 inspected pavement conditions for each facility. Comments are based primarily on the AIRPAV analysis but also include field notes and remarks from the pavement condition inspectors. Where appropriate, individual pavement sections are referenced within the larger facility. Feature 125 had a 4 point PCI increase since the last inspection due to maintenance (patching of prior alligator cracking). Feature 3010 had a 10 point PCI drop since the last inspection due largely to the development of medium severity L&T cracking. Feature 4010 had an 11 point PCI drop since the last inspection due largely to the development of high severity L&T cracking. 2.4.1 Runways
Runway 18--36 consisted of 2 sections of AC or AAC pavement. The runway had a total area of 334,150 ft² with an average inspected PCI of 73 (Good). The distribution of pavement area and sections by PCI range are shown in Table 2-5.
Table 2-5. Runway Condition Distribution
PCI Range Rating Number of Sections Pavement Area (ft²) Pavement Area (%)
100-71 Good 2 334,150 100
70-56 Fair - - -
55-0 Poor - - -
Pavement Condition Report, Starke County Airport 13
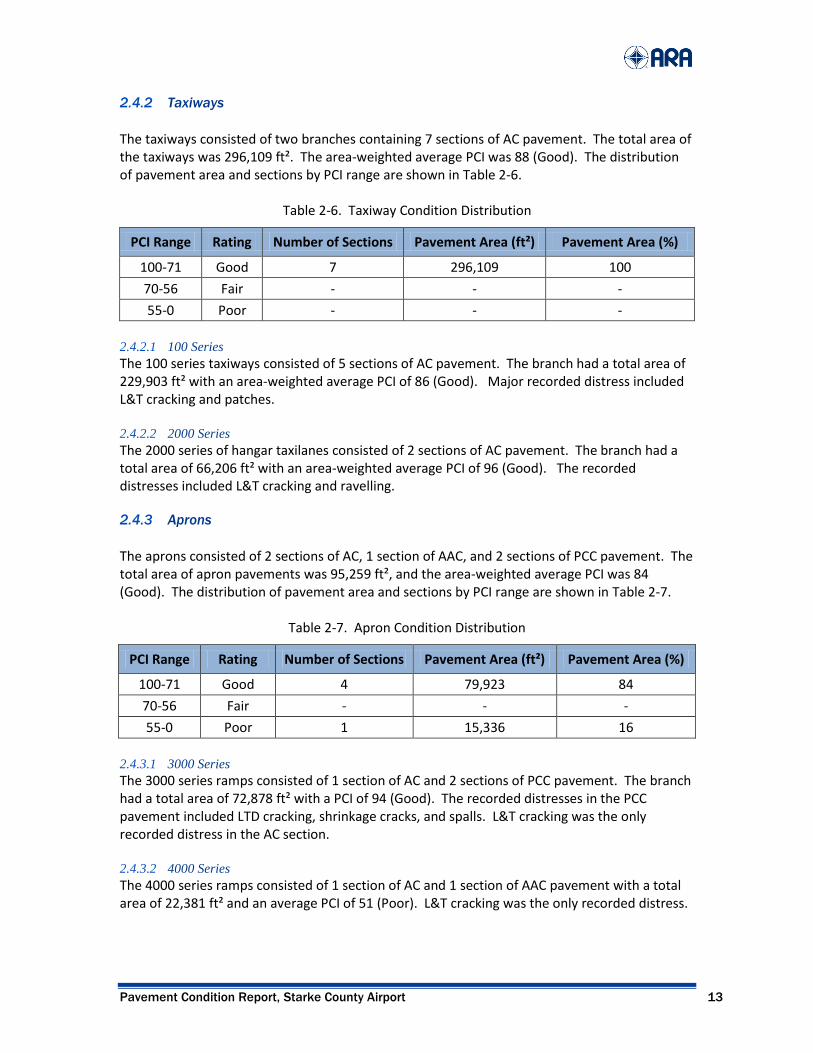
2.4.2 Taxiways
The taxiways consisted of two branches containing 7 sections of AC pavement. The total area of the taxiways was 296,109 ft². The area-weighted average PCI was 88 (Good). The distribution of pavement area and sections by PCI range are shown in Table 2-6.
Table 2-6. Taxiway Condition Distribution
PCI Range Rating Number of Sections Pavement Area (ft²) Pavement Area (%)
100-71 Good 7 296,109 100
70-56 Fair - - -
55-0 Poor - - -
2.4.2.1 100 Series
The 100 series taxiways consisted of 5 sections of AC pavement. The branch had a total area of 229,903 ft² with an area-weighted average PCI of 86 (Good). Major recorded distress included L&T cracking and patches. 2.4.2.2 2000 Series
The 2000 series of hangar taxilanes consisted of 2 sections of AC pavement. The branch had a total area of 66,206 ft² with an area-weighted average PCI of 96 (Good). The recorded distresses included L&T cracking and ravelling. 2.4.3 Aprons
The aprons consisted of 2 sections of AC, 1 section of AAC, and 2 sections of PCC pavement. The total area of apron pavements was 95,259 ft², and the area-weighted average PCI was 84 (Good). The distribution of pavement area and sections by PCI range are shown in Table 2-7.
Table 2-7. Apron Condition Distribution
PCI Range Rating Number of Sections Pavement Area (ft²) Pavement Area (%)
100-71 Good 4 79,923 84
70-56 Fair - - -
55-0 Poor 1 15,336 16
2.4.3.1 3000 Series
The 3000 series ramps consisted of 1 section of AC and 2 sections of PCC pavement. The branch had a total area of 72,878 ft² with a PCI of 94 (Good). The recorded distresses in the PCC pavement included LTD cracking, shrinkage cracks, and spalls. L&T cracking was the only recorded distress in the AC section. 2.4.3.2 4000 Series
The 4000 series ramps consisted of 1 section of AC and 1 section of AAC pavement with a total area of 22,381 ft² and an average PCI of 51 (Poor). L&T cracking was the only recorded distress.

Pavement Condition Report, Starke County Airport 14

Pavement Condition Report, Starke County Airport 15
3. Capital Improvement Program
3.1 Analysis
The individual feature analyses shown in appendix B document viable rehabilitation projects that address the causes of each pavement section failure while restoring the pavement to a condition above the desired MSL. The recommended timing of each improvement action is defined as the year that the pavement condition is projected to reach the MSL. By establishing benchmark MSL targets, it is possible to plan objectively for future needs against a standard set of performance criteria. This section categorizes the identified viable options into CIP strategies based on cost and expected service life. The airport may find it desirable to adjust the timing of projects detailed in the CIP to meet fiscal and operational constraints. For example, if different sections of a runway were projected to reach the MSL in various years ranging from 2013 to 2015, it is not operationally feasible to stage rehabilitation over a 3-year period. Instead, runway rehabilitation would be programmed in a manner that balanced the need to minimize the length of the runway closure while maximizing the remaining service life. 3.2 Cost Estimates
Project costs were estimated based on the pavement area and the unit costs shown in Table 3-1 for specific M&R activities. Project costs are presented so planners and managers can compare the relative magnitude of funding required for various alternatives. The two-page AIRPAV feature analysis (see appendix B) provides cost estimates for each identified project. These cost estimates are for planning purposes only and do not constitute an engineering estimate. Furthermore, these costs estimates represent the improvement of existing pavement structures and associated incidental work only. Other potential project line items, such as lighting, navigational aids, and drainage modifications are not included, and estimates for those items must be developed separately and incorporated into an overall project cost. Typical examples of work that might be included in alternatives evaluated by AIRPAV are outlined on the following pages. These example projects would meet the requirements for each selected option; however, the descriptions are not intended to imply required, or even preferred, design configurations. Rehabilitation decisions, such as overlay thickness design, should be made in conjunction with engineering design analysis.

Pavement Condition Report, Starke County Airport 16
Table 3-1. Unit Costs
Rigid Pavement (PCC)
Reconstruction $12.90 /sf
Slab Replacement & Full Depth Patching $12.48 /sf
Patching (Partial Depth) $16.70 /sf
Slab Repair & Overlay $4.69 /sf + $0.41 /sf/in > 4”
Joint Seal Replacement $2.24 /lf
Joint Seal Repair $0.87 /lf
Undersealing $4.16 /sf
Flexible Pavement (AC)
Reconstruction $5.36 /sf
Resurfacing $1.44 /sf
Structural Overlay $2.25 /sf + $0.41 /sf/in > 4”
Surface Treatment $0.39 /sf
Patching $9.78 /lf
Crack Repair (Restorative) $1.24 /lf
Crack Repair (Sustaining) $0.85 /lf
3.2.1 Rigid Pavement Work Descriptions
The following descriptions provide additional information about the typical work items covered by the unit costs shown in Table 3-1. 3.2.1.1 Reconstruction
Reconstruction is recommended when the pavement defects would not be corrected by less extensive measures. Unit prices assume removal of the existing pavement to the subgrade and reconstruction with 8 inches of high strength PCC pavement on 6 inches of aggregate subbase. 3.2.1.2 Repair and Overlay
This procedure usually consists of a crack and seat process, where the existing pavement is broken into segments of approximately 2 ft on a side by dropping a heavy breaker bar onto the pavement. Properly done, aggregate interlock between pavement segments is retained and reflective cracking is reduced. A flexible surface is then placed over the recycled PCC base.

Pavement Condition Report, Starke County Airport 17
3.2.1.3 Slab Replacement
Slab replacements are typically required for high-severity blow ups, scaling, and shattered slabs. Unit prices assume removal of the selected slab to the subgrade. Prepare subgrade to bearing strength equivalent to surrounding subgrade. Provide subbase support equivalent to existing and install load transfer steel as required. Place PCC pavement level with existing surface. 3.2.1.4 Patching (Partial Depth)
While partial depth patching is most commonly used to repair joint and corner spalls, it is effective for a wide variety of distress types. Saw cut and remove area of pavement to sound concrete above reinforcing steel. Treat existing concrete to ensure firm bond. Place PCC level with existing surface. 3.2.1.5 Joint Seal Replacement
Rout joints and cracks to a depth of at least 1-1/4 inches, clean joint wall surfaces to expose fresh vital concrete, install backing rope, and apply rubberized sealant meeting ASTM D3405 specification, or equivalent. 3.2.1.6 Joint Seal Repair
Press existing sealant into joint for use as backer material; apply joint sealant meeting ASTM D3405 specification, or equivalent. 3.2.1.7 Undersealing
Undersealing is used to repair faulting between slabs or when corner breaks have settled relative to the slab. High-pressure injection is used to force material into the underlying voids and continues until the settled pavement is restored to its original elevation. Several materials have been used for undersealing, including cement grout, asphalt slurries, and proprietary formulations of expansive Styrofoam.

Pavement Condition Report, Starke County Airport 18
3.2.2 Flexible Pavement Work Descriptions
3.2.2.1 Reconstruction
Reconstruction is recommended when the pavement defects would not be corrected by less extensive measures. Unit prices assume removal of existing pavement to subgrade. Scarify and compact subgrade to 6-inch depth. Construct 4 inches of P401 AC surface course on 8 inches of aggregate base course. 3.2.2.2 Resurfacing
Resurfacing assumes a nominal 2-inch asphalt mill and inlay on existing prepared pavement. 3.2.2.3 Structural Overlay
Structural overlays are used to address load related distress or to increase pavement load bearing capacity. Apply a 4-inch AC overlay on existing prepared pavement. Add additional thickness as needed to achieve required strength. 3.2.2.4 Surface Treatment
Apply a high-quality, penetrating rejuvenating sealer 3.2.2.5 Patching
High-performance cold patching products can be used for short term repairs. Long-term patches should be made with plant mixed hot asphalt meeting FAA P401 specs. 3.2.2.6 Crack Repair (Restorative)
Rout existing crack to a minimum depth of 1-1/4 inches, install backing rope and apply rubberized crack filler meeting ASTM D3405 specification. 3.2.2.7 Crack Repair (Sustaining)
This is typically spot repairs of existing crack sealant.

Pavement Condition Report, Starke County Airport 21
3.3 Capital Improvement Strategies
Figure 3-1 shows a projection of the overall airport pavement condition for the next 10 years based on implementing one of three capital improvement strategies:
No Action: No capital improvement action is undertaken
Longest Life: The most comprehensive repair and longest life rehabilitation option
Lowest Cost: The rehabilitation option with the projected lowest annual cost
Figure 3-1. Programmed CIP
The longest life CIP scenario is projected to cost approximately $510,000 over the next 10 years. The
lowest annual cost scenario is projected to cost approximately $60,000 over the next 10 years. Examples of each capital improvement strategy and a complete listing of all viable capital projects are presented in Table 3-2 through Table 3-4.
Table 3-2. Most Comprehensive Repair
Feature Built Description Action Yr Work Item Cost, $
4005 1995 TAXIWAY A-2 2013 Resurfacing 22,083
4010 1995 TAXIWAY A-6 2022 Resurfacing 10,144
6005 1995 RUNWAY 18-36 2022 Resurfacing 43,685
6010 1995 RUNWAY 18-36 2021 Resurfacing 437,490
Total 513,402
0
10
20
30
40
50
60
70
80
90
100
2013 2017 2022
No Action
Longest Life
Lowest Cost

Pavement Condition Report, Starke County Airport 22
Table 3-3. Lowest Annual Cost Repair
Feature Built Description Action Yr Work Item Cost, $
4005 1995 TAXIWAY A-2 2013 Resurfacing 22,083
4010 1995 TAXIWAY A-6 2022 Crack Repair 539
6005 1995 RUNWAY 18-36 2022 Surface Treatment 12,688
6010 1995 RUNWAY 18-36 2021 Crack Repair 24,862
Total 60,172
Table 3-4. All Viable Options
Feature Built Description Action Yr Work Item Cost, $
105 2006 TAXIWAY A 2013 No Action -
115 2006 TAXIWAY A3 2013 No Action -
120 2006 TAXIWAY A4 2013 No Action -
125 2006 TAXIWAY A5 2013 No Action -
130 2009 TAXIWAY TO FUEL 2013 No Action -
2005 2006 TEE HANGAR 2013 No Action -
2010 2009 TEE HANGAR 2013 No Action -
3005 2006 RAMP 2013 No Action -
3010 2006 RAMP 2013 No Action -
3015 2009 FUELING RAMP 2013 No Action -
4005 1995 TAXIWAY A-2 2013 Surface Treatment 7,563
4005 1995 TAXIWAY A-2 2013 Resurfacing 22,083
4010 1995 TAXIWAY A-6 2022 Crack Repair 539
4010 1995 TAXIWAY A-6 2022 Resurfacing 10,144
6005 1995 RUNWAY 18-36 2022 Surface Treatment 12,688
6005 1995 RUNWAY 18-36 2022 Resurfacing 43,685
6010 1995 RUNWAY 18-36 2021 Resurfacing 437,490
6010 1995 RUNWAY 18-36 2021 Surface Treatment 128,724
6010 1995 RUNWAY 18-36 2021 Crack Repair 24,862

Pavement Condition Report, Starke County Airport 23
4. Maintenance Management Program
4.1 General Comments
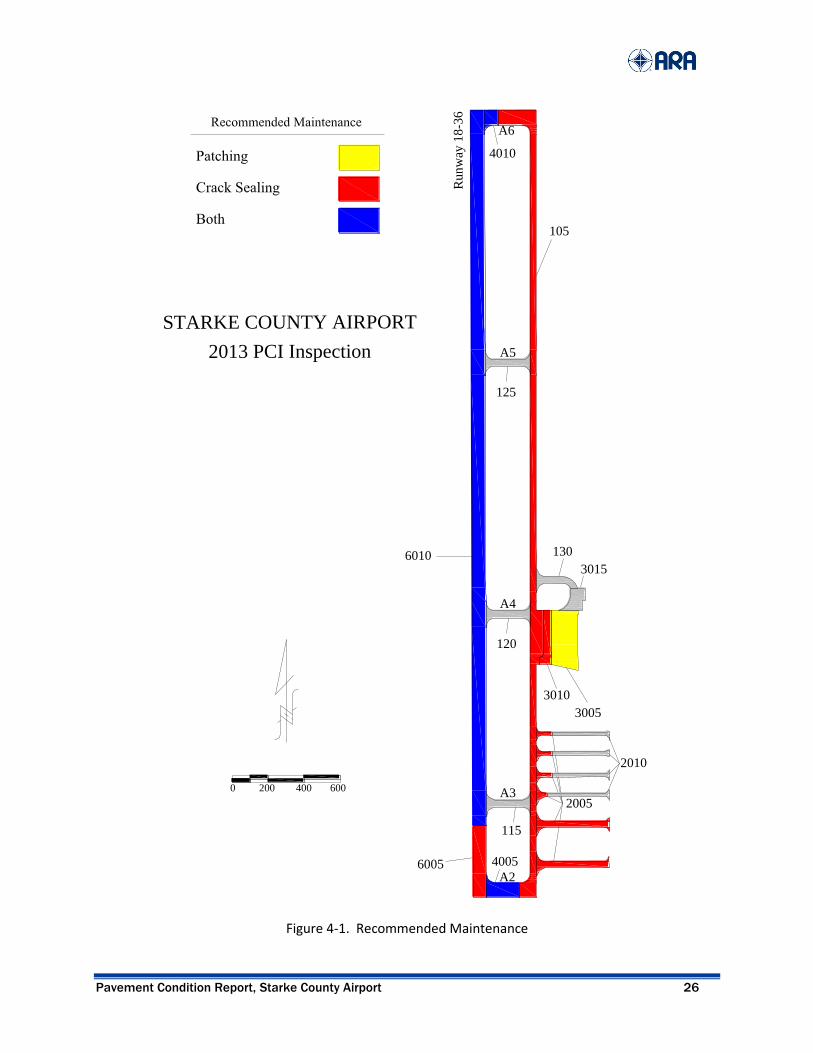
Most pavement distress is classified by severity (low, medium, or high). As a general rule, high-severity distresses should be patched, and medium-severity distress should be sealed. A detailed matrix of recommended maintenance policies to address various distress types is provided near the end of this section. 4.1.1 Inspected Crack Severity
Of the inspected pavement, 63 percent of the cracks were rated at low severity and require no maintenance beyond ongoing inspection and spot repair. About 36 percent of the cracks were rated at medium severity and would benefit from sealing and repair, and 1 percent was rated at high severity and may warrant patching to help maintain safe operations. 4.1.2 Other Distress
In asphalt pavement, area measured distresses such as rutting, depressions, fatigue cracks, and ravelling were recorded at low severity levels 96 percent of the time, medium severity 1 percent of the time, and high severity 3 percent of the time. 4.2 Recommended Maintenance Actions
The following illustrations and tables show pavement areas that have maintenance and repair needs. Ongoing development of capital improvement projects may address some of these maintenance needs. To help budgeting and prevent duplication of effort, all pavement features recommended for maintenance should be compared to planned improvements prior to finalizing a maintenance program strategy.
Table 4-1. Recommend Maintenance Actions
Work Item Quantity Unit Cost
AC PATCH 735 SF $6,376
AC RESTORATIVE CRACK REPAIR 22,838 LF $28,319
AC SUSTAINING CRACK REPAIR 1,535 LF $1,328
PCC PATCHING 22 SF $380
Total: $36,403

Pavement Condition Report, Starke County Airport 24
4.2.1 Patching
Table 4-2. Recommend AC Patching
Feature Work Item Amount Insp. PCI Change Est. PCI
4005 AC PATCH 136 42 14 56
4010 AC PATCH 82 71 7 78
6010 AC PATCH 516 73 5 78
TOTAL: 735 S.F.
EQUIPMENT: SAW, AIR COMPRESSOR, HEATING KETTLE, HAND TOOLS
EST. MATERIALS: 9 TONS ASPHALT PATCH
EST. MATERIAL COST: $916
EST. CREW HOURS: 21.0
EST. CREW COST: $5,460
EST. PROJECT COST: $6,376
Table 4-3. Recommend PCC Patching
Feature Work Item Amount Insp. PCI Change Est. PCI
3005 PCC PATCHING 22 S.F. 96 1 97
EQUIPMENT: SAW, AIR COMPRESSOR, JACK HAMMER, MIXER, HAND TOOLS
EST. MATERIALS: <1 CUBIC YARDS CONCRETE MIX
EST. MATERIAL COST: $60
EST. CREW HOURS: 2.3
EST. CREW COST: $320
EST. PROJECT COST: $380

Pavement Condition Report, Starke County Airport 25
4.2.2 Crack Seal
Table 4-4. Recommend AC Restorative Crack Repair
Feature Work Item Amount Insp. PCI Change Est. PCI
3010 AC RESTORATIVE CRACK REPAIR 724 81 4 85
4005 AC RESTORATIVE CRACK REPAIR 2,029 42 13 55
4010 AC RESTORATIVE CRACK REPAIR 379 71 17 88
6010 AC RESTORATIVE CRACK REPAIR 19,706 73 7 80
3010 AC RESTORATIVE CRACK REPAIR 724 81 4 85
TOTAL: 22,838 L.F.
EQUIPMENT: AIR COMPRESSOR, HEATING KETTLE, HAND TOOLS
EST. MATERIALS: 4,568 POUNDS ASTM D3405 SEALANT OR EQUIVALENT
EST. MATERIAL COST: $4,567
EST. CREW HOURS: 114.2
EST. CREW COST: $23,751
EST. PROJECT COST: $28,319
Table 4-5. Recommend AC Sustaining Crack Repair
Feature Work Item Amount Insp. PCI Change Est. PCI
105 AC SUSTAINING CRACK REPAIR 1,042 84 N/A
2005 AC SUSTAINING CRACK REPAIR 56 94 N/A
6005 AC SUSTAINING CRACK REPAIR 435 73 N/A
TOTAL: 1,535 L.F.
EQUIPMENT: AIR COMPRESSOR, HEATING KETTLE, HAND TOOLS
EST. MATERIALS: 307 POUNDS ASTM D3405 SEALANT OR EQUIVALENT
EST. MATERIAL COST: $307
EST. CREW HOURS: 6.7
EST. CREW COST: $1,021
EST. PROJECT COST: $1,328
Pavement Condition Report, Starke County Airport 26
2013 PCI Inspection
0 200 400 600
STARKE COUNTY AIRPORT
4005
4010
3005
3010
105
125
120
115
2005
6005
6010
2010
3015
130
A2
A3
A4
A5
A6
Ru
nw
ay 1
8-3
6
Figure 4-1. Recommended Maintenance

Pavement Condition Report, Starke County Airport 27
4.3 Pavement Deterioration
Before attempting maintenance and repairs, it helps to understand pavement performance and pavement deterioration. The factors that contribute most to deterioration are environmental, materials, and/or load related. Brief discussions of each are presented in the following sections. 4.3.1 Environmental/Age-Related Deterioration
Seasonal and daily temperature changes cause expansion and contraction of the pavement materials. The shear stresses created by expansion and contraction can cause transverse cracking in flexible pavement and mid-slab cracking in rigid pavement. Further, expansion and contraction will cause cracks, and rigid pavement joints, to open and close with changes in temperature. Flexible pavement oxidizes as it ages, losing its lighter, volatile, components and becoming brittle with time. Surface treatments and seal coats are designed, in part, to provide a protective barrier and prevent this type of oxidation. Subsurface water can have the greatest impact on pavement deterioration. A wet subgrade greatly reduces the ability of a pavement to support wheel loads, and the results often show up as rutting and cracking of flexible pavement. The fine materials in a wet base can be pumped up through the cracks and eventually result in a loss of support. This loss of support can be evidenced as corner breaks and faulting in rigid pavement. Moisture inside a pavement system expands when it freezes, creating stresses that cause the pavement surface to heave. Subsequent freeze-thaw cycles leave voids in the pavement structure that enable further rutting and breaking. Repeated freeze-thaw cycles eventually cause the pavement to disintegrate. Freeze-thaw deterioration requires frost-susceptible material, sub-zero temperatures, and water. If we remove one of these factors, freeze-thaw damage will not occur. One of the best ways to ensure pavement longevity is to provide drainage and keep it dry. 4.3.2 Materials-Related Deterioration
The pavement thickness and type of subgrade play a large role in the formation and spacing of transverse cracks. If the subgrade and base materials are smooth or rounded and allow for relatively free movement of the pavement surface, transverse cracks will often be spaced far apart (>60 feet). If the subgrade and base material are rough or angular and provide greater resistance to movement of the pavement surface, transverse cracks will be spaced more closely (<40 feet). The distance between transverse cracks also depends on the pavement thickness, as a thicker pavement can resist cracking for longer lengths. At general aviation airport pavements, around 50 feet is typical transverse crack spacing. Aggregate is the biggest component of any pavement structure, and it is the contact between the aggregate particles that actually transfers the load and provides the strength. Aggregate durability and shape are major factors affecting pavement performance. Durability is the ability of the aggregate to perform satisfactorily over time and resist deterioration. Sharp, well-angled aggregates that interlock, compact densely, and resist movement are the most desirable. In flexible pavement, the selection of asphalt cement can have a significant impact on pavement performance. Asphalt is visco-elastic, which means it is stiff at low temperatures and flows at high temperatures. With this in mind, we expect asphalt pavement to remain stiff on hot summer days to resist plastic deformation (rutting and shoving). In addition, we expect asphalt pavement to have

Pavement Condition Report, Starke County Airport 28
sufficient cold temperature flexible on cold winter days to resist transverse cracking. The proper selection of asphalt cement grade and maintaining adequate mix volumetrics (air voids, voids in the mineral aggregate, etc.) are key factors in the performance of flexible pavement. As water freezes, it expands and occupies a greater volume than in a liquid state. In PCC pavement, interconnected, well-distributed air voids are required to allow for expansion of moisture with the PCC. PCC mixes with insufficient air entrainment are susceptible to freeze-thaw damage, as the expansive forces have been shown to cause concrete deterioration. Small, closely spaced, interconnected air voids provide the greatest degree of protection. Asphalt paving mixes also require air voids, but for reasons different than for PCC pavement. When a well-constructed asphalt pavement is subjected to vehicle loading, it will nevertheless experience some minor secondary consolidation. Air voids allow for the safe movement of the asphalt binder within the mix. With insufficient air voids, the asphalt binder will migrate to the surface of the pavement—it will in essence, get squeezed out of the mix. This phenomenon is called flushing. In addition, these mixes become unstable and are prone to rutting in the wheel paths. However, if the air voids become too high, air and water can penetrate the pavement, reducing both durability and flexibility. Air infiltration will accelerate oxidization of the binder, while water penetration will increase the moisture susceptibility of the mix (i.e., stripping of the asphalt cement from the aggregate). Air voids in flexible pavement should be kept low enough to prevent water and air from penetrating the asphalt layers, but high enough to minimize the potential of plastic deformation. Regardless of whether the pavement binder is AC or PCC, binder materials are mixed with aggregate to coat all aggregate particles with a thin binder film. Durability of flexible asphalt pavement is increased with a thicker binder film, and the pavement becomes more resistant to age hardening; however, if the film is too thick, the asphalt acts like a lubricant, promoting ruts, shoving, and bleeding. Each asphalt mix should be customized for materials available locally. With a concrete pavement, aggregate interlock supports the wheel loads, and the hydrated cement binder further interlocks the aggregate particles to inhibit all movement. “Hydration” is the term for the chemical reaction of portland cement with water. In the hydration process, dry cement particles react with water to form gels, and then crystals, that grow and bond with the aggregate and form a rigid interlocking structure. Hydration can continue for years, but much of the ultimate strength will be reached within 28 days. Hydration is a sensitive chemical process. Typically, any admixtures used to accelerate the hydration process will reduce durability, and admixture use should be considered carefully or avoided.

Pavement Condition Report, Starke County Airport 29
4.3.3 Load-Related Deterioration
As illustrated below, rigid and flexible pavements differ in the way loads are distributed. A concrete slab resists bending and transfers loads evenly, while an asphalt pavement is designed to bend, gradually spreading loads over wider areas.
Load-related cracks can start at the top or bottom of a pavement section. In asphalt sections, load-related (fatigue) cracks start at the bottom. If a load-related crack reaches the surface, it usually indicates structural deficiency. In rigid pavement, corner breaks are caused by tensile forces at the top of the slab, and the crack propagates downward. Mid-slab LTD cracks are distress examples resulting from tensile forces at the bottom of the slab. Both wheel loads and environmental factors can cause spalls anytime there is movement between adjacent slabs. If non-compressible material (such as a small rock) is allowed into a joint, stresses will build up between adjacent slabs can cause a spall. Keeping joint and crack sealant intact can help to reduce the infiltration of non-compressible material and minimize spalling.

Pavement Condition Report, Starke County Airport 30
4.4 Best Practices
4.4.1 Flexible Pavement
L&T cracks at medium severity should be filled with a good quality crack sealant material. High-severity cracks normally must be patched. Cracks rated at low severity may be narrow unsealed cracks or sealed cracks up to 3 inches wide. The PCI procedure does not distinguish between narrow unfilled cracks and wider filled cracks. Some L&T cracks at low severity are included in the estimated sealing quantities and costs in this maintenance plan. In general, when medium- or high-severity cracking constitutes less than 25 percent of the total crack quantity, sustaining maintenance usually is more cost-effective. When 25 percent or more of the total crack quantity is at medium or high severity, a restorative program typically becomes more cost-effective. Existing patches rated as medium and high severity should be replaced with new patches. Small areas (usually less than 100 square feet per patch) of alligator cracking and rutting at medium and high severity also may be repaired cost-effectively by patching. Larger patches should be considered if equipment can be made available to accomplish the work. Patching to repair up to 10 percent of the surface of a pavement feature that is otherwise serviceable can result in significant cost savings as compared to rehabilitation of the entire feature. An example maintenance policy treatment matrix for flexible pavement is shown in Table 4-6. Examples of various maintenance techniques are provided in appendix C. 4.4.2 Rigid Pavement
Joint seal damage rated at medium and high severity should be repaired. If medium- and high-severity damage is limited to less than about 25 percent of the total joint length, sustaining maintenance is recommended. If medium- and high-severity damage exceeds 25 percent of the total joint length, the joint sealant should be removed and replaced under a restorative repair project. LTD cracks at low and medium severity should be considered for sealing as part of the joint sealing project. High-severity LTD cracks require sealing, patching, or slab replacement, depending on the extent of deterioration. Small patches are typically used to repair medium- and high-severity spalls or to replace deteriorated older patches. Restorative small patches are typically partial-depth repairs, usually to a maximum depth of 1/3 of the slab thickness. Large patches and corner breaks at medium and high severity should be repaired by full-depth large patches. High-severity LTD cracks and shattered slabs are candidates for patching and slab replacement. Low-severity shattered slabs can be left in place pending further deterioration. An example maintenance policy treatment matrix for rigid pavement is shown in Table 4-6. Examples of various maintenance techniques are provided in appendix C.
Pavement Condition Report, Starke County Airport 31
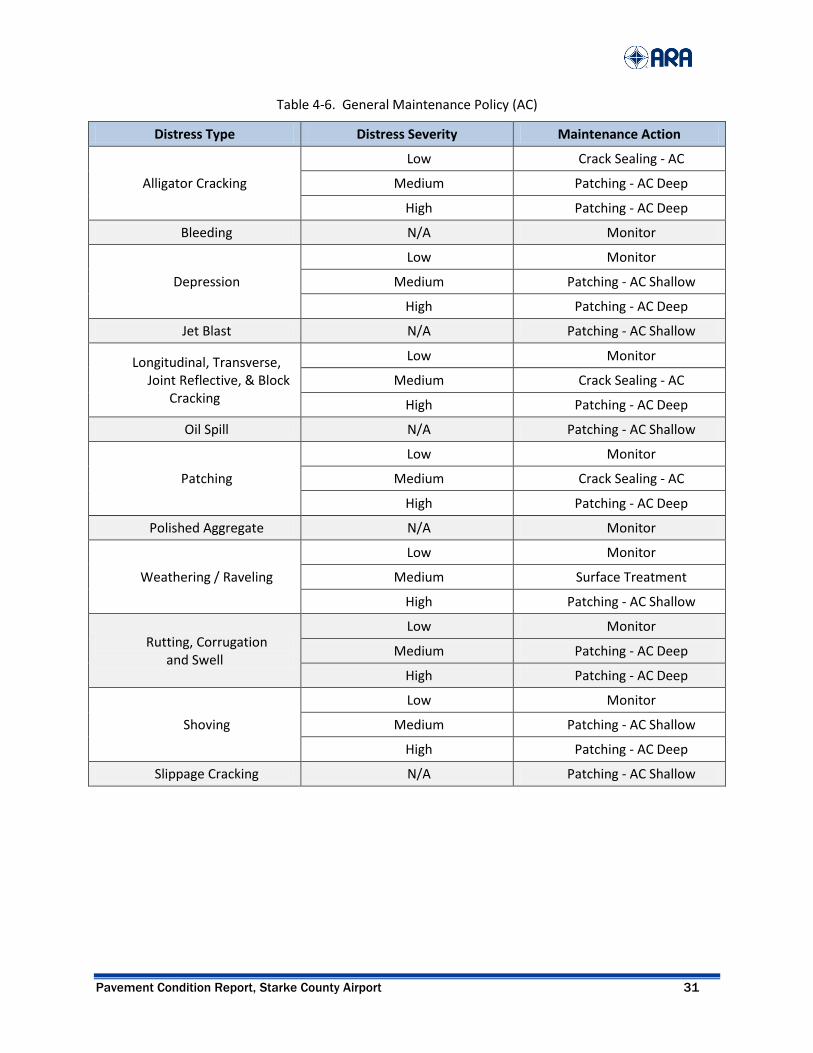
Table 4-6. General Maintenance Policy (AC)
Distress Type Distress Severity Maintenance Action
Alligator Cracking
Low Crack Sealing - AC
Medium Patching - AC Deep
High Patching - AC Deep
Bleeding N/A Monitor
Depression
Low Monitor
Medium Patching - AC Shallow
High Patching - AC Deep
Jet Blast N/A Patching - AC Shallow
Longitudinal, Transverse, Joint Reflective, & Block
Cracking
Low Monitor
Medium Crack Sealing - AC
High Patching - AC Deep
Oil Spill N/A Patching - AC Shallow
Patching
Low Monitor
Medium Crack Sealing - AC
High Patching - AC Deep
Polished Aggregate N/A Monitor
Weathering / Raveling
Low Monitor
Medium Surface Treatment
High Patching - AC Shallow
Rutting, Corrugation and Swell
Low Monitor
Medium Patching - AC Deep
High Patching - AC Deep
Shoving
Low Monitor
Medium Patching - AC Shallow
High Patching - AC Deep
Slippage Cracking N/A Patching - AC Shallow

Pavement Condition Report, Starke County Airport 32
Table 4-7. General Maintenance Policy (PCC)
Distress Type Distress Severity Maintenance Action
Blow Up
Low Patching - PCC Partial Depth
Medium Slab Replacement - PCC
High Slab Replacement - PCC
Longitudinal, Transverse & Diagonal Cracking
Low Monitor
Medium Crack Sealing - PCC
High Patching - PCC Full Depth
Durability Cracking
Low Monitor
Medium Patching - PCC Full Depth
High Slab Replacement - PCC
Large Patch & Corner Break
Low Monitor
Medium Patching - PCC Full Depth
High Patching - PCC Full Depth
Popout / Shrinkage Cracks N/A Monitor
Scaling
Low Monitor
Medium Patching - PCC Partial Depth
High Slab Replacement - PCC
Faulting
Low Monitor
Medium Grinding (Localized)
High Grinding (Localized)
Shattered Slab
Low Monitor
Medium Crack Sealing - PCC
High Slab Replacement - PCC
Joint Spall, Corner Spall & Small Patch
Low Monitor
Medium Patching - PCC Partial Depth
High Patching - PCC Partial Depth
Alkali Silica Reactivity
Low Monitor
Medium Slab Replacement - PCC
High Slab Replacement - PCC

Pavement Condition Report, Starke County Airport 33
4.5 Pavement Repair Materials
New pavement repair materials are introduced and improved regularly. This section provides information on products compatible with airport needs. 4.5.1 Joint and Crack Sealer
Hot-poured, pressure-injected, polymeric rubberized asphalt sealant meeting ASTM D3405 specifications is suitable for most sealing requirements. This product is relatively inexpensive, durable, and suitable for both rigid and flexible pavements. Other, more expensive, hot-applied sealants that promise longer life are being developed for specialty applications. Twin component cold applied sealants also have been used with success. Contact your local distributor. 4.5.2 Flexible Pavement Patch
High-performance plant mixed cold patching products that can be stockpiled on-site can be used for short term repairs to maintain safety. Long-term patches should be made with high-quality plant mixed hot asphalt having a ¾-inch maximum aggregate size and meeting Federal Aviation Administration (FAA) P401, or highest quality highway specifications. Low-quality packaged materials available from local hardware type stores should be avoided. 4.5.3 Rigid Pavement Patch
Permanent patches in rigid pavement should be made with air-entrained concrete with 1-inch maximum size aggregate. If the area must be quickly opened to traffic, high early concrete should be considered. Concrete should have zero slump and a coarse texture. As with asphalt patches, low-quality packaged materials should be used only as temporary patches to maintain safety and service until a more permanent repair can be made. 4.6 Pavement Repair Equipment
Many pavement repair and sealing products are available. Specialized tools and equipment help ensure high-quality repairs. This section discusses equipment compatible with airport needs. 4.6.1 Air Compressor
Used to remove non-compressible sand and debris from prepared cracks and joints, the compressor should have a sustained capacity of 120 cubic feet per minute with a nozzle velocity of 100 psi. Trailer-mounted compressors typically have capacities in this range. 4.6.2 Concrete Saw
A saw capable of making a minimum 3-inch-deep cut is required. The saw should be capable of making cuts in both asphalt and concrete. Gasoline-powered 5- to 25-hp wheel-mounted saws typically are preferred for this type of work, but electric and pneumatic tools also are available.

Pavement Condition Report, Starke County Airport 34
4.6.3 Heating Kettle
Applying sealant is the most time-consuming operation, and a sealing machine with heating and pressure application capabilities is a critical item in a successful sealing program. The capacity of the sealing equipment dictates the rate at which a crew progresses. For large sealing projects, a minimum 100-gallons/hour sustained capacity is recommended. The unit should be a double boiler type, with mechanical agitators or continuous recirculation. Kettle temperature must be monitored to ensure that the sealant is not “burned.” Overheating the sealant will prematurely age harden the material. 4.6.4 Router
A concrete saw can be used to prepare joints, but for random cracking, a mechanical router with a vertical impact mechanism is preferred. When cracks are being routed, this activity will dictate the speed of the crew. Crack routers in the 25-hp range are commonly used and are available from a variety of manufacturers. 4.6.5 Sand Cleaner
A sand blaster helps to clean loose particles and dust from prepared cracks. The unit must have sufficient force to expose fresh, vital pavement to bond with sealant and patching materials. 4.6.6 Vibratory Roller or Plate Compactor
Required to compact plant mixed and packaged patching materials properly. Small rollers are best for pothole type applications; plate compactors are best for large areas. 4.6.7 Other Equipment
Other general use equipment that can be helpful in a maintenance program includes bucket loaders, dump trucks, water tanks, and a power sweeper unit.
Pavement Condition Report, Starke County Airport 35
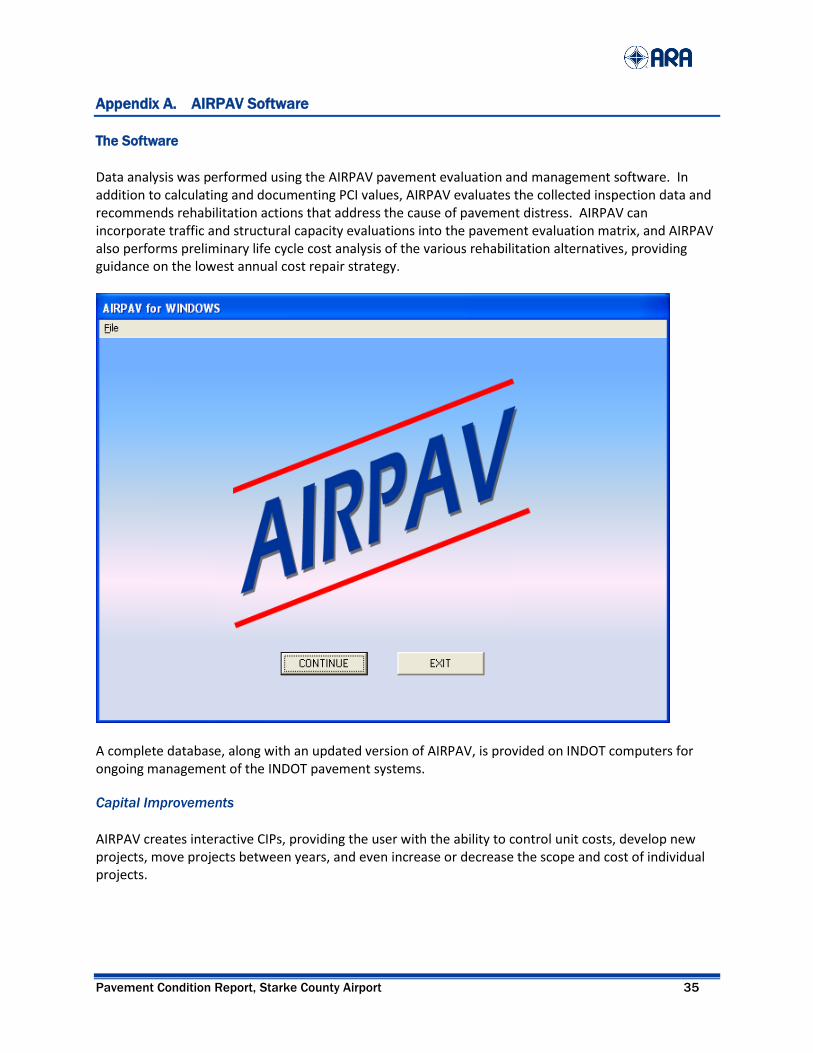
Appendix A. AIRPAV Software
The Software
Data analysis was performed using the AIRPAV pavement evaluation and management software. In addition to calculating and documenting PCI values, AIRPAV evaluates the collected inspection data and recommends rehabilitation actions that address the cause of pavement distress. AIRPAV can incorporate traffic and structural capacity evaluations into the pavement evaluation matrix, and AIRPAV also performs preliminary life cycle cost analysis of the various rehabilitation alternatives, providing guidance on the lowest annual cost repair strategy.
A complete database, along with an updated version of AIRPAV, is provided on INDOT computers for ongoing management of the INDOT pavement systems. Capital Improvements
AIRPAV creates interactive CIPs, providing the user with the ability to control unit costs, develop new projects, move projects between years, and even increase or decrease the scope and cost of individual projects.
Pavement Condition Report, Starke County Airport 36
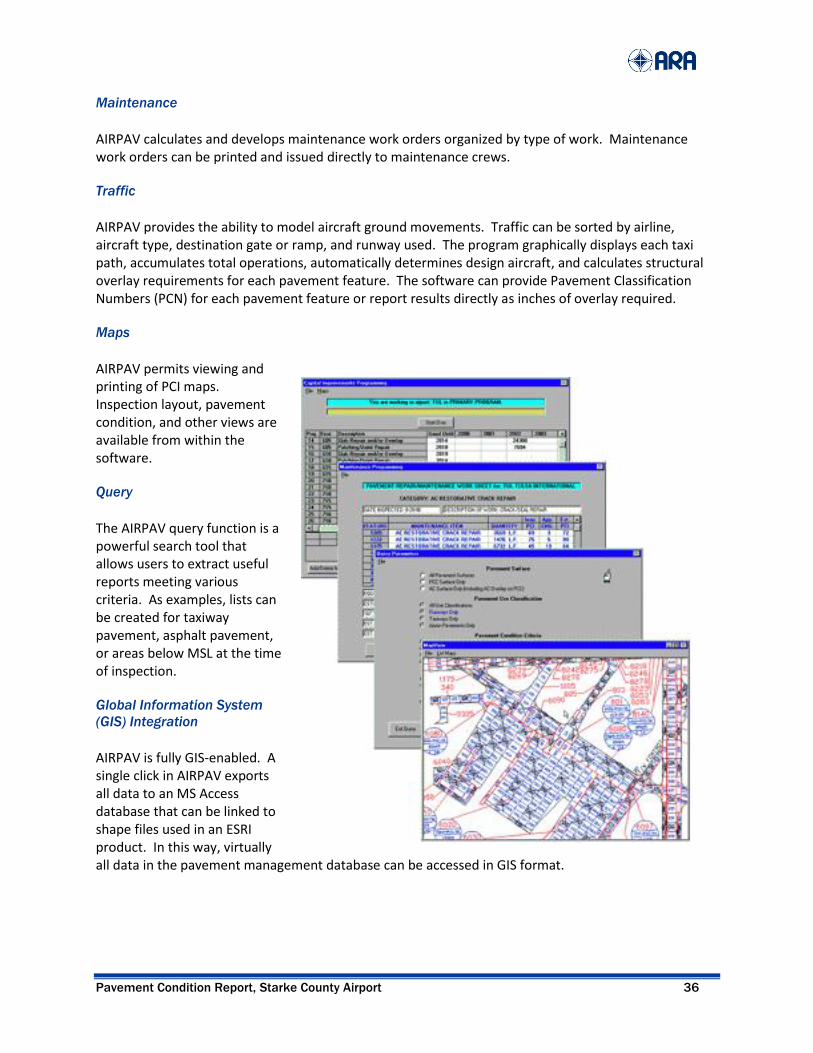
Maintenance
AIRPAV calculates and develops maintenance work orders organized by type of work. Maintenance work orders can be printed and issued directly to maintenance crews. Traffic
AIRPAV provides the ability to model aircraft ground movements. Traffic can be sorted by airline, aircraft type, destination gate or ramp, and runway used. The program graphically displays each taxi path, accumulates total operations, automatically determines design aircraft, and calculates structural overlay requirements for each pavement feature. The software can provide Pavement Classification Numbers (PCN) for each pavement feature or report results directly as inches of overlay required. Maps
AIRPAV permits viewing and printing of PCI maps. Inspection layout, pavement condition, and other views are available from within the software. Query
The AIRPAV query function is a powerful search tool that allows users to extract useful reports meeting various criteria. As examples, lists can be created for taxiway pavement, asphalt pavement, or areas below MSL at the time of inspection. Global Information System
(GIS) Integration
AIRPAV is fully GIS-enabled. A single click in AIRPAV exports all data to an MS Access database that can be linked to shape files used in an ESRI product. In this way, virtually all data in the pavement management database can be accessed in GIS format.
Pavement Condition Report, Starke County Airport 37
Appendix B. Feature Analysis
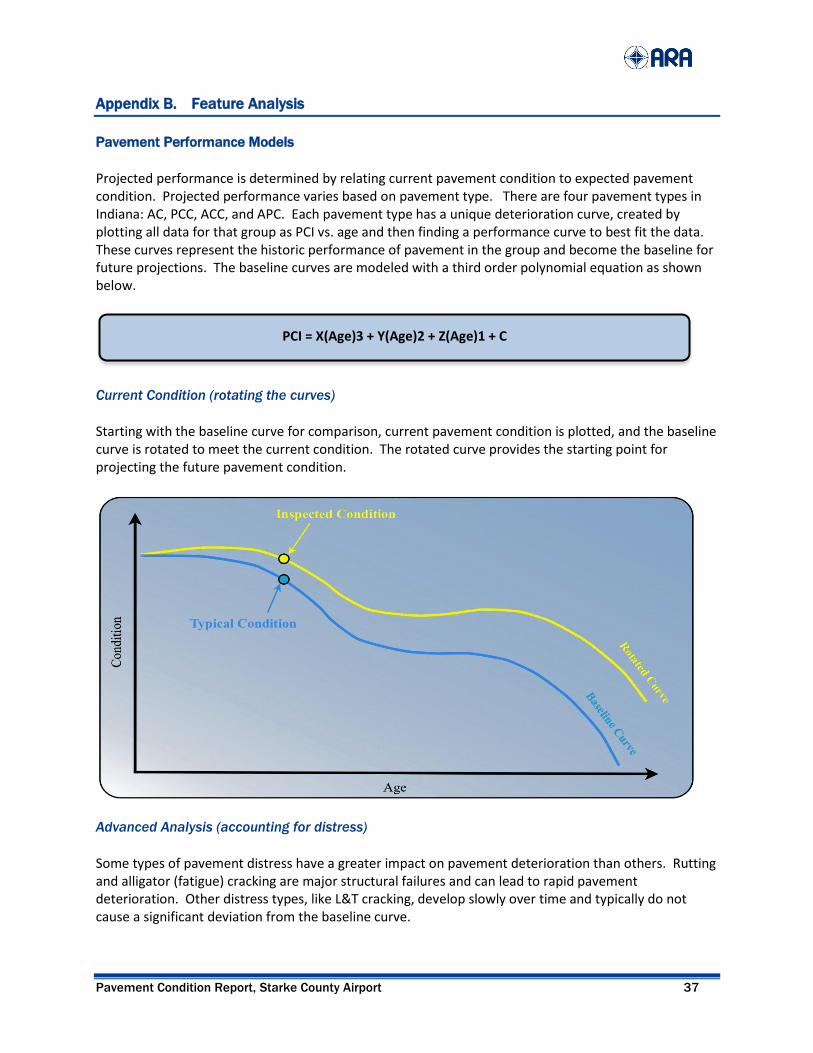
Pavement Performance Models
Projected performance is determined by relating current pavement condition to expected pavement condition. Projected performance varies based on pavement type. There are four pavement types in Indiana: AC, PCC, ACC, and APC. Each pavement type has a unique deterioration curve, created by plotting all data for that group as PCI vs. age and then finding a performance curve to best fit the data. These curves represent the historic performance of pavement in the group and become the baseline for future projections. The baseline curves are modeled with a third order polynomial equation as shown below.
Current Condition (rotating the curves)
Starting with the baseline curve for comparison, current pavement condition is plotted, and the baseline curve is rotated to meet the current condition. The rotated curve provides the starting point for projecting the future pavement condition.
Advanced Analysis (accounting for distress)
Some types of pavement distress have a greater impact on pavement deterioration than others. Rutting and alligator (fatigue) cracking are major structural failures and can lead to rapid pavement deterioration. Other distress types, like L&T cracking, develop slowly over time and typically do not cause a significant deviation from the baseline curve.
PCI = X(Age)3 + Y(Age)2 + Z(Age)1 + C

Pavement Condition Report, Starke County Airport 38
After current condition is accounted for with the curve rotation, pavement distress is addressed in the advanced analysis by compressing or expanding the baseline curve to account for the expected rate of pavement deterioration.
Projected PCI (near term vs. longer term)
Projecting pavement condition with advanced analysis is a combination of rotating, expanding, and contracting the baseline curves. This projection method provides good short-term results for all pavement sections and fair long-term projections on pavement sections with conditions near the baseline model. The long-term accuracy of outlier data is discussed on the following page.
Pavement Condition Report, Starke County Airport 39
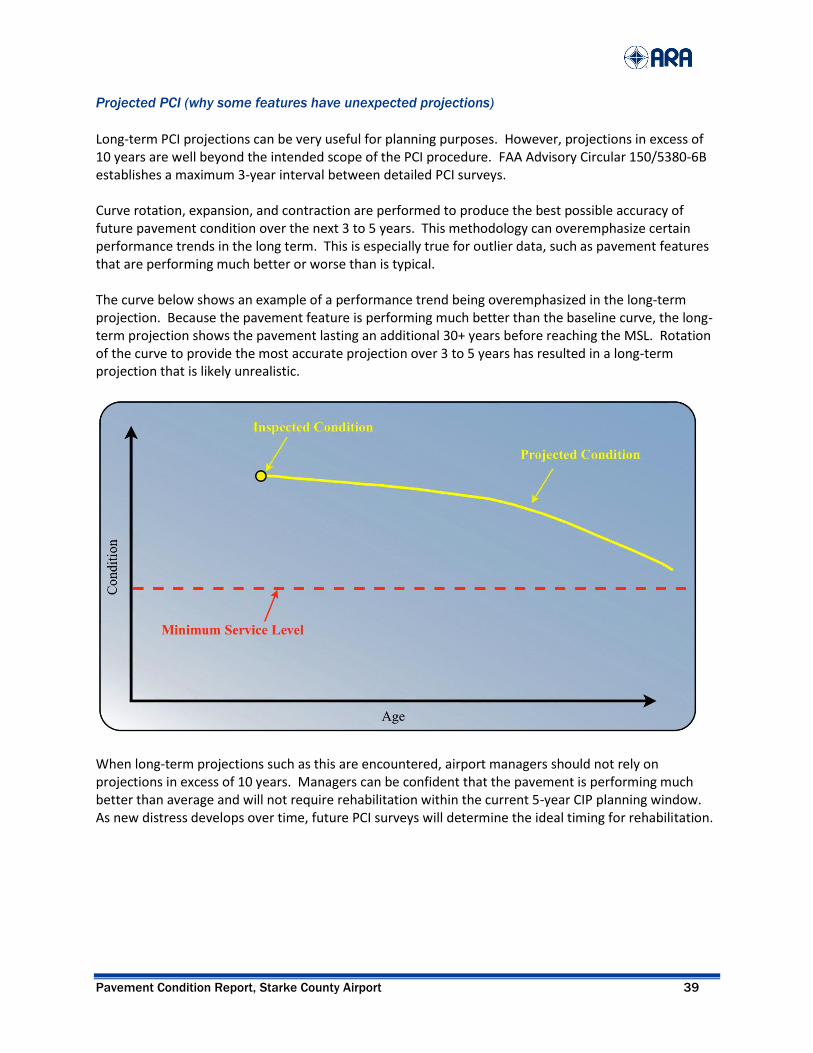
Projected PCI (why some features have unexpected projections)
Long-term PCI projections can be very useful for planning purposes. However, projections in excess of 10 years are well beyond the intended scope of the PCI procedure. FAA Advisory Circular 150/5380-6B establishes a maximum 3-year interval between detailed PCI surveys. Curve rotation, expansion, and contraction are performed to produce the best possible accuracy of future pavement condition over the next 3 to 5 years. This methodology can overemphasize certain performance trends in the long term. This is especially true for outlier data, such as pavement features that are performing much better or worse than is typical. The curve below shows an example of a performance trend being overemphasized in the long-term projection. Because the pavement feature is performing much better than the baseline curve, the long-term projection shows the pavement lasting an additional 30+ years before reaching the MSL. Rotation of the curve to provide the most accurate projection over 3 to 5 years has resulted in a long-term projection that is likely unrealistic.
When long-term projections such as this are encountered, airport managers should not rely on projections in excess of 10 years. Managers can be confident that the pavement is performing much better than average and will not require rehabilitation within the current 5-year CIP planning window. As new distress develops over time, future PCI surveys will determine the ideal timing for rehabilitation.
Pavement Condition Report, Starke County Airport 40
Feature Analysis
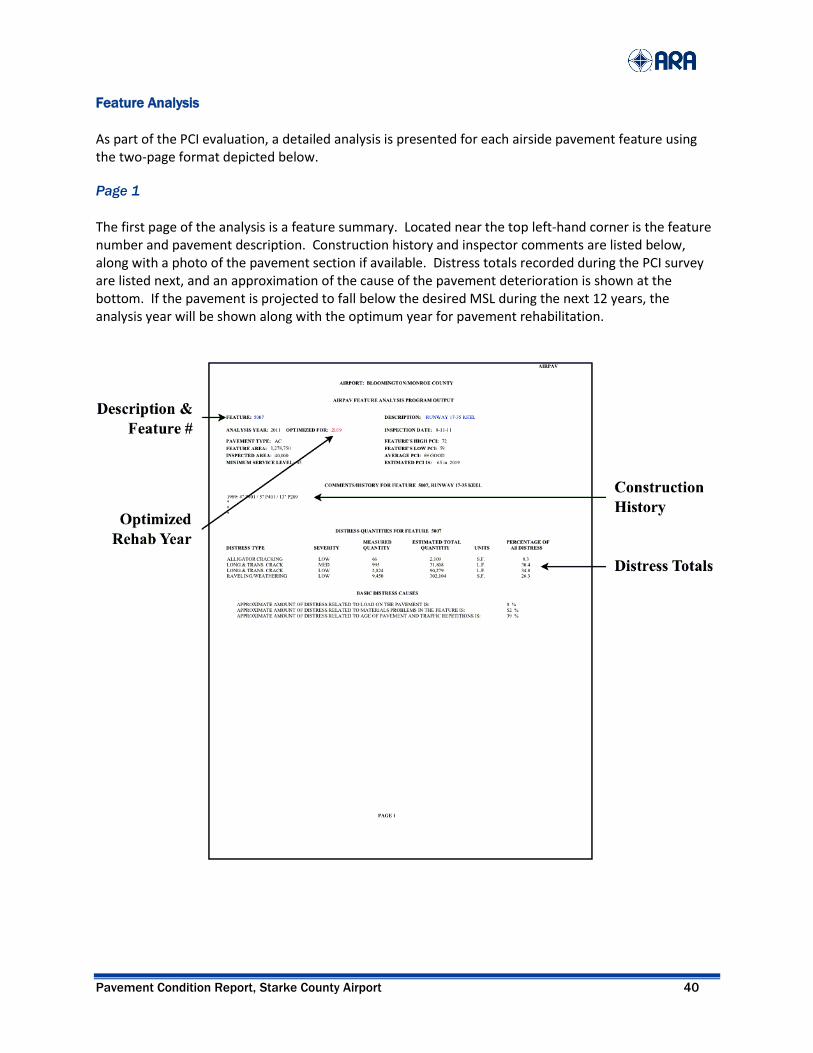
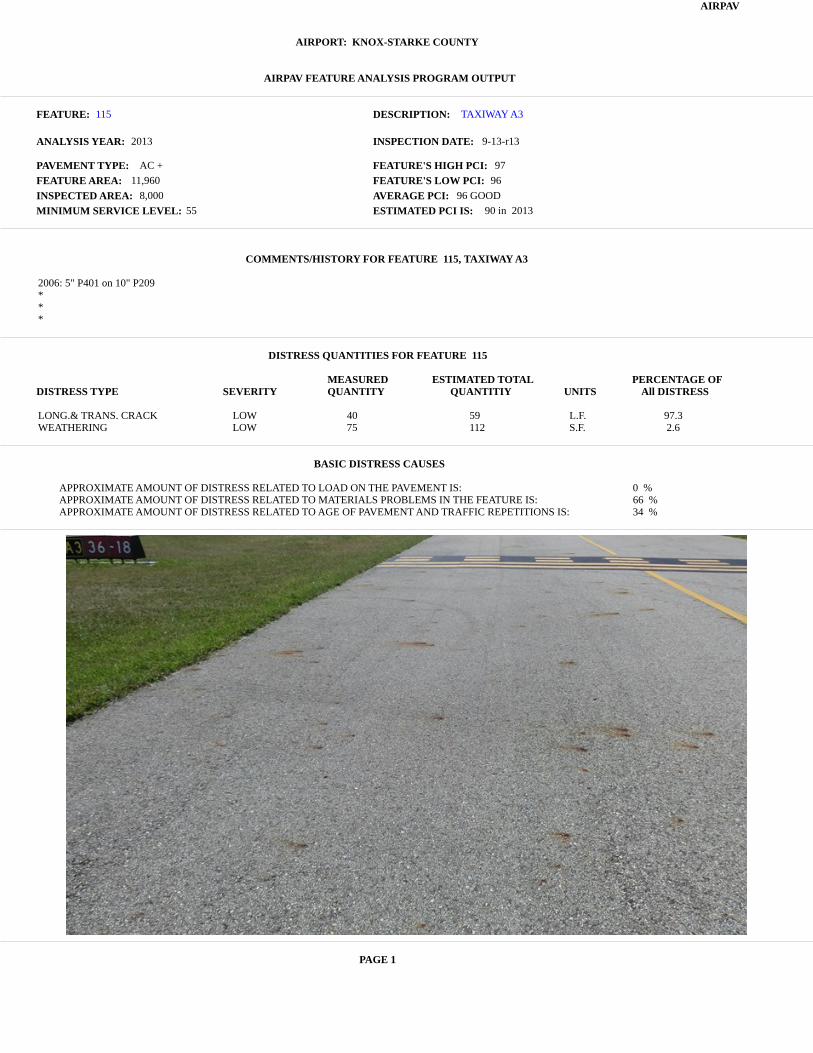
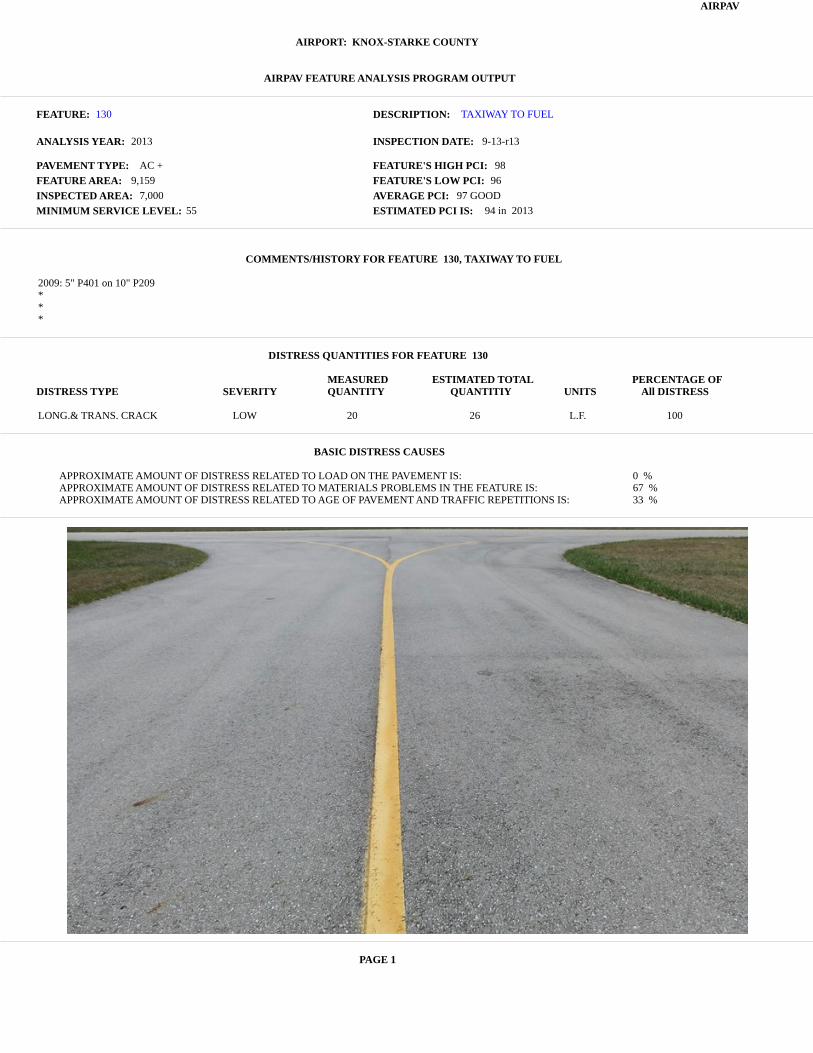
As part of the PCI evaluation, a detailed analysis is presented for each airside pavement feature using the two-page format depicted below. Page 1
The first page of the analysis is a feature summary. Located near the top left-hand corner is the feature number and pavement description. Construction history and inspector comments are listed below, along with a photo of the pavement section if available. Distress totals recorded during the PCI survey are listed next, and an approximation of the cause of the pavement deterioration is shown at the bottom. If the pavement is projected to fall below the desired MSL during the next 12 years, the analysis year will be shown along with the optimum year for pavement rehabilitation.

Pavement Condition Report, Starke County Airport 41
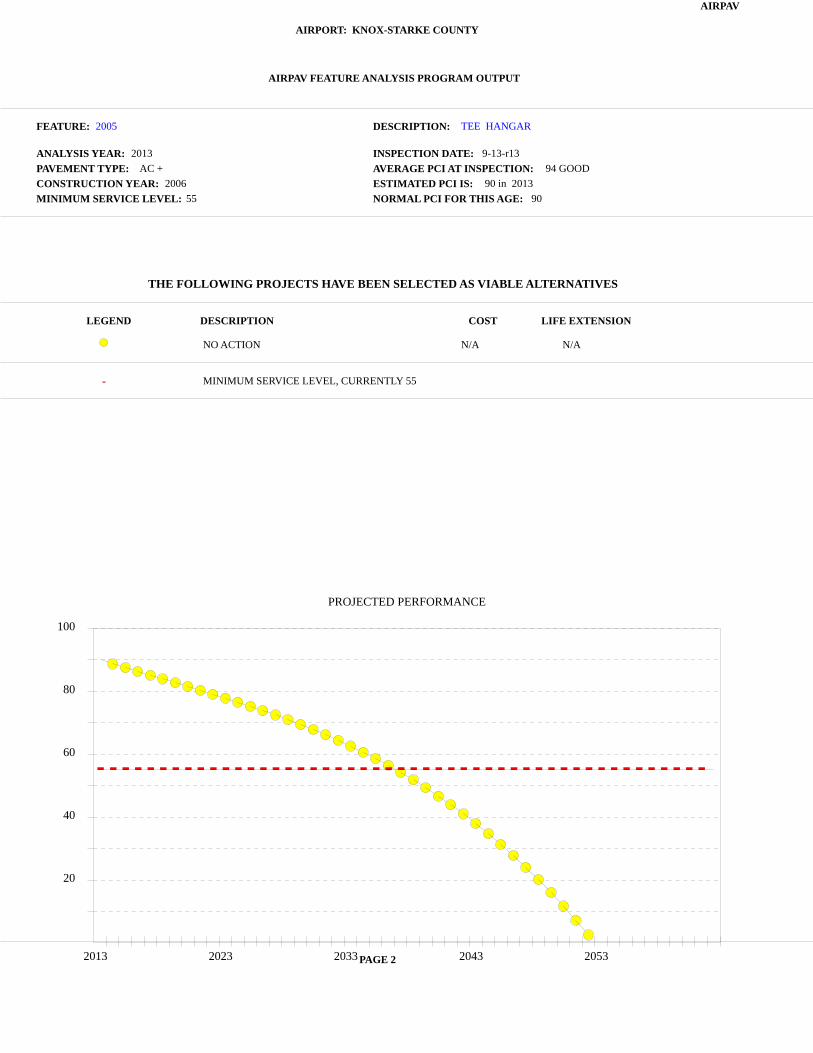
Page 2
The second page is a graphic analysis of pavement deterioration. Pavement deterioration is forecast based on historic deterioration of similar Indiana pavement types. Remaining life is projected by stretching and rotating the baseline curves to fit the current condition determined from the PCI survey. When pavement condition drops below the desired MSL, the software selects rehabilitation actions that address the cause of the pavement failure while restoring the pavement to a condition above the MSL. A NO ACTION recommendation indicates that the feature is expected to remain serviceable during the 12-year forecasting period without major repairs. NO ACTION recommendations do not diminish the need for regular maintenance.
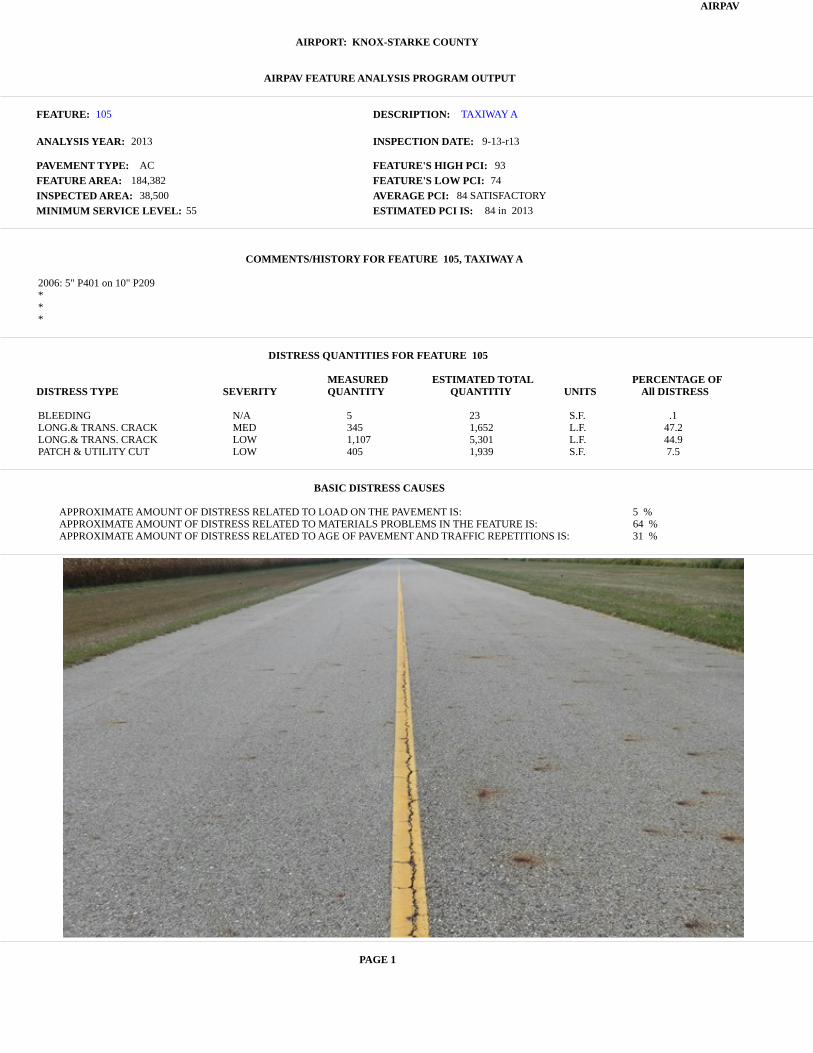
AIRPAV
AIRPORT: KNOX-STARKE COUNTY
AIRPAV FEATURE ANALYSIS PROGRAM OUTPUT
FEATURE: DESCRIPTION:
ANALYSIS YEAR: INSPECTION DATE:
PAVEMENT TYPE: FEATURE'S HIGH PCI:
FEATURE AREA: FEATURE'S LOW PCI:
INSPECTED AREA: AVERAGE PCI:
MINIMUM SERVICE LEVEL: ESTIMATED PCI IS:
105 TAXIWAY A
2013 9-13-r13
AC 93
184,382 74
38,500 84 SATISFACTORY
55 84 in 2013
COMMENTS/HISTORY FOR FEATURE 105, TAXIWAY A
2006: 5" P401 on 10" P209***
DISTRESS QUANTITIES FOR FEATURE 105
MEASURED ESTIMATED TOTAL PERCENTAGE OFDISTRESS TYPE SEVERITY QUANTITY QUANTITIY UNITS All DISTRESS
BLEEDING N/A 5 23 S.F. .1LONG.& TRANS. CRACK MED 345 1,652 L.F. 47.2LONG.& TRANS. CRACK LOW 1,107 5,301 L.F. 44.9PATCH & UTILITY CUT LOW 405 1,939 S.F. 7.5
BASIC DISTRESS CAUSES
APPROXIMATE AMOUNT OF DISTRESS RELATED TO LOAD ON THE PAVEMENT IS: 5 %APPROXIMATE AMOUNT OF DISTRESS RELATED TO MATERIALS PROBLEMS IN THE FEATURE IS: 64 %APPROXIMATE AMOUNT OF DISTRESS RELATED TO AGE OF PAVEMENT AND TRAFFIC REPETITIONS IS: 31 %
PAGE 1
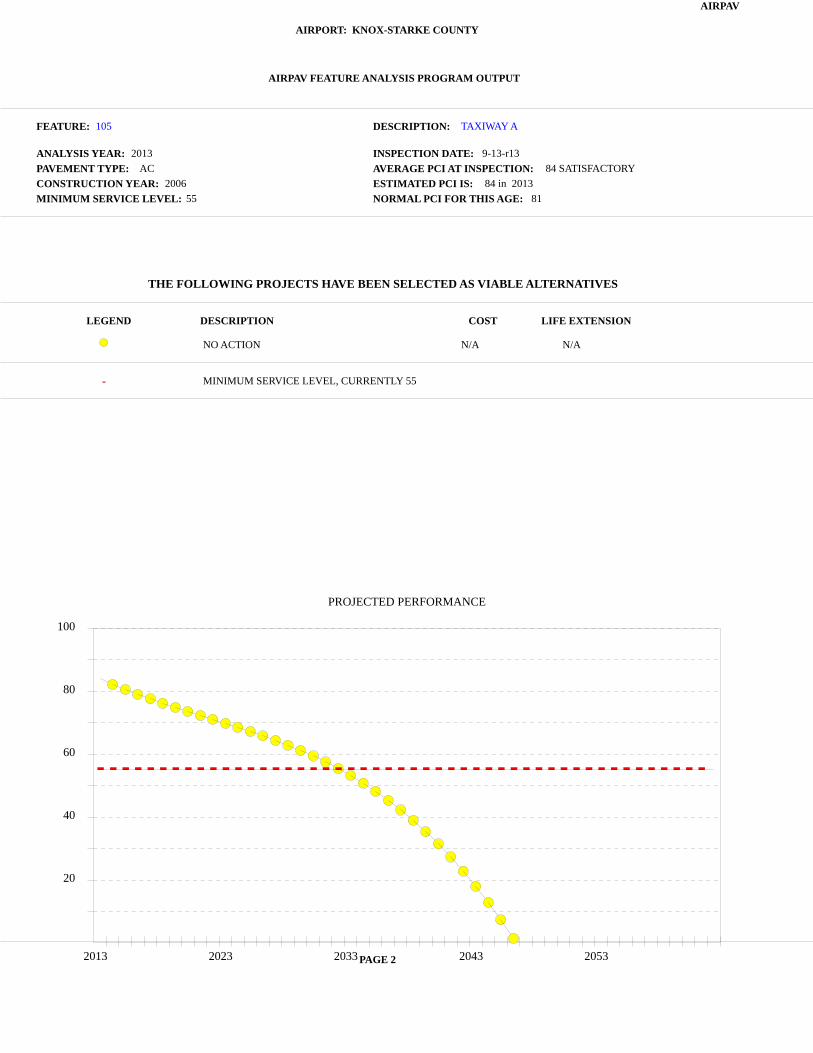
AIRPAV
AIRPORT: KNOX-STARKE COUNTY
AIRPAV FEATURE ANALYSIS PROGRAM OUTPUT
FEATURE: DESCRIPTION:
ANALYSIS YEAR: INSPECTION DATE:
PAVEMENT TYPE: AVERAGE PCI AT INSPECTION:
CONSTRUCTION YEAR: ESTIMATED PCI IS:
MINIMUM SERVICE LEVEL: NORMAL PCI FOR THIS AGE:
105 TAXIWAY A
2013 9-13-r13
AC 84 SATISFACTORY
2006 84 in 2013
55 81
THE FOLLOWING PROJECTS HAVE BEEN SELECTED AS VIABLE ALTERNATIVES
LEGEND DESCRIPTION COST LIFE EXTENSION
NO ACTION N/A N/A
MINIMUM SERVICE LEVEL, CURRENTLY 55
PAGE 2
PROJECTED PERFORMANCE
20
40
60
80
100
2013 2023 2033 2043 2053
AIRPAV
AIRPORT: KNOX-STARKE COUNTY
AIRPAV FEATURE ANALYSIS PROGRAM OUTPUT
FEATURE: DESCRIPTION:
ANALYSIS YEAR: INSPECTION DATE:
PAVEMENT TYPE: FEATURE'S HIGH PCI:
FEATURE AREA: FEATURE'S LOW PCI:
INSPECTED AREA: AVERAGE PCI:
MINIMUM SERVICE LEVEL: ESTIMATED PCI IS:
115 TAXIWAY A3
2013 9-13-r13
AC + 97
11,960 96
8,000 96 GOOD
55 90 in 2013
COMMENTS/HISTORY FOR FEATURE 115, TAXIWAY A3
2006: 5" P401 on 10" P209***
DISTRESS QUANTITIES FOR FEATURE 115
MEASURED ESTIMATED TOTAL PERCENTAGE OFDISTRESS TYPE SEVERITY QUANTITY QUANTITIY UNITS All DISTRESS
LONG.& TRANS. CRACK LOW 40 59 L.F. 97.3WEATHERING LOW 75 112 S.F. 2.6
BASIC DISTRESS CAUSES
APPROXIMATE AMOUNT OF DISTRESS RELATED TO LOAD ON THE PAVEMENT IS: 0 %APPROXIMATE AMOUNT OF DISTRESS RELATED TO MATERIALS PROBLEMS IN THE FEATURE IS: 66 %APPROXIMATE AMOUNT OF DISTRESS RELATED TO AGE OF PAVEMENT AND TRAFFIC REPETITIONS IS: 34 %
PAGE 1

AIRPAV
AIRPORT: KNOX-STARKE COUNTY
AIRPAV FEATURE ANALYSIS PROGRAM OUTPUT
FEATURE: DESCRIPTION:
ANALYSIS YEAR: INSPECTION DATE:
PAVEMENT TYPE: AVERAGE PCI AT INSPECTION:
CONSTRUCTION YEAR: ESTIMATED PCI IS:
MINIMUM SERVICE LEVEL: NORMAL PCI FOR THIS AGE:
115 TAXIWAY A3
2013 9-13-r13
AC + 96 GOOD
2006 90 in 2013
55 90
THE FOLLOWING PROJECTS HAVE BEEN SELECTED AS VIABLE ALTERNATIVES
LEGEND DESCRIPTION COST LIFE EXTENSION
NO ACTION N/A N/A
MINIMUM SERVICE LEVEL, CURRENTLY 55
PAGE 2
PROJECTED PERFORMANCE
20
40
60
80
100
2013 2023 2033 2043 2053

AIRPAV
AIRPORT: KNOX-STARKE COUNTY
AIRPAV FEATURE ANALYSIS PROGRAM OUTPUT
FEATURE: DESCRIPTION:
ANALYSIS YEAR: INSPECTION DATE:
PAVEMENT TYPE: FEATURE'S HIGH PCI:
FEATURE AREA: FEATURE'S LOW PCI:
INSPECTED AREA: AVERAGE PCI:
MINIMUM SERVICE LEVEL: ESTIMATED PCI IS:
120 TAXIWAY A4
2013 9-13-r13
AC + 96
12,107 96
8,000 96 GOOD
55 90 in 2013
COMMENTS/HISTORY FOR FEATURE 120, TAXIWAY A4
2006: 5" P401 on 10" P209***
DISTRESS QUANTITIES FOR FEATURE 120
MEASURED ESTIMATED TOTAL PERCENTAGE OFDISTRESS TYPE SEVERITY QUANTITY QUANTITIY UNITS All DISTRESS
LONG.& TRANS. CRACK LOW 49 74 L.F. 100
BASIC DISTRESS CAUSES
APPROXIMATE AMOUNT OF DISTRESS RELATED TO LOAD ON THE PAVEMENT IS: 0 %APPROXIMATE AMOUNT OF DISTRESS RELATED TO MATERIALS PROBLEMS IN THE FEATURE IS: 67 %APPROXIMATE AMOUNT OF DISTRESS RELATED TO AGE OF PAVEMENT AND TRAFFIC REPETITIONS IS: 33 %
PAGE 1

AIRPAV
AIRPORT: KNOX-STARKE COUNTY
AIRPAV FEATURE ANALYSIS PROGRAM OUTPUT
FEATURE: DESCRIPTION:
ANALYSIS YEAR: INSPECTION DATE:
PAVEMENT TYPE: AVERAGE PCI AT INSPECTION:
CONSTRUCTION YEAR: ESTIMATED PCI IS:
MINIMUM SERVICE LEVEL: NORMAL PCI FOR THIS AGE:
120 TAXIWAY A4
2013 9-13-r13
AC + 96 GOOD
2006 90 in 2013
55 90
THE FOLLOWING PROJECTS HAVE BEEN SELECTED AS VIABLE ALTERNATIVES
LEGEND DESCRIPTION COST LIFE EXTENSION
NO ACTION N/A N/A
MINIMUM SERVICE LEVEL, CURRENTLY 55
PAGE 2
PROJECTED PERFORMANCE
20
40
60
80
100
2013 2023 2033 2043 2053

AIRPAV
AIRPORT: KNOX-STARKE COUNTY
AIRPAV FEATURE ANALYSIS PROGRAM OUTPUT
FEATURE: DESCRIPTION:
ANALYSIS YEAR: INSPECTION DATE:
PAVEMENT TYPE: FEATURE'S HIGH PCI:
FEATURE AREA: FEATURE'S LOW PCI:
INSPECTED AREA: AVERAGE PCI:
MINIMUM SERVICE LEVEL: ESTIMATED PCI IS:
125 TAXIWAY A5
2013 9-13-r13
AC + 96
12,295 89
8,000 93 GOOD
55 90 in 2013
COMMENTS/HISTORY FOR FEATURE 125, TAXIWAY A5
2006: 5" P401 on 10" P209***
DISTRESS QUANTITIES FOR FEATURE 125
MEASURED ESTIMATED TOTAL PERCENTAGE OFDISTRESS TYPE SEVERITY QUANTITY QUANTITIY UNITS All DISTRESS
LONG.& TRANS. CRACK MED 2 3 L.F. 27LONG.& TRANS. CRACK LOW 67 103 L.F. 56.6PATCH & UTILITY CUT LOW 18 27 S.F. 16.2
BASIC DISTRESS CAUSES
APPROXIMATE AMOUNT OF DISTRESS RELATED TO LOAD ON THE PAVEMENT IS: 11 %APPROXIMATE AMOUNT OF DISTRESS RELATED TO MATERIALS PROBLEMS IN THE FEATURE IS: 61 %APPROXIMATE AMOUNT OF DISTRESS RELATED TO AGE OF PAVEMENT AND TRAFFIC REPETITIONS IS: 28 %
PAGE 1

AIRPAV
AIRPORT: KNOX-STARKE COUNTY
AIRPAV FEATURE ANALYSIS PROGRAM OUTPUT
FEATURE: DESCRIPTION:
ANALYSIS YEAR: INSPECTION DATE:
PAVEMENT TYPE: AVERAGE PCI AT INSPECTION:
CONSTRUCTION YEAR: ESTIMATED PCI IS:
MINIMUM SERVICE LEVEL: NORMAL PCI FOR THIS AGE:
125 TAXIWAY A5
2013 9-13-r13
AC + 93 GOOD
2006 90 in 2013
55 90
THE FOLLOWING PROJECTS HAVE BEEN SELECTED AS VIABLE ALTERNATIVES
LEGEND DESCRIPTION COST LIFE EXTENSION
NO ACTION N/A N/A
MINIMUM SERVICE LEVEL, CURRENTLY 55
PAGE 2
PROJECTED PERFORMANCE
20
40
60
80
100
2013 2023 2033 2043 2053
AIRPAV
AIRPORT: KNOX-STARKE COUNTY
AIRPAV FEATURE ANALYSIS PROGRAM OUTPUT
FEATURE: DESCRIPTION:
ANALYSIS YEAR: INSPECTION DATE:
PAVEMENT TYPE: FEATURE'S HIGH PCI:
FEATURE AREA: FEATURE'S LOW PCI:
INSPECTED AREA: AVERAGE PCI:
MINIMUM SERVICE LEVEL: ESTIMATED PCI IS:
130 TAXIWAY TO FUEL
2013 9-13-r13
AC + 98
9,159 96
7,000 97 GOOD
55 94 in 2013
COMMENTS/HISTORY FOR FEATURE 130, TAXIWAY TO FUEL
2009: 5" P401 on 10" P209***
DISTRESS QUANTITIES FOR FEATURE 130
MEASURED ESTIMATED TOTAL PERCENTAGE OFDISTRESS TYPE SEVERITY QUANTITY QUANTITIY UNITS All DISTRESS
LONG.& TRANS. CRACK LOW 20 26 L.F. 100
BASIC DISTRESS CAUSES
APPROXIMATE AMOUNT OF DISTRESS RELATED TO LOAD ON THE PAVEMENT IS: 0 %APPROXIMATE AMOUNT OF DISTRESS RELATED TO MATERIALS PROBLEMS IN THE FEATURE IS: 67 %APPROXIMATE AMOUNT OF DISTRESS RELATED TO AGE OF PAVEMENT AND TRAFFIC REPETITIONS IS: 33 %
PAGE 1

AIRPAV
AIRPORT: KNOX-STARKE COUNTY
AIRPAV FEATURE ANALYSIS PROGRAM OUTPUT
FEATURE: DESCRIPTION:
ANALYSIS YEAR: INSPECTION DATE:
PAVEMENT TYPE: AVERAGE PCI AT INSPECTION:
CONSTRUCTION YEAR: ESTIMATED PCI IS:
MINIMUM SERVICE LEVEL: NORMAL PCI FOR THIS AGE:
130 TAXIWAY TO FUEL
2013 9-13-r13
AC + 97 GOOD
2009 94 in 2013
55 94
THE FOLLOWING PROJECTS HAVE BEEN SELECTED AS VIABLE ALTERNATIVES
LEGEND DESCRIPTION COST LIFE EXTENSION
NO ACTION N/A N/A
MINIMUM SERVICE LEVEL, CURRENTLY 55
PAGE 2
PROJECTED PERFORMANCE
20
40
60
80
100
2013 2023 2033 2043 2053

AIRPAV
AIRPORT: KNOX-STARKE COUNTY
AIRPAV FEATURE ANALYSIS PROGRAM OUTPUT
FEATURE: DESCRIPTION:
ANALYSIS YEAR: INSPECTION DATE:
PAVEMENT TYPE: FEATURE'S HIGH PCI:
FEATURE AREA: FEATURE'S LOW PCI:
INSPECTED AREA: AVERAGE PCI:
MINIMUM SERVICE LEVEL: ESTIMATED PCI IS:
2005 TEE HANGAR
2013 9-13-r13
AC + 100
39,283 87
14,410 94 GOOD
55 90 in 2013
COMMENTS/HISTORY FOR FEATURE 2005, TEE HANGAR
2006: 5" P401 on 10" P209***
DISTRESS QUANTITIES FOR FEATURE 2005
MEASURED ESTIMATED TOTAL PERCENTAGE OFDISTRESS TYPE SEVERITY QUANTITY QUANTITIY UNITS All DISTRESS
DEPRESSION LOW 12 32 S.F. 3.5LONG.& TRANS. CRACK MED 18 49 L.F. 27LONG.& TRANS. CRACK LOW 120 327 L.F. 51.8RAVELING LOW 55 149 S.F. 17.4
BASIC DISTRESS CAUSES
APPROXIMATE AMOUNT OF DISTRESS RELATED TO LOAD ON THE PAVEMENT IS: 0 %APPROXIMATE AMOUNT OF DISTRESS RELATED TO MATERIALS PROBLEMS IN THE FEATURE IS: 62 %APPROXIMATE AMOUNT OF DISTRESS RELATED TO AGE OF PAVEMENT AND TRAFFIC REPETITIONS IS: 38 %
PAGE 1
AIRPAV
AIRPORT: KNOX-STARKE COUNTY
AIRPAV FEATURE ANALYSIS PROGRAM OUTPUT
FEATURE: DESCRIPTION:
ANALYSIS YEAR: INSPECTION DATE:
PAVEMENT TYPE: AVERAGE PCI AT INSPECTION:
CONSTRUCTION YEAR: ESTIMATED PCI IS:
MINIMUM SERVICE LEVEL: NORMAL PCI FOR THIS AGE:
2005 TEE HANGAR
2013 9-13-r13
AC + 94 GOOD
2006 90 in 2013
55 90
THE FOLLOWING PROJECTS HAVE BEEN SELECTED AS VIABLE ALTERNATIVES
LEGEND DESCRIPTION COST LIFE EXTENSION
NO ACTION N/A N/A
MINIMUM SERVICE LEVEL, CURRENTLY 55
PAGE 2
PROJECTED PERFORMANCE
20
40
60
80
100
2013 2023 2033 2043 2053
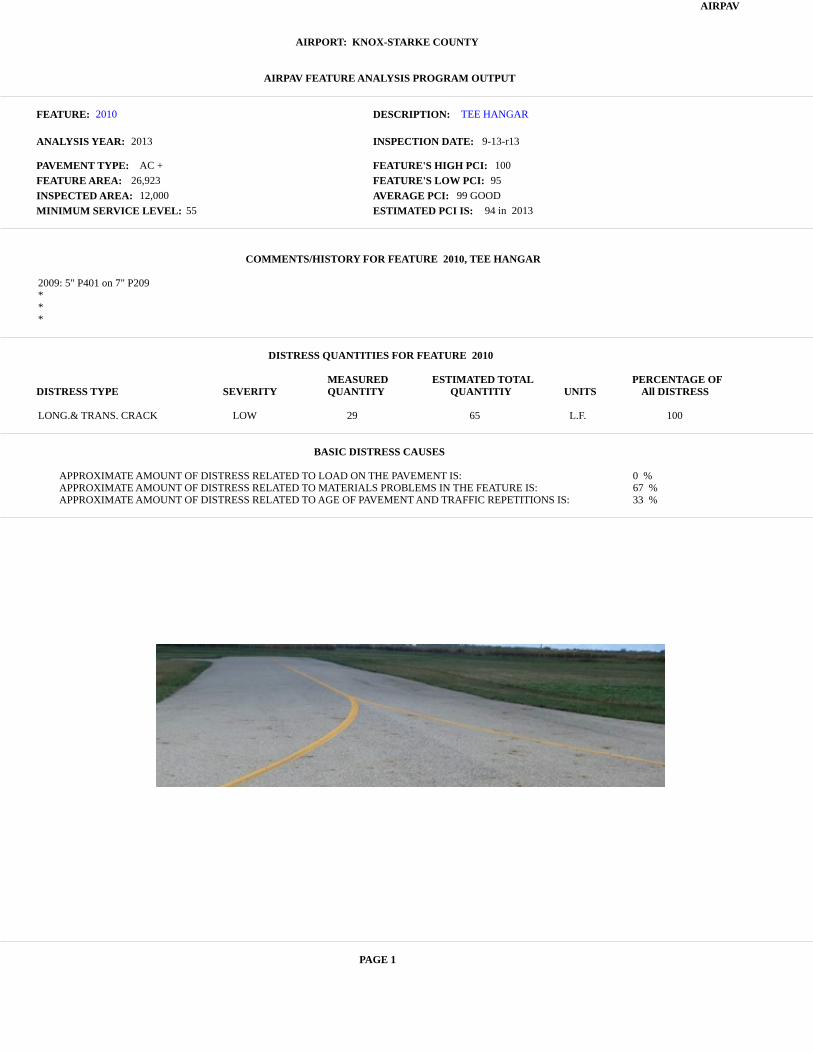
AIRPAV
AIRPORT: KNOX-STARKE COUNTY
AIRPAV FEATURE ANALYSIS PROGRAM OUTPUT
FEATURE: DESCRIPTION:
ANALYSIS YEAR: INSPECTION DATE:
PAVEMENT TYPE: FEATURE'S HIGH PCI:
FEATURE AREA: FEATURE'S LOW PCI:
INSPECTED AREA: AVERAGE PCI:
MINIMUM SERVICE LEVEL: ESTIMATED PCI IS:
2010 TEE HANGAR
2013 9-13-r13
AC + 100
26,923 95
12,000 99 GOOD
55 94 in 2013
COMMENTS/HISTORY FOR FEATURE 2010, TEE HANGAR
2009: 5" P401 on 7" P209***
DISTRESS QUANTITIES FOR FEATURE 2010
MEASURED ESTIMATED TOTAL PERCENTAGE OFDISTRESS TYPE SEVERITY QUANTITY QUANTITIY UNITS All DISTRESS
LONG.& TRANS. CRACK LOW 29 65 L.F. 100
BASIC DISTRESS CAUSES
APPROXIMATE AMOUNT OF DISTRESS RELATED TO LOAD ON THE PAVEMENT IS: 0 %APPROXIMATE AMOUNT OF DISTRESS RELATED TO MATERIALS PROBLEMS IN THE FEATURE IS: 67 %APPROXIMATE AMOUNT OF DISTRESS RELATED TO AGE OF PAVEMENT AND TRAFFIC REPETITIONS IS: 33 %
PAGE 1
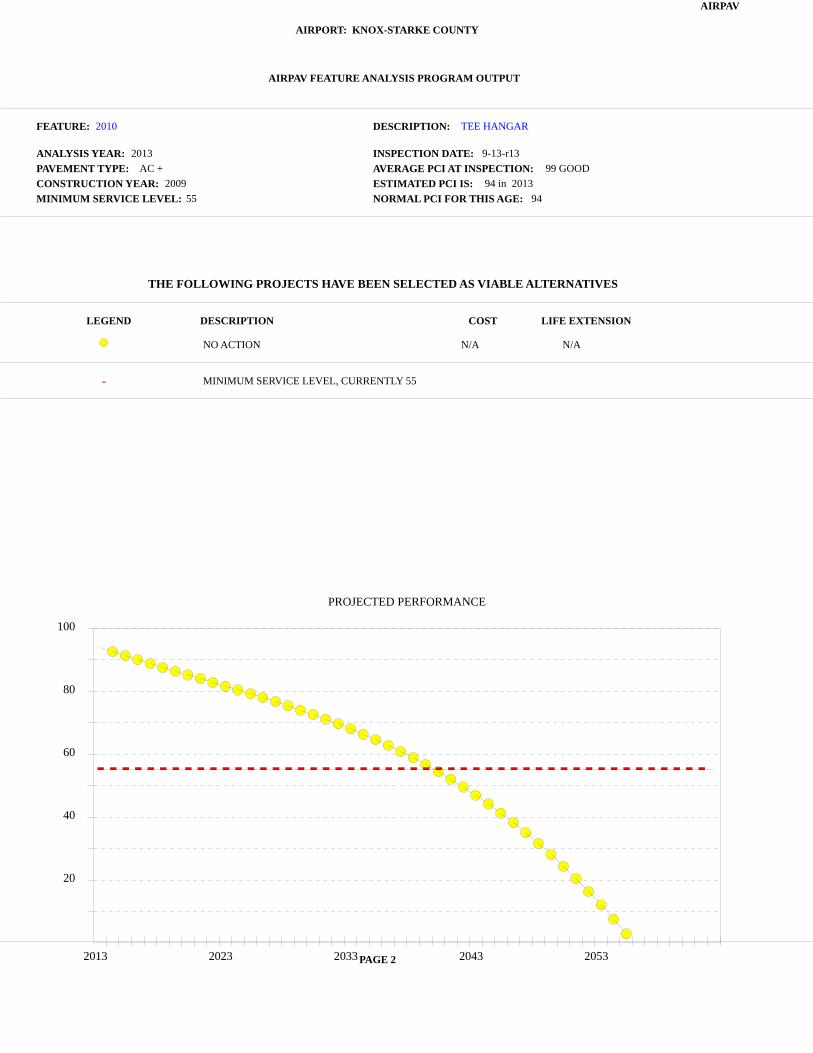
AIRPAV
AIRPORT: KNOX-STARKE COUNTY
AIRPAV FEATURE ANALYSIS PROGRAM OUTPUT
FEATURE: DESCRIPTION:
ANALYSIS YEAR: INSPECTION DATE:
PAVEMENT TYPE: AVERAGE PCI AT INSPECTION:
CONSTRUCTION YEAR: ESTIMATED PCI IS:
MINIMUM SERVICE LEVEL: NORMAL PCI FOR THIS AGE:
2010 TEE HANGAR
2013 9-13-r13
AC + 99 GOOD
2009 94 in 2013
55 94
THE FOLLOWING PROJECTS HAVE BEEN SELECTED AS VIABLE ALTERNATIVES
LEGEND DESCRIPTION COST LIFE EXTENSION
NO ACTION N/A N/A
MINIMUM SERVICE LEVEL, CURRENTLY 55
PAGE 2
PROJECTED PERFORMANCE
20
40
60
80
100
2013 2023 2033 2043 2053
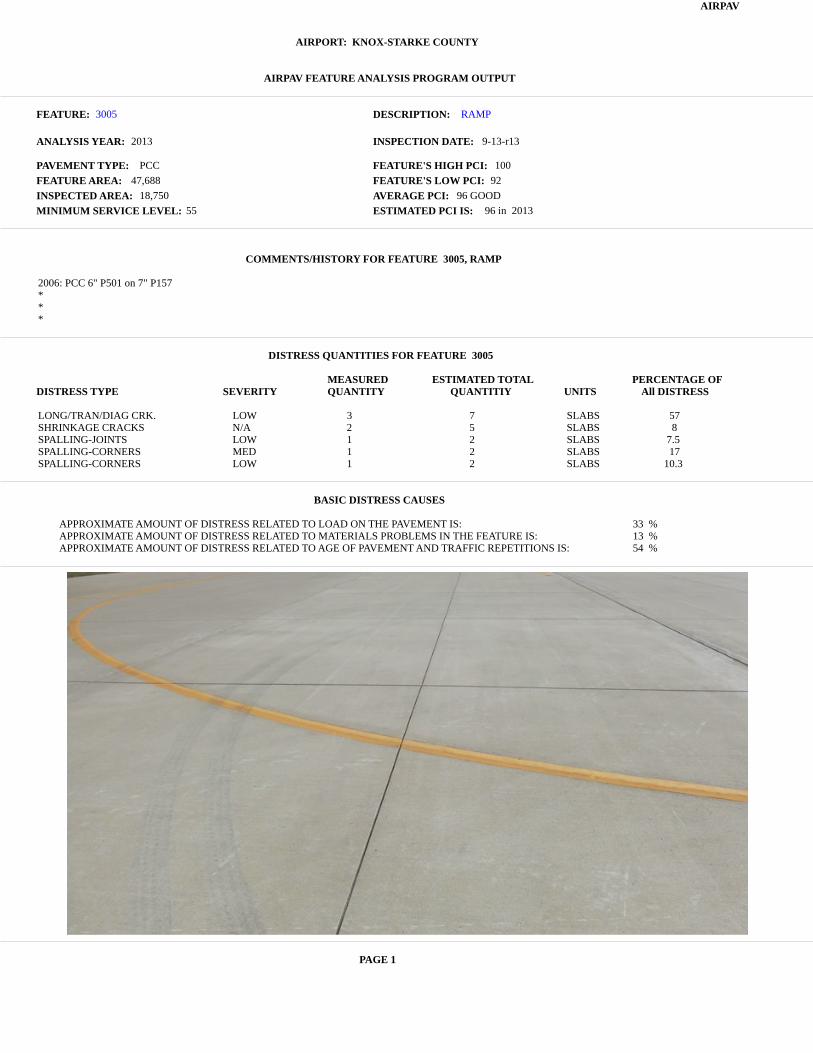
AIRPAV
AIRPORT: KNOX-STARKE COUNTY
AIRPAV FEATURE ANALYSIS PROGRAM OUTPUT
FEATURE: DESCRIPTION:
ANALYSIS YEAR: INSPECTION DATE:
PAVEMENT TYPE: FEATURE'S HIGH PCI:
FEATURE AREA: FEATURE'S LOW PCI:
INSPECTED AREA: AVERAGE PCI:
MINIMUM SERVICE LEVEL: ESTIMATED PCI IS:
3005 RAMP
2013 9-13-r13
PCC 100
47,688 92
18,750 96 GOOD
55 96 in 2013
COMMENTS/HISTORY FOR FEATURE 3005, RAMP
2006: PCC 6" P501 on 7" P157***
DISTRESS QUANTITIES FOR FEATURE 3005
MEASURED ESTIMATED TOTAL PERCENTAGE OFDISTRESS TYPE SEVERITY QUANTITY QUANTITIY UNITS All DISTRESS
LONG/TRAN/DIAG CRK. LOW 3 7 SLABS 57SHRINKAGE CRACKS N/A 2 5 SLABS 8SPALLING-JOINTS LOW 1 2 SLABS 7.5SPALLING-CORNERS MED 1 2 SLABS 17SPALLING-CORNERS LOW 1 2 SLABS 10.3
BASIC DISTRESS CAUSES
APPROXIMATE AMOUNT OF DISTRESS RELATED TO LOAD ON THE PAVEMENT IS: 33 %APPROXIMATE AMOUNT OF DISTRESS RELATED TO MATERIALS PROBLEMS IN THE FEATURE IS: 13 %APPROXIMATE AMOUNT OF DISTRESS RELATED TO AGE OF PAVEMENT AND TRAFFIC REPETITIONS IS: 54 %
PAGE 1
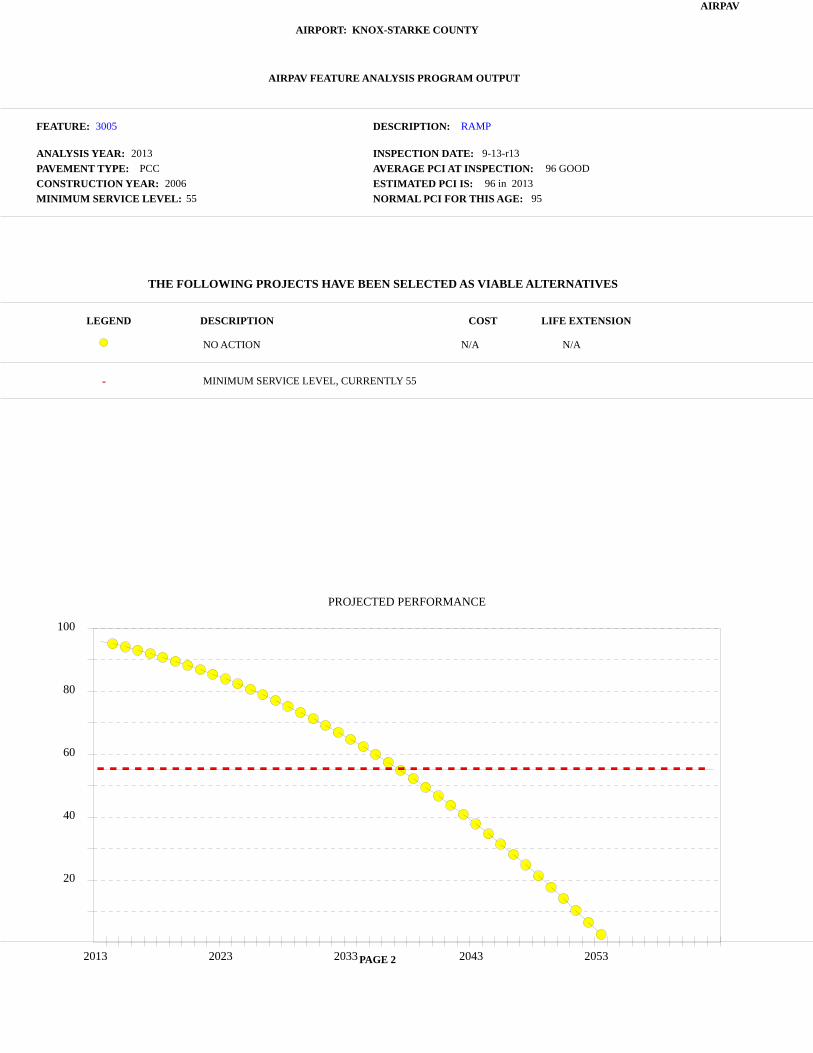
AIRPAV
AIRPORT: KNOX-STARKE COUNTY
AIRPAV FEATURE ANALYSIS PROGRAM OUTPUT
FEATURE: DESCRIPTION:
ANALYSIS YEAR: INSPECTION DATE:
PAVEMENT TYPE: AVERAGE PCI AT INSPECTION:
CONSTRUCTION YEAR: ESTIMATED PCI IS:
MINIMUM SERVICE LEVEL: NORMAL PCI FOR THIS AGE:
3005 RAMP
2013 9-13-r13
PCC 96 GOOD
2006 96 in 2013
55 95
THE FOLLOWING PROJECTS HAVE BEEN SELECTED AS VIABLE ALTERNATIVES
LEGEND DESCRIPTION COST LIFE EXTENSION
NO ACTION N/A N/A
MINIMUM SERVICE LEVEL, CURRENTLY 55
PAGE 2
PROJECTED PERFORMANCE
20
40
60
80
100
2013 2023 2033 2043 2053
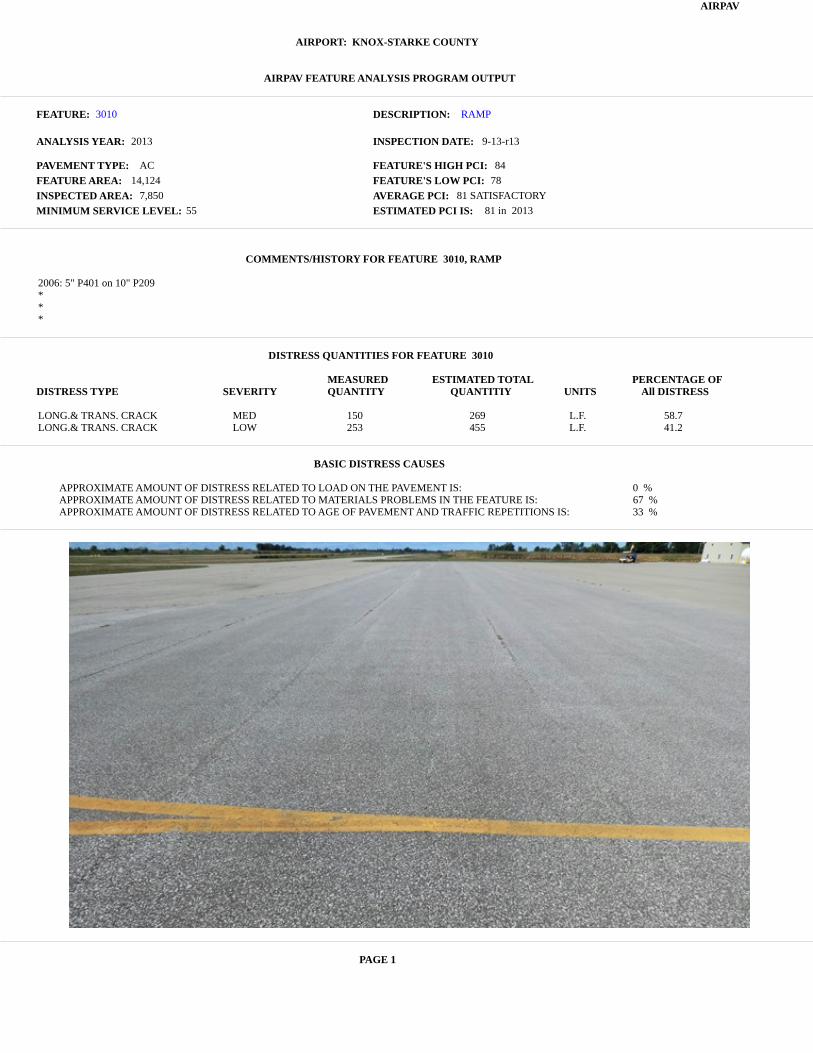
AIRPAV
AIRPORT: KNOX-STARKE COUNTY
AIRPAV FEATURE ANALYSIS PROGRAM OUTPUT
FEATURE: DESCRIPTION:
ANALYSIS YEAR: INSPECTION DATE:
PAVEMENT TYPE: FEATURE'S HIGH PCI:
FEATURE AREA: FEATURE'S LOW PCI:
INSPECTED AREA: AVERAGE PCI:
MINIMUM SERVICE LEVEL: ESTIMATED PCI IS:
3010 RAMP
2013 9-13-r13
AC 84
14,124 78
7,850 81 SATISFACTORY
55 81 in 2013
COMMENTS/HISTORY FOR FEATURE 3010, RAMP
2006: 5" P401 on 10" P209***
DISTRESS QUANTITIES FOR FEATURE 3010
MEASURED ESTIMATED TOTAL PERCENTAGE OFDISTRESS TYPE SEVERITY QUANTITY QUANTITIY UNITS All DISTRESS
LONG.& TRANS. CRACK MED 150 269 L.F. 58.7LONG.& TRANS. CRACK LOW 253 455 L.F. 41.2
BASIC DISTRESS CAUSES
APPROXIMATE AMOUNT OF DISTRESS RELATED TO LOAD ON THE PAVEMENT IS: 0 %APPROXIMATE AMOUNT OF DISTRESS RELATED TO MATERIALS PROBLEMS IN THE FEATURE IS: 67 %APPROXIMATE AMOUNT OF DISTRESS RELATED TO AGE OF PAVEMENT AND TRAFFIC REPETITIONS IS: 33 %
PAGE 1
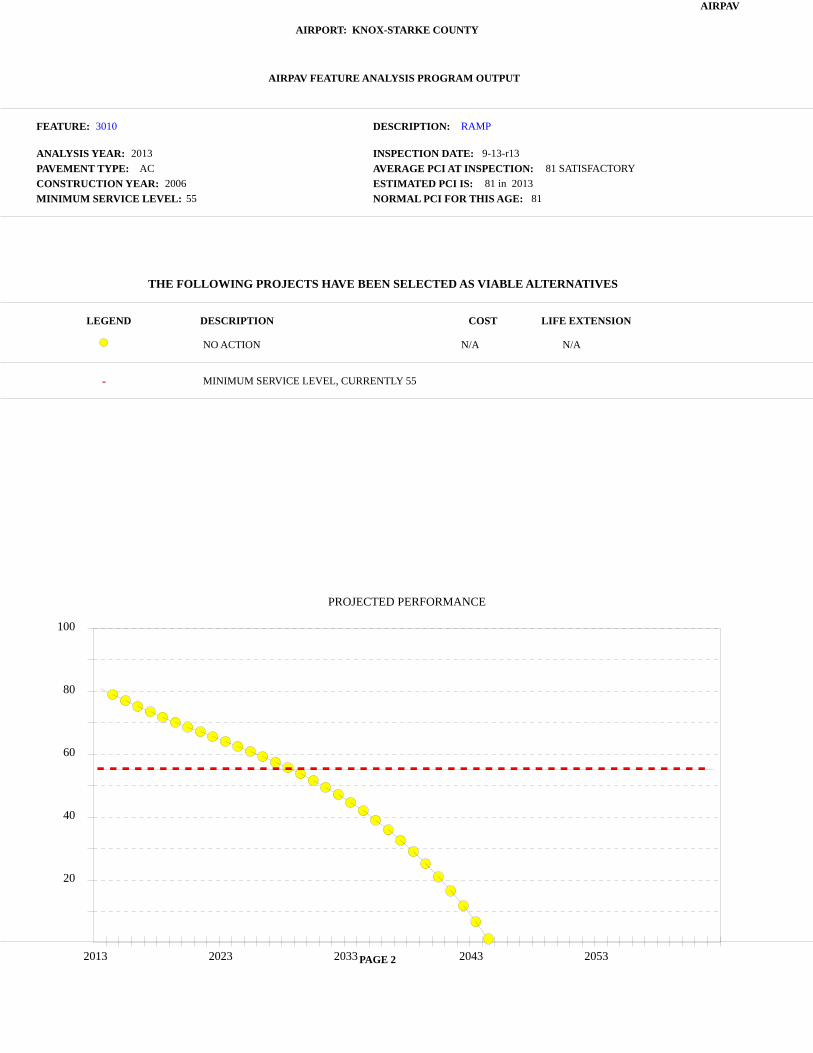
AIRPAV
AIRPORT: KNOX-STARKE COUNTY
AIRPAV FEATURE ANALYSIS PROGRAM OUTPUT
FEATURE: DESCRIPTION:
ANALYSIS YEAR: INSPECTION DATE:
PAVEMENT TYPE: AVERAGE PCI AT INSPECTION:
CONSTRUCTION YEAR: ESTIMATED PCI IS:
MINIMUM SERVICE LEVEL: NORMAL PCI FOR THIS AGE:
3010 RAMP
2013 9-13-r13
AC 81 SATISFACTORY
2006 81 in 2013
55 81
THE FOLLOWING PROJECTS HAVE BEEN SELECTED AS VIABLE ALTERNATIVES
LEGEND DESCRIPTION COST LIFE EXTENSION
NO ACTION N/A N/A
MINIMUM SERVICE LEVEL, CURRENTLY 55
PAGE 2
PROJECTED PERFORMANCE
20
40
60
80
100
2013 2023 2033 2043 2053

AIRPAV
AIRPORT: KNOX-STARKE COUNTY
AIRPAV FEATURE ANALYSIS PROGRAM OUTPUT
FEATURE: DESCRIPTION:
ANALYSIS YEAR: INSPECTION DATE:
PAVEMENT TYPE: FEATURE'S HIGH PCI:
FEATURE AREA: FEATURE'S LOW PCI:
INSPECTED AREA: AVERAGE PCI:
MINIMUM SERVICE LEVEL: ESTIMATED PCI IS:
3015 FUELING RAMP
2013 9-13-r13
PCC 100
11,066 99
8,935 99 GOOD
55 99 in 2013
COMMENTS/HISTORY FOR FEATURE 3015, FUELING RAMP
2009: PCC 8" P501 on 4" P209***
DISTRESS QUANTITIES FOR FEATURE 3015
MEASURED ESTIMATED TOTAL PERCENTAGE OFDISTRESS TYPE SEVERITY QUANTITY QUANTITIY UNITS All DISTRESS
SHRINKAGE CRACKS N/A 2 2 SLABS 100
BASIC DISTRESS CAUSES
APPROXIMATE AMOUNT OF DISTRESS RELATED TO LOAD ON THE PAVEMENT IS: 0 %APPROXIMATE AMOUNT OF DISTRESS RELATED TO MATERIALS PROBLEMS IN THE FEATURE IS: 50 %APPROXIMATE AMOUNT OF DISTRESS RELATED TO AGE OF PAVEMENT AND TRAFFIC REPETITIONS IS: 50 %
PAGE 1
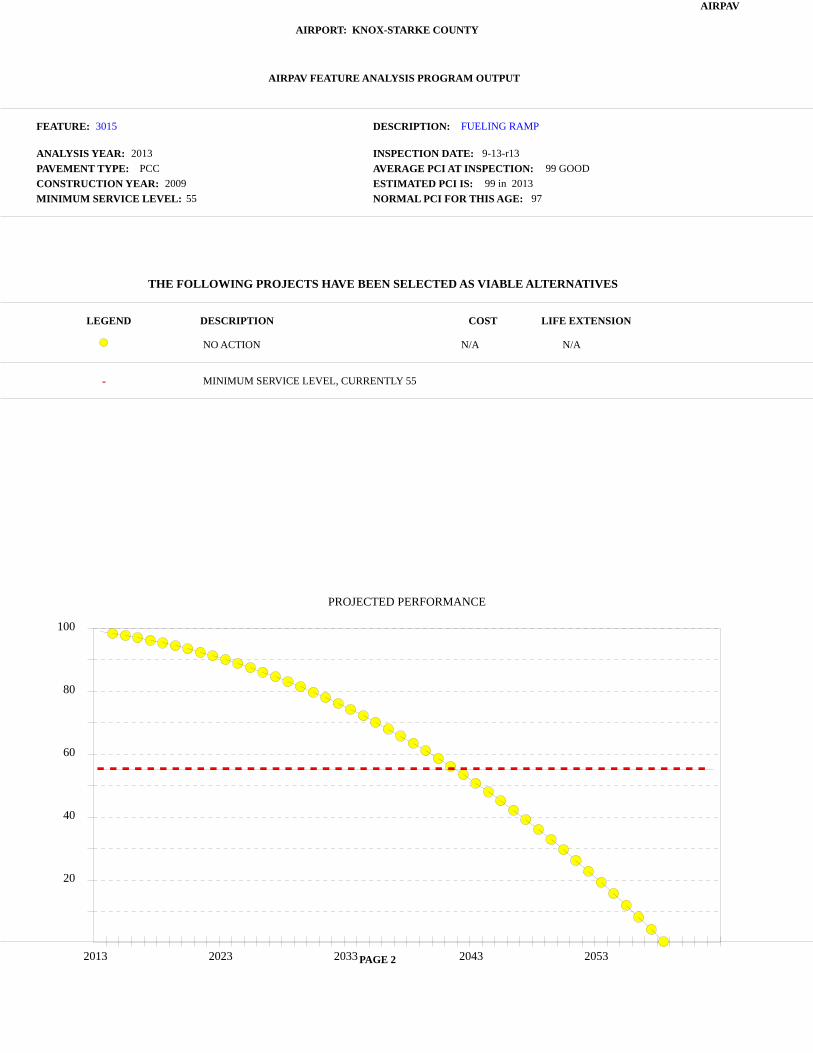
AIRPAV
AIRPORT: KNOX-STARKE COUNTY
AIRPAV FEATURE ANALYSIS PROGRAM OUTPUT
FEATURE: DESCRIPTION:
ANALYSIS YEAR: INSPECTION DATE:
PAVEMENT TYPE: AVERAGE PCI AT INSPECTION:
CONSTRUCTION YEAR: ESTIMATED PCI IS:
MINIMUM SERVICE LEVEL: NORMAL PCI FOR THIS AGE:
3015 FUELING RAMP
2013 9-13-r13
PCC 99 GOOD
2009 99 in 2013
55 97
THE FOLLOWING PROJECTS HAVE BEEN SELECTED AS VIABLE ALTERNATIVES
LEGEND DESCRIPTION COST LIFE EXTENSION
NO ACTION N/A N/A
MINIMUM SERVICE LEVEL, CURRENTLY 55
PAGE 2
PROJECTED PERFORMANCE
20
40
60
80
100
2013 2023 2033 2043 2053

AIRPAV
AIRPORT: KNOX-STARKE COUNTY
AIRPAV FEATURE ANALYSIS PROGRAM OUTPUT
FEATURE: DESCRIPTION:
ANALYSIS YEAR: INSPECTION DATE:
PAVEMENT TYPE: FEATURE'S HIGH PCI:
FEATURE AREA: FEATURE'S LOW PCI:
INSPECTED AREA: AVERAGE PCI:
MINIMUM SERVICE LEVEL: ESTIMATED PCI IS:
4005 TAXIWAY A-2
2013 9-13-r13
AC 43
15,336 41
8,000 42 POOR
55 42 in 2013
COMMENTS/HISTORY FOR FEATURE 4005, TAXIWAY A-2
1995: 5" P401 ON 9" P209 ON LIME TREATED SUBGRADE***
DISTRESS QUANTITIES FOR FEATURE 4005
MEASURED ESTIMATED TOTAL PERCENTAGE OFDISTRESS TYPE SEVERITY QUANTITY QUANTITIY UNITS All DISTRESS
ALLIGATOR CRACKING MED 2 3 S.F. 5.1LONG.& TRANS. CRACK HIGH 3 5 L.F. 3.6LONG.& TRANS. CRACK MED 663 1,271 L.F. 34LONG.& TRANS. CRACK LOW 396 759 L.F. 14.4PATCH & UTILITY CUT HIGH 55 105 S.F. 10.3PATCH & UTILITY CUT MED 16 30 S.F. 3.8PATCH & UTILITY CUT LOW 1,145 2,194 S.F. 18RAVELING LOW 120 230 S.F. 2.7RUTTING LOW 33 63 S.F. 7.8
BASIC DISTRESS CAUSES
APPROXIMATE AMOUNT OF DISTRESS RELATED TO LOAD ON THE PAVEMENT IS: 32 %APPROXIMATE AMOUNT OF DISTRESS RELATED TO MATERIALS PROBLEMS IN THE FEATURE IS: 49 %APPROXIMATE AMOUNT OF DISTRESS RELATED TO AGE OF PAVEMENT AND TRAFFIC REPETITIONS IS: 19 %
PAGE 1

AIRPAV
AIRPORT: KNOX-STARKE COUNTY
AIRPAV FEATURE ANALYSIS PROGRAM OUTPUT
FEATURE: DESCRIPTION:
ANALYSIS YEAR: INSPECTION DATE:
PAVEMENT TYPE: AVERAGE PCI AT INSPECTION:
CONSTRUCTION YEAR: ESTIMATED PCI IS:
MINIMUM SERVICE LEVEL: NORMAL PCI FOR THIS AGE:
4005 TAXIWAY A-2
2013 9-13-r13
AC 42 POOR
1995 42 in 2013
55 64
THE FOLLOWING PROJECTS HAVE BEEN SELECTED AS VIABLE ALTERNATIVES
LEGEND DESCRIPTION COST LIFE EXTENSION
RESURFACING $22,083 23 YEARS
SURFACE TREATMENT $7,563 4 YEARS
NO ACTION N/A N/A
MINIMUM SERVICE LEVEL, CURRENTLY 55
PAGE 2
PROJECTED PERFORMANCE
20
40
60
80
100
2013 2023 2033 2043 2053
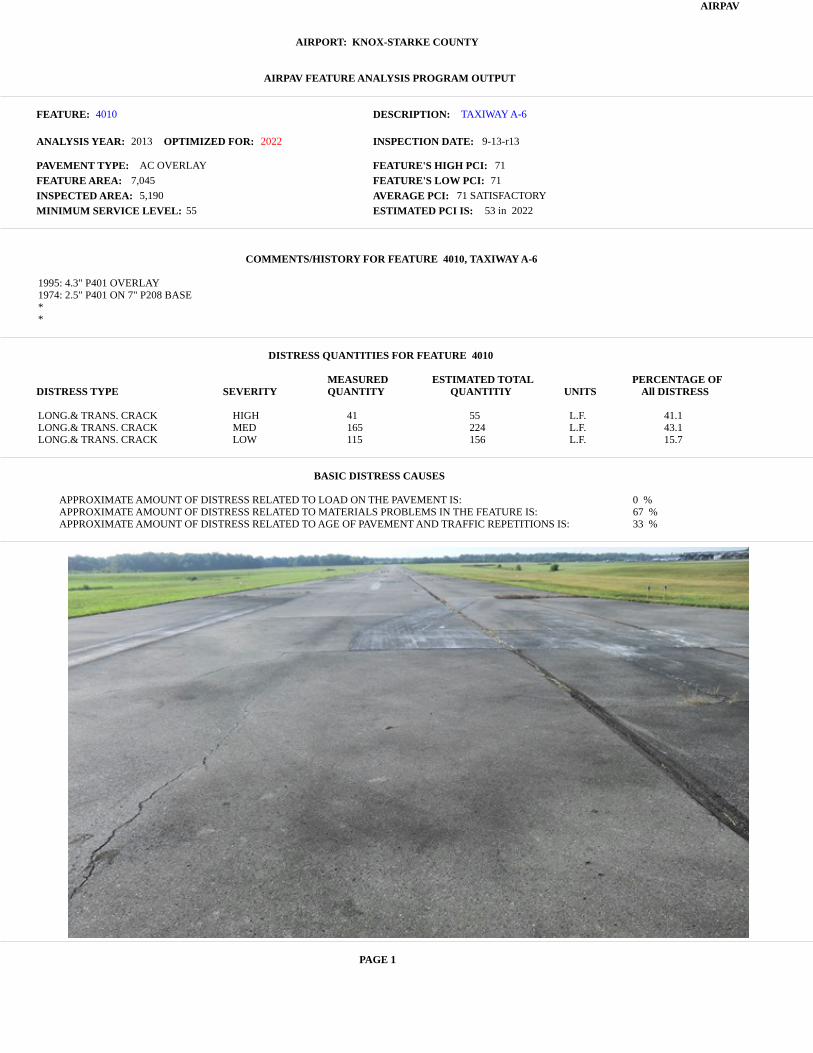
AIRPAV
AIRPORT: KNOX-STARKE COUNTY
AIRPAV FEATURE ANALYSIS PROGRAM OUTPUT
FEATURE: DESCRIPTION:
ANALYSIS YEAR: INSPECTION DATE: OPTIMIZED FOR:
PAVEMENT TYPE: FEATURE'S HIGH PCI:
FEATURE AREA: FEATURE'S LOW PCI:
INSPECTED AREA: AVERAGE PCI:
MINIMUM SERVICE LEVEL: ESTIMATED PCI IS:
4010 TAXIWAY A-6
2013 9-13-r13 2022
AC OVERLAY 71
7,045 71
5,190 71 SATISFACTORY
55 53 in 2022
COMMENTS/HISTORY FOR FEATURE 4010, TAXIWAY A-6
1995: 4.3" P401 OVERLAY1974: 2.5" P401 ON 7" P208 BASE**
DISTRESS QUANTITIES FOR FEATURE 4010
MEASURED ESTIMATED TOTAL PERCENTAGE OFDISTRESS TYPE SEVERITY QUANTITY QUANTITIY UNITS All DISTRESS
LONG.& TRANS. CRACK HIGH 41 55 L.F. 41.1LONG.& TRANS. CRACK MED 165 224 L.F. 43.1LONG.& TRANS. CRACK LOW 115 156 L.F. 15.7
BASIC DISTRESS CAUSES
APPROXIMATE AMOUNT OF DISTRESS RELATED TO LOAD ON THE PAVEMENT IS: 0 %APPROXIMATE AMOUNT OF DISTRESS RELATED TO MATERIALS PROBLEMS IN THE FEATURE IS: 67 %APPROXIMATE AMOUNT OF DISTRESS RELATED TO AGE OF PAVEMENT AND TRAFFIC REPETITIONS IS: 33 %
PAGE 1
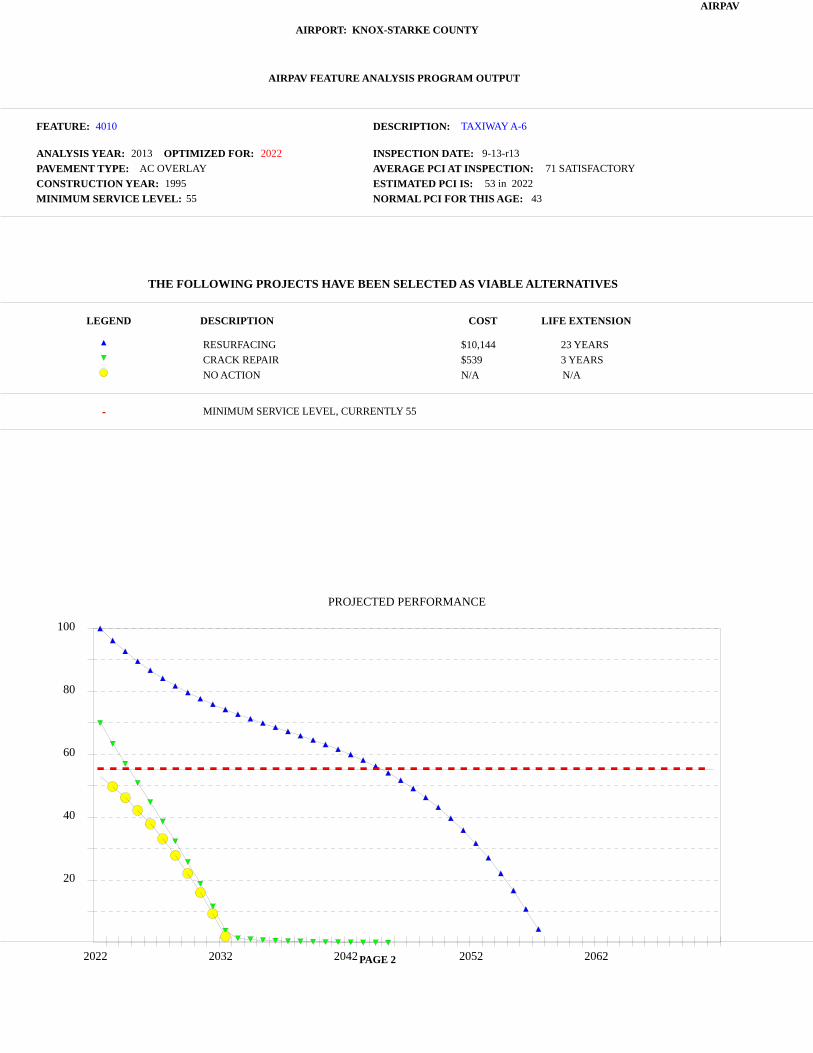
AIRPAV
AIRPORT: KNOX-STARKE COUNTY
AIRPAV FEATURE ANALYSIS PROGRAM OUTPUT
FEATURE: DESCRIPTION:
ANALYSIS YEAR: INSPECTION DATE: OPTIMIZED FOR:
PAVEMENT TYPE: AVERAGE PCI AT INSPECTION:
CONSTRUCTION YEAR: ESTIMATED PCI IS:
MINIMUM SERVICE LEVEL: NORMAL PCI FOR THIS AGE:
4010 TAXIWAY A-6
2013 9-13-r13 2022
AC OVERLAY 71 SATISFACTORY
1995 53 in 2022
55 43
THE FOLLOWING PROJECTS HAVE BEEN SELECTED AS VIABLE ALTERNATIVES
LEGEND DESCRIPTION COST LIFE EXTENSION
RESURFACING $10,144 23 YEARS
CRACK REPAIR $539 3 YEARS
NO ACTION N/A N/A
MINIMUM SERVICE LEVEL, CURRENTLY 55
PAGE 2
PROJECTED PERFORMANCE
20
40
60
80
100
2022 2032 2042 2052 2062

AIRPAV
AIRPORT: KNOX-STARKE COUNTY
AIRPAV FEATURE ANALYSIS PROGRAM OUTPUT
FEATURE: DESCRIPTION:
ANALYSIS YEAR: INSPECTION DATE: OPTIMIZED FOR:
PAVEMENT TYPE: FEATURE'S HIGH PCI:
FEATURE AREA: FEATURE'S LOW PCI:
INSPECTED AREA: AVERAGE PCI:
MINIMUM SERVICE LEVEL: ESTIMATED PCI IS:
6005 RUNWAY 18-36
2013 9-13-r13 2022
AC 75
30,337 71
15,000 73 SATISFACTORY
60 58 in 2022
COMMENTS/HISTORY FOR FEATURE 6005, RUNWAY 18-36
1995: 5" P401 ON 9" P209 ON LIME TREATED SUBBASE***
DISTRESS QUANTITIES FOR FEATURE 6005
MEASURED ESTIMATED TOTAL PERCENTAGE OFDISTRESS TYPE SEVERITY QUANTITY QUANTITIY UNITS All DISTRESS
LONG.& TRANS. CRACK MED 342 691 L.F. 40.2LONG.& TRANS. CRACK LOW 1,095 2,214 L.F. 50RAVELING HIGH 5 10 S.F. 4.7WEATHERING MED 350 707 S.F. 3.6WEATHERING LOW 700 1,415 S.F. 1.3
BASIC DISTRESS CAUSES
APPROXIMATE AMOUNT OF DISTRESS RELATED TO LOAD ON THE PAVEMENT IS: 0 %APPROXIMATE AMOUNT OF DISTRESS RELATED TO MATERIALS PROBLEMS IN THE FEATURE IS: 63 %APPROXIMATE AMOUNT OF DISTRESS RELATED TO AGE OF PAVEMENT AND TRAFFIC REPETITIONS IS: 37 %
PAGE 1

AIRPAV
AIRPORT: KNOX-STARKE COUNTY
AIRPAV FEATURE ANALYSIS PROGRAM OUTPUT
FEATURE: DESCRIPTION:
ANALYSIS YEAR: INSPECTION DATE: OPTIMIZED FOR:
PAVEMENT TYPE: AVERAGE PCI AT INSPECTION:
CONSTRUCTION YEAR: ESTIMATED PCI IS:
MINIMUM SERVICE LEVEL: NORMAL PCI FOR THIS AGE:
6005 RUNWAY 18-36
2013 9-13-r13 2022
AC 73 SATISFACTORY
1995 58 in 2022
60 48
THE FOLLOWING PROJECTS HAVE BEEN SELECTED AS VIABLE ALTERNATIVES
LEGEND DESCRIPTION COST LIFE EXTENSION
RESURFACING $43,685 20 YEARS
SURFACE TREATMENT $12,688 7 YEARS
NO ACTION N/A N/A
MINIMUM SERVICE LEVEL, CURRENTLY 60
PAGE 2
PROJECTED PERFORMANCE
20
40
60
80
100
2022 2032 2042 2052 2062
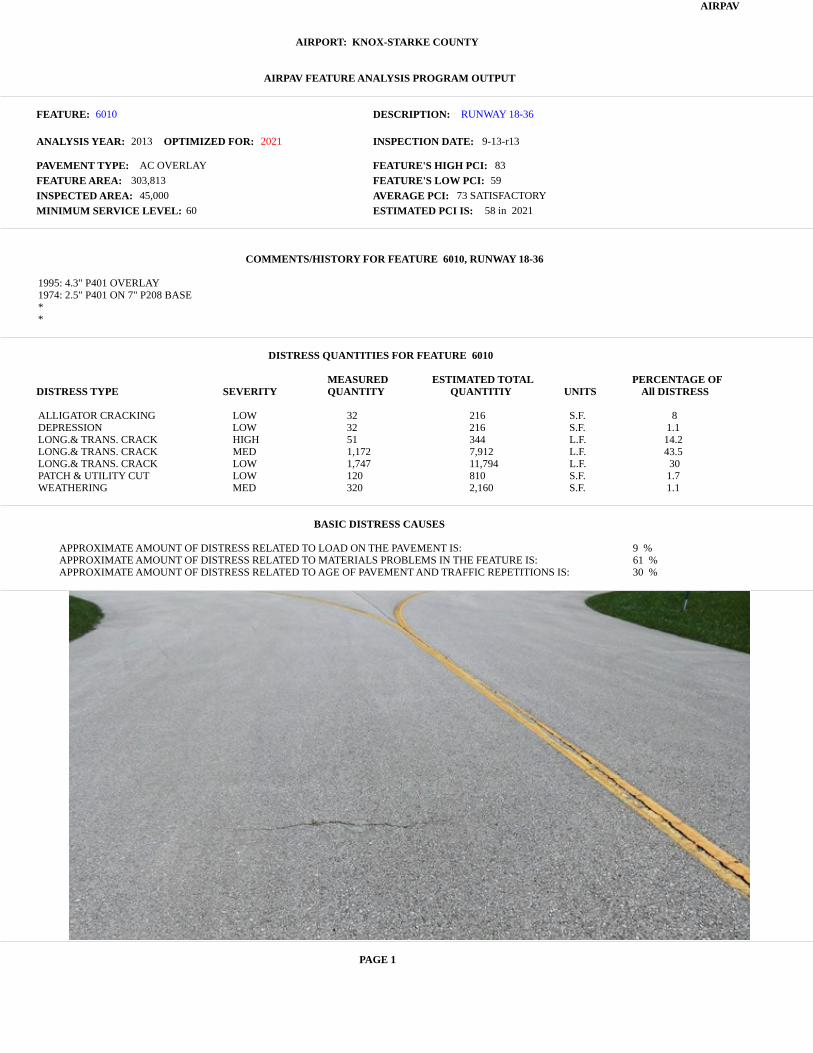
AIRPAV
AIRPORT: KNOX-STARKE COUNTY
AIRPAV FEATURE ANALYSIS PROGRAM OUTPUT
FEATURE: DESCRIPTION:
ANALYSIS YEAR: INSPECTION DATE: OPTIMIZED FOR:
PAVEMENT TYPE: FEATURE'S HIGH PCI:
FEATURE AREA: FEATURE'S LOW PCI:
INSPECTED AREA: AVERAGE PCI:
MINIMUM SERVICE LEVEL: ESTIMATED PCI IS:
6010 RUNWAY 18-36
2013 9-13-r13 2021
AC OVERLAY 83
303,813 59
45,000 73 SATISFACTORY
60 58 in 2021
COMMENTS/HISTORY FOR FEATURE 6010, RUNWAY 18-36
1995: 4.3" P401 OVERLAY1974: 2.5" P401 ON 7" P208 BASE**
DISTRESS QUANTITIES FOR FEATURE 6010
MEASURED ESTIMATED TOTAL PERCENTAGE OFDISTRESS TYPE SEVERITY QUANTITY QUANTITIY UNITS All DISTRESS
ALLIGATOR CRACKING LOW 32 216 S.F. 8DEPRESSION LOW 32 216 S.F. 1.1LONG.& TRANS. CRACK HIGH 51 344 L.F. 14.2LONG.& TRANS. CRACK MED 1,172 7,912 L.F. 43.5LONG.& TRANS. CRACK LOW 1,747 11,794 L.F. 30PATCH & UTILITY CUT LOW 120 810 S.F. 1.7WEATHERING MED 320 2,160 S.F. 1.1
BASIC DISTRESS CAUSES
APPROXIMATE AMOUNT OF DISTRESS RELATED TO LOAD ON THE PAVEMENT IS: 9 %APPROXIMATE AMOUNT OF DISTRESS RELATED TO MATERIALS PROBLEMS IN THE FEATURE IS: 61 %APPROXIMATE AMOUNT OF DISTRESS RELATED TO AGE OF PAVEMENT AND TRAFFIC REPETITIONS IS: 30 %
PAGE 1
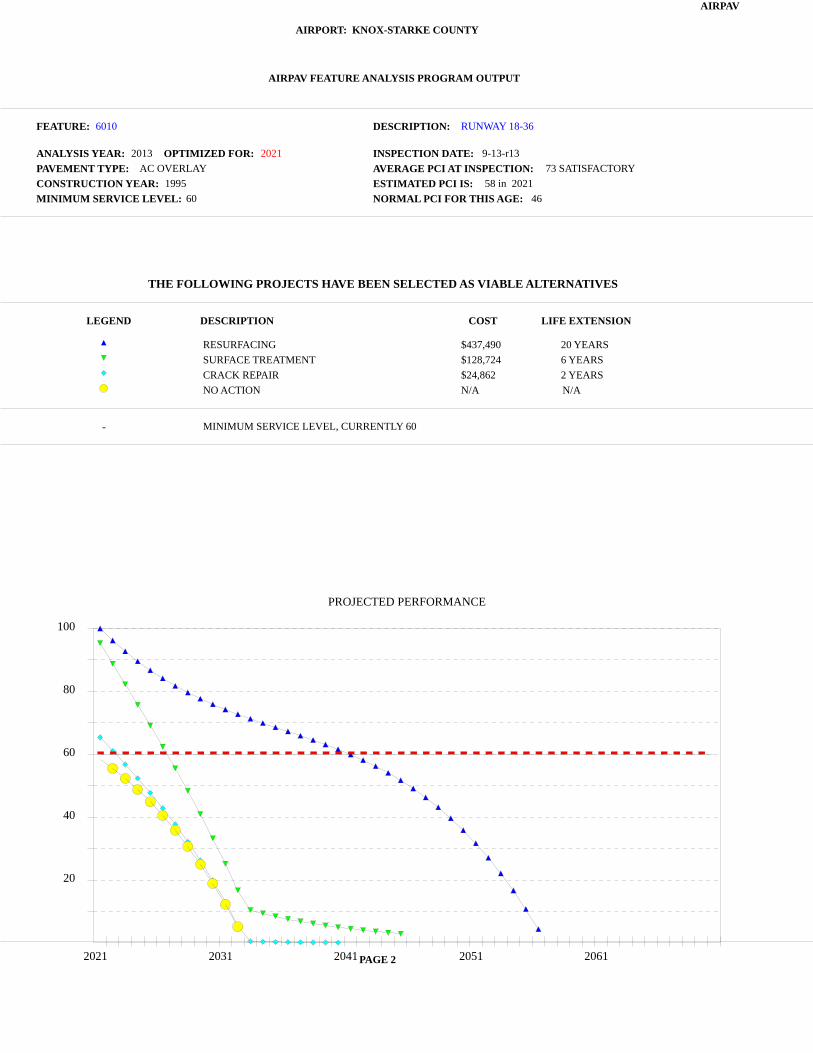
AIRPAV
AIRPORT: KNOX-STARKE COUNTY
AIRPAV FEATURE ANALYSIS PROGRAM OUTPUT
FEATURE: DESCRIPTION:
ANALYSIS YEAR: INSPECTION DATE: OPTIMIZED FOR:
PAVEMENT TYPE: AVERAGE PCI AT INSPECTION:
CONSTRUCTION YEAR: ESTIMATED PCI IS:
MINIMUM SERVICE LEVEL: NORMAL PCI FOR THIS AGE:
6010 RUNWAY 18-36
2013 9-13-r13 2021
AC OVERLAY 73 SATISFACTORY
1995 58 in 2021
60 46
THE FOLLOWING PROJECTS HAVE BEEN SELECTED AS VIABLE ALTERNATIVES
LEGEND DESCRIPTION COST LIFE EXTENSION
RESURFACING $437,490 20 YEARS
SURFACE TREATMENT $128,724 6 YEARS
CRACK REPAIR $24,862 2 YEARS
NO ACTION N/A N/A
MINIMUM SERVICE LEVEL, CURRENTLY 60
PAGE 2
PROJECTED PERFORMANCE
20
40
60
80
100
2021 2031 2041 2051 2061

Pavement Condition Report, Starke County Airport 70
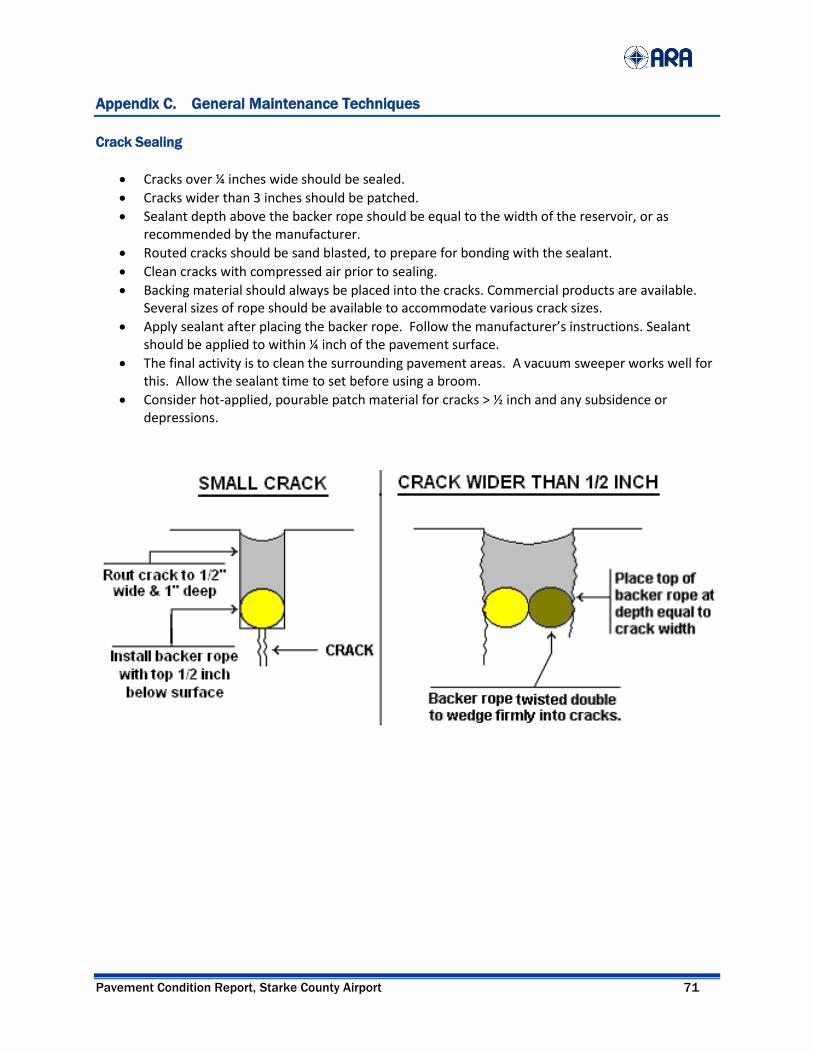
Pavement Condition Report, Starke County Airport 71
Appendix C. General Maintenance Techniques
Crack Sealing
Cracks over ¼ inches wide should be sealed.
Cracks wider than 3 inches should be patched.
Sealant depth above the backer rope should be equal to the width of the reservoir, or as recommended by the manufacturer.
Routed cracks should be sand blasted, to prepare for bonding with the sealant.
Clean cracks with compressed air prior to sealing.
Backing material should always be placed into the cracks. Commercial products are available. Several sizes of rope should be available to accommodate various crack sizes.
Apply sealant after placing the backer rope. Follow the manufacturer’s instructions. Sealant should be applied to within ¼ inch of the pavement surface.
The final activity is to clean the surrounding pavement areas. A vacuum sweeper works well for this. Allow the sealant time to set before using a broom.
Consider hot-applied, pourable patch material for cracks > ½ inch and any subsidence or depressions.

Pavement Condition Report, Starke County Airport 72
Overband Technique
An alternate crack sealing technique using the procedures outlined below. Material
Blend grade 20 or equivalent asphalt cement and latex rubber at 5 percent by weight asphalt.
Again, at 5 percent by weight of asphalt, add polyester fibers into agitator tank.
Maintain blended asphalt temperature at least 20 degrees below flash point.
Continuously recycle hot blended asphalt through pumps and hoses when heating kettle is in standby mode.
Application
Sealant should be applied to dry pavement, with ambient temperatures above 40 degrees.
Cracks should be sand cleaned and blown free of debris immediately before sealing.
Application of sealant immediately follows cleaning of the crack.
Sealant should be pressure applied from a wand-type applicator with “overband” nozzle.
Seat the sealant with a steel-wheeled roller immediately after placement.
In wider cracks, a backer rope is recommended to limit material quantities required.
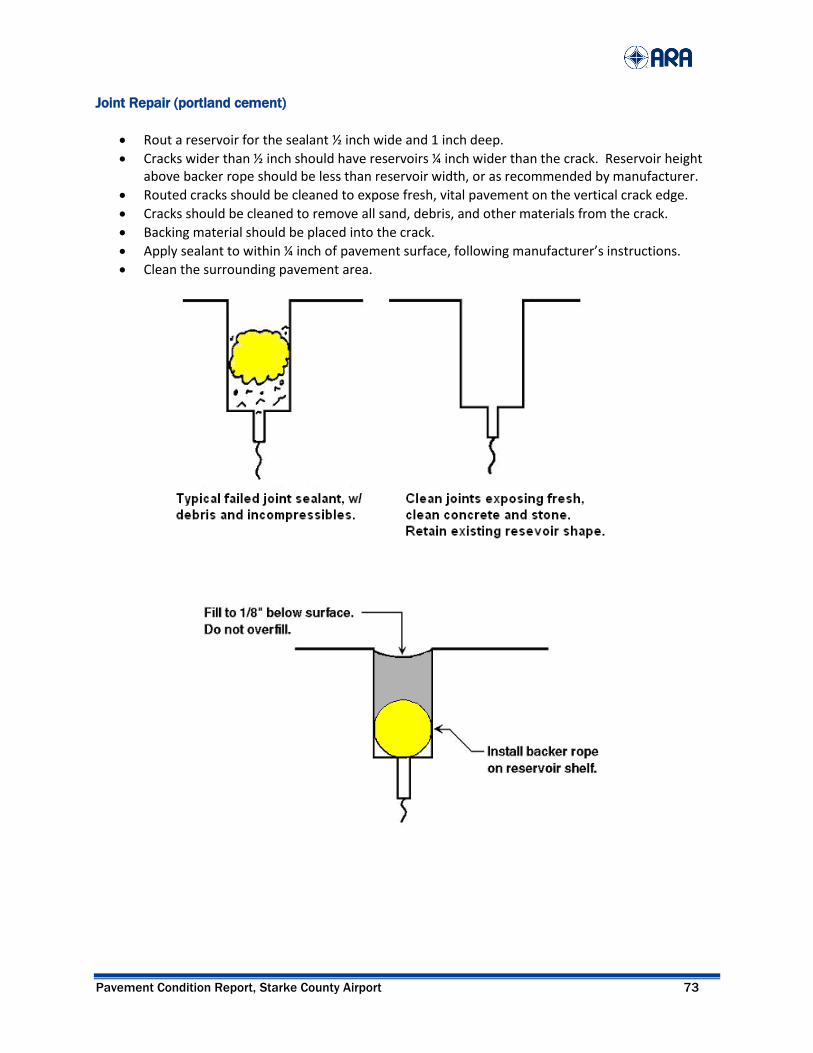
Pavement Condition Report, Starke County Airport 73
Joint Repair (portland cement)
Rout a reservoir for the sealant ½ inch wide and 1 inch deep.
Cracks wider than ½ inch should have reservoirs ¼ inch wider than the crack. Reservoir height above backer rope should be less than reservoir width, or as recommended by manufacturer.
Routed cracks should be cleaned to expose fresh, vital pavement on the vertical crack edge.
Cracks should be cleaned to remove all sand, debris, and other materials from the crack.
Backing material should be placed into the crack.
Apply sealant to within ¼ inch of pavement surface, following manufacturer’s instructions.
Clean the surrounding pavement area.
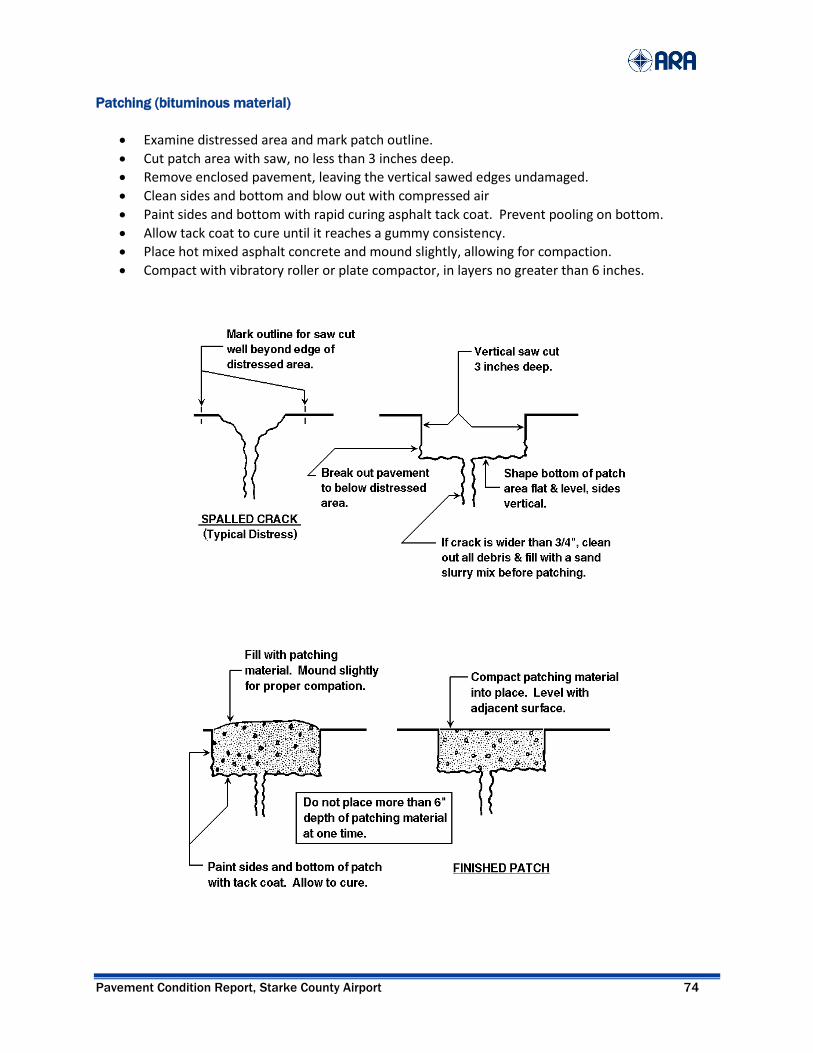
Pavement Condition Report, Starke County Airport 74
Patching (bituminous material)
Examine distressed area and mark patch outline.
Cut patch area with saw, no less than 3 inches deep.
Remove enclosed pavement, leaving the vertical sawed edges undamaged.
Clean sides and bottom and blow out with compressed air
Paint sides and bottom with rapid curing asphalt tack coat. Prevent pooling on bottom.
Allow tack coat to cure until it reaches a gummy consistency.
Place hot mixed asphalt concrete and mound slightly, allowing for compaction.
Compact with vibratory roller or plate compactor, in layers no greater than 6 inches.

Pavement Condition Report, Starke County Airport 75
Patching (pourable materials)
Hot-applied, pourable materials generally are used to repair deficiencies larger than can be repaired by sealants, but smaller than those where traditional techniques would be required. Suggested uses for this type of repair include cracks over 2 inches wide, potholes less than 4 inches deep, as a leveling for small depressions, as a cap for settled utility cuts, and as a skin patch for areas of alligator cracking.
Examine and mark the patch outline. Boundaries should extend to sound pavement.
Apply patch material to clean, dry surfaces.
A heating lance to preheat or dry existing pavement is recommended in cold or wet conditions.
Patch material should be poured into the area to be repaired and leveled as appropriate.
Patch edges should be sealed after application to assure good adhesion, preventing surface moisture from migrating under patch edges.

Pavement Condition Report, Starke County Airport 76
Patching (PCC)
The technique outlined here simulates a thin bonded PCC overlay. This procedure has been proven effective in service throughout the country.
Examine and mark patch outline.
Saw cut area to a depth of 2 inches. The enclosed area is then chipped or jack hammered to solid pavement, but not less than a 2-inch nominal depth.
The sides and bottom are sand cleaned and air-blasted to expose vital, clean concrete.
A 25 percent solution of muriatic acid is applied to all exposed surfaces within the patch.
The muriatic acid solution is thoroughly flushed from the patch area with water.
Compressed air is used to remove excess water from the area, but exposed concrete must be maintained in a moist condition.
The sides and bottom of the area are then coated with approximately a 1/16-inch layer of cement grout applied at the consistency of paste. The grout acts as an adhesive to bond the fresh concrete to existing concrete.
If the patch is adjacent to joints, the continuity of the joint must be maintained by placing inserts approximately the shape of the desired joint against the wall of the patch.
Before concrete grout begins to dry, concrete is placed in the patch area and is compacted into position with hand tampers or a vibrating plate tamper.
When the patch has been struck to the proper slope and elevation, a surface texture is applied to approximate the texture of adjacent pavement.
Joint edges may be edged slightly to remove sharp edges. The patch should be covered with polyethylene or sprayed with a curing compound.
Clean the surrounding pavement before concrete spillover has a chance to set up.
The patch may be open to traffic in 72 hours.
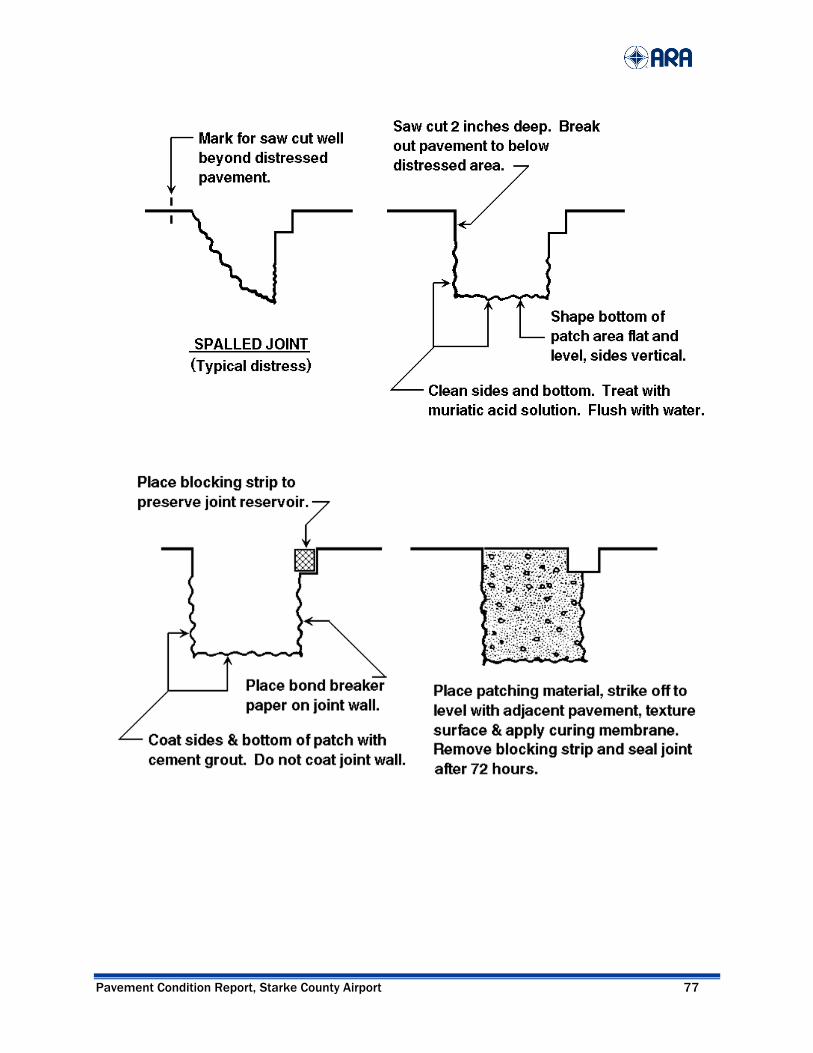
Pavement Condition Report, Starke County Airport 77

Pavement Condition Report, Starke County Airport 78

Pavement Condition Report, Starke County Airport 79
Appendix D. PCI Summary
The PCI summary provides an index of pavement conditions at the airport. The letter in the first column indicates the type of pavement, asphalt or portland cement. The last column lists the distress types found in each sample unit. The distress types are listed by a numbering code for each type of pavement, shown at the beginning of the summary.
Sample units marked with an asterisk (*) are additional sample units. Additional sample units do not represent the typical condition of surrounding sample units in the pavement features. The PCI summary provides a quick overview of the pavement condition and consistency. Are the distress types similar? Do the individual sample units have consistent PCI ratings? Answering these questions is a start to understanding your dynamic pavement system.
Distress Codes
Distress in Sample Unit
Additional Sample Unit
Pavement Type
Sample Unit
Average PCI
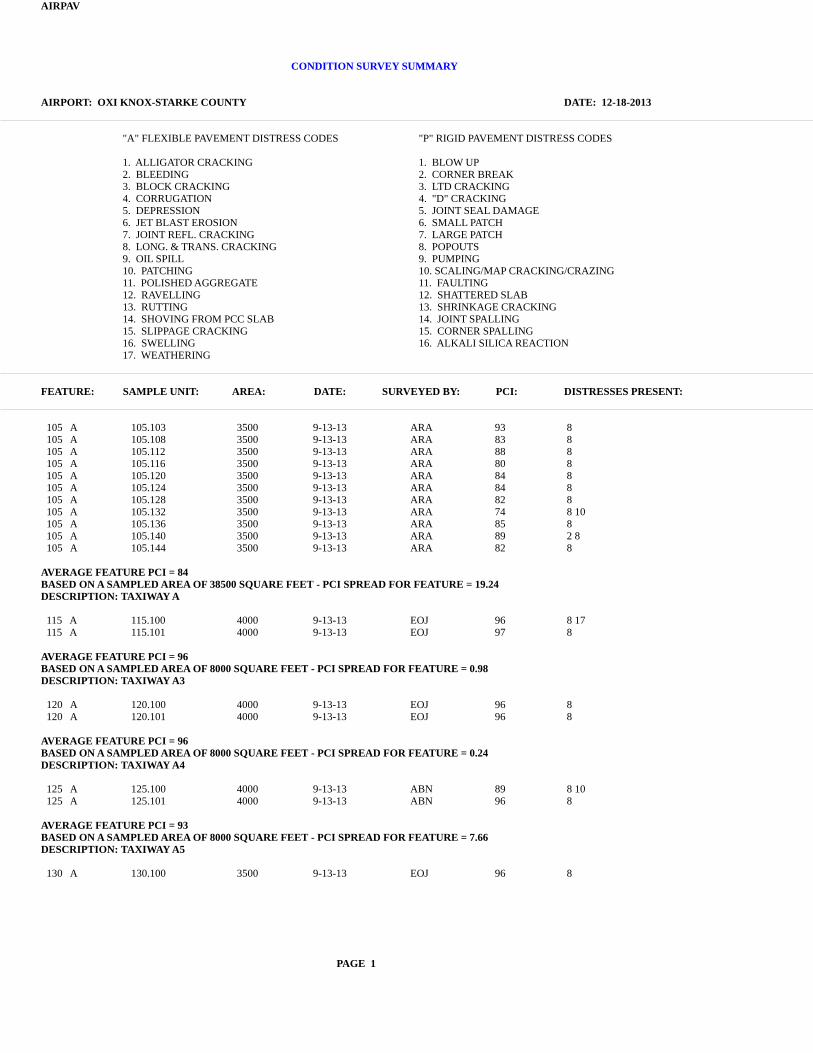
AIRPAV
CONDITION SURVEY SUMMARY
AIRPORT: OXI KNOX-STARKE COUNTY DATE: 12-18-2013
"A" FLEXIBLE PAVEMENT DISTRESS CODES "P" RIGID PAVEMENT DISTRESS CODES
1. ALLIGATOR CRACKING 1. BLOW UP2. BLEEDING 2. CORNER BREAK3. BLOCK CRACKING 3. LTD CRACKING4. CORRUGATION 4. "D" CRACKING5. DEPRESSION 5. JOINT SEAL DAMAGE6. JET BLAST EROSION 6. SMALL PATCH7. JOINT REFL. CRACKING 7. LARGE PATCH8. LONG. & TRANS. CRACKING 8. POPOUTS9. OIL SPILL 9. PUMPING10. PATCHING 10. SCALING/MAP CRACKING/CRAZING11. POLISHED AGGREGATE 11. FAULTING12. RAVELLING 12. SHATTERED SLAB13. RUTTING 13. SHRINKAGE CRACKING14. SHOVING FROM PCC SLAB 14. JOINT SPALLING15. SLIPPAGE CRACKING 15. CORNER SPALLING16. SWELLING 16. ALKALI SILICA REACTION17. WEATHERING
FEATURE: SAMPLE UNIT: AREA: DATE: SURVEYED BY: PCI: DISTRESSES PRESENT:
105 A 105.103 3500 9-13-13 ARA 93 8105 A 105.108 3500 9-13-13 ARA 83 8105 A 105.112 3500 9-13-13 ARA 88 8105 A 105.116 3500 9-13-13 ARA 80 8105 A 105.120 3500 9-13-13 ARA 84 8105 A 105.124 3500 9-13-13 ARA 84 8105 A 105.128 3500 9-13-13 ARA 82 8105 A 105.132 3500 9-13-13 ARA 74 8 10105 A 105.136 3500 9-13-13 ARA 85 8105 A 105.140 3500 9-13-13 ARA 89 2 8105 A 105.144 3500 9-13-13 ARA 82 8
AVERAGE FEATURE PCI = 84BASED ON A SAMPLED AREA OF 38500 SQUARE FEET - PCI SPREAD FOR FEATURE = 19.24DESCRIPTION: TAXIWAY A
115 A 115.100 4000 9-13-13 EOJ 96 8 17115 A 115.101 4000 9-13-13 EOJ 97 8
AVERAGE FEATURE PCI = 96BASED ON A SAMPLED AREA OF 8000 SQUARE FEET - PCI SPREAD FOR FEATURE = 0.98DESCRIPTION: TAXIWAY A3
120 A 120.100 4000 9-13-13 EOJ 96 8120 A 120.101 4000 9-13-13 EOJ 96 8
AVERAGE FEATURE PCI = 96BASED ON A SAMPLED AREA OF 8000 SQUARE FEET - PCI SPREAD FOR FEATURE = 0.24DESCRIPTION: TAXIWAY A4
125 A 125.100 4000 9-13-13 ABN 89 8 10125 A 125.101 4000 9-13-13 ABN 96 8
AVERAGE FEATURE PCI = 93BASED ON A SAMPLED AREA OF 8000 SQUARE FEET - PCI SPREAD FOR FEATURE = 7.66DESCRIPTION: TAXIWAY A5
130 A 130.100 3500 9-13-13 EOJ 96 8
PAGE 1

FEATURE: SAMPLE UNIT: AREA: DATE: SURVEYED BY: PCI: DISTRESSES PRESENT:
130 A 130.101 3500 9-13-13 EOJ 98 8
AVERAGE FEATURE PCI = 97BASED ON A SAMPLED AREA OF 7000 SQUARE FEET - PCI SPREAD FOR FEATURE = 1.61DESCRIPTION: TAXIWAY TO FUEL
2005 A 2005.101 4000 9-13-13 ABN 1002005 A 2005.201 4000 9-13-13 ABN 87 5 82005 A 2005.202 4000 9-13-13 ABN 96 82005 A 2005.400 2410 9-13-13 ABN 92 8 12
AVERAGE FEATURE PCI = 94BASED ON A SAMPLED AREA OF 14410 SQUARE FEET - PCI SPREAD FOR FEATURE = 13.10DESCRIPTION: TEE HANGAR
2010 A 2010.301 2000 9-13-13 ABN 96 82010 A 2010.302 2000 9-13-13 ABN 95 82010 A 2010.401 2000 9-13-13 ABN 1002010 A 2010.403 2000 9-13-13 ABN 1002010 A 2010.502 2000 9-13-13 ABN 1002010 A 2010.601 2000 9-13-13 ABN 100
AVERAGE FEATURE PCI = 99BASED ON A SAMPLED AREA OF 12000 SQUARE FEET - PCI SPREAD FOR FEATURE = 4.68DESCRIPTION: TEE HANGAR
3005 P 3005.100 3750 9-13-13 EOJ 1003005 P 3005.102 3750 9-13-13 ABN 92 33005 P 3005.201 3750 9-13-13 ABN 94 13 14 153005 P 3005.300 3750 9-13-13 EOJ 1003005 P 3005.303 3750 9-13-13 EOJ 92 3 15
AVERAGE FEATURE PCI = 96BASED ON A SAMPLED AREA OF 18750 SQUARE FEET - PCI SPREAD FOR FEATURE = 7.96DESCRIPTION: RAMP
3010 A 3010.400 4400 9-13-13 ABN 84 83010 A 3010.402 3450 9-13-13 ABN 78 8
AVERAGE FEATURE PCI = 81BASED ON A SAMPLED AREA OF 7850 SQUARE FEET - PCI SPREAD FOR FEATURE = 5.10DESCRIPTION: RAMP
3015 P 3015.100 5810 9-13-13 EOJ 99 133015 P 3015.101 3125 9-13-r13 JB 100
AVERAGE FEATURE PCI = 99BASED ON A SAMPLED AREA OF 8935 SQUARE FEET - PCI SPREAD FOR FEATURE = 1.39DESCRIPTION: FUELING RAMP
4005 A 4005.101 4000 9-13-13 ARA 43 1 8 10 12 134005 A 4005.102 4000 9-13-13 ARA 41 8 10
AVERAGE FEATURE PCI = 42BASED ON A SAMPLED AREA OF 8000 SQUARE FEET - PCI SPREAD FOR FEATURE = 2.34DESCRIPTION: TAXIWAY A-2
4010 A 4010.286 5190 9-13-13 ARA 71 8
AVERAGE FEATURE PCI = 71BASED ON A SAMPLED AREA OF 5190 SQUARE FEET - PCI SPREAD FOR FEATURE = 0.00DESCRIPTION: TAXIWAY A-6
6005 A 6005.101 3750 9-13-13 ARA 75 8 176005 A 6005.103 3750 9-13-13 ARA 71 8 176005 A 6005.105 3750 9-13-13 ARA 72 8 126005 A 6005.107 3750 9-13-13 ARA 75 8
AVERAGE FEATURE PCI = 73BASED ON A SAMPLED AREA OF 15000 SQUARE FEET - PCI SPREAD FOR FEATURE = 3.72DESCRIPTION: RUNWAY 18-36
PAGE 2

FEATURE: SAMPLE UNIT: AREA: DATE: SURVEYED BY: PCI: DISTRESSES PRESENT:
6010 A 6010.110 3750 9-13-13 ARA 83 86010 A 6010.116 3750 9-13-13 ARA 75 86010 A 6010.120 3750 9-13-13 ARA 72 8 176010 A 6010.126 3750 9-13-13 ARA 78 86010 A 6010.130 3750 9-13-13 ARA 66 1 86010 A 6010.136 3750 9-13-13 ARA 80 86010 A 6010.140 3750 9-13-13 ARA 79 86010 A 6010.150 3750 9-13-13 ARA 76 5 86010 A 6010.160 3750 9-13-13 ARA 68 86010 A 6010.170 3750 9-13-13 ARA 69 1 86010 A 6010.180 3750 9-13-13 ARA 73 86010 A 6010.184 3750 9-13-13 ARA 59 1 8 10 17
AVERAGE FEATURE PCI = 73BASED ON A SAMPLED AREA OF 45000 SQUARE FEET - PCI SPREAD FOR FEATURE = 23.25DESCRIPTION: RUNWAY 18-36
TOTAL NUMBER OF INSPECTED FEATURES = 14 TOTAL NUMBER OF INSPECTED SAMPLE UNITS = 57 TOTAL AREA OF INSPECTED PAVEMENT = 204,635 S.F.
* INDICATES "ADDITIONAL" SAMPLE UNITS.
PAGE 3
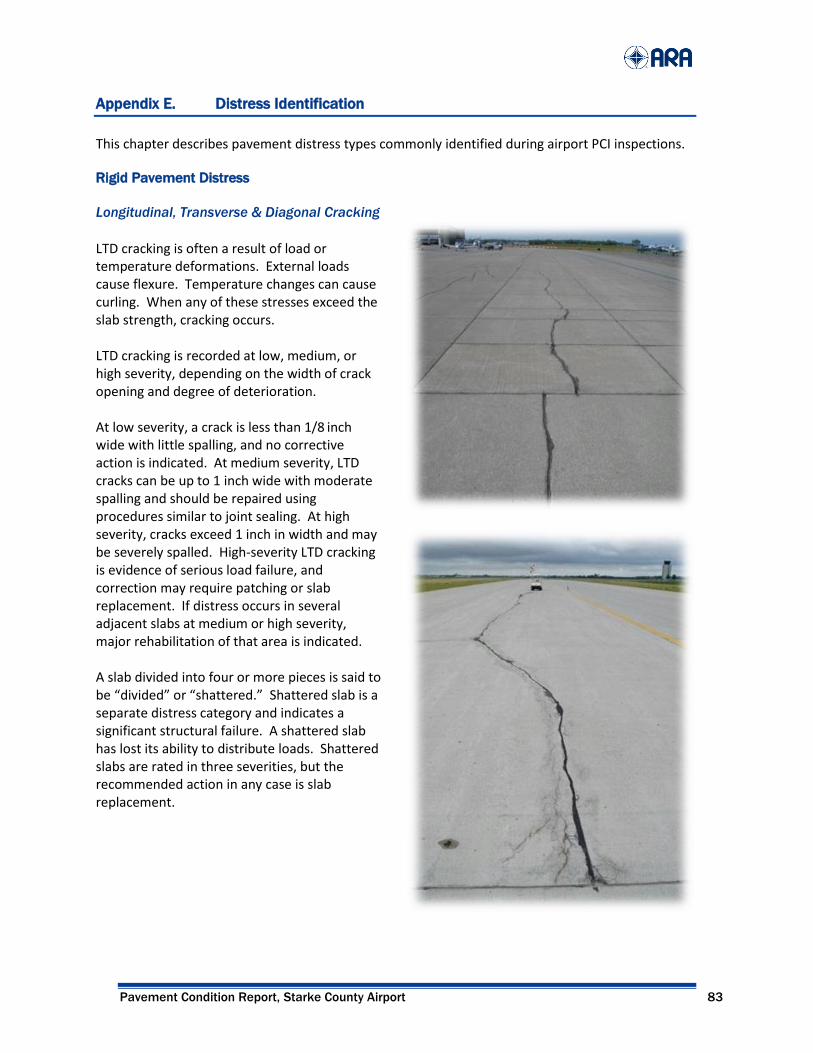
Pavement Condition Report, Starke County Airport 83
Appendix E. Distress Identification
This chapter describes pavement distress types commonly identified during airport PCI inspections. Rigid Pavement Distress
Longitudinal, Transverse & Diagonal Cracking
LTD cracking is often a result of load or temperature deformations. External loads cause flexure. Temperature changes can cause curling. When any of these stresses exceed the slab strength, cracking occurs. LTD cracking is recorded at low, medium, or high severity, depending on the width of crack opening and degree of deterioration. At low severity, a crack is less than 1/8 inch wide with little spalling, and no corrective action is indicated. At medium severity, LTD cracks can be up to 1 inch wide with moderate spalling and should be repaired using procedures similar to joint sealing. At high severity, cracks exceed 1 inch in width and may be severely spalled. High-severity LTD cracking is evidence of serious load failure, and correction may require patching or slab replacement. If distress occurs in several adjacent slabs at medium or high severity, major rehabilitation of that area is indicated. A slab divided into four or more pieces is said to be “divided” or “shattered.” Shattered slab is a separate distress category and indicates a significant structural failure. A shattered slab has lost its ability to distribute loads. Shattered slabs are rated in three severities, but the recommended action in any case is slab replacement.
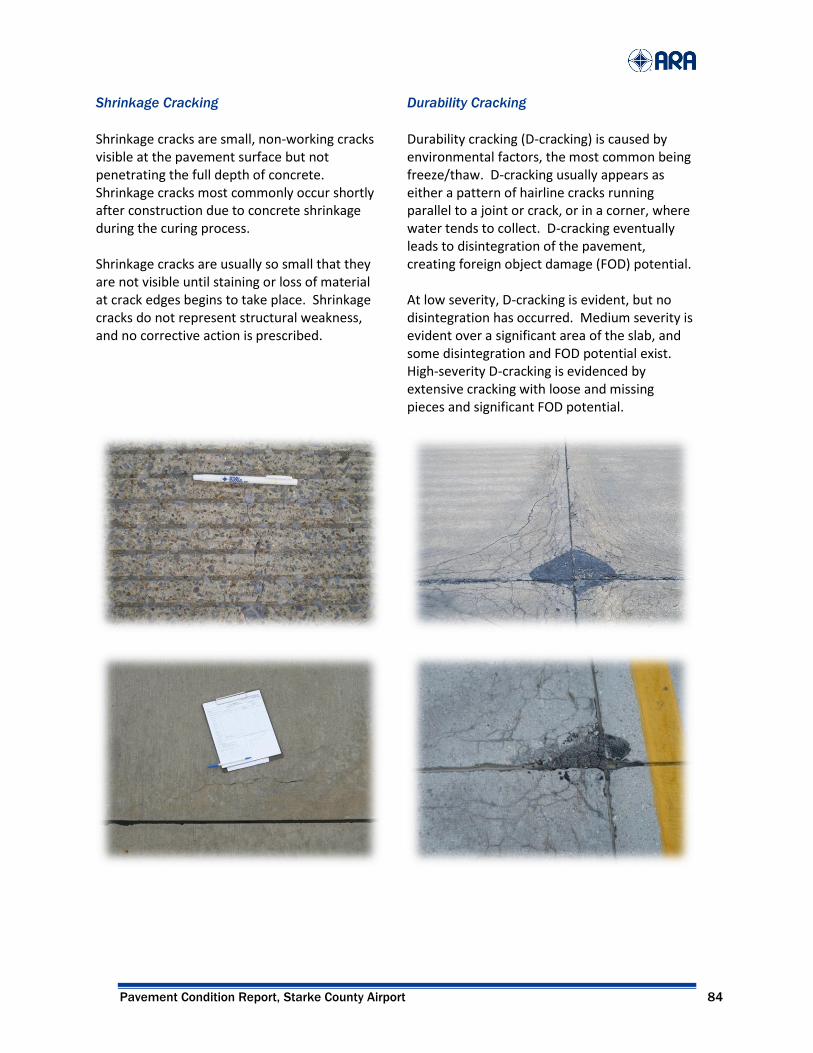
Pavement Condition Report, Starke County Airport 84
Shrinkage Cracking
Shrinkage cracks are small, non-working cracks visible at the pavement surface but not penetrating the full depth of concrete. Shrinkage cracks most commonly occur shortly after construction due to concrete shrinkage during the curing process. Shrinkage cracks are usually so small that they are not visible until staining or loss of material at crack edges begins to take place. Shrinkage cracks do not represent structural weakness, and no corrective action is prescribed.
Durability Cracking
Durability cracking (D-cracking) is caused by environmental factors, the most common being freeze/thaw. D-cracking usually appears as either a pattern of hairline cracks running parallel to a joint or crack, or in a corner, where water tends to collect. D-cracking eventually leads to disintegration of the pavement, creating foreign object damage (FOD) potential. At low severity, D-cracking is evident, but no disintegration has occurred. Medium severity is evident over a significant area of the slab, and some disintegration and FOD potential exist. High-severity D-cracking is evidenced by extensive cracking with loose and missing pieces and significant FOD potential.
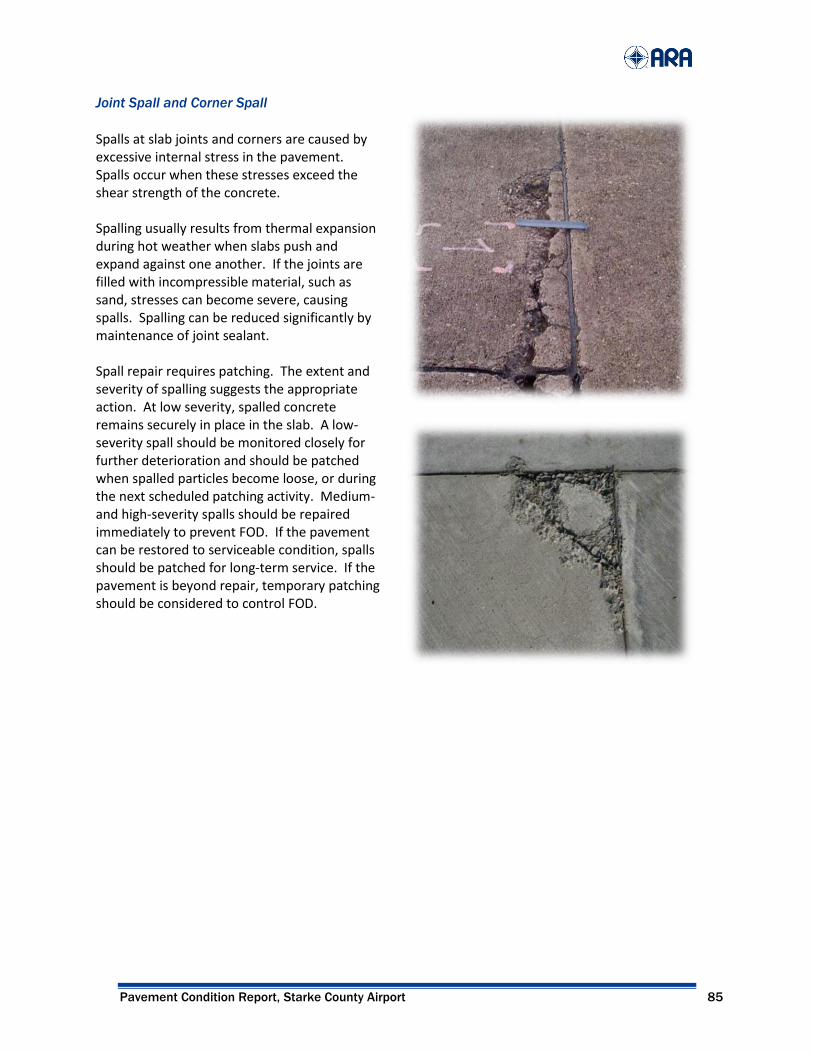
Pavement Condition Report, Starke County Airport 85
Joint Spall and Corner Spall
Spalls at slab joints and corners are caused by excessive internal stress in the pavement. Spalls occur when these stresses exceed the shear strength of the concrete. Spalling usually results from thermal expansion during hot weather when slabs push and expand against one another. If the joints are filled with incompressible material, such as sand, stresses can become severe, causing spalls. Spalling can be reduced significantly by maintenance of joint sealant. Spall repair requires patching. The extent and severity of spalling suggests the appropriate action. At low severity, spalled concrete remains securely in place in the slab. A low-severity spall should be monitored closely for further deterioration and should be patched when spalled particles become loose, or during the next scheduled patching activity. Medium- and high-severity spalls should be repaired immediately to prevent FOD. If the pavement can be restored to serviceable condition, spalls should be patched for long-term service. If the pavement is beyond repair, temporary patching should be considered to control FOD.
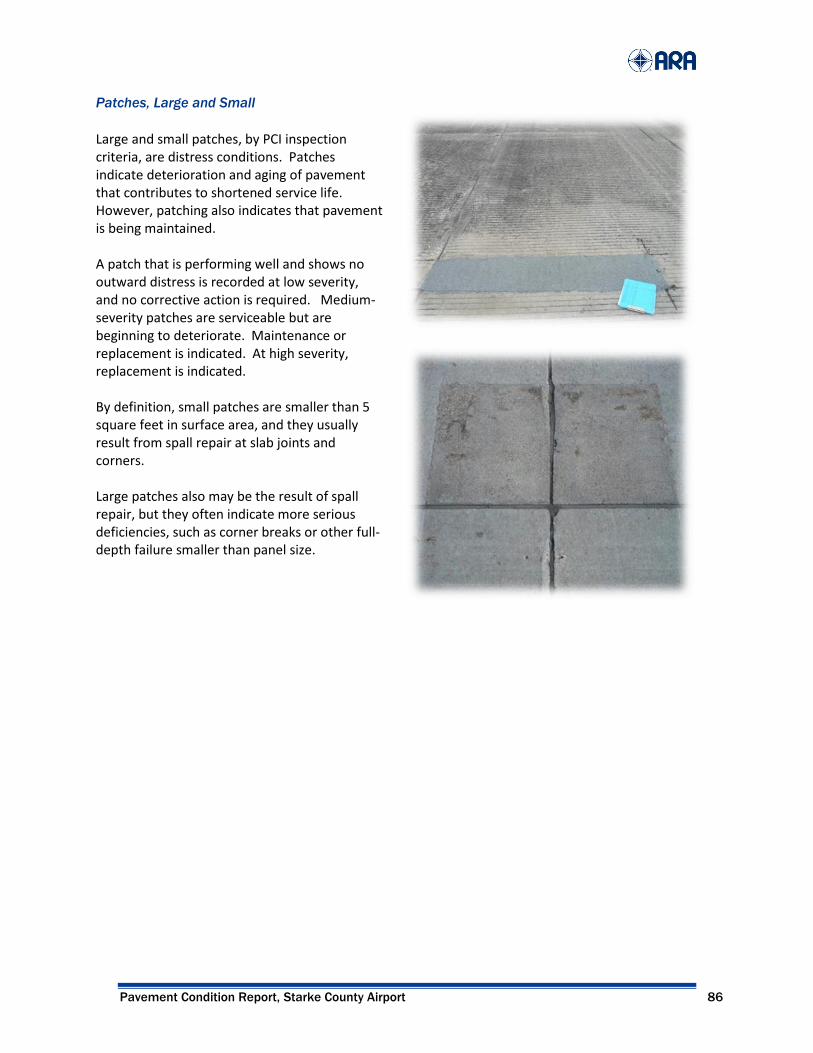
Pavement Condition Report, Starke County Airport 86
Patches, Large and Small
Large and small patches, by PCI inspection criteria, are distress conditions. Patches indicate deterioration and aging of pavement that contributes to shortened service life. However, patching also indicates that pavement is being maintained. A patch that is performing well and shows no outward distress is recorded at low severity, and no corrective action is required. Medium-severity patches are serviceable but are beginning to deteriorate. Maintenance or replacement is indicated. At high severity, replacement is indicated. By definition, small patches are smaller than 5 square feet in surface area, and they usually result from spall repair at slab joints and corners. Large patches also may be the result of spall repair, but they often indicate more serious deficiencies, such as corner breaks or other full-depth failure smaller than panel size.

Pavement Condition Report, Starke County Airport 87
Joint Seal Damage
When joint sealant is in perfect condition (no damage), there is no distress. At low severity, at least 10 percent of the sealant is debonded but still in contact with the joint edges. Medium-severity joint seal damage is recorded when at least 10 percent of the sealant has visible gaps smaller than 1/8 inch and is an indicator that replacement should be programmed as soon as is practical. In the meantime, aggressive inspection and sustaining maintenance is recommended to minimize subsurface damage from moisture penetration. At high severity, visible gaps exceed 1/8 inch, and the amount and degree of joint seal damage typically requires complete removal and replacement of the existing sealant. On serviceable pavement, deteriorated joint sealant should be repaired or replaced to preserve pavement and subgrade integrity and prolong service life. The issue is not so clear-cut with unserviceable pavement. Pavement that can be restored to serviceable condition by maintenance activities such as patching and joint seal repair, or by slab replacement, should be so maintained as long as the process is cost-effective. However, when age and condition preclude economical return to serviceable condition by such means, joint seal repair would no longer be cost-effective and should be suspended except for an interim maintenance program to control FOD potential.
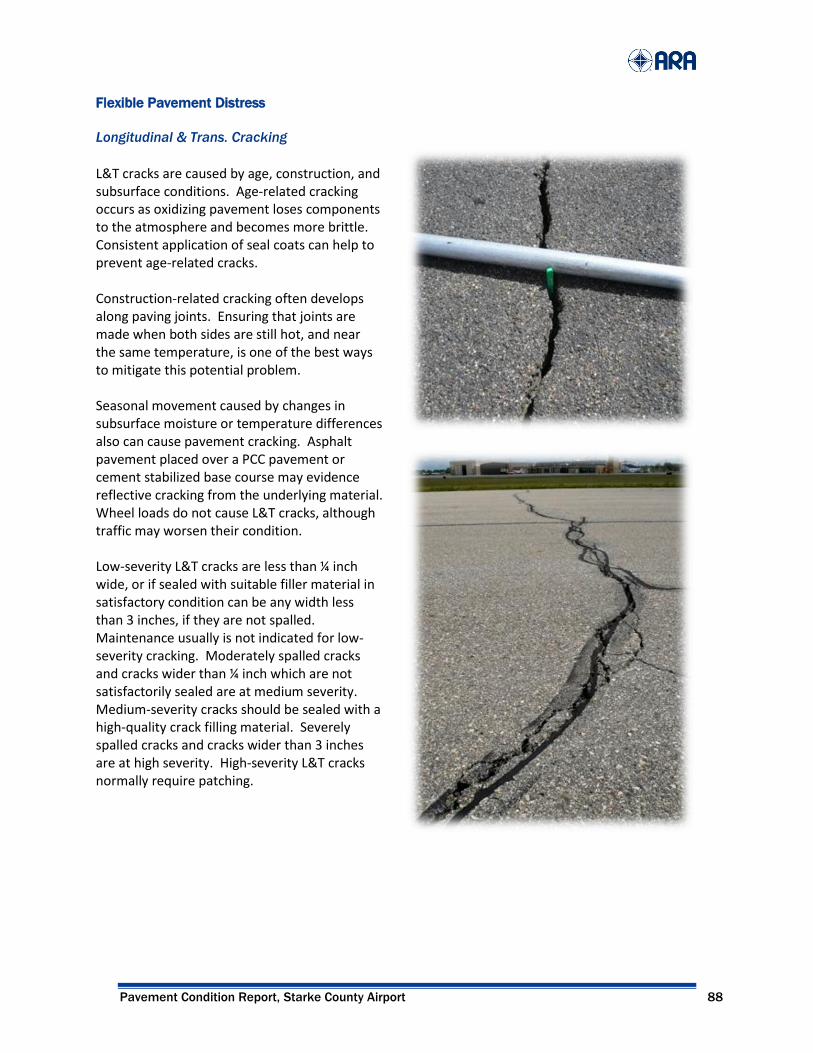
Pavement Condition Report, Starke County Airport 88
Flexible Pavement Distress
Longitudinal & Trans. Cracking
L&T cracks are caused by age, construction, and subsurface conditions. Age-related cracking occurs as oxidizing pavement loses components to the atmosphere and becomes more brittle. Consistent application of seal coats can help to prevent age-related cracks. Construction-related cracking often develops along paving joints. Ensuring that joints are made when both sides are still hot, and near the same temperature, is one of the best ways to mitigate this potential problem. Seasonal movement caused by changes in subsurface moisture or temperature differences also can cause pavement cracking. Asphalt pavement placed over a PCC pavement or cement stabilized base course may evidence reflective cracking from the underlying material. Wheel loads do not cause L&T cracks, although traffic may worsen their condition. Low-severity L&T cracks are less than ¼ inch wide, or if sealed with suitable filler material in satisfactory condition can be any width less than 3 inches, if they are not spalled. Maintenance usually is not indicated for low-severity cracking. Moderately spalled cracks and cracks wider than ¼ inch which are not satisfactorily sealed are at medium severity. Medium-severity cracks should be sealed with a high-quality crack filling material. Severely spalled cracks and cracks wider than 3 inches are at high severity. High-severity L&T cracks normally require patching.
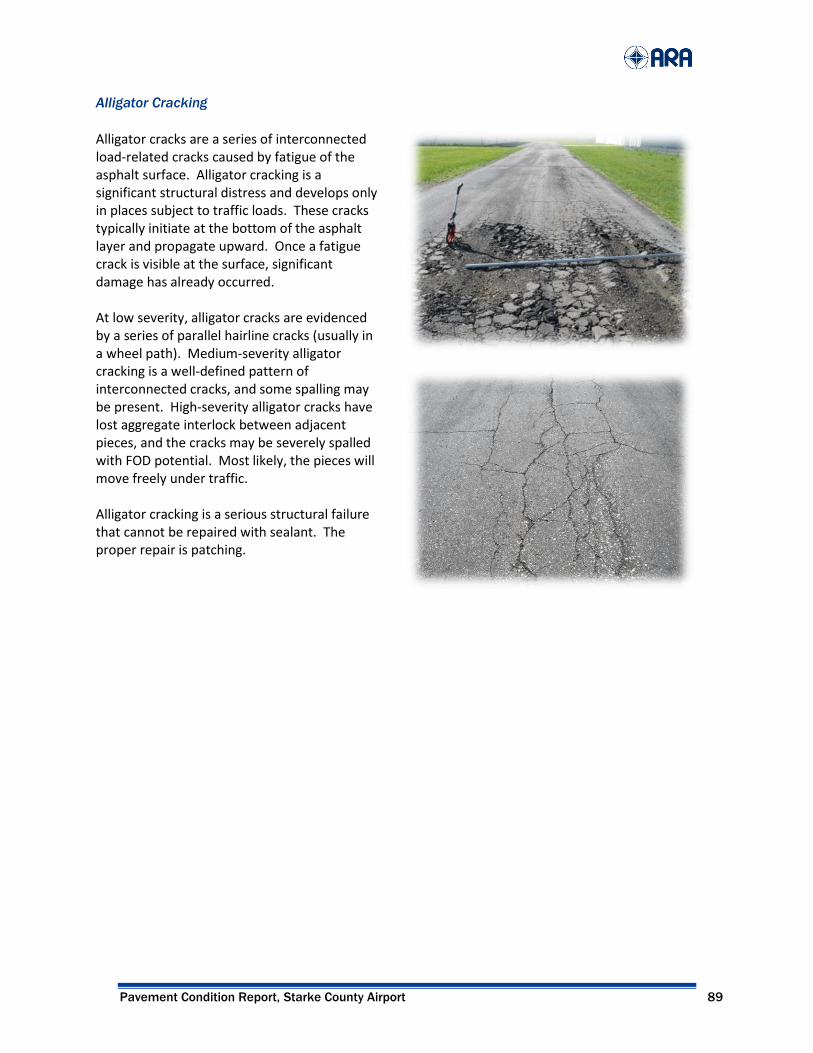
Pavement Condition Report, Starke County Airport 89
Alligator Cracking
Alligator cracks are a series of interconnected load-related cracks caused by fatigue of the asphalt surface. Alligator cracking is a significant structural distress and develops only in places subject to traffic loads. These cracks typically initiate at the bottom of the asphalt layer and propagate upward. Once a fatigue crack is visible at the surface, significant damage has already occurred. At low severity, alligator cracks are evidenced by a series of parallel hairline cracks (usually in a wheel path). Medium-severity alligator cracking is a well-defined pattern of interconnected cracks, and some spalling may be present. High-severity alligator cracks have lost aggregate interlock between adjacent pieces, and the cracks may be severely spalled with FOD potential. Most likely, the pieces will move freely under traffic. Alligator cracking is a serious structural failure that cannot be repaired with sealant. The proper repair is patching.

Pavement Condition Report, Starke County Airport 90
Raveling/Weathering
Raveling and weathering are the wearing away of the pavement surface. Failure can be caused by the dislodging of aggregate particles or the loss of asphalt binder. These distresses are usually evident over large areas and may indicate that the asphalt binder has hardened significantly. Raveling is the loss of coarse aggregate, weathering is the loss of fine aggregate or binder. Raveling: At low severity, 5 to 20 coarse aggregate particles are missing per square yard. Medium severity is defined by 20 to 40 missing coarse aggregate particles per square yard. At high severity, more than 40 coarse aggregate particles are missing per square yard, and the top layer of aggregate has eroded away. Weathering: At low severity, edges of coarse aggregate are exposed less than 1 mm. At medium severity, loss of fine aggregate is noticeable and edges of coarse aggregate are exposed up to 6 mm (1/4 inch). High severity weathering has edges of coarse aggregate exposed > 6 mm, with considerable loss of fine aggregate matrix and potential for loss of coarse aggregate.
Rutting
Ruts are localized areas of pavement having elevations lower than the surrounding sections. Rutting is due to base and subgrade consolidation caused by excessive wheel loads or poor compaction. Ruts indicate structural failure and can cause hydroplaning. At low severity, ruts have an average depth of ¼ to ½ inches. At medium severity, ruts have an average depth of ½ to 1 inch. At high severity, ruts have an average depth greater than 1 inch. Patching is the appropriate repair for ruts.

Pavement Condition Report, Starke County Airport 91
Appendix F. Airport Responsibilities
Grant Assurances
In 1995, Congress mandated that the FAA require, as a condition of grant funding, that airport sponsors prepare documentation of a maintenance management program on pavement that has been constructed, reconstructed, or repaired with Federal assistance. This report fulfills many of the grant assurance requirements, including documenting:
Locating all runways, taxiways, and aprons.
Documenting pavement dimensions.
Documenting types of pavement.
Documenting year of construction or most recent major rehabilitation.
The airport owners must be an active participant in maintaining compliance. Actions taken to ensure compliance include:
Annotating areas constructed or repaired with Federal aid.
Conducting monthly drive-by inspections to detect changes in pavement condition.
Recording each drive-by inspection and any maintenance performed as a result.
Keeping complete records of all maintenance activities.
Keeping records for 5 years.
Documenting detailed inspection information with a history of recorded pavement deterioration by PCI survey (e.g., this report).
The table on the following pages is available for maintaining a record of drive-by inspections and maintenance repairs.

Pavement Condition Report, Starke County Airport 92
Table F-1. Monthly Pavement Inspection Log
Date Inspector Conditions/Changes Repairs/Work Order
Pavement Condition Report, Starke County Airport 93
Date Inspector Conditions/Changes Repairs/Work Order
Pavement Condition Report, Starke County Airport 94
Date Inspector Conditions/Changes Repairs/Work Order
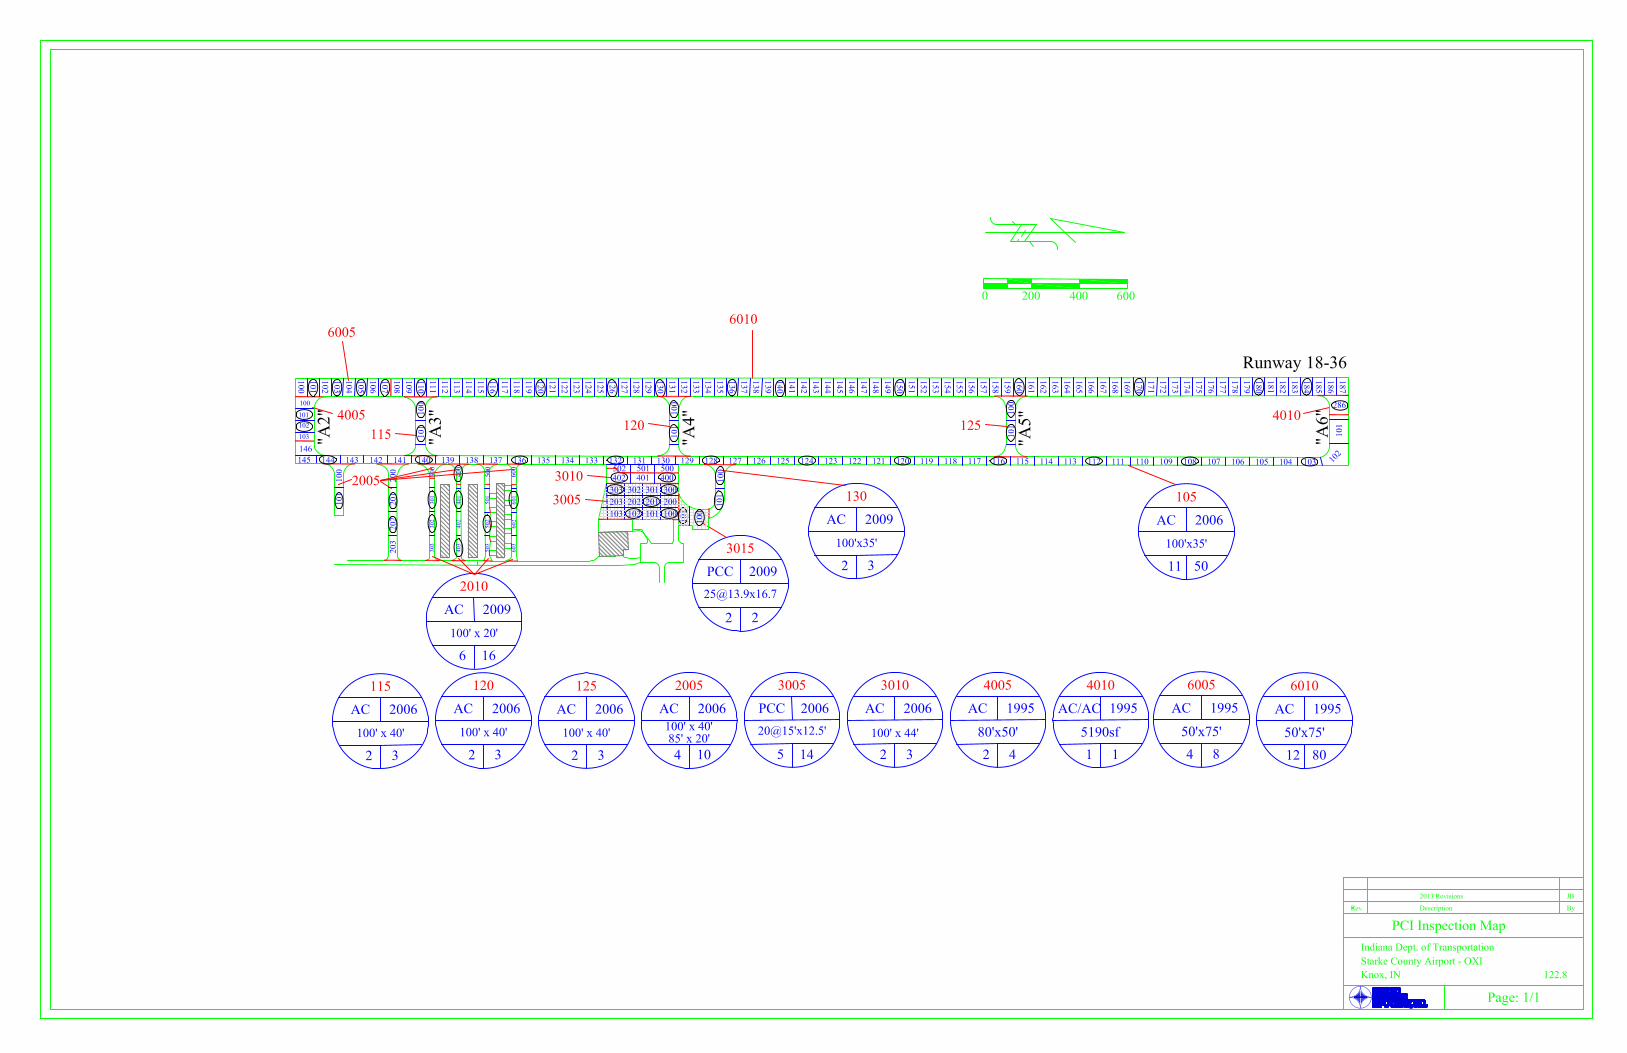

2013 PCI Inspection
0 200 400 600
STARKE COUNTY AIRPORT
4005
4010
3005
3010
105
125
120
115
2005
6005
6010
2010
3015
130
A2
A3
A4
A5
A6
Run
way
18
-36