paul irwing, manchester business...
TRANSCRIPT

Paul Irwing, Manchester Business School

Factor analysis has been the prime statistical technique for the development of structural theories in social science, such as the hierarchical factor model of human cognitive abilities, or the Five Factor Model of personality.

General Intelligence (g)
Fluid
Intelli-gence
General Memory
Crysta-llized
Intelli-gence
Broad
Visual
Percep-tion
Reasoning
Working Memory
Compre-hension
Vocabu-lary
Know-ledge
Memory Span
Spatial
Abilities
Figure 1. Part of Carroll’s hierarchical factor model of human cognitive abilities

A structural model is hypothesized in advance
This model specifies:• The number of factors• The relationship between observed variables
and factors• Error terms which comprise unique factors plus
measurement error

0.63
0.63
0.55
0.76
GFP
Plasticity
Extraversion
Openness to Experience 0.70
0.42
0.56
0.61
0.72Stability
Agreeableness
Conscientiousness
Emotional Stability
0.69
0.48
0.63
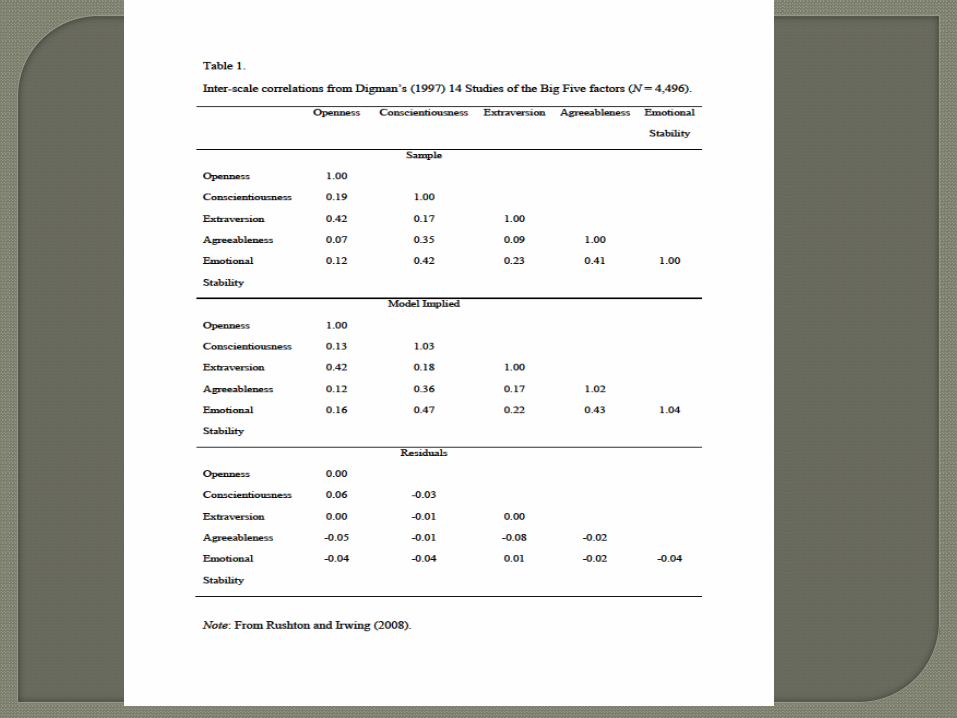
Figure 2. The General Factor of Personality (GFP) in the Big Five. A hierarchical model of personality from the Big Five to the Big Two to the GFP. Estimates in the figure are based on medians derived from Digman’s (1997) 14 samples. From Rushton and Irwing (2008).

Data is a sample correlation matrix The model is specified a priori:
• The number of factors• The relationship between observed variables and factors• Error terms which comprise unique factors plus
measurement error Model parameters (factor loadings and error
variances) are estimated so that the factor model generates a correlation matrix which is as close an approximation to the sample correlation matrix as possible. This is called the model implied correlation matrix.

The preferred method of estimating the parameters of a factor model given data which is continuous and multivariate normal is maximum likelihood.
Maximum likelihood solutions have a number of desirable properties with two of the most important being that:• Parameter estimates are a close approximation to
population parameters (consistency);• The fit function times (N – 1) approximates a chi-
square distribution, which provides a significance test of overall model fit.

The basic model equation for the common factor model is:• Y = ΛX + ΨE
It can be shown that the model implied covariance matrix is:•Σ = ΛΦΛ’ + Θ
Maximum likelihood begins with an approximate solution, e.g. least squares
It then minimizes the fit function:•F = ln│Σ(Θ)│ + tr(S Σ(Θ)-1) – ln│S│ - ρ

The likelihood ratio test:• F (N – 1) follows a chi-square distribution
Problem is that the likelihood ratio test is dependent on N, and is invariably significant in large samples, hence many approximate fit statistics have been suggested:

Root mean square error of approximation (RMSEA): cut value of < 0.06
Tucker-Lewis Index (TLI): cut value of ≥ 0.95
Standardized Root Mean Square Residual (SRMSR): cut value of ≤ 0.05

No more model parameters than are contained in the sub-diagonal of the sample covariance matrix can be estimated. However, it is desirable that there are many fewer model parameters than this, resulting in what is called an overidentified model.
In order to ensure overidentification, it is usually recommended that there are at least 3 to 4 indicators per factor.
In order to establish the scale of the factor either the variance is set at 1 or one of the factor loadings is set at 1.
It is possible to set up other restrictions in order to identify models.

To facilitate interpretability, Thurstonesuggested that factors should conform to simple structure. Commonly, this is interpreted as meaning that each indicator should load on one and only one factor, and that all other factor loadings of each indicator should be equal to 0.

The related idea of unidimensionalityspecifies that each factor should measure one and only one thing.
A necessary condition for simple structure and unidimensionality to be achieved is that the model contains the correct number of factors

The amount of variance explained by a factor is related to something called the eigenvalue.
The eigenvalue is the sum of the squares of the factor loadings.
The total eigenvalue of all the factors is equal to the sum of the number of items.

In exploratory factor analysis the eigenvalue forms the basis of a number of heuristics in order to determine the number of factors
The two commonest rules are:• The scree test which is based on a plot of the
eigenvalues against the factor number.

Factor Number1413121110987654321
Eigenvalue
6
4
2
0
Scree Plot
Figure 3. Scree plot of 14 scales from the US standardization sample of the WAIS-III

Since each item has an average eigenvalue of l, a factor with an eigenvalue less than l would explain less variance than an individual item. It is, therefore, proposed that the number of factors is equal to all those factors with eigenvalues ≥1.
Neither of these rules is correct

Base initial estimates on theory or one of the better heuristics (e.g. parallel analysis or Velicer’s Map test) used in exploratory factor analysis. (A new and probably better alternative is exploratory structural equation modelling.)
Test this solution for fit using confirmatory factor analysis
If the model fits then accept it. If the model does not fit then use the exploratory solution which contains one more factor
Continue until the CFA model fits

Gordon Allport: Comprehensive search of words describing personality – found around 18,000
Allport & Odbert (1936), 171 unique trait names
Cattell used the 171 unique trait names of Allport & Odbert (1936), to obtain ratings of 100 men by colleagues. This was repeat for 208 men with a shortened list
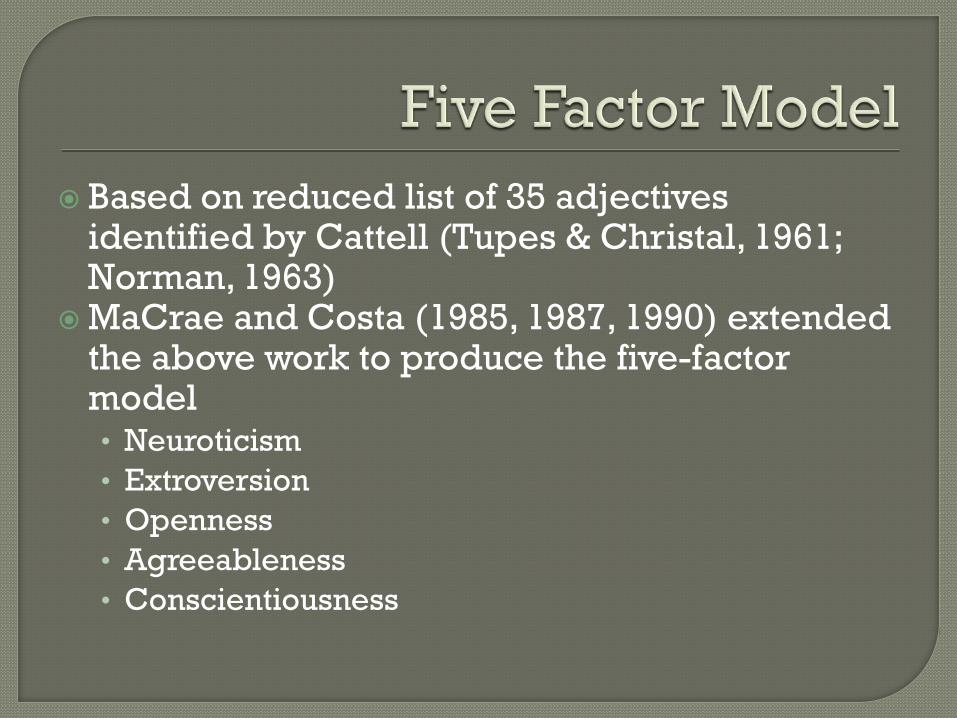
Based on reduced list of 35 adjectives identified by Cattell (Tupes & Christal, 1961; Norman, 1963)
MaCrae and Costa (1985, 1987, 1990) extended the above work to produce the five-factor model• Neuroticism• Extroversion• Openness• Agreeableness• Conscientiousness
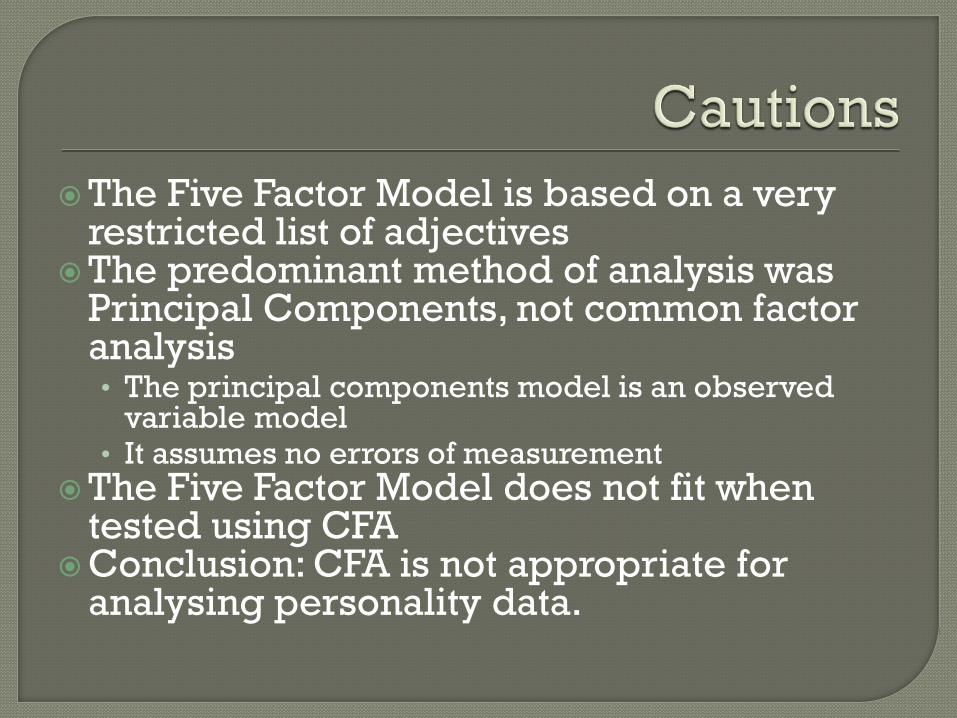
The Five Factor Model is based on a very restricted list of adjectives
The predominant method of analysis was Principal Components, not common factor analysis• The principal components model is an observed
variable model• It assumes no errors of measurement
The Five Factor Model does not fit when tested using CFA
Conclusion: CFA is not appropriate for analysing personality data.

Muthén, L. K. & Muthén, B. O. (2010). Mplus Version 6. Los Angeles, CA: Muthén & Muthén
Mplus website: http://www.statmodel.com/Kline, R. B. (2005). Principles and Practice of
Structural Equation Modelling. London: The Guilford Press.
Brown, T. A. (2006). Confirmatory factor analysis for applied research. New York, N.J.: Guilford Press.
Bollen, K. A. (1989). Structural equations with latent variables. New York, NJ: Wiley.
Mulaik, S. A. (2010). Foundations of factor analysis. London: Chapman & Hall.