patterns of household charitable giving by income group, 2005
TRANSCRIPT

Patterns of Household Charitable Giving
by Income Group, 2005
Prepared for
by
Summer 2007

Giving focused on helping the poor Summer 2007 The Center on Philanthropy at Indiana University
Executive Summary
The Center on Philanthropy at Indiana University and Google partnered in early 2007 to estimate how much of the charitable giving by households in the U.S. focuses on the needs of the poor. This analysis finds that less than one-third of the money individuals gave to nonprofits in 2005 was focused on the needs of the economically disadvantaged. Of the $250 billion in donations, less than $78 billion explicitly targeted those in need.
Only 8 percent of households’ donated dollars were reported as contributions to help meet basic needs--providing food, shelter, or other necessities. An estimated additional 23 percent of total private philanthropy (including donations from foundations, corporations, and estates) went to programs specifically intended to help people of low income--either providing other direct benefits (such as medical treatment and scholarships) or through initiatives creating opportunity and empowerment (such as literacy and job training programs).
The Center used data from two household studies, the Center on Philanthropy Panel Study and the Bank of America Study of High Net Worth Philanthropy, to estimate dollars given to “help meet basic needs.” In addition, estimates were created about expenditures by other types of charitable organizations (education, religion, health, combined funds, international development, and “other charities”), where at least some expenditures are reported by other researchers to be focused on the needs of people with low income. Those expenditures are funded in part by charitable donations, including household contributions. The portion of expenditures that is likely to be focused on the needs of people of low income for some types of charities was estimated based on reported values from other researchers’ work: Higher Education -- Council for Aid to Education (for scholarships) and the National Association of Independent Schools (also for scholarships). Religion: National Council of Churches of Christ (expenditures called benevolences). To estimate support for programs primarily serving people in low income groups by combined funds and in health care, the Center used samples of organizations in these two types of recipients. Data from IRS Forms 990 were used to study the sampled groups. For combined funds, the IRS Forms 990 were used to identify and code the allocations made. In health care, the 990s were used to track the charitable contributions received and organizations receiving those funds were grouped based on their purpose (health care clinic, hospital, etc.) The main findings from this study were published in an April 4, 2007, Wall Street Journal opinion piece authored by Sheryl Sandberg, a Vice President at Google and member of Google.org’s board. The complete findings from this analysis appear on the following pages.

Giving focused on helping the poor Summer 2007 The Center on Philanthropy at Indiana University
Acknowledgements
This research was funded by Google and undertaken by the Center on Philanthropy at Indiana University. A number of people at Google and at the Center contributed to the analysis and report. At the Center on Philanthropy at Indiana University:
Patrick M. Rooney, Ph.D., Director of Research, principal investigator Melissa S. Brown, Associate Director of Research, project manager Bridgett H. Milner, Research Development Specialist, report development Xing Wei, graduate assistant, department of economics, data analysis Takayuki Yoshioka, doctoral student, philanthropic studies, data analysis David A. Fleischhacker, graduate assistant, school of law, bibliographic assistance and editorial review
At Google:
Sheryl Sandberg, Vice President, Global Sales and Operations, review and comment Ellen Konar, Senior Quantitative Insights Manager, review and comment Josh Mendelsohn, Program Manager, Online Sales, review and comment

Giving focused on helping the poor Summer 2007 The Center on Philanthropy at Indiana University
Contents
Executive Summary……………………………………………………………..…..i
Acknowledgments………………………………………………………………. ....ii
Introduction................................................................................................................1
Methods .....................................................................................................................2
Results Section One: Estimating giving by income group ...................................... 4 Part 1: Religion ........................................................................................................5
Part 2: Combined purpose charities........................................................................ 6 Part 3: Helping to meeting basic needs ...................................................................7 Part 4: Health ...........................................................................................................8 Part 5: Education .....................................................................................................9 Part 6: Arts.............................................................................................................10 Part 7: Other causes ...............................................................................................11 Part 8: Total giving................................................................................................12
Results Section Two Part 1:
Estimating contributions that focus on the needs of the poor ...............................14 Step 1: Start with the totals ...................................................................................14
Step 2: Estimate the portion of contributions that focuses on serving people living in poverty ......................................17
Religion .................................................................................................................17 Combined purpose charities ................................................................................. 19 Helping to meet basic needs ..................................................................................21 Health ....................................................................................................................21 Education...............................................................................................................23 Arts ........................................................................................................................24 Other causes...........................................................................................................25
Results Section Two Part 2: Total giving focused on the needs of the poor ............27
Alternatives to estimates
Family foundation grantmaking ...........................................................................33 Index of Global Philanthropy ................................................................................34
Further research ........................................................................................................35
References.................................................................................................................36

Giving focused on helping the poor 1 The Center on Philanthropy at Indiana University Summer 2007
Introduction
Philanthropic giving has been about 2 percent of gross domestic product since the mid-1990s (Giving USA 2006). Studies have shown increasing social needs in the United States during the past decade (America’s Second Harvest, 2006; U.S. HUD, 2006; Catholic Charities 2006). Attention for philanthropic giving to address international needs is also increasing (Giving USA Foundation™ and Anderson, 2006, among others). To what extent is charitable giving by the largest source of contributions—individuals—directed to agencies that are working to provide for the needs of the poorest, thereby promoting greater social justice and helping prepare the most disadvantaged members of society to be better able to take care of themselves in the future as well as across generations? This is the research question which this project attempts to address. Just under 13 percent of the U.S. population lives below the federal poverty line (U.S. Census Bureau, 2006). Worldwide, an estimated 1.9 billion people (of 6.0 billion) lived on less than $1.50 per day (purchasing power parity) in 2001 (Kakwani and Son, 2006). These staggering figures indicate a serious need for assistance and the re-allocation of extra-resources. How much of donated (philanthropic) capital is being reallocated to address the needs of those living in poverty? This study attempts to estimate that value and further outline what that money is being used for. Needs of people living in poverty are the subject efforts of at least three systems to provide aid: public policy (i.e., government taxing and spending policies), informal philanthropy (i.e., private giving to friends and families), and formal philanthropy (i.e., giving tax deductible gifts to legally established private charities). This paper is restricted to the last of these, the impact of formal philanthropy. Salamon (1992) found that 27 percent of human service organizations studied in the U.S. focused their services on the poorest community residents. In a more recent study of youth-serving organizations, Galaskiewicz et al. found that organizations in low-income neighborhoods had a high percentage of government funding and almost no philanthropic support – and those in middle- and upper-income neighborhoods did receive gifts in addition to fees and dues (2005). Tobin et al. (2005), in looking at the largest, publicly-announced gifts, reported that “Higher education receives 63% of all gifts of $10 million or more, with a large majority of them going to private institutions….Meanwhile, over 80% of college students attend public universities (p. 8).” Tobin’s finding suggests that organizations in human services or higher education that are serving people in lower income groups are not likely to be receiving the largest contributions. While each discrete measure of giving by type of recipient demonstrates that a relatively small proportion of giving to that subsector is focused on the needs of the poorest, these several subsectors have not previously been aggregated to determine the total percentage of giving that is either directed to charities that predominantly aid the poor and, where possible, activities of other charitable organizations that are focused on the needs of the poor.

Giving focused on helping the poor 2 The Center on Philanthropy at Indiana University Summer 2007
Methods
To address the question of what percentage of American household giving focuses on the needs of “the poor,” two primary data sets were analyzed. These data sets are: the Center on Philanthropy Panel Study (COPPS) 2003 wave of data and the Bank of American Study of High Net Worth Philanthropy (BOA) data collected in 2006 by the Center on Philanthropy (Center). To estimate giving for households with an annual income below $200,000 COPPS data were used, to estimate giving for households with an annual income above $200,000 BOA data were used. To determine what percentage of giving within these samples focuses on the needs of the poor, weighted estimates of giving by income group were calculated. These weighted estimates provided distributions of giving to type of charitable recipient (subsector). These weighted estimates were calculated through multiplying the total number of households in the U.S. (110 million) by the percentage of households within each income range (based on tax returns filed, according to the IRS), and by the percentage of households that give to the category of recipient, and by the average donation from donors who give to that category. Other resources were also consulted to identify other means of overall funding within a subsector that addresses specific needs of “the poor.” Weighted estimates were separated into categories such as “focuses on the poor” and “no focus on the poor,” particularly for funds given to religious causes, combined purpose charities (e. g. United Way), education (e. g. scholarships), and health. In looking at other types of giving, the researchers also examined grantmaking by family foundations to determine where funds were allocated and if the allocation of funds by family foundations differed from household giving in substantial ways. There was little difference in family foundation giving and the overall estimates of household giving. The team also reviewed the Index of Global Philanthropy from the Hudson Institute and found that, at most, 9 percent is expended internationally ($24 billion of an estimated total $283 billion in all giving from all sources). It is not clear whether all of those expenditures abroad are focused on the needs of people in developing nations. Other monetary transfers (remittances, government grants, and so on) are also in the Index of Global Philanthropy but they are not included here as charitable gifts. Data sets The Center on Philanthropy Panel Study (COPPS) is a five-minute module included in the Panel Study of Income Dynamics conducted by the Institute for Social Research at the University of Michigan. The COPPS questions are asked every two years of almost 8,000 households that make up a nationally representative sample of the U.S. population. COPPS/PSID has a maximum margin of error of 1.1% with a 95% confidence level. This study uses results from the 2003 wave, which asked questions about giving in 2002 (results are adjusted for inflation). The Bank of America High Net-Worth Philanthropy Study (BOA), also conducted by the Center on Philanthropy at Indiana University, was sent to households in a random sample of census tracts identified to have a median income of $200,000 or above. The study asked questions about charitable giving in 2005 and used the same categories and definitions for giving that are used in COPPS. More than 1,400 responses were received. The BOA study has a maximum margin of error of 2.6%.

Giving focused on helping the poor 3 The Center on Philanthropy at Indiana University Summer 2007
Households that qualified for the study had income of $200,000 or more and/or net worth of $1 million or more. Both the COPPS and BOA studies ask a question: “How much did you give to organizations that help meet people’s basic needs?” Other studies used in this analysis to estimate giving focused on the needs of the poor Several other studies were consulted in the effort to estimate how much charitable giving to a certain type of organization might be directed at the needs of people living at or below the poverty line. For example, the National Council of Churches of Christ estimates that 23 percent of religious giving supports “benevolences” (2006), and Biddle (1992) finds that less than 10 percent of Protestant congregational expenditures are for international, health, or social welfare purposes, at least some of which serve the poor (p. 102 in Clotfelter). The Council for Aid to Education reports a percentage of endowment giving to education that supports scholarships (2006), and one analysis of philanthropic support for international aid and development concluded that $15.9 billion of giving to religion, education, and selected private voluntary organizations was expended for activities in other countries, although it is not clear whether beneficiaries of all of these expenditures are among the world’s poor (Hudson Institute, 2006). Therefore, in addition to the two household survey data sets, a number of other sources were also consulted to determine how funds were allocated within categories of recipients (such as how much of the total giving to education was used for scholarship funding). The other sources consulted within this study were:
• Council for Aid to Education, Voluntary Support for Education, for information on the share of higher education giving that supports scholarships;
• The National Council of Churches of Christ, Yearbook of American and Canadian Churches,
for information regarding the amount of benevolence giving to religious organizations;
• Joseph Claude Harris, “Analysis of Catholic Giving” prepared for and printed in Giving USA 2006;
• Codes done of allocations from 20 organizations in the “combined purposes” category (more
than 1,300 recipient charities) for a possible distribution of United Way, Jewish federation, and donor-advised fund gifts by ultimate charitable organization receiving the allocations; and
• Codes done for a sample of organizations in the health care subsector to distinguish between
“disease/disorder” organizations (lung, cancer, heart, etc.), clinics providing care, research institutes, etc.

Giving focused on helping the poor 4 The Center on Philanthropy at Indiana University Summer 2007
Results This section has three components:
1. Estimates of giving by type of recipient (subsector); 2. Estimates of the giving to each subsector that is focused on (not benefits, but focused by intent of the donor or the institution receiving the funds) people in the lowest income groups in the U.S. This is intended to incorporate giving that is directed at programs designed to provide services for people living at or near the official poverty line in the U.S.; 3. A summary of the total giving as developed in the first two sections.
Results Section One: Estimated Giving by Charitable Subsector or Purpose To best understand giving to “the poor,” donors were separated into four income groups, to allow for an understanding of which donors are giving to “the poor” (versus other causes) and how much is being given. These income groups were: donors with an annual household income of less than $100,000 (90.4 percent of the US population according to IRS tax return documents); donors with an annual household income between $100,000 and $200,000 (7.4 percent of the US population); donors with an annual household income between $200,000 and $1 million (2.1 percent of the US population); and finally, donors with an annual household income equal to or greater than $1,000,000 or more (0.2 percent of the population) (See Table 1). Table 1: Household Assumptions 110 million households, 2005 estimate Percentages by income from Internal Revenue Service data based on tax returns
Household Income, 2004 Percentage of households in income category*
< $100,000 90.4%
$100,000 to $200,000 7.4%
$200,000 to $1 million 2.1%
$1 million or more 0.2%
Total 100.1%* Exceeds 100% due to rounding Note: The American Community Survey for 2005 reports 111 million households. 83.7 percent of households have income < $100,000; 13.3 percent $100,000 to $200,000; and 3.0% > $200,000. Using ACS population data, basic needs giving is 7.0 percent and other programs that focus on the needs of the poor get 24.4 percent. The different income distribution yields results very close to the 30.6 percent found in this paper, where 7.5 percent is to help meet basic needs and 23.1 percent is for programs focused on the poor. Within the income groups, general giving patterns look very different (with an overall trend of higher income households donating more and to different causes than households with lower incomes) so there is reason to assume that patterns of giving to the poor may also appear quite different. Each table that follows presents the estimate of giving for a specific subsector based on the percentage of households within an income group that reported giving to charitable organizations in that subsector and the average amount they reported contributing.

Giving focused on helping the poor 5 The Center on Philanthropy at Indiana University Summer 2007
Results Section One: Part 1: Religion Table 2: Weighted estimates of giving by household income level to religious cause.* Religion donors
Household Income
Percentage of households that contribute to religion
Average amount contributed to religion by religion donor households
Religion donations ($ in billions)
Percentage of all household giving to this type of charity from each income group
< $100,000** 42.4% $1,423 $59.96 59.4%
$100,000 to $200,000** 60.7% $2,316 $11.39 11.3%$200,000 to $1 million*** 75.0% $12,105 $21.01 20.8%
$1 million or more*** 70.9% $61,060 $8.64 8.6%Total $101.00 100%
Exceeds 100% due to rounding. *Weighting takes 110 million households x percentage in income range (based on tax returns filed) x percentage that give to the category of recipient x average donation from donors who give to that category ** Income < $200,000: Data from COPPS *** Income >$200,000: Data from BOA Households with an annual income of less than $100,000 (“average” income households)
• 42.4 percent give to religious causes, giving an average household gift of $1,423, cumulatively making up 59.4 percent ($59.96 billion) of the funds raised by religious organizations.
Households with an annual income between $100,000 and $200,000 (“above average” income households)
• 60.7 percent give to religious causes, giving an average household gift of $2,316, cumulatively making up 11.3 percent ($11.39 billion) of the funds raised by religious organizations.
Households with an annual income between $200,000 and $1,000,000 (“wealthy”)
• 75.0 percent give to religious causes, giving an average household gift of $12,105, cumulatively making up 20.8 percent ($21.01 billion) of the funds raised by religious organizations.
Households with an annual income equal to or above $1,000,000 (“very wealthy”)
• 70.9 percent give to religious causes, giving an average household gift of $61,060, cumulatively making up 8.6 percent ($8.64 billion) of the funds raised by religious organizations.

Giving focused on helping the poor 6 The Center on Philanthropy at Indiana University Summer 2007
Results Section One: Part 2: Combined purpose funds Combined purpose funds receive contributions that are then allocated to a number of different types of charities. Examples include United Way, donor-advised funds at financial institutions, Jewish federations, and institutions such as the National Philanthropic Trust. Table 3: Weighted estimates of giving by household income level to combined purpose charities* Combined purpose donors
Household Income
Percentage of households that contribute to combined purposes
Average amount contributed to combined purposed by combined purpose donor households
Combined purpose donations, ($ in billions)
Percentage of all household giving to this type of charity from each income group
< $100,000** 23.4% $330 $7.70 34.8%$100,000 to $200,000** 48.1% $554 $2.16 9.8%$200,000 to $1 million*** 62.1% $7,087 $10.19 46.1%$1 million or more*** 60.3% $17,072 $2.06 9.3%Total $22.11 100%
*Weighting takes 110 million households x percentage in income range (based on tax returns filed) x percentage that give to the category of recipient x average donation from donors who give to that category ** Income < $200,000: Data from COPPS *** Income >$200,000: Data from BOA Households with an annual income of less than $100,000 (“average” income households)
• 23.4 percent give to combined purpose charity organizations, giving an average household gift of $330, cumulatively making up 34.8 percent ($7.7 billion) of the funds raised by combined purpose charities.
Households with an annual income between $100,000 and $200,000 (“above average” income households)
• 48.1 percent give to combined purpose charities, giving an average household gift of $554, cumulatively making up 9.8 percent ($2.16 billion) of the funds raised by combined purpose charities.
Households with an annual income between $200,000 and $1,000,000 (“wealthy”)
• 62.1 percent give to combined purpose charities, giving an average household gift of $7,087, cumulatively making up 46.1 percent ($10.19 billion) of the funds raised by combined purpose charities.
Households with an annual income equal to or above $1,000,000 (“very wealthy”)
• 60.3 percent give to combined purpose charities, giving an average household gift of $17,072, cumulatively making up 9.3 percent ($2.06 billion) of the funds raised by combined purpose charities.

Giving focused on helping the poor 7 The Center on Philanthropy at Indiana University Summer 2007
Results Section One: Part 3: Helping to meet basic needs Table 4: Weighted estimates of giving by household income level to causes aimed at meeting basic needs* Donors to help meet basic needs
Household Income
Percentage of households that contribute to basic needs
Average amt contributed to basic needs by basic needs donors
Help meet basic needs donations ($ in billions)
Percentage of all household giving to this type of charity from each income group
< $100,000** 25.8% $365 $9.34 49.1%$100,000 to $200,000** 46.2% $657 $2.46 12.9%$200,000 to $1 million*** 74.5% $3,076 $5.30 27.9%$1 million or more*** 76.4% $12,673 $1.93 10.2%Total $19.03 100%
Exceeds 100% due to rounding. *Weighting takes 110 million households x percentage in income range (based on tax returns filed) x percentage that give to the category of recipient x average donation from donors who give to that category ** Income < $200,000: Data from COPPS *** Income >$200,000: Data from BOA Households with an annual income of less than $100,000 (“average” income households)
• 25.8 percent give to causes aimed at meeting basic human needs, giving an average household gift of $365, cumulatively making up 49.1 percent ($9.34 billion) of the funds raised to help meet basic needs.
Households with an annual income between $100,000 and $200,000 (“above average” income households)
• 46.2 percent give to causes aimed at meeting basic human needs, giving an average household gift of $657, cumulatively making up 12.9 percent ($2.46 billion) of the funds raised to help meet basic needs.
Households with an annual income between $200,000 and $1,000,000 (“wealthy”)
• 74.5 percent give to causes aimed at meeting basic needs, giving an average household gift of $3,076, cumulatively making up 27.9 percent ($5.30 billion) of the funds raised to help meet basic human needs.
Households with an annual income equal to or above $1,000,000 (“very wealthy”)
• 76.4 percent give to basic needs causes, giving an average household gift of $12,673, cumulatively making up 10.2 percent ($1.93 billion) of the funds raised to help meet basic human needs causes.

Giving focused on helping the poor 8 The Center on Philanthropy at Indiana University Summer 2007
Results Section One: Part 4: Health Table 5: Weighted estimates of giving by household income level to health related organizations.* Health donors
Household Income
Percentage of households that contribute to health
Average amt contributed to health by health donors
Health donations ($ in billions)
Percentage of all household giving to this type of charity from each income group
< $100,000** 17.8% $173 $3.06 13.9%$100,000 to $200,000** 34.3% $401 $1.12 5.1%$200,000 to $1 million*** 74.1% $2,805 $4.81 21.9%$1 million or more*** 70.4% $92,289 $12.97 59.1%Total $21.96 100%
*Weighting takes 110 million households x percentage in income range (based on tax returns filed) x percentage that give to the category of recipient x average donation from donors who give to that category ** Income < $200,000: Data from COPPS *** Income >$200,000: Data from BOA Households with an annual income of less than $100,000 (“average” income households)
• 17.8 percent give to health related organizations, giving an average household gift of $173, cumulatively making up 13.9 percent ($3.06 billion) of the funds raised by health organizations.
Households with an annual income between $100,000 and $200,000 (“above average” income households)
• 34.3 percent give to health related organizations, giving an average household gift of $401, cumulatively making up 5.1 percent ($1.12 billion) of the funds raised by health organizations.
Households with an annual income between $200,000 and $1,000,000 (“wealthy”)
• 74.1 percent give to health related organizations, giving an average household gift of $2,805, cumulatively making up 21.9 percent ($4.81 billion) of the funds raised by health organizations.
Households with an annual income equal to or above $1,000,000 (“very wealthy”)
• 70.4 percent give to health related organizations, giving an average household gift of $92,289, cumulatively making up 59.1 percent ($12.97 billion) of the funds raised by health organizations.

Giving focused on helping the poor 9 The Center on Philanthropy at Indiana University Summer 2007
Results Section One: Part 5: Education Table 6: Weighted estimates of giving by household income level to education* Education donors
Household Income
Percentage of households that contribute to education
Average amt contributed to education by education donors
Education ($ in billions)
Percentage of all household giving to this type of charity from each income group
< $100,000** 11.2% $243 $2.69 5.9%$100,000 to $200,000** 31.9% $439 $1.14 2.5%$200,000 to $1 million*** 82.2% $15,327 $29.15 63.5%$1 million or more*** 82.9% $78,138 $12.94 28.2%Total $45.92 100%
Exceeds 100% due to rounding. *Weighting takes 110 million households x percentage in income range (based on tax returns filed) x percentage that give to the category of recipient x average donation from donors who give to that category ** Income < $200,000: Data from COPPS *** Income >$200,000: Data from BOA Households with an annual income of less than $100,000 (“average” income households)
• 11.2 percent give to education, giving an average household gift of $243, cumulatively making up 5.9 percent ($2.69 billion) of the funds raised by education.
Households with an annual income between $100,000 and $200,000 (“above average income” households)
• 31.9 percent are donors who give to education, giving an average household gift of $439, cumulatively making up 2.5 percent ($1.14 billion) of the funds raised by education.
Households with an annual income between $200,000 and $1,000,000 (“wealthy”)
• 82.2 percent are donors who give to education, giving an average household gift of $15,327, cumulatively making up 63.5 percent ($29.15 billion) of the funds raised by education.
Households with an annual income equal to or above $1,000,000 (“very wealthy”)
• 82.9 percent are donors who give to education, giving an average household gift of $78,138, cumulatively making up 28.2 percent ($12.94 billion) of the funds raised by education.

Giving focused on helping the poor 10 The Center on Philanthropy at Indiana University Summer 2007
Results Section One: Part 6: Arts Table 7: Weighted estimates of giving by household income level to arts* Arts donors
Household Income
Percentage of households that contribute to arts
Average amt contributed to arts by arts donors
Arts donations ($ in billions)
Percentage of all household giving to this type of charity from each income group
< $100,000** 6.2% $163 $1.01 4.4%$100,000 to $200,000** 16.5% $332 $0.44 1.9%$200,000 to $1 million*** 71.8% $8,166 $13.57 59.3%$1 million or more*** 77.4% $50,945 $7.88 34.4%Total $22.90 100%
*Weighting takes 110 million households x percentage in income range (based on tax returns filed) x percentage that give to the category of recipient x average donation from donors who give to that category ** Income < $200,000: Data from COPPS *** Income >$200,000: Data from BOA Households with an annual income of less than $100,000 (“average” income households)
• 6.2 percent contribute to the arts, giving an average household gift of $163, cumulatively making up 4.4% ($1.01 billion) of the funds raised by the arts.
Households with an annual income between $100,000 and $200,000 (“above average income” households)
• 16.5 percent give to the arts, giving an average household gift of $332, cumulatively making up 1.9% ($0.44 billion) of the funds raised by the arts.
Households with an annual income between $200,000 and $1,000,000 (“wealthy”)
• 71.8 percent give to the arts, giving an average household gift of $8,166, cumulatively making up 59.3% ($13.57 billion) of the funds raised by the arts.
Households with an annual income equal to or above $1,000,000 (“very wealthy”)
• 77.4 percent give to the arts, giving an average household gift of $50,945, cumulatively making up 34.4% ($7.88 billion) of the funds raised by the arts.

Giving focused on helping the poor 11 The Center on Philanthropy at Indiana University Summer 2007
Results Section One: Part 7: Other causes In COPPS, separate questions ask about giving for the environment (including animals) and giving for international aid. There is a third question about “other.” In BOA, environment and international giving are not included as separate options. For this analysis, COPPS results for environment and international are combined with “Other” to make it more comparable to the BOA questions. Table 8 Weighted estimates of giving by household income level to “other” causes* ($ in billions) "Other" donors (includes environment, international affairs, and unspecified)
Household Income
Percentage of households that contribute to other types of causes
Average amt contributed to other causes by "other" donors
Other donations ($ in billions)
Percentage of all household giving to “Other” from each income group
< $100,000** 23.3% $265 $6.16 31.4%$100,000 to $200,000** 42.2% $342 $1.17 6.0%$200,000 to $1 million*** 57.1% $5,632 $7.45 37.9%$1 million or more*** 54.8% $44,332 $4.85 24.7%Total $19.63
*Weighting takes 110 million households x percentage in income range (based on tax returns filed) x percentage that give to the category of recipient x average donation from donors who give to that category ** Income < $200,000: Data from COPPS *** Income >$200,000: Data from BOA Households with an annual income of less than $100,000 (“average” income households)
• 23.3 percent contribute to “other” causes (for example the environment, international affairs, or unspecified organizations), giving an average household gift of $265, cumulatively making up 31.4 percent ($6.16 billion) of the funds raised for “other” causes.
Households with an annual income between $100,000 and $200,000 (“above average income” households)
• 42.2 percent contribute to “other” causes, giving an average household gift of $342, cumulatively making up 6.0 percent ($1.17 billion) of the funds raised by “other” types of recipients.
Households with an annual income between $200,000 and $1,000,000 (“wealthy”)
• 57.1 percent contribute to “other” causes, giving an average household gift of $5,632, cumulatively making up 37.9 percent ($7.45 billion) of the funds raised by “other” types of recipients.
Households with an annual income equal to or above $1,000,000 (“very wealthy”)
• 54.8 percent contribute to “other” causes, giving an average household gift of $44,332, cumulatively making up 24.7 percent ($4.85 billion) of the funds raised by “other” types of recipients.

Giving focused on helping the poor 12 The Center on Philanthropy at Indiana University Summer 2007
Results Section One, Part 8: Total estimated individual/household giving The estimates here are based on survey results from two different studies of household giving, with weighting applied to generate population estimates for total giving for each subsector. Summed, the total of all estimated giving by type of recipient is $252.55 billion. Table 9 shows the sum of all estimates by type of recipient by income category. Table 9 Sum of giving, by subsector by income ($ in billions)
Household Income Religion Combined
Help meet basic needs Health Education Arts Other Total
< $100,000 59.96 7.70 9.34 3.06 2.69 1.01 6.16 89.92$100,000 to $200,000 11.39 2.16 2.46 1.12 1.14 0.44 1.17 19.88$200,000 to $1 million 21.01 10.19 5.30 4.81 29.15 13.57 7.45 91.48$1 million or more 8.64 2.06 1.93 12.97 12.94 7.88 4.85 51.27Total 101.00 22.11 19.03 21.96 45.92 22.90 19.63 252.55
*Weighting takes 110 million households x percentage in income range (based on tax returns filed) x percentage that give to the category of recipient x average donation from donors who give to that category ** Income < $200,000: Data from COPPS *** Income >$200,000: Data from BOA The sum of household giving using the two giving studies (Center on Philanthropy Panel Study and Bank of America Study of High Net Worth Philanthropy) yields a total that is very close to the estimated total for ALL giving (including foundations, corporations, and bequests) estimated for 2005 in Giving USA 2007 (total in that edition is $253.05 billion). It is expected that different methods will yield somewhat different results. Surveys of giving yield different types of measurement discrepancies, depending on who is asked to participate (sample bias), who chooses to answer (selection bias), how accurately the respondents recall their actual giving (recall bias) and how accurately they report it (response bias). For example, when asked about giving in 2006, respondents may (intentionally or not) shift some of their giving from the end of 2005 or the beginning of 2007 into reported giving in 2006. Survey and sample designs attempt to reduce bias as much as possible but some will remain in any survey. The Giving USA estimate of $253 billion for total giving from all donor types in 2005 ties back to estimates of deducted gifts on individual, corporate, estate and foundation tax returns. The IRS values for 2005 individual/household itemized deductions will be available in late 2007. The most recent data available, for 2004, shows that new itemized contributions by individuals in cash and non-cash totaled $166 billion. This exceeds the allowed deductions of $165 billion. Allowed deductions are those that qualify within certain restrictions (for example, donors can deduct only 50 percent of their adjusted gross income when they give cash or securities to a charity, and only 30 percent when they give to a foundation). Donations above the allowed deduction amount are sometimes “carried forward” by donors and taken as allowed deductions in future years (up to five). This is why actual cash and non-cash totals exceed allowed amounts – some of the donated value will be claimed in the future because donors’ gifts exceeded allowed contribution deductions.

Giving focused on helping the poor 13 The Center on Philanthropy at Indiana University Summer 2007
To the claimed deduction amounts should be added giving by the 70 percent of households that do not itemize anything at all on their tax returns. This is approximately $38 billion, based on data from the Center on Philanthropy Panel Study analyzed for Giving USA (which has all of the potential survey biases). The reported giving of $166 billion and the estimate for non-deducting households comes to $204 billion for 2004, and will be higher for 2005. Based on survey responses from the wealthiest households in the Bank of America study, another $50 billion or so is donated but not claimed on tax returns. These donations may be cash, stocks, items of value such as artwork or real estate, or other non-cash contributions. The unclaimed deduction amount is consistent with the research of David Joulfaian (2001), who found that on average, high net worth households contribute about twice as much as they can deduct legally in any given year. While they can carry-forward unused donations for up to five years, the differences between the amounts donated and the amounts actually legally deducted can differ substantially on an annual basis. So, the IRS data about itemized deductions cover most but not all giving. The fact that the total for individual giving here exceeds the Giving USA estimate for individual giving for 2005 results from a combination of several different types of measurement error and, most importantly, the fact that surveys ask about amounts donated and Giving USA ties its results to IRS records for amounts that were legally deducted as charitable donations in any given year. It is important for verification and replication purposes that Giving USA tie its results to the IRS results, but differences from those results do not mean that other results are de facto incorrect. Further research will be needed to determine where the two estimating methods differ and how much of the difference is attributable to measurement errors and how much is due to the differences between how much households donate (and report on surveys) vs. how much they legally deduct (and report to the IRS).

Giving focused on helping the poor 14 The Center on Philanthropy at Indiana University Summer 2007
Results Section Two: Part 1: Estimating contributions that focus on the needs of the poor This next section discusses the combined estimates and the process of approximating how much of subsectors other than “help meet basic needs” might be focused on providing services for people living in poverty. In every case, where there was a choice, the researchers selected the option that resulted in a HIGHER estimate for the amount focused on the poor.1 Results Section Two: Part 1: Step 1 The first step was to take the combined total of all estimated giving, as shown in Tables 2 through 8, and in Table 9, and summarized in two forms: Figure 1 below and Table 10 on the following page.
Figure 1
Estimated charitable giving by income rangeDoes not including giving to foundations
$ in billions
59.96
11.39
21.01
8.64
7.70
2.16
10.19
2.06
9.34
2.46
5.30
1.93
3.06
4.81
12.97
2.69
29.15
12.94
6.16 7.45
4.85
1.121.14
7.88
13.57
1.01
0.441.17
< $100,000 $100,000 to $200,000 $200,000 to $1 million $1 million or more
Other
Arts
Education
Health
Help meet basic needs
Combined
Religion
1 Typically, when estimating the amount that is given, Center practice is to use the lowest option if more than one result
is possible. This ensures that giving estimates are consistently conservative. In this research, because the focus is not on how much is given, but how much of the total is allocated to a specific purpose--a purpose which has public policy implications--we have elected to take the broadest possible view of how much is directed to the needs of people of low income. Thus, given an option between two values, we selected the higher value, the one that showed a greater amount focused on the needs of the poor.

Giving focused on helping the poor 15 The Center on Philanthropy at Indiana University Summer 2007
These data indicate that average-income households (<$100,000) contribute substantially to religion, combined purpose charities, to help meet basic needs, and “other” types of recipients. On the other end of the spectrum, wealthy and very wealthy households ($200,000 or greater) contribute substantially to education, health, religion, the arts, and “other” types of recipients. Table 10 compares the percentage of giving to each category that comes from each income group. Of all giving to religion, 59 percent is estimated to be from households with income less than $100,000. Of giving to the arts, 34 percent is estimated to be from households with income above $1 million. Table 10 Share of giving by households in each income group, before applying percentages from other studies for allocations of gifts by type of purpose Giving by income group as a percentage of estimated total giving to charity type
Income group Religion Combined
Help meet basic needs Health Education Arts Other Total
% of pop. In group
< $100,000** 59 35 49 14 6 4 31 35.6 90.4 $100,000 to $200,000** 11 10 13 5 2 2 6 7.9 7.4 $200,000 to $1 million*** 21 46 28 22 63 59 38 36.2 2.1
$1 million or more*** 9 9 10 59 28 34 25 20.3 0.2
Total 100% 100% 100% 100% 100% 100% 100% 100% 100% Percentage totals are not exactly 100% due to rounding. *Weighting takes 110 million households x percentage in income range (based on tax returns filed) x percentage that give to the category of recipient x average donation from donors who give to that category ** Income < $200,000: Giving data from COPPS *** Income >$200,000: Giving data from BOA Table 10 also shows the percentage of the population by income group, in the far right column. More than 90 percent of households have income less than $100,000. These households give more than one-third (35.6 percent) of all donations, and relatively high percentages of estimated contributions to religion (59 percent); helping to meet basic needs (49 percent); and combined purposes (35 percent). The households with income less than $100,000 give comparatively little to arts (4 percent of total arts giving), education (6 percent of total education giving), and health (14 percent of total health giving). The very highest income group, at 0.2 percent of the population, gives a disproportionately large share of the total (20.3 percent). Therefore, the highest income Americans are donating 100 times what their expected share is based on their numbers. However, when compared to their share of overall income in the US (0.2 percent of tax returns report 11.2 percent of the income), they are donating about 180 times what one would expect if all households donated equal shares of their income. This income group contributes 59 percent of the donations recorded for health care, 34 percent of the giving to the arts, and 28 percent of the giving to education. Donations from this group

Giving focused on helping the poor 16 The Center on Philanthropy at Indiana University Summer 2007
to religion and combined purpose funds are just 9 percent of total estimated giving for those types of causes, and just 10 percent of giving to help meet basic needs.

Giving focused on helping the poor 17 The Center on Philanthropy at Indiana University Summer 2007
Figure 2 shows the allocation of charitable dollars by type of recipient for donors within the same income group. This graph illustrates that the vast majority (67 percent) of giving by households with income less than $100,000 goes to religious organizations, whereas households with income above $1 million give 17 percent of their dollars to religion, a quarter or so of their dollars to Education, and a quarter to Health. It is worth noting that the distribution of giving for those earning $100,000 to $200,000 is very similar to those earning less than $100,000. Similarly, the distribution of giving among those earning $200,000 to $1 million is very similar to those earning $1 million and more, but both of these upper income groups have very different distributions of giving from the two lower income groups. Relatively low income households (Less than $200,000 per year) give much more to religion and to meet basic needs as a share of their total giving and much less to arts, education, and health than do households with incomes in excess of $200,000.
Figure 2 Estimated Allocation of Charitable Dollars by Income Group, 2005
66.7%
57.3%
23.0%16.9%
8.6%
10.9%
11.1%
4.0%
10.4%
12.4%
5.8%
3.8%
3.4%5.6%
5.3%
25.3%
3.0% 5.7%
31.9% 25.2%
2.2%
14.8% 15.4%
6.9% 5.9% 8.1% 9.5%1.1%
< $100,000 $100,000 to $200,000 $200,000 to $1 million $1 million or more
Other
Arts
Education
Health
Help meetbasic needs
Combined
Religion

Giving focused on helping the poor 18 The Center on Philanthropy at Indiana University Summer 2007
Results Section Two: Part 1: Step 2 With estimates for contributions for each type of recipient or organizational purpose, the next step was to develop estimates for the portion of each subsector’s contributions that focus on serving people living in poverty. This was done for giving to religion, combined funds, health, education, and “other” (international aid primarily). The results, combined with the resources used and estimating steps for each, are described further below. Religion Of the estimated $101.00 billion given by all donors to religious causes, 20.1 percent ($20.28 billion) is estimated to have gone toward benevolences focused on the poor (see Table 11). Another 3.8 percent of the total ($3.86 billion) is estimated in benevolences contributed in response to needs in a general population and not focused specifically on the needs of people in lower income groups. The remaining 76.1 percent ($76.86 billion) went to congregational operations. Table 11 Religion Weighted giving estimates after applying percentages from other studies to show estimated allocations focused on the poor
Household Income
Religion-Benevolences focused on the poor (20.1% of total)
Religion – benevolences but not focused on poor (3.8 % of total)
Combined Benevolences (23.9% of total)
Religion -Congregational Operations (76.1% of total)
Religion – total
< $100,000 $12.04 $2.29 $14.33 $45.63 $59.96 $100,000 to
$200,000 $2.29 $0.44 $2.73 $8.66 $11.39
$200,000 to $1 million $4.22 $0.80 $5.02 $15.99 $21.01
$1 million or more $1.73 $0.33 $2.06 $6.58 $8.64
Total $20.28 $3.86 24.14 $76.86 $101.00 The Yearbook of American and Canadian Churches, 2006 edition, shows that benevolences in the reporting Protestant denominations were 23.9 percent of total religion contributions. The Yearbook collects information about total contributions and benevolence contributions from approximately 40 Protestant denominations annually. Table 12 shows that Catholic parish and other giving is very consistent with the trend in Protestant denominations, where outreach activities, at 27 percent, are a slightly higher percentage of the total than found in the reporting Protestant denominations. Table 12 Catholic Parish and Catholic Other Giving ($ in billions) Type of donation Estimated total Percentage Congregational operations $ 6.31 73% Other, outreach activities $ 2.33 27% TOTAL $ 8.64 100%
Source: Joseph Claude Harris, independent researcher who studies Catholic giving

Giving focused on helping the poor 19 The Center on Philanthropy at Indiana University Summer 2007
Catholic giving is roughly in line with the Protestant funding, albeit with a slightly higher percentage for “other” than reported by Protestant denominations for “benevolences.” Overall, Catholic church giving, at an estimated $8.6 billion, is less than 10 percent of total estimated religious giving (Giving USA 2006). Benevolence contributions are not necessarily focused on the poor. There are other types of church activity that benefit a broader audience without being focused on any one income group. There are also churches that operate in predominantly low-income communities that provide poverty-relief activities as part of their standard church operations (that is, church operating budget expenditures are not separate from focusing on the needs of the poor because the church has members who are themselves poor). It is possible to separate benevolences expenditures from other operating expenses. With available data, however, it is not possible to determine the amount of church operating expense that supports churches located in low-income communities (and presumably focused on the needs of their congregants, who are likely to be low-income). Of the money donated to religious benevolences ($24.14 billion), an estimated 84 percent ($20.28 billion) went to the poor (see Table 13). This means that approximately 20 percent ($20.28 billion) of the funds donated to religious causes (total of giving to religion = $101 billion) are estimated to have been used for or targeted for the poor. This $20.28 billion donated to religious organizations that are likely focused on the needs of the poor makes up 8 percent of total donations (total of all giving = $252.55 billion). Benevolences are recorded in four categories: 1) Budget benevolences, such as for food banks and other community needs; 2) Overseas ministries, which serve a mixture of income groups, depending upon the community;
3) Nonbudget denominational benevolences, such as special offerings which might benefit the poor but which are not specifically for the poor; and
4) Nondenominational benevolences, which includes gifts the church makes to other organizations. Using data from the National Council of Churches’ Yearbook, the estimated allocation of benevolences among those four types – and an estimate of what percentage is focused on the poor – is in Table 13.
Table 13: Benevolence Uses 1 2 3 4 % for categories* 63.2% 19.7% 6.2% 10.9% 100% Estimate of share that is for “the poor” ** all ½ none All Percent for poor 63.2% 9.8% 0.0% 10.9% 84% Targeted to poor – 84% of benevolences
* Percentages for categories 1 – 4: National Council of Churches’ 2005 Yearbook of American & Canadian Churches ** Portion of each for “the poor:” best guess informed by input from a person very involved in the ministry of her own
church, which is itself a very engaged, community-serving congregation. Note that the result – that as much as 84 percent of benevolences are focused on the poor – results in 20 percent of congregational giving being focused on the poor. This is twice the percentage estimated in some other work (Biddle, 1992).

Giving focused on helping the poor 20 The Center on Philanthropy at Indiana University Summer 2007
Combined purpose charities Combined purposes include funds that collect money for distribution to other charities. Using a small random sample of 20 organizations, the Center on Philanthropy keyed more than 1,330 allocations reported by 12 charities (5 United Ways of various sizes, 5 Jewish Federations of various sizes, and 2 donor-advised fund entities). These allocations were coded using a system of 17 different purposes for the ORGANIZATION (not the activity or program). Table 14 Combined purpose charities Weighted giving estimates after applying percentages from other studies to show estimated allocations focused on the poor ($ in billions)
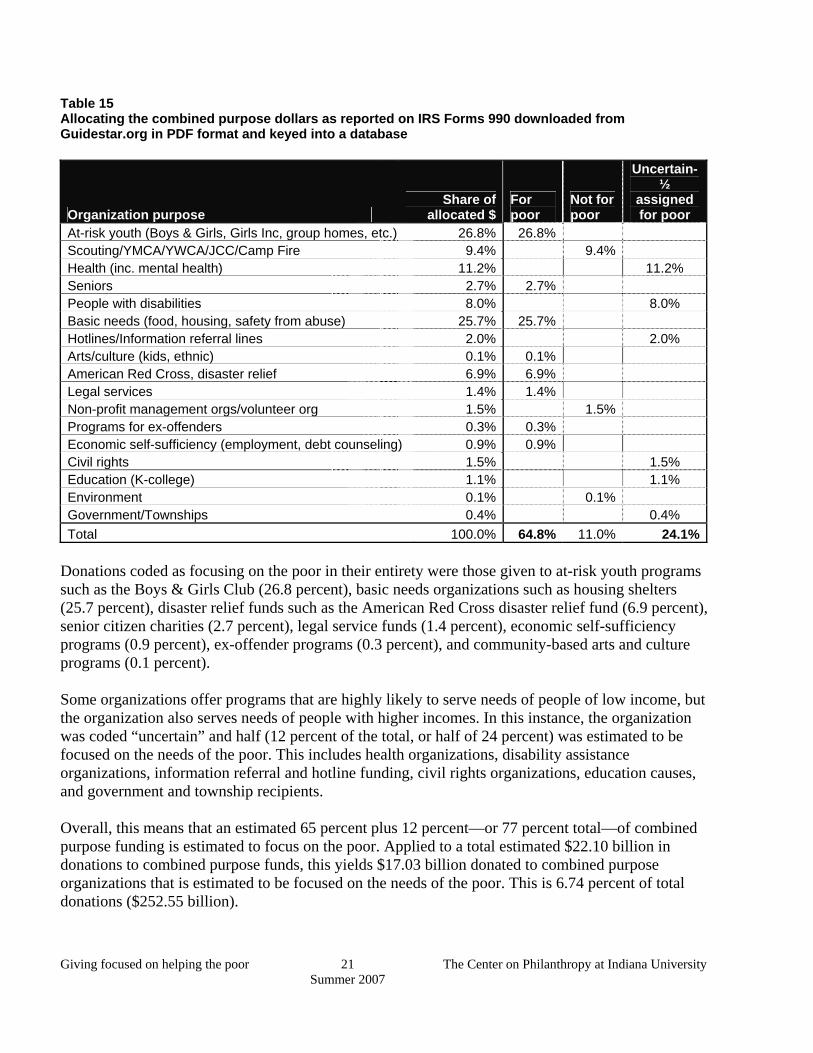
In the coding, the two purposes that consistently received the largest percentage across the organizations in the sample were at-risk youth and families in crisis. Combined, these two types of organizations received 52.6 percent of the dollars allocated. The estimate includes other organizations that were coded as very likely to be primarily serving people in or near poverty. The total estimated percentage from the 1,300+ allocations coded was 64.8 percent for the poor, approximately 24 percent that could not be determined, and 11 percent that was for important community needs but not focused on the poor (although certainly some people in poverty benefit). For estimating purposes, the analysis used 65 percent plus one-half of the 24 percent in the “uncertain” column to be sure not to exclude something. This equals 77 percent. The 17 categories are shown in Table 15, with the allocation “for the poor,” “not for the poor,” or “uncertain” shown.
Household Income
Combined purposes, focused
on the poor
Combined purposes, not
focused on the poor
Combined purposes, total
< $100,000 $5.93 $1.77 $ 7.70
$100,000 to $200,000 $1.66 $0.50 $ 2.16
$200,000 to $1 million $7.85 $2.34 $10.19
$1 million or more $1.59 $0.47 $ 2.06
Total $17.03 $5.08 $22.11
Giving focused on helping the poor 21 The Center on Philanthropy at Indiana University Summer 2007
Table 15 Allocating the combined purpose dollars as reported on IRS Forms 990 downloaded from Guidestar.org in PDF format and keyed into a database
Organization purpose Share of
allocated $For poor
Not for poor
Uncertain- ½
assigned for poor
At-risk youth (Boys & Girls, Girls Inc, group homes, etc.) 26.8% 26.8% Scouting/YMCA/YWCA/JCC/Camp Fire 9.4% 9.4% Health (inc. mental health) 11.2% 11.2% Seniors 2.7% 2.7% People with disabilities 8.0% 8.0% Basic needs (food, housing, safety from abuse) 25.7% 25.7% Hotlines/Information referral lines 2.0% 2.0% Arts/culture (kids, ethnic) 0.1% 0.1% American Red Cross, disaster relief 6.9% 6.9% Legal services 1.4% 1.4% Non-profit management orgs/volunteer org 1.5% 1.5% Programs for ex-offenders 0.3% 0.3% Economic self-sufficiency (employment, debt counseling) 0.9% 0.9% Civil rights 1.5% 1.5% Education (K-college) 1.1% 1.1% Environment 0.1% 0.1% Government/Townships 0.4% 0.4% Total 100.0% 64.8% 11.0% 24.1%
Donations coded as focusing on the poor in their entirety were those given to at-risk youth programs such as the Boys & Girls Club (26.8 percent), basic needs organizations such as housing shelters (25.7 percent), disaster relief funds such as the American Red Cross disaster relief fund (6.9 percent), senior citizen charities (2.7 percent), legal service funds (1.4 percent), economic self-sufficiency programs (0.9 percent), ex-offender programs (0.3 percent), and community-based arts and culture programs (0.1 percent). Some organizations offer programs that are highly likely to serve needs of people of low income, but the organization also serves needs of people with higher incomes. In this instance, the organization was coded “uncertain” and half (12 percent of the total, or half of 24 percent) was estimated to be focused on the needs of the poor. This includes health organizations, disability assistance organizations, information referral and hotline funding, civil rights organizations, education causes, and government and township recipients. Overall, this means that an estimated 65 percent plus 12 percent—or 77 percent total—of combined purpose funding is estimated to focus on the poor. Applied to a total estimated $22.10 billion in donations to combined purpose funds, this yields $17.03 billion donated to combined purpose organizations that is estimated to be focused on the needs of the poor. This is 6.74 percent of total donations ($252.55 billion).

Giving focused on helping the poor 22 The Center on Philanthropy at Indiana University Summer 2007
Helping to meet basic needs Of the $19.03 billion given to charity causes aimed at meeting basic human needs, all money is estimated to have been used to help the poor. Money given to help meet basic needs comprises 7.5 percent of the $252.55 billion given by all income groups. Table 16 Giving to help meet basic needs Weighted giving estimates after applying percentages from other studies to show estimated allocations focused on the poor
Household Income
Giving to help meet basic
needs
< $100,000 $9.34
$100,000 to $200,000 $2.46
$200,000 to $1 million $5.30
$1 million or more $1.93
Total $19.03 Health Of the $21.96 billion given by all donors to health organizations, 9.9 percent ($2.17 billion) is estimated to have gone by donor intent toward helping the poor. This is not an estimate of how people of different income levels benefit from advances in medicine and health care. It is an estimate of how much donors contribute to health causes with the intent of helping people in the lowest income groups in our country. Table 17 Giving to health-related organizations Weighted giving estimates after applying percentages from other studies to show estimated allocations focused on the poor
Household Income
Health – contributions focused on the poor (9.9%)
Health – other contributions
Health- total
< $100,000** $0.30 $2.76 $3.06
$100,000 to $200,000** $0.11 $1.01 $1.12
$200,000 to $1 million*** $0.48 $4.33 $4.81
$1 million or more*** $1.28 $11.69 $12.97
Total $2.17 $19.79 $21.96

Giving focused on helping the poor 23 The Center on Philanthropy at Indiana University Summer 2007
For this estimate, contributions intended to benefit people living in poverty were approximated by looking at the purpose for which the recipient organization was founded. Thus, half of the amount going to charities helping terminally ill children was considered “to benefit people living in poverty” (in part because families with such ill children have few financial resources, even if they are not strictly living in poverty – this is an example of always trying to “err on the high side”). Half of the amount donated to hospice programs and services for the aging were considered to be focused on the needs of the poor. Contributions to health care clinics, even ones that do not primarily serve the poor (e.g., Cleveland Clinic) were counted as “focused on the poor” for the purposes of this study.
Table 18 Weighted estimates of allocation by type of health organization, circa 2003 Charitable receipts (includes individual, foundation, corporate, and bequest donations) IRS 990 sample * ($ in dollars)
Type of organization
Charitable contributions estimate
Share of
total Disease specific organizations : includes research, treatment, prevention $4,958,916,136 25.0% Hospital 7,076,907,334 35.7% Hospital foundation 3,285,010,565 16.6% Children (Make-A-Wish, St. Jude's, etc.) 501,083,998 2.5% Clinics 1,460,058,528 7.4% Mental Health 900,022,043 4.5% Hospice/Aging 492,755,925 2.5% Health Promotion 1,011,076,258 5.1% Airlift, Ambulance, Rescue $137,251,194 0.7% Total $19,823,081,981 100.0%
* We have a sample of 1,067 health organizations, stratified by size. The sample includes a census of organizations considered large and a random sample of those considered medium-sized and those considered small. The weighting is done using the stratum number divided by the total number of organizations in the medium-sized category and again for the small organizations. Bold indicates percentage estimated to be entirely (clinics) or partially (children, hospice/aging) focused on needs of the poor. No data were available to separate foundation grantmaking dollars and priorities from corporate funding and individual contributions. Nor could we identify donor intent for contributions to organizations focused on a specific disease or disorder (was a contribution to a cancer group to cover mammogram costs for people at the poverty line or was it for general support or research that will affect everyone?). With 7.4 percent to clinics, and an estimated 1.25 percent to children’s health needs and 1.25 percent to hospices/aging programs, an estimated 9.9 percent was determined to be clearly related to helping people in dire financial circumstances. Other donations for health were judged to benefit a wide range of people in different income groups. The motivations for giving do not seem to be based on income (intent of the donor) but on cause or need (having a condition or needing a certain type of care).

Giving focused on helping the poor 24 The Center on Philanthropy at Indiana University Summer 2007
Education Of the estimated $45.92 billion given by all donors to education, approximately 15.7 percent ($7.20 billion) is estimated to be focused on helping the poor. Donations estimated to be helping the poor were those made to higher education endowments with the restricted purpose of student financial aid, those made to private schools with the restricted purposed of student financial aid, and a proportion (1/2) of those made to all other educational funds (libraries, tutoring, literacy programs, etc). Table 19 Giving to education Weighted giving estimates after applying percentages from other studies to show estimated allocations focused on the poor
Household Income
Scholarships (15.7% of education giving)*
Education (except scholarships)
Education – total
< $100,000** $0.42 $2.27 $2.69
$100,000 to $200,000** $0.18 $0.96 $1.14
$200,000 to $1 million*** $4.57 $24.58 $29.15
$1 million or more*** $2.03 $10.91 $12.94
Total $7.20 $38.72 $45.92
An estimated 75 percent of education donations are for higher education (T. Pollak, 2007). Of these donations to higher education, 24.7 percent of estimated contributions were for endowments with restricted purposes, based on data from the Council for Aid to Education. Of the endowment gifts with restricted purposes, student financial aid received 34.9 percent of the dollars. These findings are from the Voluntary Support of Education study, conducted by the Council for Aid to Education, 2003 edition, pages 8 (endowment gifts) and 13 (allocation for student financial aid). It is, of course, likely that some of the annual fund gifts are also used to help the poor but data are not available to help estimate what portion, if any, of higher education spending provides, as examples, text books, direct financial assistance (e.g. for transportation or lodging expense), or otherwise covers costs that focus on the needs of lower income students. Given the available information about scholarships and endowments, this work proceeds as follows: 75% of $45.92 = higher education giving = $34.44 24.7% of $34.44 = endowment giving = $ 8.51 34.9% of $8.51 = scholarship funds = $ 2.96 total in scholarship fund giving for higher education, or 6.4 % of education giving Of the remaining 25 percent of education donations, 10 percent went to private schools and 15 percent went to other types of programs (libraries, tutoring, literacy, etc) (both Pollak, 2007). It is estimated that of private school donations, 17.2 percent went toward student financial aid (NAIS, 2006). This is $0.80 billion ($800 million) or 1.7 percent of all estimated contributions from individuals to education. It assumes that all scholarship funds are donated by individuals, not from corporations or foundation.

Giving focused on helping the poor 25 The Center on Philanthropy at Indiana University Summer 2007
Of the other types of donations, totaling $6.89 billion, because there was no other data, a middle-ground estimate is that 50 percent went toward causes aimed at helping the poor, or $3.44 billion. The estimated $7.20 billion donated by individuals to education to focus on the needs of the poor makes up 15.7 percent of all education giving and 2.9 percent of total donations ($252.55 billion). Arts For arts giving, there are no data available to show how much is focused on the needs of the poor. While access to the arts certainly benefits entire communities, and some gifts promote free access to cultural institutions, the lack of national level data about giving focused on the poor makes it difficult to estimate arts contributions that are directed toward the needs of lower-income people. There are many types of programs that link arts with people who are or are likely to have low incomes. These include:
• Arts access programs, which provide interpreters, special assistance, and other services to increase arts participation by people with disabilities;
• Touring exhibits or performance series to take the arts to schools in low income
neighborhoods and to rural areas; and
• Gifts and grants that promote creation of art by people in lower income areas, which can include music instructional programs and other activities.
A Google search (July 2007) on “art access” and on “art low income” resulted in fewer than 12 non-governmental programs that offered the above, which suggests that donations for the arts FOCUSED on the needs of people with low income yield a marginal share of charitable giving to the arts.

Giving focused on helping the poor 26 The Center on Philanthropy at Indiana University Summer 2007
Other causes Of the $19.63 billion given by all donors to “other” charity organizations, between 56 percent and 64 percent (varying with the income of donor) is estimated to be focused on the needs of people with low income. Through coding actual donations reported (by name of charity) given to “other” causes within the COPPS and BOA data, it was estimated that 64 percent of average income donors’ “other” donations were made to causes that targeted the poor. Table 20 Giving to other causes (environment, international, and unspecified) Weighted giving estimates after applying percentages from other studies to show estimated allocations focused on the poor
Household Income
Other Giving - for poor
Other Giving - not for poor
Other Giving – total
< $100,000 $3.94 $2.22 $6.16
$100,000 to $200,000 $0.75 $0.42 $1.17
$200,000 to $1 million $4.17 $3.28 $7.45
$1 million or more $2.72 $2.13 $4.85
Total $11.58 $8.05 $19.63
For the estimate of how much giving was focused on the poor, the amounts drawn from the COPPS study include contributions for environment, for services to youth or families, for international affairs or aid, for neighborhood or community improvement, and for unspecified other purposes (but organizational names were available). Table 21 Estimate of portion of “Other” funding focused on the poor Households with income < $200,000 (COPPS data)
Giving to: Share of COPPS total *
For the poor?
Percentage of total for the poor
Share of COPPS “other” total for poor
Environment 1.0 No 0
Youth/families 1.7 Yes 1.70
Neighborhood/communities 0.6 Yes 0.60
International aid 1.0 Yes 1.00
Other-unspecified 2.2 40% 0.88
Total 6.5 4.18 64%**
* Share of total for households with income <$200,000 ** 64% = 4.18/6.5

Giving focused on helping the poor 27 The Center on Philanthropy at Indiana University Summer 2007
Table 22 Estimate of portion of “Other” funding focused on the poor Households with income > $200,000 (Bank of America [BOA] data)
Estimated giving to: Share of BOA total *
For the poor?
Percentage of total for the poor
Share of BOA “other” total for poor
Environment 1.2 No 0
Youth/families 1.6 Yes 1.6
Neighborhood/communities 0.5 No 0
International aid 0.9 yes 0.9
Other-unspecified 2.2 50% 1.1
Total 6.4 3.6 56%** * Estimated share of total for households with income > $200,000. Estimates by type of recipient are approximate, using information from COPPS upper-income respondents (> $100,000) and applied to BOA data. BOA did not ask about each of these separately.
** 56% = 3.6/6.4 Through these estimates, it is calculated that approximately $11.58 billion of the $19.63 billion donated to “other” charity organizations focused on the needs of the poor. This is 59.0 percent of the total for estimated “other” donations. This $11.58 billion donated to “other” organizations that focus on meeting the needs of the poor makes up 4.6% of total donations ($252.55 billion).

Giving focused on helping the poor 28 The Center on Philanthropy at Indiana University Summer 2007
Results Section Two Part 2: Total giving focused on the needs of the poor When summed, the giving to help meet basic needs and other estimated giving that is focused on the poor come to $77.30 billion, or about 30.6 percent of total estimated household contributions of $252.55.
• Giving to help meet basic needs is 7.5 percent of the total, and
• Other donations focused on helping the poor are 23.1 percent of the total. Table 23 shows the estimates for giving to help meet basic needs. Table 24 shows the estimated values for giving to other subsectors where a portion of the gifts or expenditures are focused on the needs of the poor. Table 25 compares the sum of these two with total estimated giving, drawn from Table 9. Table 23 Summary of giving to help meet basic needs
Household income Total Giving
Giving to help meet
basic needs
Percentage of total dollars given
to help meet basic needs < $100,000 89.92 9.34 10.4%
$100,000 to $200,000 19.88 2.46 12.4%
$200,000 to $1 million 91.48 5.30 5.8%
$1 million or more 51.27 1.93 3.8%
Total 252.55 19.04 7.5%
Table 24 Summary of giving to other subsectors where gifts are likely to be focused on helping the poor Amount of giving to other subsectors likely focused on helping the poor
Household income
Total Giving
Religion-Benevolence
Combined purposes-focused on poor
Health-focused on poor
Education, scholarships Other Sum
Percentageof total dollars
< $100,000 $89.92 $12.04 $5.93 $0.30 $0.42 $3.94 $22.63 25.2% $100,000 to $200,000 $19.88 $2.29 $1.66 $0.11 $0.18 $0.75 $4.99 25.1% $200,000 to $1 million $91.48 $4.22 $7.85 $0.48 $4.57 $4.17 $21.29 23.0% $1 million or more $51.27 $1.73 $1.59 $1.28 $2.03 $2.72 $9.35 18.2% Total $252.55 $20.28 $17.03 $2.17 $7.20 $11.58 $58.26 23.1%

Giving focused on helping the poor 29 The Center on Philanthropy at Indiana University Summer 2007
Taking the total from Table 23 ($19.04) and adding it to the total from Table 24 ($58.26), we find that an estimated total of $77.3 billion dollars focusing on the needs of the poor was donated by donors from all income groups. Table 25 summarizes the findings. Table 25 Combined values, giving to help meet basic needs and other types of giving that is focused on the needs of the poor ($ in billions)
Household income
Total Giving
To help meet basic needs
Estimates from other subsectors
Sum of two types of giving focused on the needs of the poor
Percentage of total giving focused on the needs of the poor from this income group
< $100,000 $89.92 $9.34 $22.63 $31.97 41.4% $100,000 to $200,000 $19.88 $2.46 $4.99 $7.45 9.6%
$200,000 to $1 million $91.48 $5.3 $21.29 $26.59 34.4%
$1 million or more $51.27 $1.93 $9.35 $11.28 14.6%
Total $252.55 $19.04 $58.26 $77.30 100.0%

Giving focused on helping the poor 30 The Center on Philanthropy at Indiana University Summer 2007
Figure 3 shows the estimates as portions of total estimated giving of $252.55 billion for 2005, based on the type of recipient organization as estimated in this preliminary analysis. Figure 3
Figure 3 shows that estimated giving focused on the needs of the poor is almost one-third (~31%) of total giving. It includes:
• Contributions to help people meet basic needs, at $19.04 billion, or 7.5 percent of total giving. This figure is based on surveys of households at all income levels.
• Contributions of an estimated $20.29 billion made to religious organizations that are
designated as benevolences. This estimate includes preliminary amounts for the allocation of benevolences that focus on helping the needy. This estimated amount accounts for 8.0 percent of total giving.
• Allocations from United Way, Jewish federations, donor-advised funds and other combined
purpose funds are an estimated 6.7 percent of total giving. These allocations, based on the analysis here, are most likely to serve at-risk youth and help meet basic needs for food, shelter, or protection from abuse. Thus, a donor who contributes to a combined fund is
Estimates of giving focused on the needs of the poorTotal = $252.55 billion
$ in billions Religious Benevolences to help the poor
$20.29 8.0%
Allocations from combined purpose to help the poor
funds $17.02 6.7%
Health care to help the poor$2.17 0.9%
Scholarships to help the poor$7.20 2.9%
Other, inc. international aid to help the poor
$11.58 4.6%
Help meet basic needs$19.047.5%
All non-poor giving
$175.26 69.4%

Giving focused on helping the poor 31 The Center on Philanthropy at Indiana University Summer 2007
supporting—although at times indirectly and without specific knowledge of how the money is allocated--programs focused on the needs of the poor.
• Health care received less than 1 percent, as estimated, of the donations tracked here. This
figure is very preliminary. It is based on the untested assumption that the distribution of giving for health by households follows the distribution of gifts received by type of health cause (hospitals, clinics, research, etc.). This obscures the very significant funding for health organizations that comes from foundations and corporations. There are, as yet, no better data for studying health giving to focus on the needs of the poor.
• Contributions for scholarships, whether need-based or otherwise, are estimated to be 15.7
percent of education giving and 2.9 percent of total giving. This estimate does not include scholarship contributions made through an annual fund, as there are no available data on a national level.
• Other contributions, which includes international aid and more, are estimated to include
$11.58 billion focused on the needs of the poor, or 4.6 percent of total giving. Table 26 summarizes the percentage of giving estimated to focus on the needs of the poor by each income group. The analysis here suggests that as much as 35.6 percent of giving by households with incomes less than $100,000 focuses on needs of the poor, compared with 22 percent of the giving by households with income of $1 million or more. Table 26 Percentage of all giving supporting activities focused on the needs of the poor, by type of giving
Household income
Religion-Benevolence
Combined purposes Health
Education, scholarships Other
To help meet basic needs
As a percentage of income group total giving
< $100,000 13.4% 6.6% 0.3% 0.5% 4.4% 10.4% 35.6% $100,000 to $200,000 11.5% 8.4% 0.6% 0.9% 3.8% 12.4% 37.5%
$200,000 to $1 million 4.6% 8.6% 0.5% 5.0% 4.6% 5.8% 29.1%
$1 million or more 3.4% 3.1% 2.5% 4.0% 5.3% 3.8% 22.0%
Total Giving 8.0% 6.7% 0.9% 2.9% 4.6% 7.5% 30.6%
Comparisons of donations to specific causes across donor income levels can be seen in Figures 4 and 5. These figures illustrate that gifts (size and percentage) are very different across donor income levels. For example, average-income and above-average income donors give a large amount and percentage of their donations to religious causes while wealthy and very wealthy donors give a larger proportion to education. The very wealthy give a large amount and percentage of donation to health causes relative to other income group donors.

Giving focused on helping the poor 32 The Center on Philanthropy at Indiana University Summer 2007
Figure 4
Allocation of giving (estimated), by income group, 2005
< $100,000 $100,000 to $200,000 $200,000 to $500,000 $1 million or more
Other - not for poor
Other - for poor (64%)
Arts
Education not for poor
Education for poor (15.7%)
Health - not poor
Health - for poor (9.9%)
To help meet basic needs
Combined purposes not for poor
Combined purposes for poor (77%)
Religion-Benevolences not for poor(16% of 23.9%) Religion-Benevolences for poor (84%of 23.9%) Religion, Congregational operations

Giving focused on helping the poor 33 The Center on Philanthropy at Indiana University Summer 2007
Figure 5
Percentage of donations by recipient, by income
< $100,000 $100,000 to $200,000 $200,000 to $500,000 $1 million or more
Other - not for poor
Other - for poor (64%)
Arts
Education not for poor
Education for poor (15.7%)
Health - not poor
Health - for poor (9.9%)
To help meet basic needs
Combined purposes not for poor
Combined purposes for poor (77%)
Religion-Benevolences not for poor(16% of 23.9%) Religion-Benevolences for poor (84%of 23.9%) Religion, Congregational operations

Giving focused on helping the poor 34 The Center on Philanthropy at Indiana University Summer 2007
Alternatives to estimates: Family Foundation Grantmaking To determine where grantmaking funds were allocated and if the allocation of funds by family foundations differed from household giving in substantial ways, Foundation Center data was consulted. See Figure 6 for a summary of fund allocation for family foundation grantmaking. As can been seen in Figure 6, family foundation fund allocation does not substantially differ from individual donor gift allocations and so will not be discussed further. The percentage allocation for basic categories (education, health, religion, etc.) is from the Foundation Center’s report Foundation Giving Trends, 2006 edition, which presents data for 2004 foundation giving (see page 36) of the Foundation Center study. The estimate here assumes that half of private foundation giving is from family foundations. The more recent figure is more than half (54 percent, Key Facts about Family Foundations, January 2007), but the 2007 report does not include breakouts by type of recipient. The estimates in Figure 6 take the giving priorities reported by the foundation for type of recipient, and use the distribution for “poor” and “not poor” found above: 20 percent of religion giving is for the poor; 77 percent of combined purposes; 15.7 percent of education, 9.9 percent of health. The percentages shown here are percentages of total estimated family foundation grantmaking.
Figure 6
Estimated allocation of family foundation grantmaking
Other for foundations: animal/wildlife; civil rights; community improvement; media; philanthropy; public administration; recreation; science research; social science research.
Combined purposes - general5%
To help meet basic needs 10%
Health care
2%
Health - general16%Educ. Scholarships
3%
Other - not for poor 18%
Educ., not scholarships15%
Arts11%
Combined purposes - poor18%
Religion-Benevolences for poor (84% of 23.9%)
0%
Religion, Congregational operations
2%
Religion-Benevolences -general
0%

Giving focused on helping the poor 35 The Center on Philanthropy at Indiana University Summer 2007
Alternatives to estimates: Index of Global Philanthropy The Index of Global Philanthropy seeks to estimate how much private assistance from U.S. sources is expended in other countries (including developed nations). The Index draws on a number of data sources and includes charitable contributions as well as activities funded by nonprofit organizations directly (universities, religious organizations, and private voluntary organizations [PVOs]). Table 27, excerpted from Giving USA 2006, presents the types of expenditures that are closest to the legal definition of a charitable contribution (corporate expenditures abroad may not be legally considered deductible gifts). Table 27 Private assistance going from organizations or donors in the United States to support activities in other countries (billions of dollars) Source of aid Amount Foundations 3.4Corporations 4.9Private and voluntary organizations*
9.7
Universities and colleges 1.7Religious organizations 4.5Total 24.2Source: Index of Global Philanthropy, Hudson Institute, April 2006, page 15. (information excerpted from Giving USA 2006, page 183) * The estimate for private and voluntary organizations is based on data from 503 organizations registered with the U.S. Agency for International Development, which were integrated into a complex set of formulas and assumptions. It will not match the Giving USA estimate for cash donations to organizations in the international affairs subsector, which looks at different organizations and focuses on cash donations only.
Note that this estimate does not differentiate the source of the funding. Foundations and corporations may support institutions in higher education or the private voluntary organizations, and see some of that funding expended for activities abroad. Nonetheless, we make the assumption here that only individual giving is included above for PVOs, universities and colleges, and religious organizations. This is the most conservative approach that results in the highest possible estimate of giving focused on the needs of the poor. Before any adjustments, based on the Index’s estimate that $24.2 billion of charitable gifts was directed to activities in other countries, one could say that 8.7 percent of estimated $283.05 billion in total giving was expended abroad. This is based on an estimate of giving for 2005 from all sources, as published in Giving USA 2007. It would not be accurate to assume that all of the funding identified by the Index is directed to the needs of people living in great poverty. Global development aid is often for very poor countries but not always. The $4.5 billion shown for religious organizations in the Index of Global Philanthropy is a component of the benevolences estimate in this report. At least a portion of the amount of private voluntary organizations (PVO) is also included in the donations counted in this report (household giving estimated for international organizations is not totaled in this report). Giving USA 2007

Giving focused on helping the poor 36 The Center on Philanthropy at Indiana University Summer 2007
reports $11.50 billion in international giving from all sources for 2005. To adjust the Index values for individual donors, we:
Remove foundation and corporations, and Estimate that $2.5 billion of the PVO amount is from households (in COPPS, estimating that 1 percent of household giving is for international aid), and remove it. Remove religious organization expenditures abroad, as duplicate counting.
The result, $8.9 billion, is potentially another 3.5 percent in giving that might be focused on the needs of the poor. This assumes that global philanthropy is always focused on the needs of the poor, which is not necessarily the case, and that the values in the Index are not duplicate counts for other estimates already developed in this report. Further research This study is a first take at patterns of charitable giving and how much might be focused on the needs of people living in poverty in the U.S. and abroad. It draws on household surveys about basic categories for giving, including ‘giving to help people meet their basic needs.” That research is supplemented with studies done by other organizations to try to identify contributions made to other types of charity that are focused on the needs of the poor. Further study is needed to determine more completely the services funded by contributions to health organizations. This work relies on the distribution of gift receipts by different types of health charities, not on the activities supported by those charities nor the specific goals around which they raise funds. For religious giving, there is existing literature about how congregations expend their revenues. The estimate here is a larger share of congregational expenditures than is found in at least one other study (Biddle, 1992). Additional studies should be identified and their findings incorporated. Of particular interest is the extent to which “benevolences” focus on the needs of the poor or focus on the needs of a general population. The sampling method used to estimate how combined purpose funds are allocated is a start at gathering data to study this complex issue. With a larger sample, the result will be more accurate. To the extent possible, as with health giving, it would help to know the purposes supported by the allocated funds, not just the organizational classification within a subsector. That is, are funds given to an art museum focused on the needs of the poor because they support free admission for children from a district that could not otherwise afford to send classes on field trips – or similar purposes or activities that might be obscured by the coding system used for charitable organizations (the National Taxonomy of Exempt Entities). The larger political or policy questions that this study implies are unexplored here. What is the right mix of “giving people fish” compared with “teaching them to fish?” What is the private sector’s appropriate role? The government sector? The roles of friends and family? Could differential tax

Giving focused on helping the poor 37 The Center on Philanthropy at Indiana University Summer 2007
treatment of gifts for some types of organizations increase charitable donations focused on the needs of the poor? These topics have been tackled by other writers and can inform further analysis.

Giving focused on helping the poor 38 The Center on Philanthropy at Indiana University Summer 2007
References America’s Second Harvest, Hunger in America 2006, www.hungerinamerica.org. Viewed April 10, 2007. Anderson, K. with J. Navin, The business of international philanthropy: Spare change that can change the world, Business Today, November 14, 2006. http://www.businesstoday.org/index.php?option=com_content&task=view&id=222&Itemid=38. J. Atienza. 2006. Foundation Giving Trends. (New York, NY: The Foundation Center). A. Austin. 2007. Key Facts on Family Foundations. (New York, NY: The Foundation Center). Biddle, J. 1992. “Religious organizations” in Clotfelter, C. (ed). Who Benefits from the Nonprofit Sector? (Chicago: University of Chicago). Catholic Charities USA. 2006. Catholic Charities USA Survey. November 2006. Center on Philanthropy at Indiana University for the Bank of America. 2006. High Net Worth Philanthropy Study. http://newsroom.bankofamerica.com/index.php?s=press_kit&item=63. Viewed February 23, 2007. Center on Philanthropy at Indiana University. 2003. Data set from Center on Philanthropy Panel Study, a module of the Panel Study of Income Dynamics conducted by the Institute for Social Research at the University of Michigan. Clotfelter, C. 1992. Who Benefits from the Nonprofit Sector? (Chicago: University of Chicago). Council for Aid to Education. 2006. Voluntary Support for Education. (New York: Author). Giving USA Foundation. 2006. Giving USA 2006. (Glenview, IL: Author). Hudson Institute. 2006. Index of Global Philanthropy. www.hudsoninstitute.org. Galaskiewicz, J., P. Molina, O. Mayorova, J. Inouye. 2005. “Funding sources, Auspices, and Location of Youth Services,” paper presentation, ARNOVA 2005. Abstract available at: http://arnova.omnibooksonline.com/2005/papers/PA051452.pdf. Giving USA Foundation™. 2007.Giving USA 2007. (Glenview, IL: Author). Joulfaian, D. 2002. Charitable Giving in Life and at Death, in Gale. W., J. R. Hines, Jr., and J. Slemrod, Rethinking Estate and Gift Taxation, (Washington, DC: Brookings Institution Press), pp. 350-374. Kakwani, N. and Son, H. 2006. New Global Poverty Counts. Working paper No. 29, Sept. 2006. International Poverty Centre: United Nations Development Programme.

Giving focused on helping the poor 39 The Center on Philanthropy at Indiana University Summer 2007
Lawrence, S. and Atienza, J. 2006. Foundation Yearbook. Facts and Figures on Private and Community Foundations. (New York: The Foundation Center). NAIS (National Association of Independent Schools). 2006. Profile of Statistical Indicators. February 2006. StatsOnline/NAIS. www.nais.org. National Council of Churches of Christ. 2006. Yearbook of American & Canadian Churches. (New York: Author). Pollak, T. 2007. Personal communication from the director of the National Center for Charitable Statistics with researchers at the Center on Philanthropy, regarding the share of all education contributions dollars reported by higher education institutions on IRS Forms 990. Salamon. L. 1992. “Social Services” in C. Clotfelter (ed), Who Benefits from the Nonprofit Sector? (Chicago: University of Chicago Press). Tobin, G., A. Karp, and A. Weinberg. 2005. “American Mega-Giving: A Comparison to Global Disaster Relief.” Working paper posted at http://www.jewishresearch.org/PDFs/MegaGiving_05.pdf. U.S. Department of Housing and Urban Development, Annual Homeless Assessment Report to Congress, 2007, page 38. http://www.huduser.org/Publications/pdf/ahar.pdf. Viewed April 10, 2007. U.S. Census Bureau. 2006. Income climbs, poverty stabilizes, Uninsured rate increases. press release, August 29, 2006. www.census.gov.