patrick d. kilgo emory university department of biostatistics and bioinformatics southern regional...
TRANSCRIPT

Patrick D. KilgoEmory University
Department of Biostatistics and Bioinformatics
Southern Regional Council on StatisticsJune 6th, 2011
Integrating A Problem-Based Learning Approach Into Large Sections of
Graduate-Level Introductory Biostatistics Courses
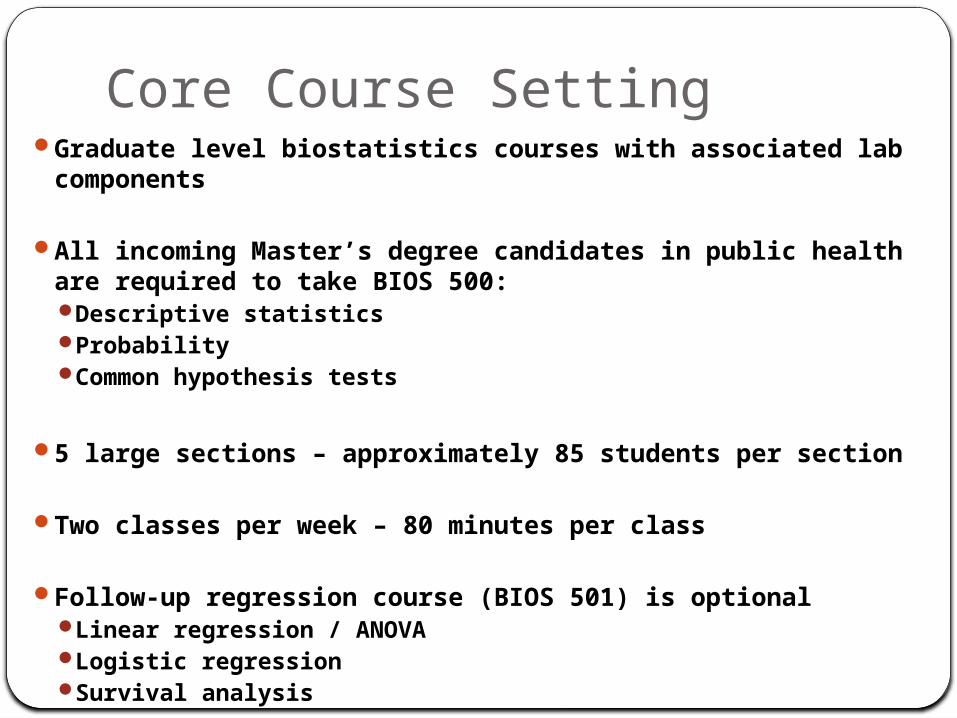
Core Course SettingGraduate level biostatistics courses with associated lab
components
All incoming Master’s degree candidates in public health are required to take BIOS 500:Descriptive statisticsProbabilityCommon hypothesis tests
5 large sections – approximately 85 students per section
Two classes per week – 80 minutes per class
Follow-up regression course (BIOS 501) is optionalLinear regression / ANOVALogistic regressionSurvival analysis

What’s The Problem? RETENTION
It is common for our students to have forgotten almost everything in the intervening month between Fall and Spring semesters
Thesis season: By their second year, the average student has:Forgotten most of the statistical concepts they once
“knew”Has forgotten how to apply concepts and statistical
tests and also the programming necessary to accomplish their analysis
Resorted to roaming the halls of the third floor, beckoning any statistical-looking person for help
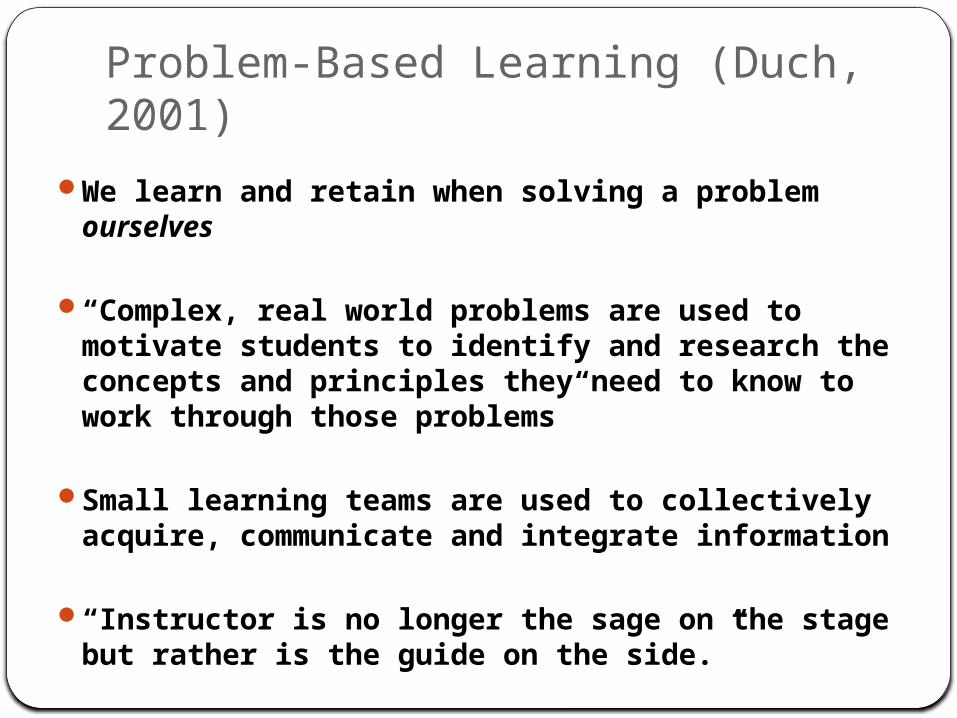
Problem-Based Learning (Duch, 2001)
We learn and retain when solving a problem ourselves
“Complex, real world problems are used to motivate students to identify and research the concepts and principles they need to know to work through those problems”
Small learning teams are used to collectively acquire, communicate and integrate information
“Instructor is no longer the sage on the stage but rather is the guide on the side.”

Problem-Based Learning Objectives (Duch, 2001)
Think critically and be able to analyze and solve real-world problems
Find, evaluate and use appropriate learning resources
Work cooperatively in teams and small groups
Demonstrate versatile and effective communication skills, both verbal and written
Use content knowledge and skills acquired at the university to become continual learners.

Previous PBL Biostatistics CoursesCarolyn Boyle, Mississippi State, Journal
of Statistics Education v.7, n.1 (1999)
Applied in an animal science setting
18 veterinarian students
8 cases over two semesters
The only published account of PBL in biostatistics

Goals – Excellence In These Areas … Generating descriptive statistics
Choosing the appropriate analysis approach when faced
with a research problem
Interpreting findings from research studies
Writing reports and communicating results of research findings following a statistical analysis
Thinking through analytical problems and subsequently
designing studies
Working in groups to solve research problems
Beginning the statistical thinking/planning for your Master’s thesis
Discussing statistical analysis with other faculty,
students and employers

Extra Resources Required for PBLDepartmental Support - $$$$$$$$
3 additional experienced “co-instructors”Though some disagree, I still believe that this
task is beyond the capabilities of the average TA
3 additional classrooms
Patience and flexibility on the part of the lab instructors
A ton of my time

General Framework of My PBL Class
No more tests or homework
No required textbook: I asked them to find any statistical text for reference
4 “cases” (problems) over the course of the semester
Mondays: Lecture (Taught by Kilgo)
Wednesdays: 4 PBL “breakout” sections of size 20 where cases are worked on in groups of 4-5. (Taught by Kilgo and 3 co-instructors)
Teach them deeper, not wider

Deeper, Not WiderHalf as many lectures = must be efficient
Before I presented a topic I asked myself three questions:How likely are the students to encounter this topic in
practice?How likely is the average student to remember this topic
in three weeks?Will they be taught this topic in their introductory
epidemiology course?
Sample of topics omitted:Many probability axioms and concepts (~1 lecture)Bayes rule (~1 lecture)Binomial and Poisson distributions (~2-3 lectures)Nonparametric tests (~1-2 lectures)Several statistical tests – McNemar’s Test, ANOVA (~2
lectures)
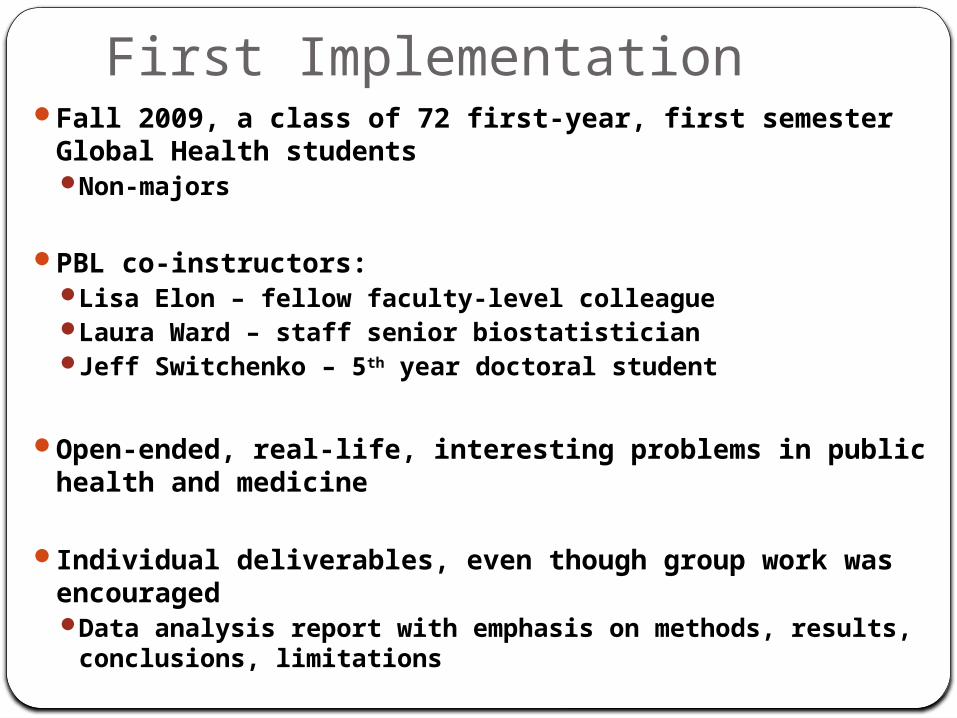
First ImplementationFall 2009, a class of 72 first-year, first semester Global
Health studentsNon-majors
PBL co-instructors: Lisa Elon – fellow faculty-level colleagueLaura Ward – staff senior biostatisticianJeff Switchenko – 5th year doctoral student
Open-ended, real-life, interesting problems in public health and medicine
Individual deliverables, even though group work was encouragedData analysis report with emphasis on methods, results,
conclusions, limitations
Cases
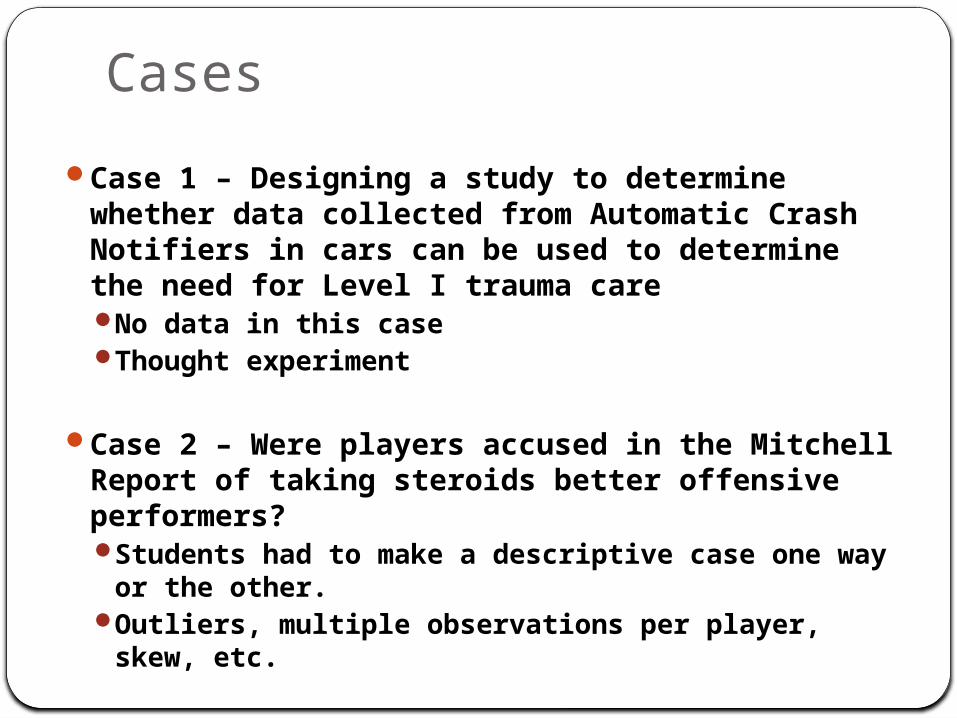
Case 1 – Designing a study to determine whether data collected from Automatic Crash Notifiers in cars can be used to determine the need for Level I trauma careNo data in this caseThought experiment
Case 2 – Were players accused in the Mitchell Report of taking steroids better offensive performers?Students had to make a descriptive case one
way or the other.Outliers, multiple observations per player, skew,
etc.

CasesCase 3 – Validation of an experimental
testing device designed to diagnose pre-Alzheimer’s diseaseData management, t-tests, assumption
violations, experimental design issuesReal-life problem – collaboration between
Emory and GA Tech
Case 4 – Smallpox Vaccine TrialChance to compare modern methods to
Jenner’s methodStudents had to read Jenner’s original paperChi-square tests, odds ratios, Interactions
(non-homogeneity)
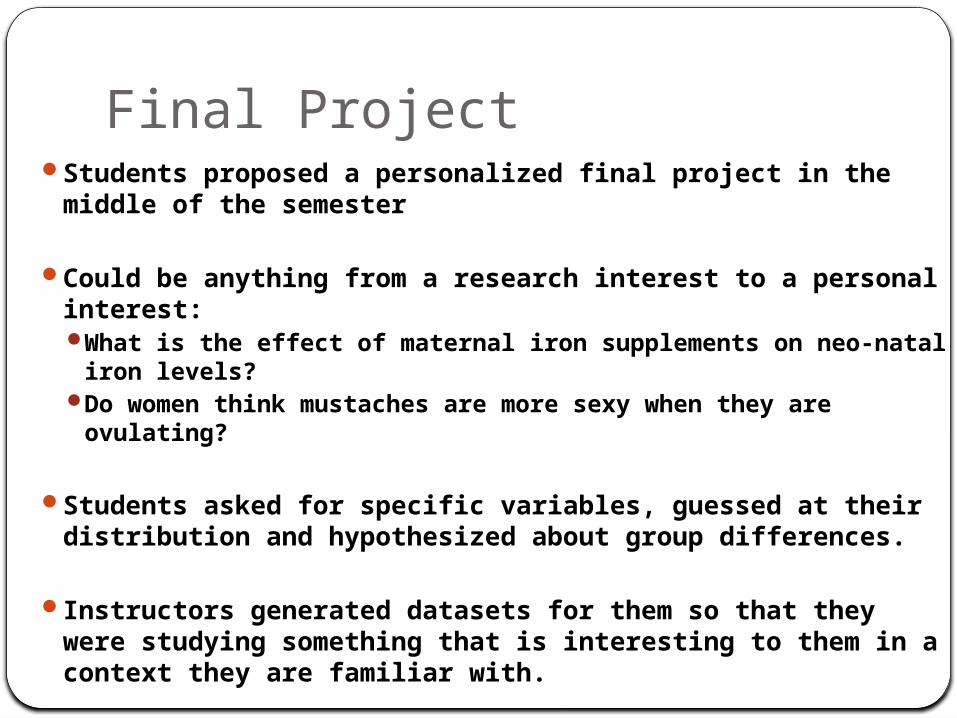
Final ProjectStudents proposed a personalized final project in the
middle of the semester
Could be anything from a research interest to a personal interest:What is the effect of maternal iron supplements on neo-natal
iron levels?Do women think mustaches are more sexy when they are
ovulating?
Students asked for specific variables, guessed at their distribution and hypothesized about group differences.
Instructors generated datasets for them so that they were studying something that is interesting to them in a context they are familiar with.
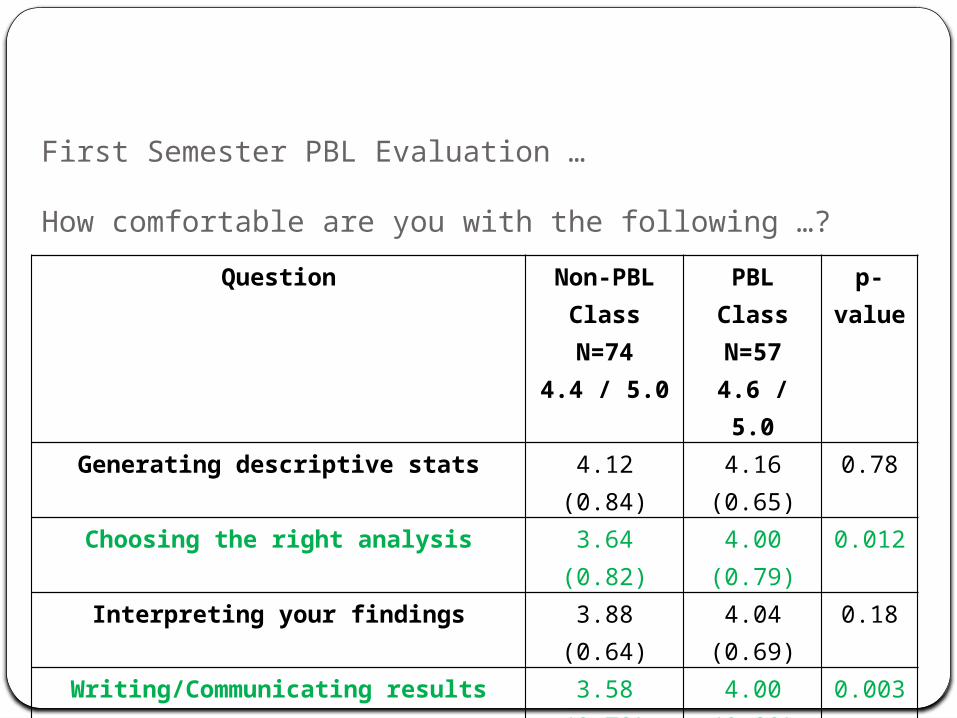
First Semester PBL Evaluation … How comfortable are you with the following …?
Question Non-PBL ClassN=74
4.4 / 5.0
PBL ClassN=57
4.6 / 5.0
p-value
Generating descriptive stats 4.12 (0.84) 4.16 (0.65) 0.78
Choosing the right analysis 3.64 (0.82) 4.00 (0.79) 0.012
Interpreting your findings 3.88 (0.64) 4.04 (0.69) 0.18
Writing/Communicating results 3.58 (0.72) 4.00 (0.89) 0.003
Thinking through problems / study design 3.27 (0.90) 3.98 (0.74) <0.001
Working in groups to solve problems 3.82 (0.84) 4.23 (0.87) 0.008
Beginning the planning for your thesis 2.97 (1.02) 3.60 (0.96) <0.001
Discussing statistics with other faculty 3.53 (0.74) 3.74 (0.92) 0.15

Feedback From Students
If I could go back in time to the beginning of the semester with a choice of class formats I would …
1)Choose the lecture-only format (4/57)2)Choose the problem-based format (48/57)3)Be indifferent towards the format (5/57)
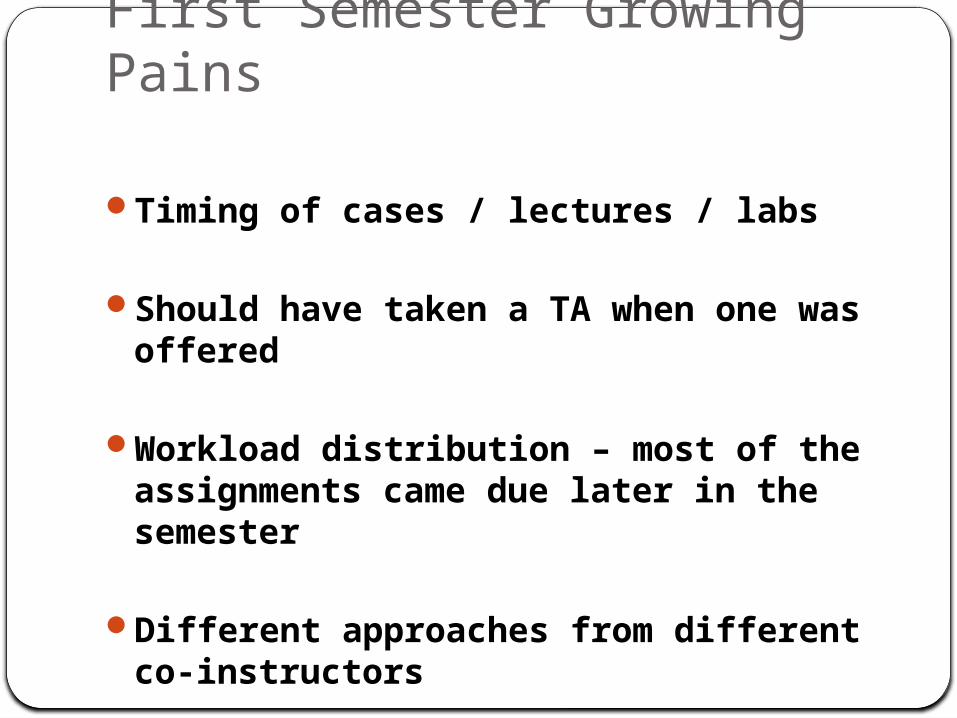
First Semester Growing Pains
Timing of cases / lectures / labs
Should have taken a TA when one was offered
Workload distribution – most of the assignments came due later in the semester
Different approaches from different co-instructors
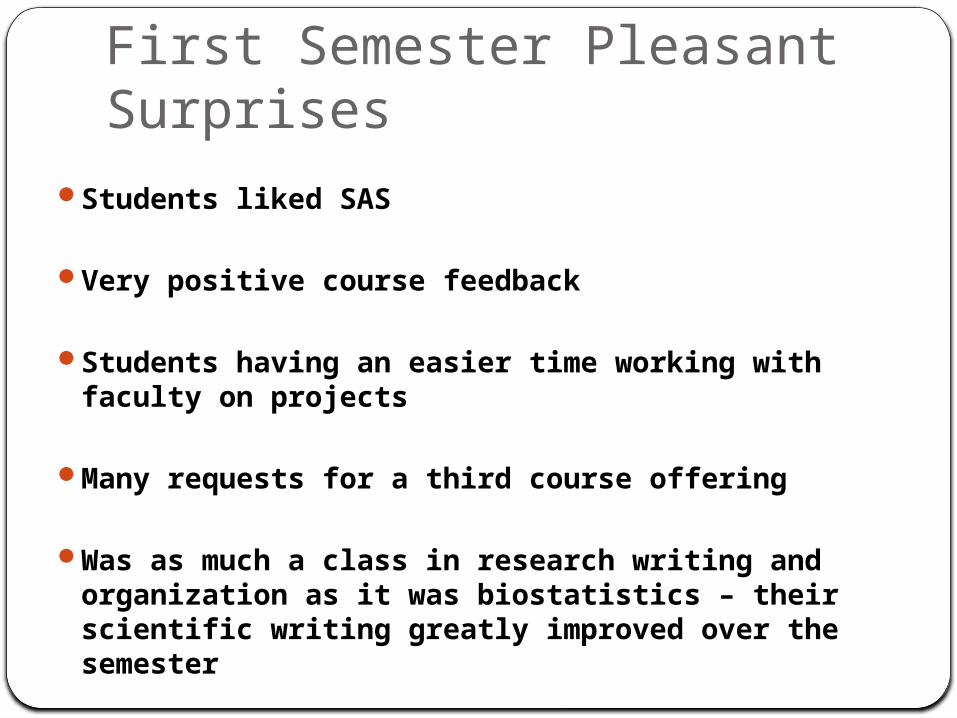
First Semester Pleasant Surprises
Students liked SAS
Very positive course feedback
Students having an easier time working with faculty on projects
Many requests for a third course offering
Was as much a class in research writing and organization as it was biostatistics – their scientific writing greatly improved over the semester
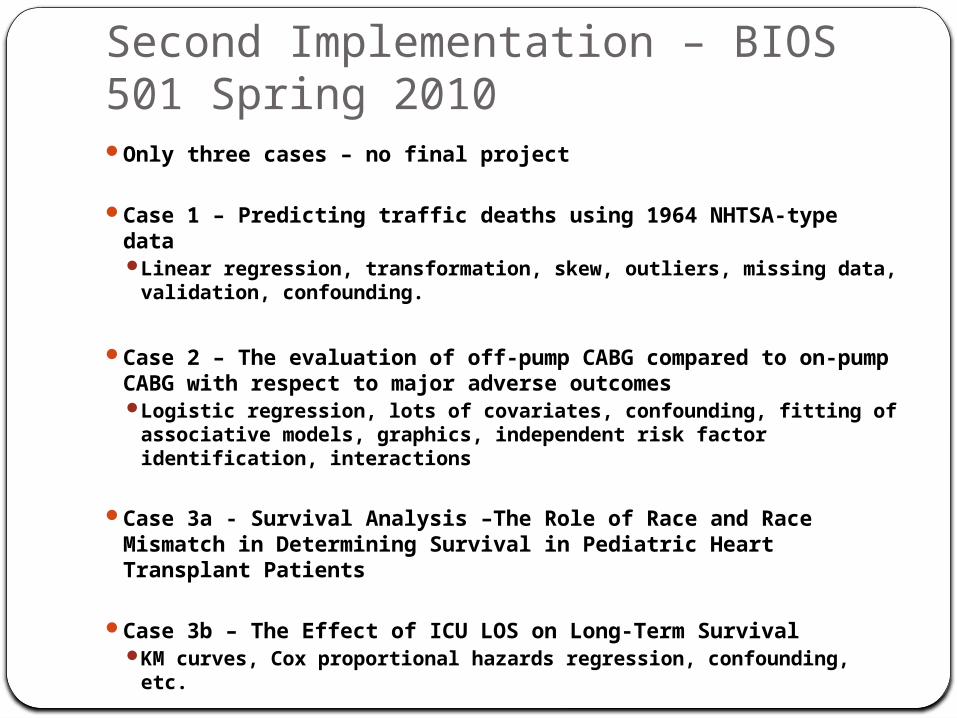
Second Implementation – BIOS 501 Spring 2010 Only three cases – no final project
Case 1 – Predicting traffic deaths using 1964 NHTSA-type dataLinear regression, transformation, skew, outliers, missing
data, validation, confounding.
Case 2 – The evaluation of off-pump CABG compared to on-pump CABG with respect to major adverse outcomesLogistic regression, lots of covariates, confounding, fitting of
associative models, graphics, independent risk factor identification, interactions
Case 3a - Survival Analysis –The Role of Race and Race Mismatch in Determining Survival in Pediatric Heart Transplant Patients
Case 3b – The Effect of ICU LOS on Long-Term SurvivalKM curves, Cox proportional hazards regression, confounding,
etc.
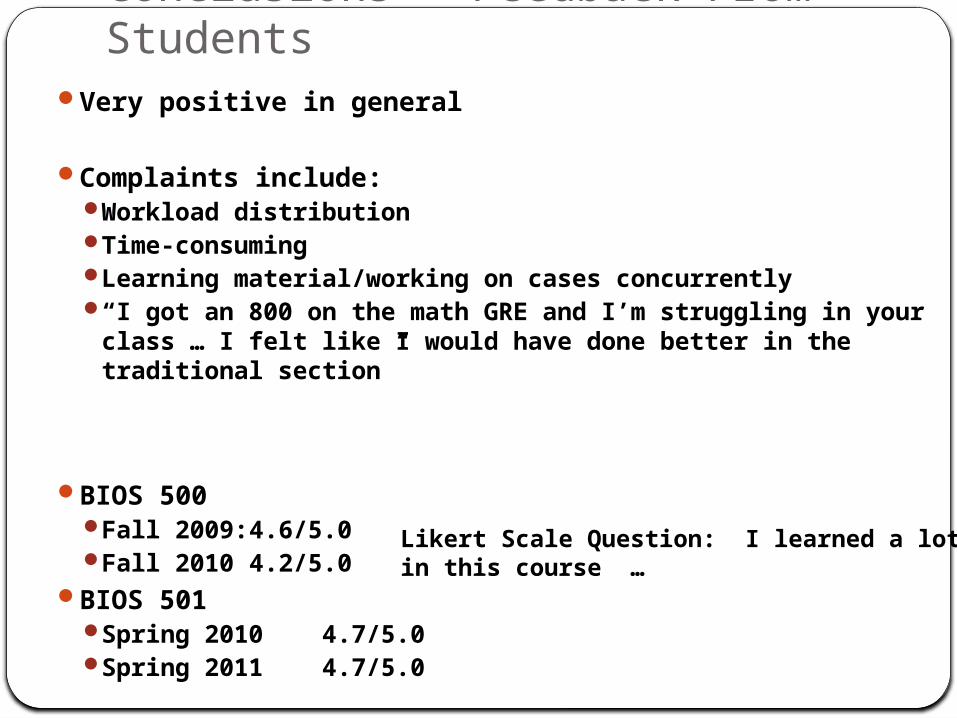
Conclusions - Feedback From Students
Very positive in general
Complaints include:Workload distributionTime-consumingLearning material/working on cases concurrently“I got an 800 on the math GRE and I’m struggling in
your class … I felt like I would have done better in the traditional section”
BIOS 500Fall 2009: 4.6/5.0Fall 2010 4.2/5.0
BIOS 501Spring 2010 4.7/5.0Spring 2011 4.7/5.0
Likert Scale Question: I learned a lot in this course …

THANK YOU!